household recycling study · pdf filehousehold recycling study c o n t e n t s ... survey ....
TRANSCRIPT

Household Recycling Study
JAN 2013

HOUSEHOLD RECYCLING STUDY
C O N T E N T S
INTRODUCTION 3
1.1 Background 3
1.2 Study Objectives 4
1.3 Report Structure 4
PHASE 1 : SURVEY 5
2.1 Design and Methodology 5
2.2 Demographic Profile of Survey Respondents 5
2.3 Key Findings: Recycling Practices 7
2.4 Key Findings: Motivations 10
2.5 Key Findings: Awareness/ Knowledge 14
2.6 Key Findings: Barriers 17
2.7 Key Findings: Public Feedback 18
2.8 Summary of Key Findings 20
PHASE 2 : FOCUS GROUP DISCUSSIONS 21
3.1 Design and Methodology 21
3.2 Key Findings: Recycling Behaviour 22
--- Personal Reasons 22
--- Social / Cultural 22
--- Infrastructural 23
3.3 Key Findings: Views on Current / Possible Future 24
Recycling Efforts
3.4 Summary of Key Findings 26
CONCLUSION 27

HOUSEHOLD RECYCLING STUDY
1.1. Background
INTRODUCTION

HOUSEHOLD RECYCLING STUDY
1.2. Study Objectives
1.3. Report Structure

HOUSEHOLD RECYCLING STUDY
2.1. Design and Methodology
2.2. Demographic Profile of Survey Respondents
Table 2.2.1. Demographic profile
FREQUENCY (n) PERCENT (%)
Male 1182 47.3
Female 1318 52.7
FREQUENCY PERCENT
Singapore Citizens 2099 84.0
Permanent Residents 401 16.0
FREQUENCY PERCENT
Chinese 1811 72.4
Malay 280 11.2
Indian 297 11.9
Others 112 4.5
FREQUENCY PERCENT
Single 757 30.3
Married, with children 1510 60.4
Married, without children 156 6.2
Separated/Divorced/Widowed 74 3.0
Refused 3 0.1
PHASE 1 : SURVEY

HOUSEHOLD RECYCLING STUDY
FREQUENCY PERCENT
15-19 years 225 9.0
20-24 years 183 7.3
25-29 years 159 6.4
30-34 years 225 9.0
35-39 years 272 10.9
40-44 years 299 12.0
45-49 years 232 9.3
50-54 years 221 8.8
55-59 years 188 7.5
60-64 years 187 7.5
65 years and above 309 12.4
FREQUENCY PERCENT
Primary & Below 481 19.2
Secondary School ('O' levels/'N' levels) 736 29.4
ITE 109 4.4
A Levels, Diploma 496 19.8
Degree 473 18.9
Post-graduate 202 8.1
Others 3 0.1
FREQUENCY PERCENT
White Collar 1204 48.2
Blue Collar 198 7.9
Not working/Unemployed 123 4.9
Student 251 10.0
Retirees 326 13.0
Housewife/Homemaker 388 15.5
Refused 10 0.4
FREQUENCY PERCENT
HDB 1- or 2-Rm Flat 130 5.2
HDB 3-Rm Flat 467 18.7
HDB 4-Rm Flat 774 31.0
HDB 5-Rm or Executive Flat 537 21.5
Condominium or Private Flat 440 17.6
Landed Property 145 5.8
Others 7 0.3

HOUSEHOLD RECYCLING STUDY
2.3. Key Findings: Recycling Practices Recycling Participation Rate
Table 2.3.1. Recycling participation rate
FREQUENCY PERCENT
Newspaper 2181 87.2
Old Clothing* 1674 67.0
Magazines 1597 63.9
Plastic bags* 1532 61.3
Plastic Drink Bottles 1388 55.5
Junk Mail/Brochures 1159 46.4
Plastic Containers 1141 45.6
Aluminium Drinks Can 1117 44.7
Cardboard 1096 43.8
Glass Containers 945 37.8
Tin Cans 924 37.0
Beer/wine Bottles 815 32.6
Plastic Cartons 813 32.5
Small Electronic Appliances 776 31.0
Tetra-pak 408 16.3
Others, please specify 27 1.1
None of the above 125 5.0

HOUSEHOLD RECYCLING STUDY
Table 2.3.2. Proportion of items recycled by item type (%)
A little (less than
20%)
Some (20% to
less than 40%)
A Fair Amount (40% to
less than 60%)
Most (60% to
less than 80%)
Almost All (80% to
less than 100%)
All (100%)
PAPER ITEMS
Newspaper 8.4 8.3 10.2 12.9 16.4 43.9
Magazines 7.8 8.0 10.1 12.5 15.7 45.9
Junk Mail/Brochures 7.1 6.5 9.1 14.0 14.8 48.6
Cardboard 8.0 6.8 9.7 14.2 15.6 45.8
GLASS
Beer/wine Bottles 8.8 8.6 8.7 17.1 14.2 42.6
Glass Containers 9.7 9.5 9.6 14.9 14.5 41.7
METALS
Aluminium Drinks Can 11.4 10.9 9.2 16.4 13.2 38.9
Tin Cans 10.4 8.7 10.1 17.7 12.7 40.5
PLASTICS
Drink Bottles 10.0 11.3 11.7 15.6 14.5 36.9
Containers 8.5 8.9 11.5 15.5 14.8 40.8
Cartons 9.0 7.3 8.0 15.2 16.1 44.5
Bags 5.0 7.8 7.8 12.3 15.5 51.6
OTHERS
Tetra-pak 7.9 9.6 11.3 9.6 14.7 46.9
Old Clothing 11.0 13.6 13.0 10.7 9.8 41.9
Small Electronic Appliances
14.1 10.9 11.1 11.0 11.5 41.5
Recycling Method – Paper Items
Table 2.3.3. Top 5 recycling methods for paper items
FREQUENCY PERCENT*
Karung Guni Recycling Collection 965 43.2
Recycling Bins 666 29.8
Door-to-Door Collection of Recycling Bags 616 27.6
Reuse 204 9.1
Give to others to reuse 186 8.3
*respondents could choose multiple responses

HOUSEHOLD RECYCLING STUDY
Recycling Method – Non-Paper Items
Table 2.3.4. Top 5 recycling methods for non-paper items
FREQUENCY PERCENT*
Reuse 991 44.5
Recycling Bins 908 40.7
Give to others to reuse 777 34.9
Door-to-Door Collection of Recycling Bags 631 28.3
Karang Guni Recycling Collection 594 26.7
*respondents could choose multiple responses
Pre-Recycling Steps
Table 2.3.5. Actions carried out prior to recycling - Wash/Clean
FREQUENCY PERCENT* PERCENT
Wash/Clean - Glass 695 35.5 58.3% will
wash/clean Wash/Clean - Metals 608 31.0
Wash/Clean - Plastics 908 46.3
Wash/Clean - None of above 818 41.7 41.7
*respondents could choose multiple responses

HOUSEHOLD RECYCLING STUDY
2.4. Key Findings: Motivations Reasons for Recycling Paper Items
Table 2.4.1. Top 5 reasons for recycling paper items
FREQUENCY PERCENT*
Recycling helps save the environment 1544 69.2
Recycling is the morally right thing to do 701 31.4
It will benefit others 409 18.3
It is convenient to recycle 393 17.6
Recycling helps to save money/ incentives 267 12.0
*respondents could choose multiple responses
Reasons for Recycling Plastic/Metal/Glass
Table 2.4.2. Top 5 reasons for recycling Plastic/Metal/Glass
FREQUENCY PERCENT*
Recycling helps save the environment 1392 69.1
Recycling is the morally right thing to do 602 29.9
It will benefit others 438 21.7
Can be reused 239 11.9
Recycling helps to save money/ incentives 237 11.8
*respondents could choose multiple responses
Reasons for Not Recycling Paper Items

HOUSEHOLD RECYCLING STUDY
Table 2.4.3. Top 5 reasons for not recycling paper items
FREQUENCY PERCENT*
None/Too few/ Too small an item to recycle 1050 65.2
Will re-use it instead 226 14.0
Inconvenient to bring the recyclables to the bin 167 10.4
Inconvenient in having to sort out/clean the recyclables 134 8.3
Don't know of/ No recycling facilities in the proximity 108 6.7
*respondents could choose multiple responses
Reasons for Not Recycling Plastic/Metal/Glass
Table 2.4.4. Top 5 Reasons for not recycling Plastic/Metal/Glass
FREQUENCY PERCENT*
No/Too few/ Too small an item to recycle 1230 59.6
Will re-use it instead 404 19.6
Not aware that it could be recycled 231 11.2
Inconvenient to bring the recyclables to the bin 219 10.6
Don't know of/ No recycling facilities in the proximity 175 8.5
*respondents could choose multiple responses
Recycling Behaviour Compared to One Year Ago
Figure 2.4.1. Recycling behaviour compared to one year ago
25.4%
68.5%
6.2%
Recycling behaviour compared to one year ago
Recycling more
Same
Recycling less

HOUSEHOLD RECYCLING STUDY
Reasons People Start to Recycle
Table 2.4.5. Top 5 reasons why people start to recycle
FREQUENCY PERCENT*
I want to do my part to save the environment 1525 64.2
I believe it is the right thing to do 916 38.6
It is more convenient than throwing my rubbish away 291 12.3
Recycling earns/saves me money 195 8.2
There is a recycling bin nearby/ recycle bag provided 151 6.4
*respondents could choose multiple responses
Influencers of Household Recycling Behaviour
Figure 2.4.6. Did anyone influence you to recycle? (Top 5)
FREQUENCY PERCENT*
No one 1850 74.0
School/Teacher/Mentor/Coach 182 7.3
Mother/ Mother-in-law 159 6.4
Father/ Father-in-law 102 4.1
Spouse 82 3.3
*respondents could choose multiple responses

HOUSEHOLD RECYCLING STUDY
Encouraging Others to Recycle
Figure 2.4.2. Would you encourage others to start recycling
Table 2.4.7. Who would you encourage to recycle?
PERCENT*
Family members 77.9
Friend 66.6
Neighbour 17.9
Employer 2.8
Colleague 12.3
Teacher/Mentor/Coach 1.1
Religious leader 1.1
Classmate/ Schoolmate 3.5
Others 0.3
Tenant 0.1
Anyone/ Everyone 1.4
Relatives 0.7
Domestic Helper/ Maid 0.5
Senior Citizens/ Young children 0.5
Student 0.3
*respondents could choose multiple responses
78.2%
21.8%
Would you encourage others to start recycling?
Yes
No

HOUSEHOLD RECYCLING STUDY
2.5. Key Findings: Awareness/Knowledge Top-of-Mind Awareness
Figure 2.5.1. First thing associated with “Recycling” (Top 5 responses)
Co-mingled Recycling
Figure 2.5.2. Awareness of co-mingled recycling (%)
44.2%
26.0%
8.9%
6.2%
4.1%
10.60%
First thing associated with "Recycling" (Top 5 responses)
The different types of recyclables (e.g. Paper, Glass, Metals, Plastics)
Helps preserve the environment
Recyclables re-made into other useful items
Bringing recyclables to the recycling bin or collection point
Karung Guni
Others
60.8%
39.2%
Awareness of co-mingled recycling (%)
Yes
No

HOUSEHOLD RECYCLING STUDY
Knowledge of Nearest Recycling Bin
Table 2.5.1. Knowledge of nearest recycling bin (%)
FREQUENCY PERCENT
Yes 1620 64.8
No 880 35.2
Total 2500 100.0
Convenience of Nearest Recycling Bin
Table 2.5.2. “The recycling bin is conveniently located to my home”
FREQUENCY PERCENT
Strongly Disagree 35 2.2
Disagree 95 5.9
Somewhat Disagree 61 3.8
Neutral 91 5.6
Somewhat Agree 206 12.7
Agree 882 54.4
Strongly Agree 250 15.4
Total 1620 100.0
Not aware 880
Table 2.5.3. Mean score
THE RECYCLING BIN IS CONVENIENTLY LOCATED TO MY HOME
Mean score 5.46 out of 7
Knowledge of Which Items Can Be Recycled
HOUSEHOLD RECYCLING STUDY
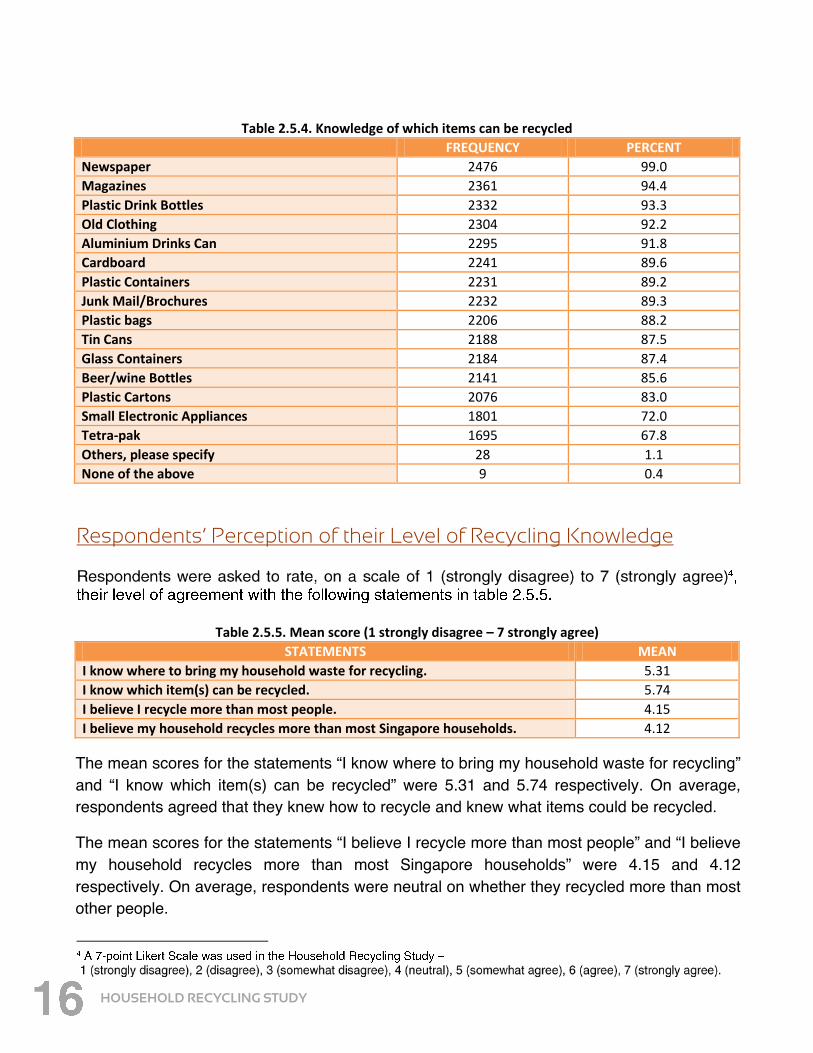
Table 2.5.4. Knowledge of which items can be recycled
FREQUENCY PERCENT
Newspaper 2476 99.0
Magazines 2361 94.4
Plastic Drink Bottles 2332 93.3
Old Clothing 2304 92.2
Aluminium Drinks Can 2295 91.8
Cardboard 2241 89.6
Plastic Containers 2231 89.2
Junk Mail/Brochures 2232 89.3
Plastic bags 2206 88.2
Tin Cans 2188 87.5
Glass Containers 2184 87.4
Beer/wine Bottles 2141 85.6
Plastic Cartons 2076 83.0
Small Electronic Appliances 1801 72.0
Tetra-pak 1695 67.8
Others, please specify 28 1.1
None of the above 9 0.4
Respondents’ Perception of their Level of Recycling Knowledge
Table 2.5.5. Mean score (1 strongly disagree – 7 strongly agree)
STATEMENTS MEAN
I know where to bring my household waste for recycling. 5.31
I know which item(s) can be recycled. 5.74
I believe I recycle more than most people. 4.15
I believe my household recycles more than most Singapore households. 4.12
The mean scores for the statements “I know where to bring my household waste for recycling” and “I know which item(s) can be recycled” were 5.31 and 5.74 respectively. On average, respondents agreed that they knew how to recycle and knew what items could be recycled.
The mean scores for the statements “I believe I recycle more than most people” and “I believe my household recycles more than most Singapore households” were 4.15 and 4.12 respectively. On average, respondents were neutral on whether they recycled more than most other people.

HOUSEHOLD RECYCLING STUDY
2.6. Key Findings: Barriers
Household Norms
Table 2.6.1. Household norms (1 strongly disagree – 7 strongly agree)
STATEMENTS MEAN
My family does not believe in recycling 2.35
No one in my home recycles 2.31
Habits
Table 2.6.2. Personal habits (1 strongly disagree – 7 strongly agree)
STATEMENTS MEAN
I will still recycle no matter how busy I am 5.13
I will recycle more often if the recycling bin is nearer to my home 5.73
I do not recycle due to hygiene reasons 2.77
The mean scores for the statements “my family does not believe in recycling” and “no one in my home recycles” were 2.35 and 2.31 respectively. The findings suggested that respondentsʼ households believed in recycling and had at least one member who recycled.
The survey results suggested that on average respondents somewhat agreed that they would recycle even if they were busy (mean score 5.13), and agreed that they would recycle more often if the recycling bins were located closer to their homes (mean score 5.73). Respondents on average also disagreed that hygiene reasons were a barrier to them recycling (mean score 2.77).

HOUSEHOLD RECYCLING STUDY
2.7. Key Findings: Public feedback Information on Recycling
Figure 2.7.1. Would you want to know more about recycling?
Table 2.7.1. Information respondents would like to know more about with regard to recycling
(Top 5 responses)
FREQUENCY PERCENT*
What are the correct steps to recycle 618 43.8
Where is the nearest recycling bin from my house 586 41.5
General Recycling Campaigns/ Actions taken by the Government 583 41.3
How does recycling affect the environment/ benefits of recycling 499 35.3
What item(s) could be recycled 472 33.4
*respondents could choose multiple responses
56.5%
43.5%
Would you want to know more about recycling?
Yes
No

HOUSEHOLD RECYCLING STUDY
Suggestions on Encouraging Household Recycling
Table 2.7.2. Suggestions for Government initiatives to encourage household recycling (Top 5 responses)
FREQUENCY PERCENT*
More media coverage 1191 47.7
Place more recycling bins around my house/ Give more recycling bags/ Have more recycling points
1072 42.9
Teach people how to recycle & the value of recycling 581 23.3
Provide incentives 494 19.8
Have more recycling campaigns/initiatives to promote environmental values
462 18.5
*respondents could choose multiple responses

HOUSEHOLD RECYCLING STUDY
2.8. Summary of Key Findings
Findings suggested that households supported recycling and had at least one member who recycled.

HOUSEHOLD RECYCLING STUDY
3.1. Design and Methodology
PHASE 2 : FOCUS GROUP DISCUSSIONS

HOUSEHOLD RECYCLING STUDY
3.2. Key Findings: Recycling Behaviour
Personal Reasons
Value of Recycling
Force of Habit
Social/Cultural
Household Role

HOUSEHOLD RECYCLING STUDY
Social Norms
Infrastructural
Convenience
Infrequent Collection

HOUSEHOLD RECYCLING STUDY
3.3. Key Findings: Views on current / possible future recycling efforts
Recycling Campaigns and Messages
Save-As-You-Reduce

HOUSEHOLD RECYCLING STUDY
Promoting Recycling through the Community
Incentives
HOUSEHOLD RECYCLING STUDY
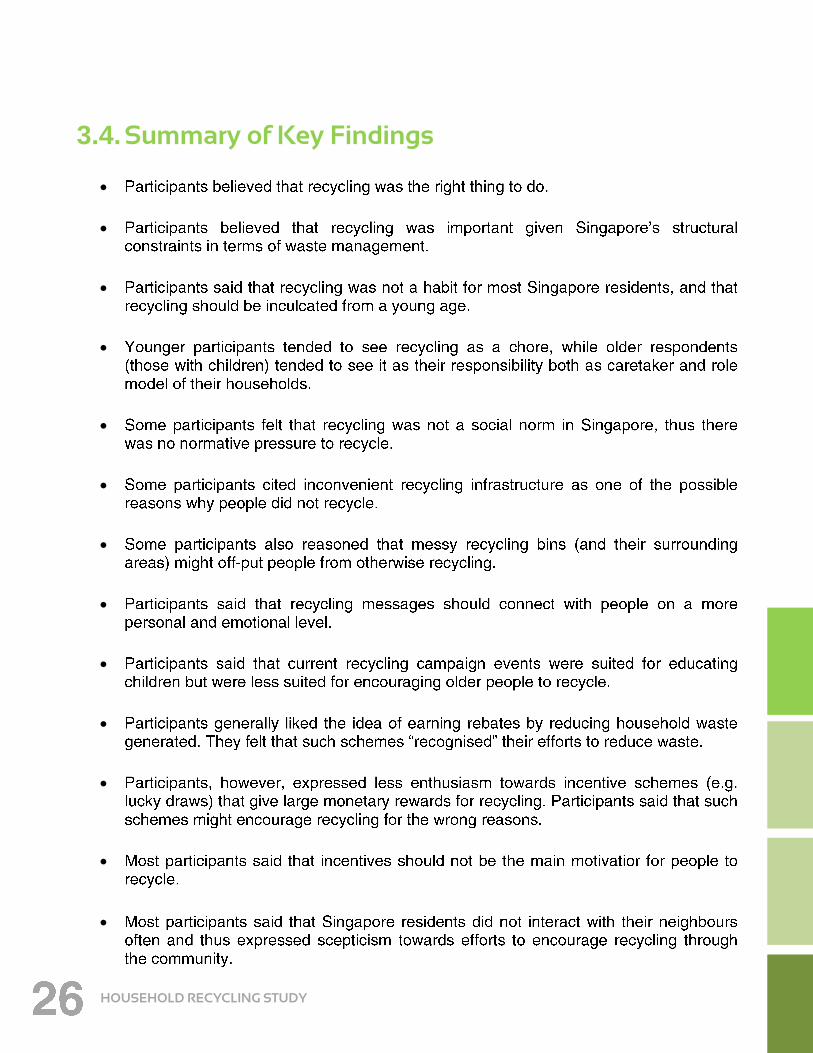
3.4. Summary of Key Findings

HOUSEHOLD RECYCLING STUDY
Expanding the number of item types that people recycle
Storing recyclables at home
Increasing accessibility of recycling infrastructure
Raising awareness of the correct steps to recycle
Connecting with people
CONCLUSION

HOUSEHOLD RECYCLING STUDY
Des
ign
ed b
y Ta
ihei
( d
esig
n@
taih
ei.c
om
.sg
)