housing & neighborhood development
TRANSCRIPT

H o u s i n g & N e i g h b o r h o o d D e v e l o p m e n t • C a b i n e t 1 1 3
Housing & Neighborhood Development
Housing & Neighborhood Development Cabinet
Housing & Neighborhood Development ....................................... 115 Leading the Way ........................................................................ 117
Housing Production and Access .............................. 120 Housing & Neighborhood Preservation .................. 121
Neighborhood Development ................................................... 123 Administration ............................................................. 130 Real Estate Management & Sales ............................ 131 Housing Development ................................................. 132 Business Services ....................................................... 133

1 1 4 H o u s i n g & N e i g h b o r h o o d D e v e l o p m e n t • C a b i n e t

H o u s i n g & N e i g h b o r h o o d D e v e l o p m e n t • C a b i n e t 1 1 5
Housing & Neighborhood Development
Housing & Neighborhood Development
Sheila Dillon, Chief of Housing & Neighborhood Development
Cabinet Mission The Cabinet is committed to making Boston the most livable city in the nation by working with its many communities to build strong neighborhoods through
the strategic investment of public resources.
Operating Budget Program Name Total Actual '12 Total Actual '13 Total Approp '14 Total Budget '15
Leading the Way 5,000,000 5,000,000 5,500,000 5,500,000Neighborhood Development 3,632,726 3,875,851 4,123,194 4,501,494
Total 8,632,726 8,875,851 9,623,194 10,001,494
Capital Budget Expenditures Actual '12 Actual '13 Estimated '14 Projected '15
Neighborhood Development 1,808,387 1,999,536 1,200,000 1,915,000 Total 1,808,387 1,999,536 1,200,000 1,915,000
External Funds Expenditures Total Actual '12 Total Actual '13 Total Approp '14 Total Budget '15
Neighborhood Development 71,608,352 64,421,665 67,990,418 70,381,328Total 71,608,352 64,421,665 67,990,418 70,381,328


H o u s i n g & N e i g h b o r h o o d D e v e l o p m e n t • L e a d i n g t h e W a y 1 1 7
Leading the Way Operating Budget
Housing & Neighborhood Development Leading the Way
Appropriation 189
Department Mission The mission of the Leading the Way campaign is to expand and protect Boston’s housing supply and stabilize neighborhoods adversely effected by the
economic downturn and foreclosure boom. The campaign focuses all of the City’s housing agencies, including the Department of Neighborhood
Development, the Boston Housing Authority, the Boston Redevelopment Authority, and the Inspectional Services Department around a comprehensive
strategy to address Boston’s housing needs in four key areas: 1) Housing Boston’s workforce through new production and enhanced access to the market; 2)
Preventing foreclosures and mitigating the negative effects of foreclosures on Boston’s neighborhoods; 3) Reversing the rise in homelessness, and 4)
Preserving and stabilizing the rental housing stock.
Selected Performance Strategies Housing Production and Access
• To expand the supply of market rate housing, especially in areas of the City not adversely affected by foreclosures
or declining values.
• To help moderate to middle income homebuyers benefit from lower market prices by helping them overcome
financing obstacles currently existing in the credit markets.
Housing & Neighborhood Preservation
• To reduce home foreclosures through counseling of at-risk homeowners.
Operating Budget Program Name Total Actual '12 Total Actual '13 Total Approp '14 Total Budget '15
Housing Production and Access 2,500,000 2,500,000 2,500,000 2,500,000Housing & Neighborhood Preservation 2,500,000 2,500,000 3,000,000 3,000,000
Total 5,000,000 5,000,000 5,500,000 5,500,000
Operating Budget Actual '12 Actual '13 Approp '14 Budget '15
Personnel Services 0 0 0 0 Non Personnel 5,000,000 5,000,000 5,500,000 5,500,000
Total 5,000,000 5,000,000 5,500,000 5,500,000

1 1 8 H o u s i n g & N e i g h b o r h o o d D e v e l o p m e n t • L e a d i n g t h e W a y
Leading the Way Operating Budget
Description of Services Leading the Way resources will be used to help new
homebuyers enter the market including purchasing
bank-foreclosed properties; stabilize neighborhoods
by assisting homeowners with repairs of their
homes; create supportive housing for homeless
families and individuals, and preserve rental
housing.
H o u s i n g & N e i g h b o r h o o d D e v e l o p m e n t • L e a d i n g t h e W a y 1 1 9
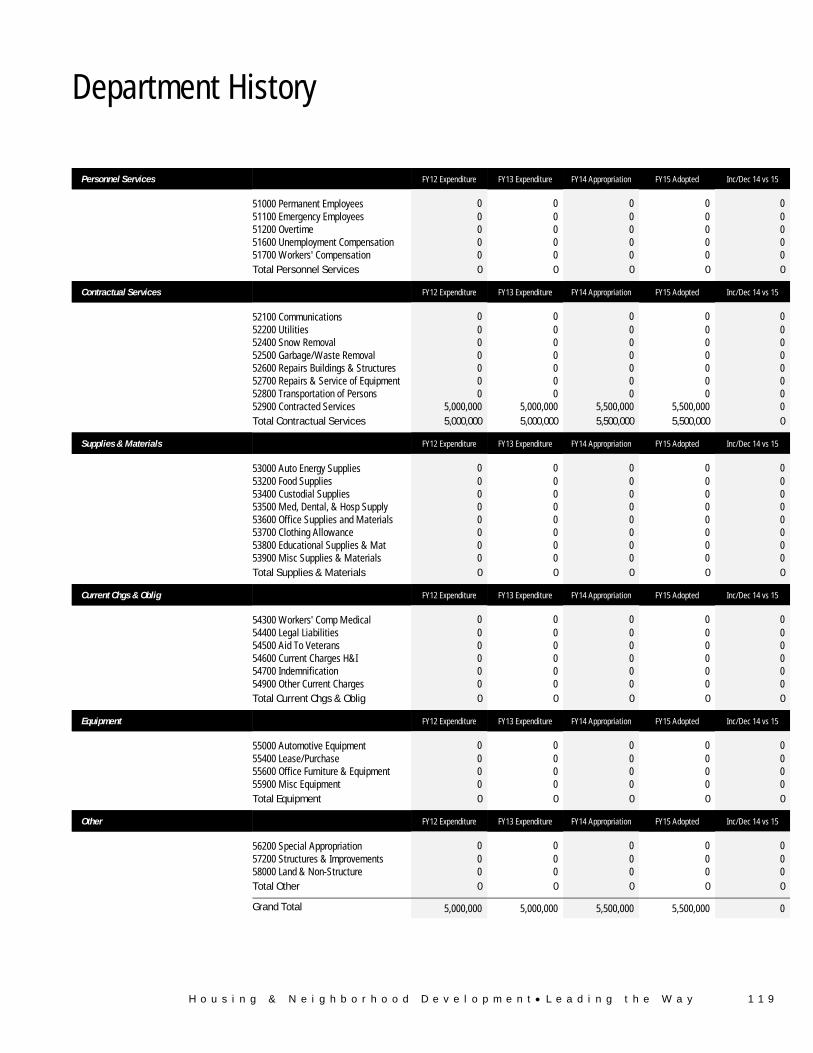
Department History
Personnel Services FY12 Expenditure FY13 Expenditure FY14 Appropriation FY15 Adopted Inc/Dec 14 vs 15
51000 Permanent Employees 0 0 0 0 0 51100 Emergency Employees 0 0 0 0 0 51200 Overtime 0 0 0 0 0 51600 Unemployment Compensation 0 0 0 0 0 51700 Workers' Compensation 0 0 0 0 0 Total Personnel Services 0 0 0 0 0
Contractual Services FY12 Expenditure FY13 Expenditure FY14 Appropriation FY15 Adopted Inc/Dec 14 vs 15
52100 Communications 0 0 0 0 0 52200 Utilities 0 0 0 0 0 52400 Snow Removal 0 0 0 0 0 52500 Garbage/Waste Removal 0 0 0 0 0 52600 Repairs Buildings & Structures 0 0 0 0 0 52700 Repairs & Service of Equipment 0 0 0 0 0 52800 Transportation of Persons 0 0 0 0 0 52900 Contracted Services 5,000,000 5,000,000 5,500,000 5,500,000 0 Total Contractual Services 5,000,000 5,000,000 5,500,000 5,500,000 0
Supplies & Materials FY12 Expenditure FY13 Expenditure FY14 Appropriation FY15 Adopted Inc/Dec 14 vs 15
53000 Auto Energy Supplies 0 0 0 0 0 53200 Food Supplies 0 0 0 0 0 53400 Custodial Supplies 0 0 0 0 0 53500 Med, Dental, & Hosp Supply 0 0 0 0 0 53600 Office Supplies and Materials 0 0 0 0 0 53700 Clothing Allowance 0 0 0 0 0 53800 Educational Supplies & Mat 0 0 0 0 0 53900 Misc Supplies & Materials 0 0 0 0 0 Total Supplies & Materials 0 0 0 0 0
Current Chgs & Oblig FY12 Expenditure FY13 Expenditure FY14 Appropriation FY15 Adopted Inc/Dec 14 vs 15
54300 Workers' Comp Medical 0 0 0 0 0 54400 Legal Liabilities 0 0 0 0 0 54500 Aid To Veterans 0 0 0 0 0 54600 Current Charges H&I 0 0 0 0 0 54700 Indemnification 0 0 0 0 0 54900 Other Current Charges 0 0 0 0 0 Total Current Chgs & Oblig 0 0 0 0 0
Equipment FY12 Expenditure FY13 Expenditure FY14 Appropriation FY15 Adopted Inc/Dec 14 vs 15
55000 Automotive Equipment 0 0 0 0 0 55400 Lease/Purchase 0 0 0 0 0 55600 Office Furniture & Equipment 0 0 0 0 0 55900 Misc Equipment 0 0 0 0 0 Total Equipment 0 0 0 0 0
Other FY12 Expenditure FY13 Expenditure FY14 Appropriation FY15 Adopted Inc/Dec 14 vs 15
56200 Special Appropriation 0 0 0 0 0 57200 Structures & Improvements 0 0 0 0 0 58000 Land & Non-Structure 0 0 0 0 0 Total Other 0 0 0 0 0
Grand Total 5,000,000 5,000,000 5,500,000 5,500,000 0

1 2 0 H o u s i n g & N e i g h b o r h o o d D e v e l o p m e n t • L e a d i n g t h e W a y
Program 1. Housing Production and Access
Organization 189200
Program Description The mission of this program is to house Boston’s workforce through new production of market rate housing, opening up access to the market for moderate-
and-middle income homebuyers and producing new affordable housing for lower-wage workers including new supportive housing for Boston’s homeless. This
program will use City-controlled resources including its regulatory powers, real estate assets and funding to leverage significant public and private
investments to achieve its goals.
Operating Budget Actual '12 Actual '13 Approp '14 Budget '15
Personnel Services 0 0 0 0 Non Personnel 2,500,000 2,500,000 2,500,000 2,500,000
Total 2,500,000 2,500,000 2,500,000 2,500,000
Performance
Strategy: To expand the supply of market rate housing, especially in areas of the City not adversely affected by foreclosures or declining values.
Performance Measures Actual '12 Actual '13 Projected '14 Target '15
Market-rate units permitted 2,201 2,400 2,918 2,500
Strategy: To help moderate to middle income homebuyers benefit from lower market prices by helping them overcome financing obstacles currently
existing in the credit markets.
Performance Measures Actual '12 Actual '13 Projected '14 Target '15
Affordable units permitted 447 346 872 500

H o u s i n g & N e i g h b o r h o o d D e v e l o p m e n t • L e a d i n g t h e W a y 1 2 1
Program 2. Housing & Neighborhood Preservation
Organization 189300
Program Description The mission of this program is 1) to preserve affordable housing that is at risk due to either expiring affordability protections or physical and financial
distress, and 2) to preserve neighborhoods put at risk due to foreclosures, neglected bank-owned real estate and declining values. This mission will be
achieved through a combination of initiatives that will preserve affordable rental housing, prevent foreclosures and mitigate the effects of those foreclosures
that do occur and help existing homeowners reinvest in their homes.
Operating Budget Actual '12 Actual '13 Approp '14 Budget '15
Personnel Services 0 0 0 0 Non Personnel 2,500,000 2,500,000 3,000,000 3,000,000
Total 2,500,000 2,500,000 3,000,000 3,000,000
Performance
Strategy: To reduce home foreclosures through counseling of at-risk homeowners.
Performance Measures Actual '12 Actual '13 Projected '14 Target '15
Homeowners assisted with foreclosure prevention counseling 703 458 356 350
Homeowners assisted with foreclosure prevention counseling who avoided foreclosure
495 503 391 400

1 2 2 H o u s i n g & N e i g h b o r h o o d D e v e l o p m e n t • L e a d i n g t h e W a y

H o u s i n g & N e i g h b o r h o o d D e v e l o p m e n t • N e i g h b o r h o o d D e v e l o p m e n t 1 2 3
Neighborhood Development Operating Budget
Housing & Neighborhood Development Neighborhood Development
Sheila Dillon, Chief of Housing & Neighborhood Development , Appropriation 188
Department Mission The Cabinet is committed to making Boston the most livable city in the nation by working with its many communities to build strong neighborhoods through
the strategic investment of public resources.
Selected Performance Strategies Real Estate Management & Sales
• To dispose of tax-foreclosed and surplus property.
• To manage tax-foreclosed and surplus property.
Housing Development
• To assist existing homeowners in retaining their homes and to encourage homeownership.
• To assist tenants and landlords to preserve their tenancies or secure alternative housing, including those at risk
of homelessness.
• To provide shelter, support services, rental assistance, and housing counseling to homeless persons, persons with
AIDS, and tenants at risk.
Business Services
• To create jobs and help open new businesses.
• To enhance Boston Main Streets.
• To improve business assistance tools and services.
• To improve customer service for businesses.
Operating Budget Program Name Total Actual '12 Total Actual '13 Total Approp '14 Total Budget '15
Administration 850,807 1,537,647 1,663,185 1,603,229Real Estate Management & Sales 1,737,871 1,357,404 1,794,389 1,807,714Housing Development 928,443 791,083 540,539 548,470Business Services 115,605 189,717 125,081 542,081
Total 3,632,726 3,875,851 4,123,194 4,501,494
External Funds Budget Fund Name Total Actual
'12Total Actual '13 Total Approp '14 Total Budget '15
Abandoned Property Rehab Grant 0 50,296 0 0ARRA - CDBG 1,424,429 169,287 0 0
ARRA - Homeless Prevention & Rapid Re-Housing 1,638,306 261,786 0 0
ARRA - Neighborhood Stabilization Program 5,019,122 2,130,178 0 0BRA/HODAG Program Income 0 0 0 1,750,000Brownfields Economic Development Initiative 48,256 225,871 50,334 50,334CDBG 19,540,584 19,167,392 20,894,112 22,114,797Choice Neighborhood Implementation Grant 0 2,661,794 9,941,590 6,378,100Community Challenge Planning Grant 0 47,151 615,100 858,000Continuum of Care 21,549,863 22,237,904 21,689,907 23,883,539Emergency Solutions Grant 897,148 1,750,271 1,188,404 1,367,603
1 2 4 H o u s i n g & N e i g h b o r h o o d D e v e l o p m e n t • N e i g h b o r h o o d D e v e l o p m e n t
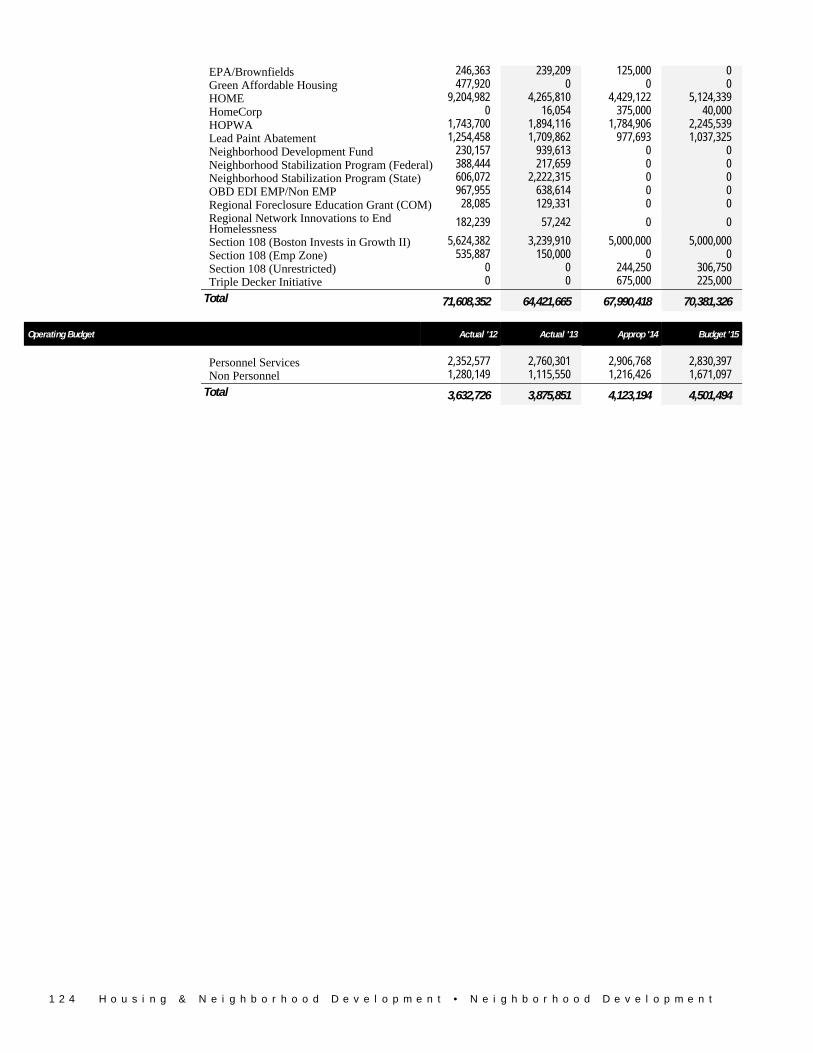
EPA/Brownfields 246,363 239,209 125,000 0Green Affordable Housing 477,920 0 0 0HOME 9,204,982 4,265,810 4,429,122 5,124,339HomeCorp 0 16,054 375,000 40,000HOPWA 1,743,700 1,894,116 1,784,906 2,245,539Lead Paint Abatement 1,254,458 1,709,862 977,693 1,037,325Neighborhood Development Fund 230,157 939,613 0 0Neighborhood Stabilization Program (Federal) 388,444 217,659 0 0Neighborhood Stabilization Program (State) 606,072 2,222,315 0 0OBD EDI EMP/Non EMP 967,955 638,614 0 0Regional Foreclosure Education Grant (COM) 28,085 129,331 0 0
Regional Network Innovations to End Homelessness 182,239 57,242 0 0
Section 108 (Boston Invests in Growth II) 5,624,382 3,239,910 5,000,000 5,000,000Section 108 (Emp Zone) 535,887 150,000 0 0Section 108 (Unrestricted) 0 0 244,250 306,750Triple Decker Initiative 0 0 675,000 225,000
Total 71,608,352 64,421,665 67,990,418 70,381,326
Operating Budget Actual '12 Actual '13 Approp '14 Budget '15
Personnel Services 2,352,577 2,760,301 2,906,768 2,830,397 Non Personnel 1,280,149 1,115,550 1,216,426 1,671,097
Total 3,632,726 3,875,851 4,123,194 4,501,494

H o u s i n g & N e i g h b o r h o o d D e v e l o p m e n t • N e i g h b o r h o o d D e v e l o p m e n t 1 2 5
Neighborhood Development Operating Budget
Authorizing Statutes • Enabling Legislation, 1961 Mass. Acts ch. 642, §§
1-3.
• Sale of Certain Surplus Property, 1982 Mass. Acts
ch. 190, § 24; 1986 Mass. Acts ch. 701, § 4.
• Design Services, M.G.L.A. c. 7, § 38A 1/2.
• Public Works Construction, M.G.L.A. c. 30, § 39M.
• Building Construction, M.G.L.A. c. 149, §§ 44A-
44J.
• Municipal Participation in Condominiums,
M.G.L.A. c. 183A, § 20.
• Boston Urban Homestead Program, CBC Ord. §§
8-2.1-8-2.8.
• Code Enforcement, M.G.L.A. c.40, § 21d; M.G.L.A.
c. 270, § 16.
• Transfers of Property to Boston Redevelopment
Authority, CBC St. 11 §§ 251, 255.
• Committee on Foreclosed Real Estate; Powers,
CBC Ord. §§ 11-7.1-11-7.2; CBC St. 11 §§ 251,
255.
• 1994 Mass. Acts ch. 282; CBC Ord. § 10-2.1.
Description of Services The Department provides services and assistance
through a wide variety of programs that are
designed to improve the current housing stock of
existing homeowners, promote homeownership,
develop and preserve affordable housing, foster
economically viable neighborhood business
districts, and dispose of City-owned tax foreclosed
and surplus property in a responsible manner.

1 2 6 H o u s i n g & N e i g h b o r h o o d D e v e l o p m e n t • N e i g h b o r h o o d D e v e l o p m e n t
Department History
Personnel Services FY12 Expenditure FY13 Expenditure FY14 Appropriation FY15 Adopted Inc/Dec 14 vs 15
51000 Permanent Employees 2,334,034 2,748,144 2,893,269 2,816,898 -76,371 51100 Emergency Employees 11 0 0 0 0 51200 Overtime 0 0 0 0 0 51600 Unemployment Compensation 18,532 10,012 11,000 11,000 0 51700 Workers' Compensation 0 2,145 2,499 2,499 0 Total Personnel Services 2,352,577 2,760,301 2,906,768 2,830,397 -76,371
Contractual Services FY12 Expenditure FY13 Expenditure FY14 Appropriation FY15 Adopted Inc/Dec 14 vs 15
52100 Communications 89,289 105,625 70,231 56,500 -13,731 52200 Utilities 98,680 64,881 109,413 103,944 -5,469 52400 Snow Removal 11,684 48,161 45,000 45,000 0 52500 Garbage/Waste Removal 8,606 6,856 16,250 10,050 -6,200 52600 Repairs Buildings & Structures 89,827 133,450 205,022 202,522 -2,500 52700 Repairs & Service of Equipment 29,592 16,042 31,150 27,150 -4,000 52800 Transportation of Persons 5,030 6,446 7,851 7,187 -664 52900 Contracted Services 575,513 567,456 604,332 1,048,622 444,290 Total Contractual Services 908,221 948,917 1,089,249 1,500,975 411,726
Supplies & Materials FY12 Expenditure FY13 Expenditure FY14 Appropriation FY15 Adopted Inc/Dec 14 vs 15
53000 Auto Energy Supplies 3,553 1,988 2,368 2,368 0 53200 Food Supplies 4,850 8,050 6,685 6,685 0 53400 Custodial Supplies 0 0 0 0 0 53500 Med, Dental, & Hosp Supply 0 0 0 0 0 53600 Office Supplies and Materials 16,564 25,670 26,850 26,800 -50 53700 Clothing Allowance 0 0 0 0 0 53800 Educational Supplies & Mat 0 0 0 0 0 53900 Misc Supplies & Materials 4,384 14,762 11,625 13,625 2,000 Total Supplies & Materials 29,351 50,470 47,528 49,478 1,950
Current Chgs & Oblig FY12 Expenditure FY13 Expenditure FY14 Appropriation FY15 Adopted Inc/Dec 14 vs 15
54300 Workers' Comp Medical 358 2,619 900 900 0 54400 Legal Liabilities 6,217 472 6,854 4,000 -2,854 54500 Aid To Veterans 0 0 0 0 0 54600 Current Charges H&I 0 0 0 0 0 54700 Indemnification 0 0 0 0 0 54900 Other Current Charges 334,829 110,806 45,525 106,875 61,350 Total Current Chgs & Oblig 341,404 113,897 53,279 111,775 58,496
Equipment FY12 Expenditure FY13 Expenditure FY14 Appropriation FY15 Adopted Inc/Dec 14 vs 15
55000 Automotive Equipment 0 0 0 0 0 55400 Lease/Purchase 0 0 8,620 7,869 -751 55600 Office Furniture & Equipment 0 0 0 0 0 55900 Misc Equipment 1,173 2,266 17,750 1,000 -16,750 Total Equipment 1,173 2,266 26,370 8,869 -17,501
Other FY12 Expenditure FY13 Expenditure FY14 Appropriation FY15 Adopted Inc/Dec 14 vs 15
56200 Special Appropriation 0 0 0 0 0 57200 Structures & Improvements 0 0 0 0 0 58000 Land & Non-Structure 0 0 0 0 0 Total Other 0 0 0 0 0
Grand Total 3,632,726 3,875,851 4,123,194 4,501,494 378,300
H o u s i n g & N e i g h b o r h o o d D e v e l o p m e n t • N e i g h b o r h o o d D e v e l o p m e n t 1 2 7
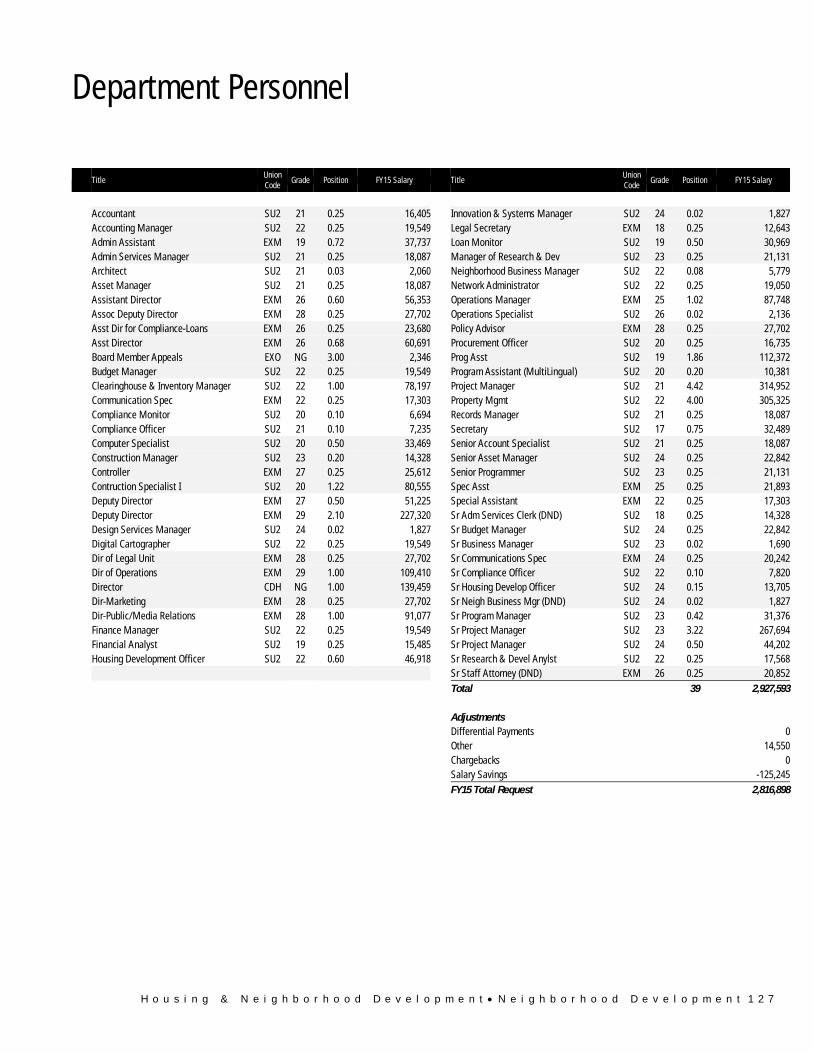
Department Personnel
Title Union Code
Grade Position FY15 Salary Title Union Code
Grade Position FY15 Salary
Accountant SU2 21 0.25 16,405 Innovation & Systems Manager SU2 24 0.02 1,827 Accounting Manager SU2 22 0.25 19,549 Legal Secretary EXM 18 0.25 12,643 Admin Assistant EXM 19 0.72 37,737 Loan Monitor SU2 19 0.50 30,969 Admin Services Manager SU2 21 0.25 18,087 Manager of Research & Dev SU2 23 0.25 21,131 Architect SU2 21 0.03 2,060 Neighborhood Business Manager SU2 22 0.08 5,779 Asset Manager SU2 21 0.25 18,087 Network Administrator SU2 22 0.25 19,050 Assistant Director EXM 26 0.60 56,353 Operations Manager EXM 25 1.02 87,748 Assoc Deputy Director EXM 28 0.25 27,702 Operations Specialist SU2 26 0.02 2,136 Asst Dir for Compliance-Loans EXM 26 0.25 23,680 Policy Advisor EXM 28 0.25 27,702 Asst Director EXM 26 0.68 60,691 Procurement Officer SU2 20 0.25 16,735 Board Member Appeals EXO NG 3.00 2,346 Prog Asst SU2 19 1.86 112,372 Budget Manager SU2 22 0.25 19,549 Program Assistant (MultiLingual) SU2 20 0.20 10,381 Clearinghouse & Inventory Manager SU2 22 1.00 78,197 Project Manager SU2 21 4.42 314,952 Communication Spec EXM 22 0.25 17,303 Property Mgmt SU2 22 4.00 305,325 Compliance Monitor SU2 20 0.10 6,694 Records Manager SU2 21 0.25 18,087 Compliance Officer SU2 21 0.10 7,235 Secretary SU2 17 0.75 32,489 Computer Specialist SU2 20 0.50 33,469 Senior Account Specialist SU2 21 0.25 18,087 Construction Manager SU2 23 0.20 14,328 Senior Asset Manager SU2 24 0.25 22,842 Controller EXM 27 0.25 25,612 Senior Programmer SU2 23 0.25 21,131 Contruction Specialist I SU2 20 1.22 80,555 Spec Asst EXM 25 0.25 21,893 Deputy Director EXM 27 0.50 51,225 Special Assistant EXM 22 0.25 17,303 Deputy Director EXM 29 2.10 227,320 Sr Adm Services Clerk (DND) SU2 18 0.25 14,328 Design Services Manager SU2 24 0.02 1,827 Sr Budget Manager SU2 24 0.25 22,842 Digital Cartographer SU2 22 0.25 19,549 Sr Business Manager SU2 23 0.02 1,690 Dir of Legal Unit EXM 28 0.25 27,702 Sr Communications Spec EXM 24 0.25 20,242 Dir of Operations EXM 29 1.00 109,410 Sr Compliance Officer SU2 22 0.10 7,820 Director CDH NG 1.00 139,459 Sr Housing Develop Officer SU2 24 0.15 13,705 Dir-Marketing EXM 28 0.25 27,702 Sr Neigh Business Mgr (DND) SU2 24 0.02 1,827 Dir-Public/Media Relations EXM 28 1.00 91,077 Sr Program Manager SU2 23 0.42 31,376 Finance Manager SU2 22 0.25 19,549 Sr Project Manager SU2 23 3.22 267,694 Financial Analyst SU2 19 0.25 15,485 Sr Project Manager SU2 24 0.50 44,202 Housing Development Officer SU2 22 0.60 46,918 Sr Research & Devel Anylst SU2 22 0.25 17,568 Sr Staff Attorney (DND) EXM 26 0.25 20,852 Total 39 2,927,593 Adjustments Differential Payments 0 Other 14,550 Chargebacks 0 Salary Savings -125,245 FY15 Total Request 2,816,898

1 2 8 H o u s i n g & N e i g h b o r h o o d D e v e l o p m e n t • N e i g h b o r h o o d D e v e l o p m e n t
External Funds History
Personnel Services FY12 Expenditure FY13 Expenditure FY14 Appropriation FY15 Adopted Inc/Dec 14 vs 15
51000 Permanent Employees 9,951,177 8,439,575 8,922,649 9,156,046 233,397 51100 Emergency Employees 0 0 0 0 0 51200 Overtime 0 0 0 0 0 51300 Part Time Employees 0 0 0 0 0 51400 Health Insurance 1,402,654 1,156,649 1,220,005 1,251,659 31,654 51500 Pension & Annunity 875,976 708,346 774,198 819,267 45,069 51600 Unemployment Compensation 0 0 0 0 0 51700 Workers' Compensation 0 0 0 0 0 51800 Indirect Costs 60,524 23,138 0 0 0 51900 Medicare 111,479 102,859 128,656 131,995 3,339 Total Personnel Services 12,401,810 10,430,567 11,045,508 11,358,967 313,459
Contractual Services FY12 Expenditure FY13 Expenditure FY14 Appropriation FY15 Adopted Inc/Dec 14 vs 15
52100 Communications 59,791 46,424 82,852 56,900 -25,952 52200 Utilities 57,648 134,404 124,700 124,700 0 52400 Snow Removal 3,000 1,816 0 0 0 52500 Garbage/Waste Removal 70 4,307 5,080 5,080 0 52600 Repairs Buildings & Structures 38,857 60,798 239,107 239,107 0 52700 Repairs & Service of Equipment 20,315 14,968 39,300 24,300 -15,000 52800 Transportation of Persons 27,126 31,436 66,591 68,375 1,784 52900 Contracted Services 58,737,684 53,537,922 56,114,176 58,081,491 1,967,315 Total Contractual Services 58,944,491 53,832,075 56,671,806 58,599,953 1,928,147
Supplies & Materials FY12 Expenditure FY13 Expenditure FY14 Appropriation FY15 Adopted Inc/Dec 14 vs 15
53000 Auto Energy Supplies 2,786 1,483 6,440 4,440 -2,000 53200 Food Supplies 0 0 0 0 0 53400 Custodial Supplies 667 465 1,250 1,250 0 53500 Med, Dental, & Hosp Supply 0 0 0 0 0 53600 Office Supplies and Materials 80,652 68,247 94,300 84,300 -10,000 53700 Clothing Allowance 0 0 0 0 0 53800 Educational Supplies & Mat 0 0 0 0 0 53900 Misc Supplies & Materials 19,880 9,959 13,480 12,760 -720 Total Supplies & Materials 103,985 80,154 115,470 102,750 -12,720
Current Chgs & Oblig FY12 Expenditure FY13 Expenditure FY14 Appropriation FY15 Adopted Inc/Dec 14 vs 15
54300 Workers' Comp Medical 0 0 5,000 5,000 0 54400 Legal Liabilities 0 0 0 0 0 54600 Current Charges H&I 0 0 0 0 0 54700 Indemnification 0 0 0 0 0 54900 Other Current Charges 92,595 63,477 101,784 270,056 168,272 Total Current Chgs & Oblig 92,595 63,477 106,784 275,056 168,272
Equipment FY12 Expenditure FY13 Expenditure FY14 Appropriation FY15 Adopted Inc/Dec 14 vs 15
55000 Automotive Equipment 0 0 0 0 0 55400 Lease/Purchase 0 0 0 0 0 55600 Office Furniture & Equipment 18,157 6,825 10,000 5,000 -5,000 55900 Misc Equipment 47,314 8,567 40,850 39,600 -1,250 Total Equipment 65,471 15,392 50,850 44,600 -6,250
Other FY12 Expenditure FY13 Expenditure FY14 Appropriation FY15 Adopted Inc/Dec 14 vs 15
56200 Special Appropriation 0 0 0 0 0 57200 Structures & Improvements 0 0 0 0 0 58000 Land & Non-Structure 0 0 0 0 0 Total Other 0 0 0 0 0
Grand Total 71,608,352 64,421,665 67,990,418 70,381,328 2,390,910

H o u s i n g & N e i g h b o r h o o d D e v e l o p m e n t • N e i g h b o r h o o d D e v e l o p m e n t 1 2 9
External Funds Personnel
Title Union Code
Grade Position FY15 Salary Title Union Code
Grade Position FY15 Salary
Accountant SU2 21 0.75 49,215 Innovation & Systems Manager SU2 24 0.98 89,540 Accounting Manager SU2 22 0.75 58,648 Legal Sec EXM 18 0.75 37,929 Admin Asst EXM 19 3.28 177,272 Loan Monitor SU2 19 1.50 92,907 Admin Services Manager SU2 21 0.75 54,261 Manager Of Research & Dev SU2 23 0.75 63,393 Architect SU2 21 0.97 66,612 Neighborhood Business Manager SU2 22 3.92 283,155 Asset Manager SU2 21 0.75 54,261 Network Admin SU2 22 0.75 57,149 Assistant Director EXM 26 2.40 223,014 Operations Manager EXM 25 3.98 335,930 Assoc Deputy Director EXM 28 0.75 83,107 Operations Specialist SU2 26 0.98 104,642 Asst Dir for Compliance-Loans EXM 26 0.75 71,040 Policy Advisor EXM 28 0.75 83,107 Asst Director EXM 26 5.32 489,036 Procurement Officer SU2 20 0.75 50,204 Budget Manager SU2 22 0.75 58,648 Prog Asst SU2 19 9.14 553,617 Communication Spec EXM 22 0.75 51,909 Prog Manager SU2 21 6.40 457,887 Compliance Monitor SU2 20 0.90 60,245 Program Assistant (MultiLingual) SU2 20 1.80 108,461 Compliance Officer SU2 21 0.90 65,113 Project Manager SU2 21 6.18 432,947 Computer Specialist SU2 20 1.50 100,408 Records Mngr SU2 21 0.75 54,261 Construction & Design Serv Mangr SU2 24 1.00 91,367 Secretary SU2 17 1.25 58,952 Construction Manager SU2 23 1.80 141,835 Senior Account Specialist SU2 21 0.75 54,261 Construction Specialist II SU2 21 2.00 144,696 Senior Asset Manager SU2 24 0.75 68,525 Controller EXM 27 0.75 76,837 Senior Programmer SU2 23 0.75 63,393 Contruction Specialist I SU2 20 5.78 382,464 Spec Asst (DND) EXM 25 0.75 65,680 Deputy Director EXM 27 0.50 51,225 Special Assistant EXM 22 0.75 51,909 Deputy Director EXM 29 4.90 533,526 Sr Adm Services Clerk (DND) SU2 18 0.75 42,985 Design Services Manager SU2 24 0.98 89,540 Sr Budget Manager SU2 24 0.75 68,525 Digital Cartographer SU2 22 0.75 58,648 Sr Business Manager SU2 23 0.98 82,833 Dir Marketing EXM 28 0.75 83,107 Sr Communications Spec EXM 24 0.75 60,725 Dir of Legal Unit EXM 28 0.75 83,107 Sr Compliance Officer SU2 22 0.90 70,377 Finance Manager SU2 22 0.75 58,648 Sr Housing Develop Officer SU2 24 4.85 443,130 Financial Analyst SU2 19 0.75 46,454 Sr Neigh Business Mgr SU2 24 0.98 89,540 HMIS Administrator SU2 23 1.00 84,523 Sr Program Manager SU2 23 2.58 201,577 HMIS Coordinator SU2 21 1.00 58,540 Sr Project Manager SU2 23 2.78 234,975 Housing Development Officer SU2 22 9.40 719,824 Sr Project Manager SU2 24 0.50 44,202 Housing Information Program Coordinator SU2 20 2.00 117,186 Sr Research & Devel Anylst SU2 22 0.75 52,705 Sr Staff Attorney EXM 26 0.75 62,556 Total 118 9,106,293 Adjustments Differential Payments 0 Other 60,000 Chargebacks 0 Salary Savings -10,245 FY15 Total Request 9,156,048

1 3 0 H o u s i n g & N e i g h b o r h o o d D e v e l o p m e n t • N e i g h b o r h o o d D e v e l o p m e n t
Program 1. Administration
Noah Stockman, Deputy Director , Organization 188100
Program Description The Administration Program enforces Department policies and procedures and provides support services to all Neighborhood Development programs to
ensure the effective completion of departmental goals in compliance with City, State and Federal laws and regulations.
Operating Budget Actual '12 Actual '13 Approp '14 Budget '15
Personnel Services 663,118 1,197,381 1,305,319 1,211,078 Non Personnel 187,689 340,266 357,866 392,151
Total 850,807 1,537,647 1,663,185 1,603,229

H o u s i n g & N e i g h b o r h o o d D e v e l o p m e n t • N e i g h b o r h o o d D e v e l o p m e n t 1 3 1
Program 2. Real Estate Management & Sales
Donald Wright, Manager , Organization 188200
Program Description The Real Estate Management & Sales Program works to manage disposal of foreclosed land parcels and foreclosed buildings as quickly as possible, and in a
manner that generates revenue for the City and provides benefits to the community.
Operating Budget Actual '12 Actual '13 Approp '14 Budget '15
Personnel Services 718,443 636,383 981,865 996,840 Non Personnel 1,019,428 721,021 812,524 810,874
Total 1,737,871 1,357,404 1,794,389 1,807,714
Performance
Strategy: To dispose of tax-foreclosed and surplus property.
Performance Measures Actual '12 Actual '13 Projected '14 Target '15
City-owned buildings sold, transferred, or demolished 24 8 11 9
City-owned land parcels sold or transferred 52 25 100 73Square footage made available to small builders for middle class housing 243,768 500,000
Total city-owned buildings 48 47 42 35Total city-owned land parcels 1,388 1,377 1,308 1,169
Strategy: To manage tax-foreclosed and surplus property.
Performance Measures Actual '12 Actual '13 Projected '14 Target '15
Units of service performed to clean, fence, and/or maintain vacant city-owned parcels 3,942 2,814 2,434 2,776

1 3 2 H o u s i n g & N e i g h b o r h o o d D e v e l o p m e n t • N e i g h b o r h o o d D e v e l o p m e n t
Program 3. Housing Development
Theresa Gallagher, Manager , Organization 188300
Program Description The mission of this program is to strengthen Boston neighborhoods by working with community groups to improve the economic, housing and physical
environment of the neighborhoods. This is accomplished through increasing homeownership and housing investment, strengthening neighborhood real
estate markets and improving neighborhood confidence. This program will emphasize homeownership development, affordable rental housing production,
elderly housing and streamlining the funding process through the use of competitive funding rounds. There continues to be a need for the City to direct
federal and City resources toward the development of affordable housing.
Operating Budget Actual '12 Actual '13 Approp '14 Budget '15
Personnel Services 889,206 764,563 529,123 537,054 Non Personnel 39,237 26,520 11,416 11,416
Total 928,443 791,083 540,539 548,470
Performance
Strategy: To assist existing homeowners in retaining their homes and to encourage homeownership.
Performance Measures Actual '12 Actual '13 Projected '14 Target '15
3D properties completed 62 64 85
Housing units repaired/rehabbed with homeowner loan/grant including lead paint abatement
1,902 2,485 2,116 2,326
New homebuyers provided with financial assistance 61 65 96 120
Strategy: To assist tenants and landlords to preserve their tenancies or secure alternative housing, including those at risk of homelessness.
Performance Measures Actual '12 Actual '13 Projected '14 Target '15
Total residential foreclosure petitions (owner occupied) 526 320 118 88
Strategy: To provide shelter, support services, rental assistance, and housing counseling to homeless persons, persons with AIDS, and tenants at risk.
Performance Measures Actual '12 Actual '13 Projected '14 Target '15
Homeless households served 5,110 4,443 4,846 4,400Persons with AIDS provided with housing assistance and/or support services 975 990 1,069 925

H o u s i n g & N e i g h b o r h o o d D e v e l o p m e n t • N e i g h b o r h o o d D e v e l o p m e n t 1 3 3
Program 4. Business Services
Rafael Carbonell, Manager , Organization 188500
Program Description The Neighborhood Business Services Program works to develop and preserve economically viable and attractive businesses in Main Street districts and
other neighborhood business districts, to create jobs, and increase the City’s tax base.
Operating Budget Actual '12 Actual '13 Approp '14 Budget '15
Personnel Services 81,810 161,974 90,461 85,425 Non Personnel 33,795 27,743 34,620 456,656
Total 115,605 189,717 125,081 542,081
Performance
Strategy: To create jobs and help open new businesses.
Performance Measures Actual '12 Actual '13 Projected '14 Target '15
Jobs created through all OBD programs 1,269 1,243 1,029 1,280New businesses opened with financial or technical assistance 177 136 147 240
Strategy: To enhance Boston Main Streets.
Performance Measures Actual '12 Actual '13 Projected '14 Target '15
Participants in Women on Main Initiative 334 375
Strategy: To improve business assistance tools and services.
Performance Measures Actual '12 Actual '13 Projected '14 Target '15
Businesses added to the Boston Buying Power program 850 691 943 850
Storefronts improved 123 116 121 120
Strategy: To improve customer service for businesses.
Performance Measures Actual '12 Actual '13 Projected '14 Target '15
Businesses assisted with financial or technical assistance 3,000 2,530 3,173 4,180

1 3 4 H o u s i n g & N e i g h b o r h o o d D e v e l o p m e n t • N e i g h b o r h o o d D e v e l o p m e n t
External Funds Projects
ARRA - CDBG
Project Mission The Community Development Block Grant (CDBG-R) program under ARRA enabled local governments to undertake a wide range of activities intended to create suitable living environments, provide decent affordable housing and create economic opportunities, primarily for persons of low and moderate income. The City of Boston allocated all CDBG-R funds for housing development, economic development, and construction and public facilities. All of these activities met the national objective of providing a benefit (housing, jobs, or services) to low and moderate-income persons or areas. CDBG-R was a three-year grant totaling $5,366,011 that started on 6/5/2009 and ended on 9/30/2012.
ARRA - Homeless Prevention and Rapid Re-housing Program
Project Mission The Homelessness Prevention and Rapid Re-housing Program (HPRP) under ARRA provided financial assistance and services to prevent individuals and families from becoming homeless and help those who are experiencing homelessness to be quickly re-housed and stabilized. The funds under this program targeted individuals and families who would be homeless but for this assistance. The funds provided short-term or medium-term rental assistance and housing relocation and stabilization services, including mediation, credit counseling, security or utility deposits, utility payments, moving cost assistance, and case management. At least 60 percent of funds had to be spent within two years and all funds had to be spent within three years. HPRP was a three-year grant totaling $8,209,151 that started on 7/22/2009 and ended on 7/21/2012.
ARRA – Neighborhood Stabilization Program
Project Mission The ARRA Neighborhood Stabilization Program grant was made available to Boston and several other direct grant communities on a competitive basis from the US Department of Housing and Urban Development. The NSP initiative was created as part of the "Housing and Economic Recovery Act of 2009" designed to boost local economies through the provision of resources to purchase and rehab foreclosed homes. This was the second round of NSP funding in the amount of $13.6M for the purpose of expanding the City’s existing strategies of foreclosure prevention and reclamation efforts. Specifically, this funding allowed the City to support responsible redevelopment of foreclosed homes in those neighborhoods most burdened by Boston's bank-owned properties, namely Dorchester, East Boston, Roxbury, Hyde Park, and Mattapan. ARRA NSP was a three year grant totaling $13,610,343 that started on 2/11/2010 and ended 2/10/2013, however any program income received may continue to be expended.
Abandoned Property Rehab Grant
Project Mission Abandoned Property Rehab Grant was a three year grant from the Commonwealth of Massachusetts’ Attorney General’s Office targeted to promote the rehabilitation of distressed/abandoned properties in high-foreclosure areas of Boston that cannot be rehabilitated through other means being implemented by the City. This was a three year grant totaling $150,000 that started on 1/4/2010 and ended on 12/31/2013.
BRA/HODAG Program Income
Project Mission The BRA/HODAG Program is program income generated from a HODAG loan the BRA made to the Douglas Housing Plaza Phase I Development. The funds totaling $4,297,327 will be used to help fund the City’s housing development pipeline in FY14 and FY15.

H o u s i n g & N e i g h b o r h o o d D e v e l o p m e n t • N e i g h b o r h o o d D e v e l o p m e n t 1 3 5
Brownfields Economic Development Initiative
Project Mission The purpose of the Brownfields Economic Development Initiative (BEDI) is to spur the return of Brownfields to productive economic use through financial assistance to public entities and enhance the security or improve the viability of a project financed with Section 108 guaranteed loan authority. BEDI grants must be used in conjunction with a new Section 108 guaranteed loan commitment. The most recent BEDI grant was used to promote the remediation and redevelopment of the former Modern Electroplating Brownfields site, with a portion of the funding being used to pay environmental monitoring at the Dudley Police Station. The grant totaling $1,750,000 started on 6/9/2008 and ends on 8/30/2017.
Choice Neighborhoods Implementation Grant
Project Mission The Choice Neighborhood Implementation Grant is a competitive grant from the US Department of Housing and Urban Development. The grant is being used to redevelop the Woodledge/Morrant Bay Apartments and revitalize Dorchester’s Quincy Street Corridor. The grant also aims to link affordable housing with quality schools, public transportation, good jobs, and safe streets thus totally transforming the neighborhood. The grant totaling $20,500,000 started on 1/12/2012 and ends on 9/30/2017.
Community Challenge Planning Grant
Project Mission The Community Challenge Grant is a competitive grant from the US Department of Housing and Urban Development. The grant is being used for planning, strategic land acquisition, and for outreach & engagement in order to facilitate smart growth and transit-oriented development along the Fairmount Commuter Rail Line in conjunction with four new train stations and improvements to existing stations. The grant totaling $1,865,160 started on 2/15/2012 and ends on 2/14/2015.
Community Development Block Grant
Project Mission The Community Development Block Grant (CDBG) is an annual entitlement grant from the U.S. Department of Housing and Urban Development to the City of Boston designed to fund a variety of neighborhood development activities. At least 70 percent of CDBG funds must be used to benefit low- and moderate-income households. CDBG funds are used to produce and preserve affordable housing, revitalize neighborhood commercial districts, assist the renovation of non-profit facilities, improve vacant lots, promote and monitor fair housing activities, and assist non-profit organizations in the operation of emergency shelters, health care, child care, youth and adult literacy programs. CDBG funds cannot be used for general government services nor to replace funding cuts from existing public service activities. The CDBG awards for FY12, FY13, and FY14 were $17,496,605; $15,926,397; and $16,834,371 respectively. The FY15 award is projected to be $16,390,443.
Continuum of Care
Project Mission The Continuum of Care program combines the previously stand-alone Supportive Housing and Shelter Plus Care programs into one annual competitive grant program from the US Department of Housing and Urban Development (HUD). The purpose of the program is to assist individuals and families experiencing homelessness and to provide the services needed to help such individuals move into transitional and permanent housing, with the goal of long term stability. Specifically, the program helps develop housing and related supportive services for people moving from homelessness to independent living and provides rental assistance that, when combined with social services, provides supportive housing for homeless people with disabilities and their families. The Supportive Housing awards in FY12 and FY13 were $13,658,930 and $14,313,384 respectively. The Shelter Plus Care awards in FY12 and FY13 were $6,821,160 and $6,922,116 respectively. The newly combined Continuum of Care award in FY14 was $23,540,567 and is projected to be $22,363,539 in FY15.

1 3 6 H o u s i n g & N e i g h b o r h o o d D e v e l o p m e n t • N e i g h b o r h o o d D e v e l o p m e n t
Economic Development Initiative
Project Mission The Economic Development Initiative (EDI) Program is a special HUD program that makes available grants to cities to spur economic opportunity by creating jobs, attracting private partnerships, and training residents for new job opportunities; to promote community development through a long-term economic development strategy; to establish community-based partnerships; and to develop a plan for responding to community needs by integrating economic, physical, human, and other strategies. EDI must be used in conjunction with loans guaranteed under the Section 108 Program to enhance the feasibility of economic development and revitalization projects financed with Section 108 Loan Guarantee funds.
Emergency Solutions Grant
Project Mission Formerly the Emergency Shelter Grant, the Emergency Solutions Grant (ESG) is an annual entitlement grant to the City of Boston from the U.S. Department of Housing and Urban Development. It is used to assist individuals and families to quickly regain stability in permanent housing after experiencing a crisis or homelessness. The ESG awards for FY12, FY13, and FY14 were $1,346,620; $1,515,160; and $1,161,878 respectively. The FY15 award is projected to be $1,367,603.
EPA/Brownfields
Project Mission The U.S. Environmental Protection Agency makes Brownfield Assessment and Clean-up grants available on a competitive basis. These grants are used to evaluate and/or clean-up contamination at EPA-eligible Brownfield sites. Brownfields are defined as real property, expansion, redevelopment, or re-use of which may be complicated by the presence or the potential presence of a hazardous substance, pollutant, or contaminant. In FY13, the City was awarded a clean-up grant to abate the future development site known as Jackson Commons. In FY14, assessment grant funds were used to assess environmental conditions on parcels abutting or near the Fairmount-Indigo Commuter Rail line. The three-year grant totaling $400,000 started on10/1/2010 and ended on 9/30/2013.
Green Affordable Housing Initiative (MTC)
Project Mission The Green Affordable Housing Initiative (MTC) was a multi-year grant awarded to the City of Boston from the Renewable Energy Trust, which is administered by the Massachusetts Technology Collaborative (MTC). These funds were used to benefit the occupants of affordable housing in the City of Boston through the development of green affordable housing, which incorporates renewable energy, energy efficiency, green design and healthy home construction techniques into the City’s affordable housing programs. The grant totaling $2,000,000 started on 4/11/2007 and ended on 3/1/2012.
Home Investment Partnership (HOME)
Project Mission The HOME Partnership Program is an annual entitlement grant from the U.S. Department of Housing and Urban Development (HUD) to the City of Boston to support the development of affordable housing. Eligible activities include new construction or rehabilitation of housing, tenant-based rental assistance for up to two years, and assistance to first-time homebuyers. All HOME funds must be used to benefit low and moderate income households. Fifteen percent of HOME funds are set aside for Community Housing Development Organizations. HOME grants are five years in duration. The Home awards in FY12, FY13, and FY14 were $7,530,644; $4,090,712; and $4,418,285 respectively. The FY15 award is projected to be $4,524,340.
HomeCorp
Project Mission Homecorp is a grant from the Commonwealth of Massachusetts Attorney General’s Office. The purpose of the funding is to help the City mitigate the impact of the foreclosure crisis, revitalize distressed neighborhoods that have suffered the impact of foreclosure clusters, and to promote homeownership and affordable housing. The HomeCorp awards totaling $495,000 began on 9/21/2012 and ends on 09/30/2014.

H o u s i n g & N e i g h b o r h o o d D e v e l o p m e n t • N e i g h b o r h o o d D e v e l o p m e n t 1 3 7
HOPWA
Project Mission The Housing Opportunities for People with AIDS (HOPWA) Program is a three year grant awarded annually from the U.S. Department of Housing and Urban Development to the City of Boston. The program is designed to provide affordable, appropriate housing for people with AIDS (PWAs) in the metropolitan Boston area. Eligible activities include housing, counseling, housing development, rental assistance, technical assistance, homelessness prevention, operating costs including support services, and housing-related costs. DND will be directing these funds to three primary activities: metropolitan-area housing counseling to help PWAs find/retain affordable housing, technical assistance to developers of housing for PWAs, and emergency assistance payments to help PWAs retain their existing housing. The HOPWA awards in FY12, FY13, and FY14 awards were $1,884,046; $1,878,288; and $2,087,647 respectively. The FY15 award is projected to be $2,245,539.
Lead Paint Abatement
Project Mission The Lead Paint Abatement grant is a competitive 36-month grant from the U.S. Department of Housing and Urban Development’s Office of Healthy Homes and Lead Hazard Control to the City of Boston. The purpose of the grant is to reduce the exposure of young children to lead-based paint hazards in their homes through intensive services consisting of counseling, outreach and abatement in the high-risk target areas of Dorchester, Roxbury and Mattapan and to provide financing services citywide. Activities include abatement, inspections, risk assessments, and temporary relocations. The grant awarded in FY12 totaling $2,475,000 started on 10/1/2011 and ends on 10/31/2014. The grant awarded in FY14 totaling $2,500,000 started on 8/1/2013 and ends 10/31/2016.
Neighborhood Development Fund
Project Mission The Neighborhood Development Fund receives revenue from the repayment of Urban Development Action Grant (UDAG) loans to the City. Funds can be used for eligible HUD Title I activities which are somewhat less restrictive than CDBG regulations.
Neighborhood Stabilization Program (Federal Funds)
Project Mission Neighborhood Stabilization Program (NSP) was a non-competitive grant awarded to eligible cities from the US Department of Housing and Urban Development. Funds were used to establish financial mechanisms for purchase and redevelopment of foreclosed homes and residential properties. Such mechanisms included soft-seconds, loan loss reserves, and shared-equity loans for low and moderate income homebuyers; purchase and rehabilitation of homes and residential properties that were abandoned or foreclosed upon in order to sell, rent, or redevelop such homes as properties; establish land banks for homes that were foreclosed upon; demolish blighted structures; and redevelop demolished or vacant properties. NSP funds were to be committed within 18 months of the grant start date and all funds had to be spent within three years. The grant totaling $4,230,191 started on 03/09/2009 and ended on 03/08/2013.
Neighborhood Stabilization Program (State Funds)
Project Mission Neighborhood Stabilization Program grants were made available to Boston and several other direct grant communities on a non-competitive basis from the Massachusetts Department of Housing and Community Development. The Commonwealth of Massachusetts agreed to match Boston’s HUD NSP funds $1-$1 and NSP admin funds $0.50-$1. Funds were used to establish financial mechanisms for purchase and redevelopment of foreclosed homes and residential properties. Such mechanisms included soft-seconds, loan loss reserves, and shared-equity loans for low and moderate income homebuyers; purchase and rehabilitation of homes and residential properties that were abandoned or foreclosed upon in order to sell, rent, or redevelop such homes as properties; establish land banks for homes that were foreclosed upon; demolish blighted structures; and redevelop demolished or vacant properties. The first NSP State grant totaling $4,020,500 started date on 07/20/2009 and ended on 03/31/2013. A second NSP State grant totaling $999,999 started on 08/11/2011 and ended on March 31, 2014.

1 3 8 H o u s i n g & N e i g h b o r h o o d D e v e l o p m e n t • N e i g h b o r h o o d D e v e l o p m e n t
Regional Foreclosure Education Grant (COM)
Project Mission The Regional Foreclosure Education grant from the Commonwealth of Massachusetts supported the expansion of foreclosure counseling providers under contract with the City of Boston. These providers served geographic areas of Boston with high rates of default and foreclosures targeting occupants of 1-4 unit properties. The grant totaling $143,096 started on 4/11/2013 and ended on 9/30/2013.
Regional Network Innovations to End Homelessness
Project Mission The Regional Network Innovations to End Homelessness grants were made available to the Boston Regional Network from the Massachusetts Interagency Council on Housing and Homelessness through the Department of Housing and Community Development on a competitive basis. Grant funds were used for implementing innovative strategies that inform new and emerging statewide housing approaches to ending homelessness. The grant totaling $1,746,898 started on 5/14/2009 and ended on 6/30/2011.
Section 108 Loan Guarantee Programs/Section 108 Unrestricted
Project Mission Section 108 funds are available to eligible cities from the U.S. Department of Housing and Urban Development (HUD) on an application basis. Section 108 funds are secured by the City through a pledge of its current and future CDBG grant awards. These funds are used for economic development projects. The Boston Invests in Growth Loan Fund is a $40 million HUD Section 108 funded loan pool designed to jumpstart well-financed construction projects, create jobs, and strengthen Boston’s economy. This program is designed for large commercial projects in Boston that have both permanent financing and equity in place. Boston Invests will finance the gap that remains between the financing and equity and the total project cost, known as mezzanine financing. In addition, up to 10% of the loan pool will be set aside for smaller neighborhood based projects of at least 5,000 square feet, the underwriting criteria for which will be the same as for the larger loans but the interest rate charged as well as the additional interest paid at the end will be lower. Additionally, $2.5 million HUD Section 108 funded loan pool will be used for energy efficiency and to promote job creation. The Section 108 Spread Unrestricted Fund is income earned as a result of the interest spread between Section 108 loan repayments owed to DND by its borrowers and Section 108 repayments DND owes to HUD. In FY15, DND will use this source to fund Main Streets districts and Restore projects that do not meet CDBG eligibility requirements.
Triple Decker Initiative
Project Mission The Triple-Decker Initiative is supported by funds from the Boston Redevelopment Authority. The program funds Neighborhood Development's 3D Advantage Program which facilitates the owner-occupant purchases of triple-deckers and the 3D HELP program which supports the renovation and energy retrofitting of owner-occupied triple-deckers. The Triple Decker awards in FY13 and FY14 were $375,000 and $300,000 respectively. The FY15 award is projected to be $225,000.
H o u s i n g & N e i g h b o r h o o d D e v e l o p m e n t • N e i g h b o r h o o d D e v e l o p m e n t 1 3 9
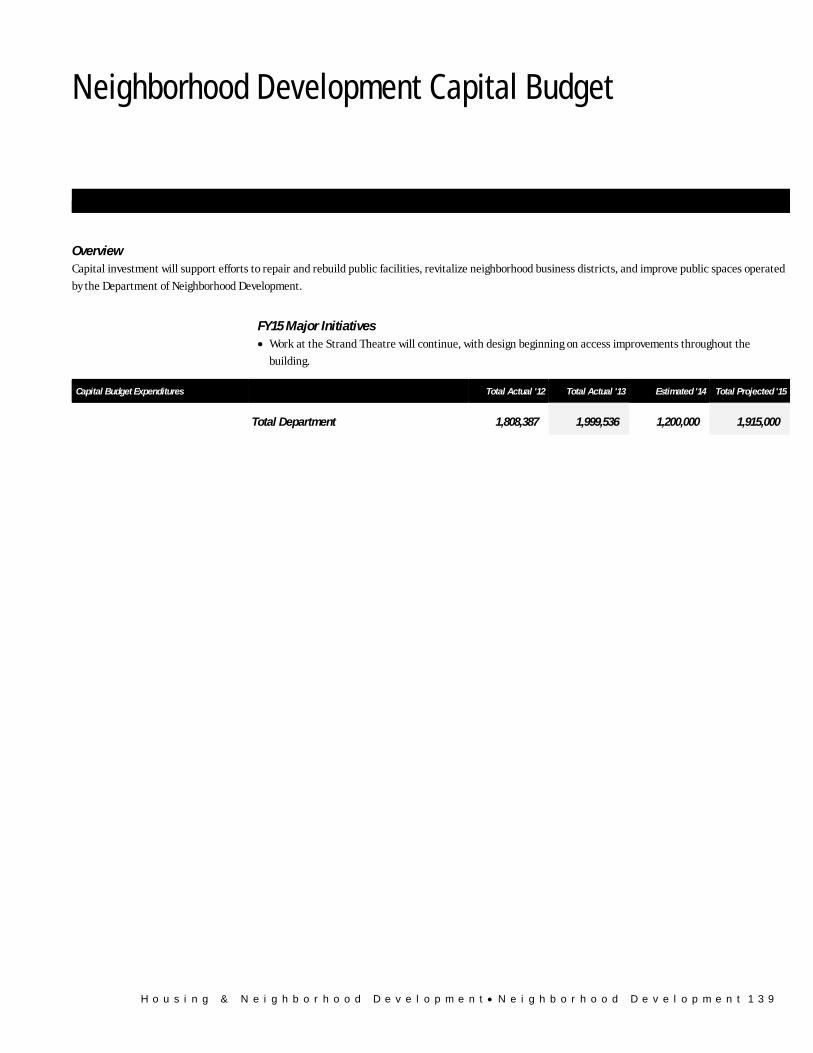
Neighborhood Development Capital Budget
Housing & Neighborhood Development Neighborhood Development
Overview Capital investment will support efforts to repair and rebuild public facilities, revitalize neighborhood business districts, and improve public spaces operated
by the Department of Neighborhood Development.
FY15 Major Initiatives • Work at the Strand Theatre will continue, with design beginning on access improvements throughout the
building.
Capital Budget Expenditures Total Actual '12 Total Actual '13 Estimated '14 Total Projected '15
Total Department 1,808,387 1,999,536 1,200,000 1,915,000

1 4 0 H o u s i n g & N e i g h b o r h o o d D e v e l o p m e n t • N e i g h b o r h o o d D e v e l o p m e n t
Neighborhood Development Project Profiles
PROPERTY DEMOLITION Project Mission Demolish three priority buildings in DND's portfolio including 65 East Cottage Street, 71-79 Intervale Street and 174
West Second Street. Managing Department, Neighborhood Development Status, New Project Location, Various neighborhoods Operating Impact, No
Authorizations
Source Existing FY15 FutureNon Capital
Fund Total City Capital 0 0 0 0 0 Grants/Other 0 1,750,000 0 0 1,750,000 Total 0 1,750,000 0 0 1,750,000
Expenditures (Actual and Planned)
Source Thru
6/30/13 FY14 FY15 FY16-19 Total City Capital 0 0 0 0 0 Grants/Other 0 0 1,750,000 0 1,750,000 Total 0 0 1,750,000 0 1,750,000
STRAND THEATER ACCESSIBILITY Project Mission Improve accessibility throughout the theatre, including the installation of an elevator; fire protection improvements. Managing Department, Capital Construction Status, New Project Location, Dorchester Operating Impact, No
Authorizations
Source Existing FY15 FutureNon Capital
Fund Total City Capital 0 200,000 1,300,000 0 1,500,000 Grants/Other 0 0 0 0 0 Total 0 200,000 1,300,000 0 1,500,000
Expenditures (Actual and Planned)
Source Thru
6/30/13 FY14 FY15 FY16-19 Total City Capital 0 0 165,000 1,335,000 1,500,000 Grants/Other 0 0 0 0 0 Total 0 0 165,000 1,335,000 1,500,000