housing and economic growth options findings report · housing and economic growth options findings...
TRANSCRIPT

Housing and economic growth options
Findings report
Peter Brett Associates
June 2018
Office Address:
33 Bowling Green Lane, Clerkenwell, London EC1R 0BJ
T: +44 (0)203 824 6600 E: [email protected]
ii
Project Ref 43091
Name Position Signature Date
Prepared by Joanna Lee
Cathy Hall
Associate
Senior Associate JL/CMH June 2018
Reviewed by Cathy Hall Senior Associate CMH June 2018
Approved by Cristina Howick Partner CH June 2018
For and on behalf of Peter Brett Associates LLP
Peter Brett Associates LLP disclaims any responsibility to the client and others in respect of any matters outside the scope of this report. This report has been prepared with reasonable skill, care and diligence within the terms of the contract with the client and taking account of the manpower, resources, investigations and testing devoted to it by agreement with the client. This report has been prepared for the client and Peter Brett Associates LLP accepts no responsibility of whatsoever nature to third parties to whom this report or any part thereof is made known. Any such party relies upon the report at their own risk.
© Peter Brett Associates LLP 2018
THIS REPORT IS FORMATTED FOR DOUBLE-SIDED PRINTING

Housing and economic growth options
Findings report
June 2018 iii
CONTENTS
1 INTRODUCTION .......................................................................................................... 1
2 POLICY AND EVIDENCE BASE CONTEXT ............................................................... 2
National planning policy context ................................................................................... 2
The Northumberland policy and evidence context ........................................................ 4
Summary .....................................................................................................................12
3 NORTHUMBERLAND’S ECONOMY ..........................................................................13
Introduction .................................................................................................................13
Northumberland’s current economic strategy ..............................................................14
Borderlands Initiative ...................................................................................................17
Summary .....................................................................................................................18
4 ECONOMIC GROWTH SCENARIOS .........................................................................20
Introduction .................................................................................................................20
Business as usual growth ............................................................................................20
Developing the alternative growth scenarios ...............................................................23
Alternative scenarios ...................................................................................................27
5 EMPLOYMENT LAND IMPLICATIONS ......................................................................31
Introduction .................................................................................................................31
Losses and gains of employment land.........................................................................33
Demand and supply balance .......................................................................................33
Future allocations ........................................................................................................35
6 HOUSING NEED IMPLICATIONS ..............................................................................37
Introduction .................................................................................................................37
Jobs and housing ........................................................................................................39
Need and target under the new system .......................................................................39
7 SUMMARY OF FINDINGS ..........................................................................................41
TABLES
Table 2.1 Net additional dwellings in Northumberland 2014-17 ............................................. 7
Table 3.1 Northumberland’s priority projects ........................................................................18
Table 4.1 Northumberland business as usual forecast .........................................................21
Table 4.2 Business as usual workforce jobs growth in Northumberland and in the LEP
(thousands) ..........................................................................................................................24
Table 4.3 Attributing the growth between sectors .................................................................26
Housing and economic growth options
Findings report
June 2018 iv
Table 4.4 Jobs-led scenarios ................................................................................................28
Table 4.5 Jobs by sector for the jobs-led scenarios (000s) ...................................................30
Table 5.1 Job growth by B and non-B Class, by scenario (2014-36).....................................31
Table 5.2 Employment land demand for each scenario ........................................................32
Table 5.3 Market balance (sqm) (2014-36) ...........................................................................34
Table 5.4 Market balance (ha) (2014-36)..............................................................................34
Table 6.1 Housing need under each scenario ......................................................................39
Table 7.1 Workforce job growth in Northumberland (000s) by scenario ................................42
Table 7.2 Employment requirements and housing need by scenario ....................................42
FIGURES
Figure 2.1 Northumberland age profile 2011-31 .................................................................... 5
Figure 2.2 Old age dependency ratio change ........................................................................ 6
Figure 2.3 Distribution of businesses in Northumberland ....................................................... 8
Figure 2.4 Take up and loss of allocated employment land 1999-2016 ................................11
Figure 3.1 Northumberland location quotient (sector representation compared to UK, with
sector size indicating employee numbers) ............................................................................13
Figure 3.2 Northumberland’s economic areas ......................................................................15
Figure 3.3 Northumberland’s Growth Network and Investment Zone ....................................16
Figure 4.1 Workforce jobs in Northumberland and NELEP 1997-2014 .................................25
Figure 4.2 Workforce job growth in each scenario ................................................................27
APPENDICES
APPENDIX A NPPF AND PPG SUMMARY
APPENDIX B BUSINESSES IN NORTHUMBERLAND
APPENDIX C ECONOMIC STRATEGIES
APPENDIX D RURAL ECONOMY AND RELATIONSHIP WITH THE SECTORS
APPENDIX E BUSINESS AS USUAL SCENARIO
APPENDIX F NORTHUMBERLAND’S RURAL ECONOMY
APPENDIX G AMBITIOUS GROWTH SCENARIO
APPENDIX H INTERMEDIATE GROWTH SCENARIO
APPENDIX I SECTORS TO USE CLASSES
APPENDIX J EMPLOYMENT DENSITIES AND PLOT RATIOS
APPENDIX K SUB-COUNTY FINDINGS
Housing and economic growth options
Findings report
June 2018 1
1 INTRODUCTION
1.1 This study, commissioned by Northumberland County Council, is part of the evidence
base that will inform targets (requirements) for housing and employment land in its
emerging Local Plan for the period 2016 to 2036. It develops and then considers the
implications in terms of both housing and employment land of several different
economic futures for Northumberland over the plan period 2016-36. The study will
inform a refresh of the Council’s economic strategy.
1.2 This study takes account of the draft planning reform package issued by the
Government on 5 and 9 March 2018. On 5 March, the Government issued a
consultation draft of revisions to the National Planning Policy Framework (NPPF).
Subsequently, they issued a draft of revisions to the Planning Practice Guidance
(PPG). The 5 March announcements also confirm that there has been further
slippage in the Government’s planning reform timetable. The announcements imply
that the revised NPPF will apply to plans submitted after January 2019. As the
Northumberland Local Plan is expected to be submitted in 2019, it is likely that the
new NPPF will apply to it.
1.3 Below, Section 2 provides a brief overview of Northumberland’s planning and
economic context, including a review of the evidence base documents that remain
relevant to this study. Section 3 considers economic futures, providing three
alternative forecasts of jobs and output growth. Section 4 translates the forecasts into
employment land demand and draws implications for the Local Plan. Section 5
translates the forecasts into housing demand, and again draws implications for the
Local Plan. Section 6 summarises our conclusions.
1.4 In addition, Appendix J provides sub-county level analysis with reference to the
overall findings of the report.
Housing and economic growth options
Findings report
June 2018 2
2 POLICY AND EVIDENCE BASE CONTEXT
National planning policy context
2.1 Since the publication of the National Planning Policy Framework (NPPF) in 2012 and
the subsequent publication of the Planning Practice Guidance (PPG) in 2014,
planning for housing and employment needs has followed a broadly standard
method. A summary of this is provided at Appendix A.
2.2 However, in February 2017 the then-Department of Communities and Local
Government (now Ministry for Housing, Communities and Local Government -
MHCLG) announced in the housing white paper1 that they would be revising the
NPPF; a draft document was published in March 2018. This includes revisions on
both housing and economic development policies.
Economic development
2.3 While the changes are primarily focused on housing, there are some shifts on
economic development policy of particular relevance to Northumberland. There are
now cross-references to the Government’s Industrial Strategy (2017), and also the
need for greater integration between planning policy and economic development
strategies, particularly Local Industrial Strategies with a ‘clear economic vision’. This
goes on to state that planning policies should:
¡ ‘set criteria, or identify strategic sites, for local and inward investment to match the
strategy and to meet anticipated needs over the plan period (including making
provision for clusters or networks of knowledge driven, creative or high technology
industries)
¡ seek to address potential barriers to investment, such as inadequate
infrastructure, services or housing, or a poor environment
¡ be flexible enough to accommodate needs not anticipated in the plan, allow for
new and flexible working practices (such as live-work accommodation), and to
enable a rapid response to changes in economic circumstances’2
2.4 The current version of the NPPF had an explicit paragraph (22) setting out that policy
should ‘avoid the long term protection of sites allocated for employment use where
there is no reasonable prospect of a site being used for that purpose’. This
paragraph is no longer within the economic development section of the revised
NPPF; however, there a wider-reaching paragraph which extends to all allocations for
any use that is of relevance, the plan-making elements of which are set out below:
‘Planning policies and decisions need to reflect changes in the demand for land.
They should be informed by regular reviews of both the land allocated for
1 https://www.gov.uk/government/uploads/system/uploads/attachment_data/file/590464/Fixing_our_broken_housing_market_-_print_ready_version.pdf 2 Para. 83

Housing and economic growth options
Findings report
June 2018 3
development in plans, and of land availability. Where the local planning authority
considers there to be no reasonable prospect of an application coming forward
for the use allocated in a plan:
a) they should, as part of plan reviews, reallocate the land for a more deliverable
use that can help to address identified needs (or, if appropriate, deallocate a site
which is undeveloped)’ (para. 120)
2.5 While the intention of the policy may be similar to the wording within the NPPF, it is
worth flagging the drafting is loose. Notably, there being a ‘reasonable prospect of an
application’ does not equate to a ‘reasonable prospect of a site being used for that
purpose’.
2.6 A new section on the rural economy (paras 84 and 85) has been introduced which
underlines the need for policy to enable growth and expansion of businesses in rural
areas, the development and diversification of agricultural businesses, and to support
appropriate tourism and leisure developments in rural areas. This could include
allocations outside existing settlement boundaries to meet needs.
Housing needs
2.7 In advance of publishing the draft revisions to the NPPF, MHCLG undertook
consultation in September 2017 on further measures set out in the housing white
paper to boost housing supply in England; this included a standard method for
calculating local authorities’ housing need. This standard method has been carried
forward into the draft NPPF and associated draft revisions to the PPG.
2.8 If taken forward into the revised NPPF, which is expected to be published in late July
2018, this standard method will replace the existing PPG-derived method which is
explained in Appendix A and which underpinned the approach taken in
Northumberland’s 2015 Strategic Housing Market Assessment. It is therefore highly
material to this study and is likely to form the basis against which a plan will be
tested.
2.9 The draft revisions to the PPG sets out that while the standard method to calculating
need can be applied to the whole plan period, LPAs are required to review their plans
every five years to ensure they remain up to date. It is relevant to note that:
‘Plan-making authorities should not apply constraints to the overall assessment
of need. Limitations including supply of land, capacity of housing markets,
viability, infrastructure, Green Belt or environmental designations, are
considerations when assessing how to meet need. These types of considerations
are not relevant to assessing the scale of that need.’ (p.25)
2.10 The draft PPG includes provisions for identifying need in excess of that derived from
the standard method which is referred to as ‘the minimum starting point’. It goes on
to state that:
‘Where it is likely that additional growth (above historic trends identified by
household projections) will occur over the plan period, an appropriate uplift may
be applied to produce a higher need figure that reflects that anticipated growth.
Housing and economic growth options
Findings report
June 2018 4
Circumstances where an uplift will be appropriate include, but are not limited to;
where growth strategies are in place, strategic level infrastructure improvements
are planned, funding is in place to promote and facilitate growth (i.e. Housing
Deals, Housing Infrastructure Fund). In these circumstances, the local housing
need figure can be reflected as a range, with the lower end of the range being as
a minimum the figure calculated using the standard method. Where an alternative
approach identifies a need above the local housing need assessment method,
the approach will be considered sound, unless there are compelling reasons to
indicate otherwise.’ (p.26)
2.11 It is in this context, as well as the provisions set out in Appendix A on the alignment of
jobs and housing under the current NPPF, that this study models a number of
different economic futures for Northumberland and considers what the implications of
these would be for housing need and employment land.
The Northumberland policy and evidence context
2.12 The Council reached an advanced stage in preparing a Core Strategy, submitting it
for examination in April 2017. However, following the May 2017 local elections, the
decision was taken in July 2017 to withdraw the document and review certain
elements, including the housing and employment numbers.
2.13 Despite its withdrawal, several evidence base documents which informed the
document remain relevant to this study. We discuss these briefly below. However,
we do not discuss the Strategic Housing Market Assessment (SHMA) (2015, Arc4)
and the Long-term Economic Sector Forecasts and Land Requirement Forecasts
(2014, St Chad’s) because the relevant elements3 of those documents have been
superseded following the publication of new official population and household
projections and updated economic forecasts.
2.14 The SHMA followed the method set out in the PPG and summarised at Appendix A .
However, because we expect the revised NPPF and guidance to be in place by the
time Northumberland’s plan progresses, we do not revisit this in the study.
Furthermore, that study is underpinned by now superseded population projections.
That said, it is relevant to review population change in Northumberland as this has
implications for both housing need and labour supply.
Population change in Northumberland
2.15 The latest 2014-based sub-national population projections were published in May
20164. These were then followed by the 2014-based sub-national household
projections, published by the Department of Communities and Local Government
(now the Ministry of Housing, Communities and Local Government, MHCLG), in
3 Other elements of the SHMA, for example housing size and tenure, may continue to be relied upon but they do not inform this study. 4 2014-based Sub-National Population Projections published by the Office for National Statistics (‘SNPP 2014’)
Housing and economic growth options
Findings report
June 2018 5
August 2016. On the Council’s behalf, these projections were tested in line with the
current PPG by Edge Analytics5 as a ‘sense check’ the objectively assessed housing
need identified in the 2015 SHMA for the then-emerging Core Strategy for the period
2011-316.
2.16 With reference to the official projections, the age structure of Northumberland’s
current and future population is very relevant to understanding the potential for and
implications of economic growth in the county, because of what it means for the
county’s labour force. The figure below, taken from the 2017 study clearly shows that
by 2031, most growth is in those aged 65 and above, while below that age, decline is
projected.
Figure 2.1 Northumberland age profile 2011-31
Source: Edge, 2017 (p.27)
2.17 Edge conclude that ‘these changes to the age structure of the population will have an
important impact upon Northumberland’s ability to sustain its labour force under
current economic participation and commuting conditions’7. The figure below updates
this analysis for the period relevant to this study but makes the same point: while
5 Northumberland Demographic Analysis and Forecasts (March 2017 6 The new plan for Northumberland will be based on the period 2016-2036. However, because the current PPG requirements to test the demography will fall away following the adoption of revisions to the NPPF in the summer, we do not in this study undertake a comprehensive update of the Edge study to reflect the new plan period. 7 Para. 7.12
Housing and economic growth options
Findings report
June 2018 6
Northumberland currently has a higher level of old age dependency8 than the region
and England, the gap is expected to have widened further by 2036.
Figure 2.2 Old age dependency ratio change
Source: SNPP 2014, old age dependency ratios
2.18 In relation to jobs, rather than use an integrated forecasting model to understand the
housing requirements generated by the jobs-led scenarios developed by St Chad’s,
both the 2015 SHMA and the 2017 Edge study used POPGROUP to model different
sensitivities. These included making various manual adjustments to unemployment
levels, economic activity rates and the commuting balance to identify the housing
needs associated with the St Chad’s scenarios.
2.19 The preferred jobs-led scenario which was taken forward in the now-withdrawn Core
Strategy was for 1,216 dpa which reduced the unemployment rate to pre-recession
levels and reduced the commuting ratio ‘in line with the NOMIS line of best fit’; no
adjustment was made to economic activity rates beyond reflecting the changes to
state pension age. This was taken from the 2015 SHMA.
2.20 The 2017 study re-ran the same scenario, using the same unemployment and
commuting assumptions to take account of the 2014-based projections and other
updated data. This indicated a need for 914 dwellings pa, reduced from the previous
1,216pa.
2.21 This change is relevant to this study in that it shows that in order to support the same
degree of economic growth, the 2017 study showed that fewer homes were needed
to underpin growth in the county. By the same token then, when considering the
8 The old age dependency ratio is the number of people over 65 years old for every 1,000 people aged between 16 and 64 years old

Housing and economic growth options
Findings report
June 2018 7
outcomes of this study, it should not necessarily be interpreted that a lower housing
need figure equates to constrained economic growth.
Housing completions
2.22 Population growth is of course linked to household growth, and so housing
completions. The latest published data from NCC on housing delivery covers the
period 1 April 2016 to 31 March 2017. This confirms that since 2014, nearly 4,000
dwellings have been completed in the county.
Table 2.1 Net additional dwellings in Northumberland 2014-17
2014/15 2015/16 2016/17
No. of dwellings 1,447 991 1,531
Source: NCC data
2.23 While further data is available from NCC on housing completions, for the purposes of
this study the draft NPPF’s standard method removes the need for scrutiny of
housing completions9, we only need to think about delivery since the base date of the
projections i.e. 2014. In due course, when the projections are updated to a 2016
base, it will only be the 2016 completions and any subsequent full years’ data that is
available will be relevant.
Employment land in Northumberland
2.24 Economic activity is unevenly spread across Northumberland. The figure below
clearly shows the concentration of business numbers in the south eastern part of the
county, focused on Cramlington, Ashington, Blyth and Morpeth, with Hexham and
Ponteland also being key business locations. Other than in the south, Berwick and
Alnwick are the only places where there are significant numbers of businesses.
2.25 This is amplified when business size is taken into account. The second map shows
only medium-sized businesses (50-250 employees).
9 Although other elements of the NPPF place particular emphasis on this (housing delivery test)
Housing and economic growth options
Findings report
June 2018 8
Figure 2.3 Distribution of businesses in Northumberland
Source: BRES 2016 (full maps in Appendix B
2.26 There are a number of key employment studies which are relevant to this study as we
have not carried out any update of the site assessment work or local market analysis
previously undertaken in Northumberland. Specifically, the full Employment Land
Review (ELR) undertaken in 2011 and updated in 2013 (‘2011 ELR’ and ‘2013 ELR’);
and the further bottom-up employment work commissioned in 2015 (Employment
Land and Premises Demand Study, ELPDS), which looked at local demand in detail
and confirmed the conclusions of the previous studies.
2.27 The 2011 ELR, prepared by NLP and BNP Paribas, provided evidence to
demonstrate the need for, and deliverability of, employment allocations across the
County in three service areas. This study provided a spatial understanding of
economic activity across Northumberland, and the influence outside the county.
These four ‘functional economic areas’ are summarised as:
¡ Berwick upon Tweed and the surrounding area, with the travel to work data
indicating a high degree of self-containment because of its remoteness from
urban centres. This covers part of North Northumberland.
¡ Alnwick, Morpeth, West Northumberland and surrounding area, including Hexham
which while predominately rural includes Morpeth as a major centre of
employment, as well as Alnwick and Hexham. Self-containment is between 60-
70%, but with stronger commuting links to Tyneside in the south and South East
Northumberland.
Housing and economic growth options
Findings report
June 2018 9
¡ South East Northumberland which is largely urban in character and includes
Blyth, Cramlington and Ashington. There is commuting between this area and
particularly Morpeth. The report refers to high levels of deprivation in this area.
¡ Newcastle, Gateshead and the area north of the Tyne which includes the three
other authorities within the North of Tyne devolution area, as well as Ponteland
and Prudhoe within the county. With reference to Northumberland, there are
significant commuting flows from South East Northumberland and West
Northumberland and while there is some out-commuting this is not significant
against the scale of in-commuting.
2.28 In terms of the stock and quality of employment land, the best sites were found to be
concentrated in the South East with an undersupply of unconstrained, available
employment sites in Hexham, Ponteland, Prudhoe and Morpeth.
2.29 Because the study was premised on now-outdated demand analysis, we do not
consider that analysis in detail. However, a significant oversupply of allocated
employment land was identified. In the context of space requirements for in the
region of 300ha of employment land10, the study suggested that 137.6ha of land
could be deallocated. For qualitative reasons stemming from the undersupply noted
above, the study made a recommendation for between 64-87ha of new employment
land focused on Morpeth, Alnwick, Hexham, Blyth, Prudhoe and Ponteland.
2.30 The ELPDS (ES Group) assessed the demand for employment land and premises in
each of the County’s main towns, service centres and their surrounding commercial
property markets. The objective was to update demand using a bottom-up qualitative
method and review whether the previous ELR recommendations are still valid. The
study was informed by workshops, surveys and local market research to identify the
scale and location of land requirements on a site-by-site basis looking at vacancy,
rents and distribution of employment land.
2.31 It identified 384 ha of available and allocated employment land. Based on an
average annual take-up of 6.22 ha, this equated to supply of over 60 years. As well
as pointing to the continued need to de-allocate sites, in spatial terms the study
supported the recommendations of the 2011 ELR for new employment land
allocations in Prudhoe, Hexham, Morpeth and Ponteland. The Hexham
recommendation was made in the context of the study identifying Cramlington as the
most important employment location in terms of floorspace and take up, and while
Hexham was second in terms of floorspace, it was suffering from constrained take up.
2.32 Taken together, these studies identify several common themes which remain relevant
to this study in terms of devising policy solutions to accommodating economic growth
in Northumberland:
¡ Economic activity is focused on the southern part of the county, with the strongest
links in terms of transport infrastructure to the Newcastle conurbation.
10 Figure subsequently halved in the 2013 report, drawing on the then-latest economic forecasts.
Housing and economic growth options
Findings report
June 2018 10
¡ Under the current development plan, there is a quantitative surplus of land
allocated for employment uses.
¡ Despite this global oversupply, there is a geographical mismatch in the demand
for and supply of employment land so that there is not sufficient land to meet
demand in the economically-most active areas of the county.
Changes in the employment land stock in Northumberland
2.33 The Northumberland Employment Land Take-up Study 1999-2017 was published in
March 2018 and provides a review of past rates and spatial patterns of the take-up of
allocated employment land, as well as its development for other types of commercial
activity or other types of land use such as housing.
2.34 In 2016, for the county as a whole, 241 ha of allocated employment land is identified
as available. The majority of this land is in the South East delivery area (167 ha); the
smallest proportion is in the West delivery area (8 ha)11. Further information is
provided in relation to land under option, developed, held for expansion, and ancillary
land. These other categories account for over 1,500 ha, and in each case, the
majority is found in the South East Northumberland.
2.35 The figure below shows the take up and loss across the county of allocated land
broken down chronologically between 1999 to 2016.
11 The delivery areas are shown on Figure 3.2
Housing and economic growth options
Findings report
June 2018 11
Figure 2.4 Take up and loss of allocated employment land 1999-2016
Source: NCC Employment Land Take-up Study (2018) Table 32
2.36 This shows that while there were considerable losses in 2011/12, overall there has
been a 19.8ha net gain in employment land over that period.
2.37 For the purposes of this study, understanding changes in employment stock is very
relevant for forecasting land requirements. This is because the employment
forecasts we use are based on net additional jobs; this means that if any existing jobs
have been displaced by losses of employment land since the base date of the
forecast, this must be factored into any allocations. For this study, this means the
change in stock since 2014.
2.38 We have been advised by NCC that while they have extensive monitoring data, which
has informed the figure above, this relates solely to allocated employment land, so
does not cover any changes in unallocated land. Additionally, NCC carried out a
‘cleanse’ of their data within the last two years. This means that the scale of change
is not likely to be representative of the single years for 2014-2016. We therefore
-30.00
-25.00
-20.00
-15.00
-10.00
-5.00
0.00
5.00
10.00
15.00
20.00H
ecta
res
take up loss
Housing and economic growth options
Findings report
June 2018 12
instead use Valuation Office Agency (VOA) floorspace statistics12 which shows that
19,000 sqm of employment space has been lost between 2014-2016 comprising
17,000 sqm of office space and 2,000 sqm of industrial space.
Summary
2.39 For the purposes of this study, we have used the emerging NPPF and associated
guidance as the framework for our method.
2.40 We have had regard to the evidence base prepared in support of the withdrawn Core
Strategy and have set aside those documents which relied on the previous set of
economic forecasts, which are now some five years old. We have however, relied on
the demographic analysis that underpinned the 2017 Edge study which considered
the latest official projections. We also have regard to the market analysis provided in
the 2015 employment study.
2.41 This review has revealed the following points which are relevant in developing the
economic futures in the following section, and then in considering the housing need
and employment land implications in the forthcoming sections:
¡ While there will be some population growth going forward, the population of the
county is ageing and will continue to age faster than the national population so
that the size of the working age population is becoming increasingly squeezed.
¡ There is a significant stock of allocated employment land but there are qualitative
gaps in the more economically active areas in the county such as Hexham,
Ponteland and Prudhoe.
¡ Recently, the level of housing completions has been very high, with nearly 4,000
units delivered in three years. Conversely, there have been net losses in
employment space within the county in period to 2016, totalling some 19,000 sqm
in the preceding two years from 2014. These losses of employment space will
need to be factored into the need for employment land going forward.
12 https://www.gov.uk/government/statistics/non-domestic-rating-business-floorspace Non-domestic rating: business floorspace - providing a time series of statistics on the floorspace and rateable value of a range of classes of properties liable for business rates.
Housing and economic growth options
Findings report
June 2018 13
3 NORTHUMBERLAND’S ECONOMY
Introduction
3.1 The figure below shows the composition of the county’s economy by sector. Each
circle in the chart illustrates the current number of jobs in each broad sector in
Northumberland. This shows that the service sector is very important to the county’s
economy (public services, professional and other private services and
accommodation, food services and recreation and retail).
Figure 3.1 Northumberland location quotient (sector representation
compared to UK, with sector size indicating employee numbers)
Source: Experian, PBA
3.2 The horizontal position on the chart shows the current representation relative to the
UK, and the vertical position shows that sector’s future job growth for the UK. This
shows that it is these services sectors that are expected to grow in Northumberland,
in line with growth at a UK level. Conversely, while manufacturing is a significant
sector for the county which is also expected to grow over the period to 2036, this
does not align with the national picture of declining manufacturing jobs.
3.3 However, this assumes that Northumberland performs as expected by forecasters
and does not take account of the initiatives that may be coming forward as part of
committed and future economic strategies. We therefore consider these below and
factor this into the forthcoming section on Northumberland’s economic future.
3.4 There are a wealth of economic development strategy documents relating to
Northumberland. We do not in this study seek to provide a detailed analysis of these
documents. This is largely because we use the North East Strategic Economic Plan
(SEP), which the county’s current Economic Strategy (2015) draws on, as the starting
point for our economic futures analysis in the next section. The SEP itself is informed
by the Northern Powerhouse economic work (Appendix C ).
Housing and economic growth options
Findings report
June 2018 14
3.5 In addition, we are also aware of the recent announcement of the North of Tyne
‘minded-to’ devolution deal in November 2017. Northumberland, alongside
Newcastle and North Tyneside, and with the support of the North East LEP, are the
constituent members of the group which will make up the North of Tyne Combined
Authority (NTCA). While little in the way of detail has come forward on what the
NTCA will involve, it is likely to be a consideration in plan making. It is expected that
a Housing and Land Board will be established to ‘support the accelerated delivery of
an ambitious target for new homes, informed by Local Housing Need figures’13 and so
too will an Employment Support Framework Agreement intended to foster inclusive
economic growth in the NTCA.
Northumberland’s current economic strategy
3.6 Within the context of the SEP, the Northumberland Economic Strategy 2015-2020
sets out a five-year vision and thematic priorities to achieve growth of 10,000 new
jobs up to 2031.
3.7 The Economic Strategy sets out the current economic context and identifies the
challenges of lower GVA than national, regional and LEP rates and falling
employment. A further challenge is the interdependence between the different parts
of the region given the dispersed rather than concentrated nature of both labour and
employment provision.
3.8 The Strategy recognises the importance of both work and workers and that
Northumberland’s commuter role is vital as part of Northumberland’s changing role in
the wider region. The county provides key workers vital to the success and growth of
the North East economy and as such it makes an important contribution in terms of
workers and as a driver of regional prosperity. This interdependency is demonstrated
by the significant flow of commuters to Tyneside which is shown by out-commuting
exceeding in-commuting by a ratio of 2:1. Within this context it seeks a more
balanced performance in the future.
3.9 As identified in the SHMA and in common with many areas, Northumberland has an
ageing population and projections expect this to continue with a significant increase in
the 65+ age groups. Linked to this, the strategy acknowledges that a continuing
challenge will be attracting a more diverse demographic of working age migrants into
the County. Another key challenge will be the ability to increase the resident working
age population.
3.10 Under this strategy, future economic growth in Northumberland is premised on
recognising connections, but also ensuring that the county has a strong economic
base and can contribute more to regional output. The objective is to add enough jobs
to keep communities and businesses sustainable and maintaining its role in the wider
functional economic area, while ensuring that it does not become a dormitory
location.
13 North of Tyne ‘minded-to’ Devolution Deal (Nov 17) p.17
Housing and economic growth options
Findings report
June 2018 15
3.11 The strategy groups Northumberland’s complex geography into four areas, two urban
(south east and central) and two rural (north and west). This are shown on the figure
below and explained following bullet points.
¡ South East Northumberland is the industrial heartland of the county with major
employers and the majority of land available for development. It is well connected
to Tyne and Wear and consists of a commuting population of locally focused
residents and workers.
¡ Central Northumberland is accessible with good connectivity to Tyne and Wear,
Durham and Carlisle and consequently a high proportion of residents commute to
well-paid jobs in the conurbation. It includes some major employers around the
principal towns and has a high concentration of public administration and defence
jobs.
¡ Rural Northumberland (North and West) is large and sparsely populated with
many distinct coastal and rural towns and villages and a host of distinctive
landscape assets which are fundamental to the tourism and land-based industries
which dominate the private sector economy. Together with agriculture, these
industries are significant here compared with the England average.
Figure 3.2 Northumberland’s economic areas
Source: Northumberland Economic Strategy 2015-20 p.30
Housing and economic growth options
Findings report
June 2018 16
3.12 As shown in Figure 3.3, the focus is on strengthening existing specialisms in the
Investment Zone, supporting the diverse base across the Growth Network, and
supporting tourism and cultural businesses, and the development and renewal of
towns. The priority interventions are grouped around business, people and place and
seek to: grow the sector strengths; strengthen the business base; enable a more
inclusive economic; develop a competitive labour force, deliver infrastructure and
connectivity and support successful towns and communities.
¡ The Investment Zone economic delivery programme will enable development of
new jobs and business, new quality and diverse housing and excellent transport
routes linked to the urban core of Tyne and Wear.
¡ The Growth Network economic delivery programme will support and facilitate the
growth of the network of market towns and ensure the rural economy is an
accessible and distinctive place to live, work and visit.
Figure 3.3 Northumberland’s Growth Network and Investment Zone
Housing and economic growth options
Findings report
June 2018 17
Source: Northumberland Economic Strategy 2015-20 pp. 74 & 76
3.13 It is expected that these spatial delivery strategies will continue to influence economic
growth and planning policy going forward in the refreshed economic strategy and the
new local plan.
Borderlands Initiative
3.14 Since the Economic Strategy was published, the Council have been working in
collaboration with Carlisle City Council, Cumbria County Council, Dumfries and
Galloway Council and Scottish Borders Council ‘to promote the economic growth and
competitiveness’ in the area.
3.15 The key economic and social challenges, together with the five strategic objectives
(summarised in Appendix C ) have been distilled into projects which form part of a list
of priority activities, under several themes. Those relevant to Northumberland are
summarised in the table below.
Housing and economic growth options
Findings report
June 2018 18
Table 3.1 Northumberland’s priority projects
Transport and connectivity Place development and regeneration
Key sectors and skills
Dualling of the A69 and the A1
Upgrading and electrification of rail services on the Tyne
Valley Rail Line between Carlisle and Newcastle, including the provision of a new station at Gilsland
Improving the East Coast Main Line
Introducing a Borderlands Digital Improvement Scheme to accelerate access to superfast broadband and 4G mobile phone technology
Introducing a Borderlands Town Regeneration Fund, with Berwick and Haltwhistle identified as the initial priorities in Northumberland
Creating Community Growth Areas that support the regeneration work of development trusts, parish councils and other community organisations
Establishing a Border Uplands Demonstrator Initiative, as initial pilot within a wider Rural Development Demonstrator Programme to showcase new ways of working in a post Brexit context
Developing a Borderlands Developer and Investor Prospectus
Securing and applying further Simplified Planning Zones and Enterprise Zones designations to key industrial sites
Exploring the scope to develop a Centre of Excellence or Innovation Centre for a key sector examples could include energy; science and technology; food and drink; hospitality and tourism; or rural development demonstration
Establishing key sector networks that bring together industry, academia and the public sector to share knowledge, information, identify key issues and opportunities including addressing skill gaps and shortages
Expanding the Supplier Development Programme, operational in Scotland, to a pan Borderlands geography to make businesses procurement ready and strengthen supply chains
Securing additional funding to expand and unify enterprise support programmes such as the Rural Growth Network operational in Northumberland
Introducing a pan Borderlands Digital Training scheme
Source: NCC Cabinet report (April 2017)
Summary
3.16 This section clearly shows that there are a number of different but overlapping
strategies being advanced to further Northumberland’s economy including:
¡ Supporting growth in existing economic strengths, particularly in those parts of the
county which have a strong relationship with the economy of the wider north east,
focused on Newcastle and the Tyneside conurbation.
¡ Facilitating growth in the network of towns across Northumberland, including the
market towns as focuses for the existing rural economy and tourist economy.
¡ An integral part of these strategies are infrastructure improvements, including:
o Key north-south rail and road links run through Northumberland, as well as
some east-west links in the southern part of the county. Some investment in
the transport infrastructure of the county is committed but in the context of
overall investment in the Northern Powerhouse, this is limited.

Housing and economic growth options
Findings report
June 2018 19
o The need to improve broadband infrastructure is a high priority for the
Borderlands Initiative, so too are further rail improvements including
electrification to local lines and upgrades to the East Coast mainline.
3.17 The following section goes onto consider how Northumberland’s economy might grow
in the future. This takes the ‘business as usual’ approach to growth i.e. the area
continues to perform broadly as it has done in the past with reference to the broader
expectations for the UK economy. However, it also considers several more ambitious
scenarios which factor in improvements to key sectors and linked to infrastructure
improvements, as outlined in the various economic development strategies
considered in this section.

Housing and economic growth options
Findings report
June 2018 20
4 ECONOMIC GROWTH SCENARIOS
Introduction
4.1 To provide an integrated view of future jobs, population and housing, we have used
the local economic forecasts (November 2017) produced by Experian Economics,
together with additional scenarios specially commissioned from Experian. Experian is
one of the three main economic forecasting houses (alongside Cambridge
Econometrics and Oxford Economics) which provides local authority-level forecasts
which align with their view of what will happen in the UK and region in the future. We
use Experian as our preferred model as the most transparent of the three models.
We choose to work with Experian for three reasons: their methods and assumptions
are the most transparent of the three forecasters, we find their forecasts credible, and
theirs is the only model that allows testing of alternative assumptions for demographic
and labour market variables such as population and economic activity rates.
4.2 The baseline Experian model assumes population change in line with the latest ONS
SNPP (currently ONS 2014). The forecast resident labour force (labour supply) for
the local authority area is calculated from that population, plus activity rates and
commuting. It therefore takes account of the changing age profile of
Northumberland’s workforce, as well as changes to retirement age and implications
for the workforce across the period.
4.3 Another output of the model is job demand (labour demand) i.e. the number of jobs in
the local authority that employers will want to fill. As its name indicates job demand is
a demand-side view, unconstrained by local labour supply. Job demand is not shown
in the published forecast on Experian’s website, but Experian has provided it for this
study.
4.4 The forecast also outputs workplace jobs (called by Experian ‘workforce jobs’), which
means the number of jobs located in the area. This number is the lower of the
forecast labour demand and forecast labour supply:
¡ If labour supply is enough to fill the forecast demand, the workforce jobs equals
demand.
¡ If labour supply is too low to meet demand, the number of jobs is the maximum
that can be filled by the forecast labour supply. In that case, the forecast is saying
that job growth in the area will be supply-constrained. In other words, to meet
demand in full would require net in-migration over and above the official
population projection. In line with the current PPG, where the projection
understates housing need, it should be adjusted upwards.
Business as usual growth
4.5 Experian’s baseline forecasts (November 2017) are provided at Appendix E . The
table overleaf provides an overview of forecast change in terms of the main variables
that sit within the Experian model.
Housing and economic growth options
Findings report
June 2018 21
Table 4.1 Northumberland business as usual forecast
(Thousands unless specified) 1997 2014 2036 Change 2014-36
Change p.a. 1997-
2036
Change p.a.
2014-36
Labour force 142.90 160.80 156.90 -3.90 0.36 -0.18
Labour force - 16 to 64 154.40 142.20 -12.20 0.00 -0.55
Labour force - 65 Plus 6.30 14.80 8.50 0.00 0.39
Population - retired 60.70 77.30 97.80 20.50 0.95 0.93
Population - student 59.40 52.60 48.20 -4.40 -0.29 -0.20
Population - 16 plus 247.30 263.40 273.70 10.30 0.68 0.47
Population - 16 to 64 195.00 192.30 166.60 -25.70 -0.73 -1.17
Population - 65 plus 52.30 71.10 107.10 36.00 1.41 1.64
Total Population 306.70 316.00 321.90 5.90 0.39 0.27
Working Age Population 186.60 186.10 175.90 -10.20 -0.27 -0.46
Economic activity rate (%) - 16+ 57.80 61.00 57.30 -3.70 -0.01 -0.17
Economic activity rate (%) - 16 to 64 80.30 85.40 5.10 0.00 0.23
Economic activity rate (%) - 65 Plus 8.90 13.80 4.90 0.00 0.22
Economic activity rate (%) - working age
76.60 86.40 89.20 2.80 0.32 0.13
Employment rate (% of 16+ population)
54.30 56.80 54.60 -2.20 0.01 -0.10
Productivity (£GVA per hour) 20.60 26.30 34.20 7.90 0.35 0.36
Total GVA (£mn 2013 prices) 4010.70 4819.80 6610.00 1790.20 66.65 81.37
Workforce jobs 122.70 122.60 129.50 6.90 0.17 0.31
Jobs demand 122.70 122.60 129.50 6.90 0.17 0.31
Excess jobs 0.00 0.00 0.00 0.00 0.00
FTE jobs 99.00 93.40 98.40 5.00 -0.02 0.23
Workplace-based employment 127.80 133.80 6.00 3.43 0.27
Residence-based employment 134.30 149.70 149.50 -0.20 0.39 -0.01
Net commuting (inflow) -22.00 -15.70 6.30 -0.40 0.29
Unemployment 8.60 11.00 7.40 -3.60 -0.03 -0.16
Unemployment rate (% of labour force)
6.00 6.80 4.70 -2.10 -0.03 -0.10
Source: Experian (provided in full at Appendix E )
4.6 The forecast shows that the size of the local economy is expected to increase over
the period:
Housing and economic growth options
Findings report
June 2018 22
¡ The number of jobs located in Northumberland (‘workforce jobs’14) grows from
122,600 to 129,500, by 6,900 jobs in total (5.6%), equal to 314 jobs p.a.
¡ Productivity, which is real output (GVA) per hour worked15, also grows - by 30.0%
over the period.
¡ Growing job numbers and growing productivity drive growing output (GVA)16,
which increases by 37.1%.
4.7 As well as future jobs, the table shows a variable called ‘job demand’. This is the
demand for labour, i.e. the number of jobs that employers want to fill. In other words,
it is the number of jobs that would exist in the local economy if growth were not
constrained by local labour supply. In the Experian model, the calculation of job
demand takes no account of local labour supply.
4.8 But the number of actual jobs, labelled ‘workforce jobs’, does take account of labour
supply. If labour supply in an area – taking account of the age and sex profile of the
population, economic activity rates17, unemployment, double-jobbing and commuting -
is enough to meet demand, then ‘workforce jobs’ equals labour demand. If labour
supply is not enough to meet demand, then ‘workforce jobs’ equals the maximum
number of jobs that labour supply can meet. The difference between job demand and
workforce jobs is called ‘excess jobs’ or ‘unfilled jobs’. The presence of unfilled jobs
indicates that the local economy is constrained by labour supply.
4.9 In the baseline forecast, Northumberland is not labour supply constrained, although
the occasional small shortfall in supply which appears in some years over the period
indicates that there is very little slack in Northumberland’s labour market. This is
because while jobs are increasing, the resident labour force is expected to shrink by
3,900 over the period. Instead, additional jobs are largely filled by:
¡ a reduction in overall net out-commuting by 6,300, implying a tightening in the
labour market with residents in Northumberland having a better chance of finding
work locally by the end of the period.
¡ a fall in unemployment from 6.8% to 4.7%, in line with the UK average.
¡ increases in economic activity. For people aged 16-64, the rate increases from
80.3% to 85.4% in line with an increase for the UK as a whole. For those aged
65+, the economic activity rate increases from 8.9% to 13.8%; this is still below
the UK rate in 2036 of 15.5%.
4.10 In summary, while an increase in jobs of 6,900 is predicted over the period, the labour
market is finely balanced. This is primarily because of the ageing population; and is
illustrated clearly in the falling employment rate i.e. the proportion of the 16+
14 A better label for this number would be ‘workplace jobs’, because it relates to workplaces in Northumberland. But Experian, following Government statistics, calls it ‘workforce jobs’. To avoid confusion, we will simply call it
‘jobs’. 15 Figures on output and productivity are provided in real terms, i.e. adjusted for inflation. 16 Output = jobs x hours worked per job x productivity 17 The activity rate is the proportion of the population that is economically active, or part of the labour force – which means either working or looking for work. It varies greatly by age and sex – as older people are less likely to be economically active than younger people, and women than men.
Housing and economic growth options
Findings report
June 2018 23
population that is in work (outcome of economic activity rate and unemployment rate).
Even though unemployment in Northumberland is expected to fall, because economic
activity rates for the 16+ is expected to decrease by 3.7 percentage points to 57.3%
in 2036, the employment rate is also expected to fall from 56.8% to 54.6%.
Developing the alternative growth scenarios
4.11 NCC are in the process of updating their economic strategy. To develop economic
growth options for this study, we have worked with NCC’s economic development
team, the LEP, local businesses and other stakeholders to identify the scale of
additional growth and the sectors which have the potential to grow more than the
business as usual forecast for Northumberland.
4.12 The North East Local Enterprise Partnership’s (NELEP) Strategic Economic Plan
(SEP) was first published in 2014 (then updated in 2017) and covers the period 2014
to 2024. The SEP sets out an aspiration to deliver 100,000 additional jobs across the
NELEP. This figure represents an above-trend level of job growth in the NELEP area
and we use this as our starting point for developing alternative growth scenarios for
Northumberland.
4.13 There are other key targets outlined in the SEP in terms of improving productivity so
that the productivity gap between the NELEP area and England (exc. London) is half
closed by 2024, and that 60% of additional jobs are in ‘better’ sectors. These are
clearly relevant to Northumberland’s economic future; however, because the
outcomes of this study are to understand the housing and employment land
implications of economic growth, in developing these scenarios, we focus on job
growth as the key measure.
4.14 We have separated our approach into a number of stages:
¡ Stage 1: identify options for the scale of above-trend jobs growth at a LEP level,
using the SEP as our starting point
¡ Stage 2: identify options for what element of that growth might take place in
Northumberland
¡ Stage 3: identify growth sectors in Northumberland by considering existing
strengths, areas of policy commitment to improve performance and the impacts of
future investment
¡ Stage 4: allocate additional growth between those growth sectors with reference
to existing job shares
Stage 1: scale of additional growth at the LEP level
4.15 Under Experian’s business as usual scenario, the number of jobs in Northumberland
is projected to increase by 3,000 over the 10 years between 2014-24. At the NELEP
level, jobs are projected to increase by over 49,000.
Housing and economic growth options
Findings report
June 2018 24
Table 4.2 Business as usual workforce jobs growth in Northumberland
and in the LEP (thousands)
2014 2024 Growth 2014-2024 Growth as percentage
of 2014
NELEP 871.40 920.80 49.40 5.7%
Northumberland 122.60 125.60 3.00 2.5%
Northumberland’s share of NELEP
jobs 14.1% 13.6%
Source: Experian 2017
4.16 As set out above, the SEP aspiration is for an additional 100,000 jobs to be delivered
in the NELEP area by 2024 i.e. a further 50,600 over that identified in Experian’s
business as usual view of growth in the NELEP area.
4.17 We considered whether above-trend growth might continue after 2024 and discussed
this with the LEP. However, in line with the draft PPG guidance’s emphasis on
planning on the first 10 years and the direction for plans to be re-evaluated after five
years, we do not factor in above-trend growth beyond the period covered by the
current SEP.
Stage 2: scale of additional growth in Northumberland
4.18 Because the SEP does not disaggregate job growth into the constituent local
authorities, we must take a view on what proportion of additional growth may take
place in Northumberland. As discussed above, in the business of usual scenario, the
relative scale of job growth in Northumberland is just over half that expected in the
whole NELEP area. It is also relevant to consider how the county has performed in
the past in the context of the performance of the NELEP area. As shown in the figure
below, it is clear that while in the NELEP area, workforce jobs have grown over the
period since 1997, jobs in Northumberland have remained largely static.

Housing and economic growth options
Findings report
June 2018 25
Figure 4.1 Workforce jobs in Northumberland and NELEP 1997-2014
Source: Experian
4.19 We considered several potential economic futures for Northumberland:
¡ Maintaining its current share of NELEP jobs i.e. Northumberland having 14.1% of
the NELEP’s jobs in 2024. This would result in 11,100 jobs more than the
baseline level of growth i.e. 19,000 additional jobs over the period 2014-36.
¡ Northumberland’s share of additional NELEP jobs declines in line with the
baseline forecast i.e. 13.5% of NELEP’s jobs in 2024. This would result in 8,400
jobs over the baseline level of growth i.e. a total addition of 15,300 jobs over the
period 2014-36.
4.20 In the context of the limited job growth that has characterised Northumberland’s past,
we have not modelled the first option. Instead, we focus on the second option as our
ambitious growth scenario. We also develop an intermediate growth scenario which
would deliver 4,200 jobs over the baseline growth.
Stage 3: identifying the growth sectors
4.21 We refer in this report to growth sectors. What we mean by this is sectors which, in
our policy-on scenarios, could experience higher growth (or slower decline) than in
the business as usual scenario. This could be because of future or committed
investment in infrastructure e.g. rail improvements, broadband etc. or through policy-
on interventions such as designating LDOs or greater flexibility for employment-
generating uses to attract businesses or promote expansion of existing businesses.
It is important to stress that while in some instances, investment has taken place
which might ‘bend the trend’ in the future above that forecast by Experian, in other
instances, there is no such guaranteed investment
4.22 Through sectoral analysis of the business as usual growth scenario, engagement with
the LEP and stakeholders at the economic growth workshop, three key areas of
employment growth are identified in Northumberland: the rural economy, tourism and
port-related activities. However, these areas do not neatly align to the economic
13.0%
13.5%
14.0%
14.5%
15.0%
15.5%
16.0%
0
100
200
300
400
500
600
700
800
900
1000
N'la
nd
jo
bs a
s a
% o
f N
ELE
P
Work
forc
e jo
bs (
00
0s)
NELEP
Northumberland
Northumberland's jobs as a proportion of NELEP
Housing and economic growth options
Findings report
June 2018 26
sectors used in forecasting. We have therefore sought to adopt a pragmatic
approach to best align these sectors; this is explained in Appendix F .
4.23 We have allowed for more than business as usual growth in agriculture, forestry and
fishing, food and accommodation services, as well as several manufacturing sectors
where Northumberland already has strengths. Accommodation and food services
has clear links with Northumberland’s tourism growth agenda; on this same point, we
have allowed for above trend growth in recreation as the other key component of the
tourist economy.
4.24 In relation to manufacturing, this is currently an important component of the rural
economy in Northumberland, as well as the urban areas. Discussions with local
stakeholders indicate that, linked to land availability pressures in North Tyneside
arising from housing growth, there may be opportunities for Northumberland to
bolster its manufacturing jobs, particularly in the south of the county where there is
little distinction in market terms between areas that fall into Northumberland or North
Tyneside.
4.25 The table in Appendix D summarises the approach taken in relation to each sector,
with growth sectors shown in bold. Because Experian’s sectors do not fully align with
those used by BRES, we include the SIC category for ease for reference.
Stage 4: Attributing additional job growth across the sectors
4.26 The priority sectors are in two categories: ++ sectors, where the greatest uplift is
made, and + sectors, with a lesser uplift. The above-baseline growth is divided
between the priority sectors in proportion to numbers of jobs in Northumberland in the
base year, with ++ sectors given double weight. These are summarised in Table 4.3.
Table 4.3 Attributing the growth between sectors
Share of
jobs in 2014 Weighting
Weighted share of jobs
Agriculture, forestry and fishing 11% + 7%
Food, drink and tobacco 3% ++ 4%
Wood & paper 4% ++ 5%
Printing and reproduction of recorded media 2% ++ 2%
Chemicals 2% ++ 3%
Pharmaceuticals 2% ++ 3%
Rubber, plastic and other non-metallic mineral products
4% ++ 5%
Computer and electronic products 3% ++ 4%
Other manufacturing 3% ++ 3%
Utilities 3% ++ 4%
Land transport, storage and post 10% + 6%
Accommodation and food services 24% ++ 30%
Recreation 11% ++ 13%
Computing and information services 2% + 1%

Housing and economic growth options
Findings report
June 2018 27
Share of
jobs in 2014 Weighting
Weighted share of jobs
Professional services 15% + 9%
Total 100% 100%
Source: Experian/PBA
Alternative scenarios
4.27 In both the ambitious growth and intermediate growth scenarios run by Experian, due
to spin-off jobs associated with the higher population, the total number of additional
jobs increases. The figure below shows the two alternative scenarios in the context
of the business-as-usual growth over the period, with all the additional (above-trend)
job growth taking place in the years to 2024.
Figure 4.2 Workforce job growth in each scenario
Source: Experian 2017
4.28 As noted above, because the labour market in Northumberland is tight in the
business-as-usual scenario, the job-led scenarios of course require additional
population to live in Northumberland, above that shown in SNPP 2014. The
forecasting model estimates that extra population, taking account of the factors that
link workplace jobs to resident population which as mentioned earlier comprise
economic activity rates, unemployment, double-jobbing and commuting. In the model,
those variables are partly driven by national trends: for example, unemployment
everywhere is higher in recessions than booms, and older people’s activity rates are
increasing everywhere, due to rising pension ages and life expectancies. The ‘link
factors’ also respond to the local balance of supply and demand: for example, when
the local market tightens unemployment may fall and activity rates increase, as
mentioned earlier.
4.29 In the job-led scenarios, we have assumed that the additional population results from
additional people moving to Northumberland from the rest of the UK, above the
130
139
123
135
110
115
120
125
130
135
140
19
97
19
98
19
99
20
00
20
01
20
02
20
03
20
04
20
05
20
06
20
07
20
08
20
09
20
10
20
11
20
12
20
13
20
14
20
15
20
16
20
17
20
18
20
19
20
20
20
21
20
22
20
23
20
24
20
25
20
26
20
27
20
28
20
29
20
30
20
31
20
32
20
33
20
34
20
35
20
36
20
37
Work
forc
e jobs (
thousands)
Business as usual Ambitious growth Intermediate growth

Housing and economic growth options
Findings report
June 2018 28
official demographic projection which rolls forward past trends. To estimate the
numbers and age/sex profile of those additional migrants, we have applied
percentage uplifts to the migration inflows shown in the SNPP. The calculation
assumes that the likelihood of people moving to an area because job opportunities
vary according to age, so in the older age groups fewer people move.
4.30 The job-led scenarios assume that the rest of the NELEP area, like Northumberland,
receives additional migration to meet aspirational job demand. This assumption
impacts on the results for Northumberland, because if other places in the NELEP
area did not have enough population to meet demand they would attract more net
commuting from Northumberland.
4.31 Table 4.4 below summarises the jobs-led scenarios, where labour demand is met in
full because of above-baseline migration to Northumberland.
Table 4.4 Jobs-led scenarios
Ambitious growth Intermediate growth
(Thousands unless specified)18
2014 2036 Change Change
p.a. 2036 Change
Change p.a.
Labour force 160.80 167.30 6.50 0.30 164.10 3.30 0.15
Labour force - 16 to 64 154.40 152.50 -1.90 -0.09 149.40 -5.00 -0.23
Labour force - 65 Plus 6.30 14.80 8.50 0.39 14.70 8.40 0.38
Population - retired 77.30 97.80 20.50 0.93 97.80 20.50 0.93
Population - student 52.60 51.00 -1.60 -0.07 50.20 -2.40 -0.11
Population - 16 plus 263.40 287.50 24.10 1.10 283.40 20.00 0.91
Population - 16 to 64 192.30 178.60 -13.70 -0.62 175.10 -17.20 -0.78
Population - 65 plus 71.10 108.90 37.80 1.72 108.40 37.30 1.70
Total Population 316.00 338.50 22.50 1.02 333.60 17.60 0.80
Working Age Population 186.10 175.90 -10.20 -0.46 175.90 -10.20 -0.46
Economic activity rate (%) - 16+ 61.00 58.20 -2.80 -0.13 57.90 -3.10 -0.14
Economic activity rate (%) - 16 to 64
80.30 85.40 5.10 0.23 85.30 5.00 0.23
Economic activity rate (%) - 65 Plus
8.90 13.60 4.70 0.21 13.60 4.70 0.21
Economic activity rate (%) - working age
86.40 89.20 2.80 0.13 89.20 2.80 0.13
Employment rate (% of 16+ population)
56.80 55.50 -1.30 -0.06 55.20 -1.60 -0.07
Productivity (£GVA per hour) 26.30 33.90 7.60 0.35 34.00 7.70 0.35
Total GVA (£mn 2013 prices) 4819.80 7046.00 2226.20 101.19 6840.00 2020.20 91.83
Workforce jobs 122.60 139.10 16.50 0.75 134.70 12.10 0.55
Jobs demand 122.70 139.10 16.40 0.75 134.70 12.00 0.55
Excess jobs 0.00 0.00 0.00 0.00 0.00 0.00 0.00
18 Figures may not sum due to rounding
Housing and economic growth options
Findings report
June 2018 29
Ambitious growth Intermediate growth
(Thousands unless specified)18
2014 2036 Change Change
p.a. 2036 Change
Change p.a.
FTE jobs 93.30 105.80 12.50 0.57 102.40 9.10 0.41
Workplace-based employment 127.80 143.60 15.80 0.72 139.10 11.30 0.51
Residence-based employment 149.70 159.50 9.80 0.45 156.40 6.70 0.30
Net commuting (inflow) -22.00 -15.80 6.20 0.28 -17.30 4.70 0.21
Unemployment 11.00 7.80 -3.20 -0.15 7.70 -3.30 -0.15
Unemployment rate (% of labour force)
6.80 4.70 -2.10 -0.10 4.70 -2.10 -0.10
Source: Experian (provided in full at Appendices B and C)
4.32 This shows that for the ambitious growth scenario19:
¡ Job demand and workforce jobs increase by 750 jobs per annum as the gap
between supply and demand is filled by population above the official projections
(16,500).
¡ The change in net commuting is similar to the business as usual shift towards
lower net out-commuting, but slightly smaller reduction due to the above-trend job
growth associated with the SEP’s ambitions elsewhere in the NELEP area.
¡ The fall in the unemployment rate and the changes in economic activity, other
than very marginally in the 65+ category, is the same as the business as usual
and the ambitious growth scenarios.
4.33 For the intermediate growth scenario20:
¡ Job demand and workforce jobs increase by 550 jobs per annum as the gap
between supply and demand is filled by population above the official projections
(12,100).
¡ The changes in commuting are similar to the business-as-usual view but are
lower due to increased job growth elsewhere in the NELEP area. The reduction
in the level of out-commuting is also lower than the ambitious scenario because
the rest of the NELEP area is anticipated to take a greater share of the above-
trend jobs in the intermediate scenario.
¡ As with the ambitious growth scenario, unemployment and economic activity
changes are not substantively different to the business-as-usual view.
Implications for the sectors
4.34 The table below shows growth in jobs by sector for both job-led scenarios (above-
baseline or extra jobs, and total jobs), as well as the number of jobs in 2014 as the
start year of the SEP and the level of growth in each sector in the business-as-usual
scenario.
19 Figures may not sum due to rounding 20 Figures may not sum due to rounding
Housing and economic growth options
Findings report
June 2018 30
Table 4.5 Jobs by sector for the jobs-led scenarios (000s)21
2014 jobs
Business as usual
growth to 2036
Intermediate growth to
2036
Ambitious growth to 2036
Extra Total Extra Total
Agriculture, forestry and fishing 4.70 -1.70 0.10 -1.40 0.20 -1.20
Food, drink and tobacco 1.50 0.00 0.10 0.20 0.20 0.40
Wood and paper 1.90 -0.50 0.10 -0.30 0.20 0.00
Chemicals 1.00 -0.10 0.10 0.00 0.10 0.10
Rubber, plastic and other non-metallic mineral products
1.60 -0.20 0.10 0.00 0.10 0.20
Computer and electronic products 1.30 -0.20 0.00 0.00 0.10 0.10
Other manufacturing 1.20 0.10 0.10 0.20 0.10 0.40
Utilities 1.50 0.40 0.00 0.60 0.10 0.80
Construction of buildings 3.00 0.50 0.10 0.50 0.20 0.50
Specialised construction activities 4.60 0.40 0.20 0.40 0.30 0.40
Wholesale 5.40 0.00 0.20 0.00 0.30 0.00
Retail 13.80 -1.50 0.60 -1.40 1.00 -1.30
Land transport, storage and post 4.10 0.00 0.30 0.30 0.50 0.70
Accommodation and food services 10.40 2.00 0.50 3.30 0.90 4.50
Recreation 4.60 0.60 0.30 1.30 0.50 1.80
Finance 1.00 0.00 0.00 0.00 0.10 0.00
Real estate 2.00 0.30 0.00 0.30 0.10 0.30
Professional services 6.60 2.10 0.30 2.50 0.60 2.90
Administrative and supportive service activities
5.90 1.70 0.40 1.80 0.70 1.90
Other private services 3.80 0.50 0.20 0.60 0.30 0.60
Public administration and defence 5.50 -2.30 0.20 -2.30 0.20 -2.30
Education 9.70 1.80 0.60 2.00 1.00 2.10
Health 11.10 1.80 0.50 1.80 0.90 1.90
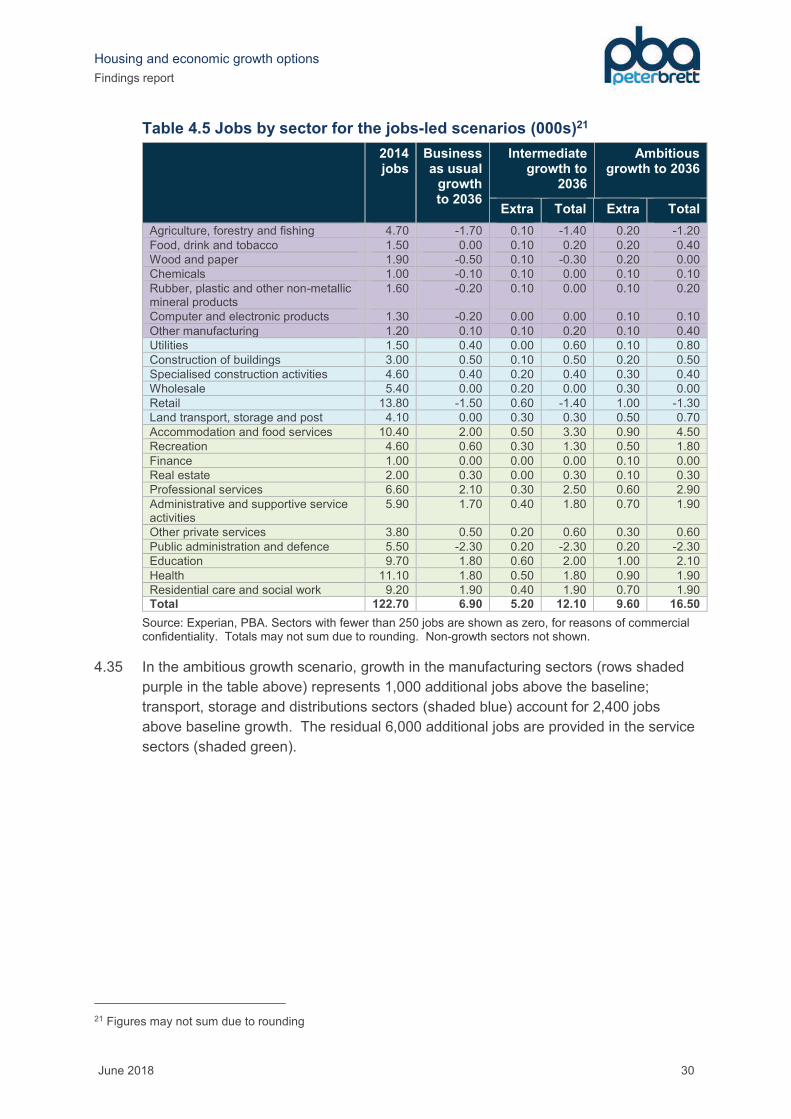
Residential care and social work 9.20 1.90 0.40 1.90 0.70 1.90 Total 122.70 6.90 5.20 12.10 9.60 16.50
Source: Experian, PBA. Sectors with fewer than 250 jobs are shown as zero, for reasons of commercial confidentiality. Totals may not sum due to rounding. Non-growth sectors not shown.
4.35 In the ambitious growth scenario, growth in the manufacturing sectors (rows shaded
purple in the table above) represents 1,000 additional jobs above the baseline;
transport, storage and distributions sectors (shaded blue) account for 2,400 jobs
above baseline growth. The residual 6,000 additional jobs are provided in the service
sectors (shaded green).
21 Figures may not sum due to rounding
Housing and economic growth options
Findings report
June 2018 31
5 EMPLOYMENT LAND IMPLICATIONS
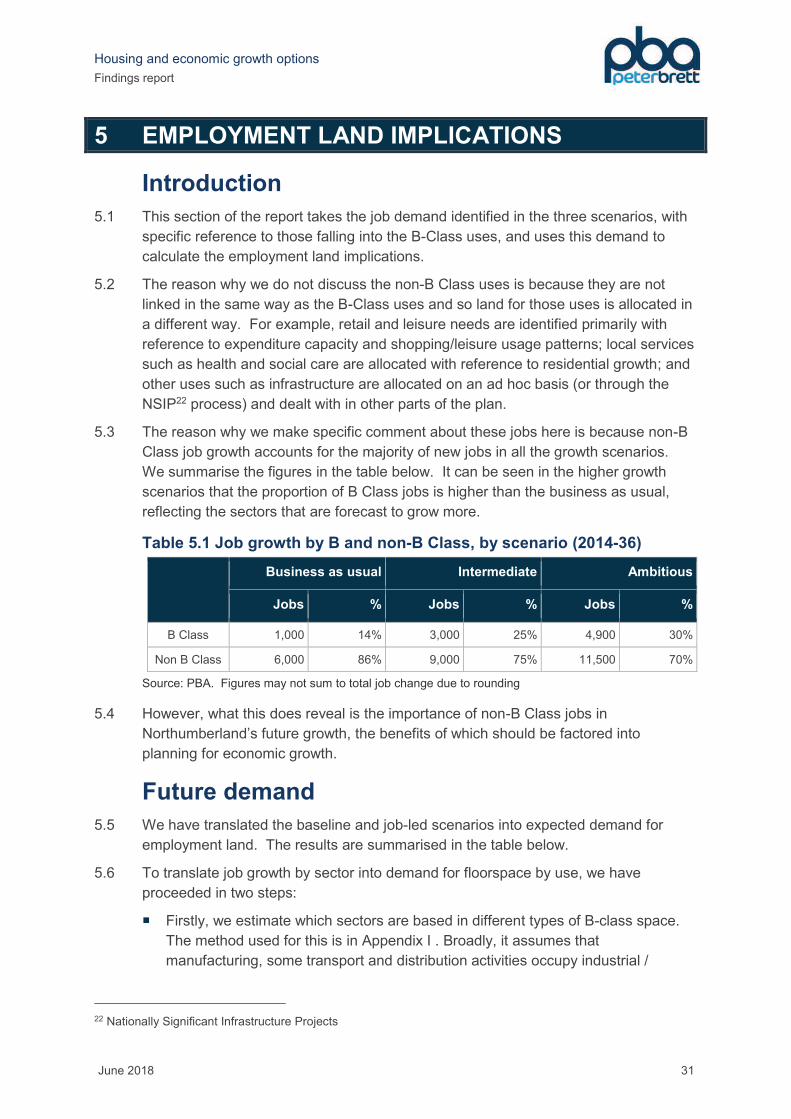
Introduction
5.1 This section of the report takes the job demand identified in the three scenarios, with
specific reference to those falling into the B-Class uses, and uses this demand to
calculate the employment land implications.
5.2 The reason why we do not discuss the non-B Class uses is because they are not
linked in the same way as the B-Class uses and so land for those uses is allocated in
a different way. For example, retail and leisure needs are identified primarily with
reference to expenditure capacity and shopping/leisure usage patterns; local services
such as health and social care are allocated with reference to residential growth; and
other uses such as infrastructure are allocated on an ad hoc basis (or through the
NSIP22 process) and dealt with in other parts of the plan.
5.3 The reason why we make specific comment about these jobs here is because non-B
Class job growth accounts for the majority of new jobs in all the growth scenarios.
We summarise the figures in the table below. It can be seen in the higher growth
scenarios that the proportion of B Class jobs is higher than the business as usual,
reflecting the sectors that are forecast to grow more.
Table 5.1 Job growth by B and non-B Class, by scenario (2014-36)
Business as usual Intermediate Ambitious
Jobs % Jobs % Jobs %
B Class 1,000 14% 3,000 25% 4,900 30%
Non B Class 6,000 86% 9,000 75% 11,500 70%
Source: PBA. Figures may not sum to total job change due to rounding
5.4 However, what this does reveal is the importance of non-B Class jobs in
Northumberland’s future growth, the benefits of which should be factored into
planning for economic growth.
Future demand
5.5 We have translated the baseline and job-led scenarios into expected demand for
employment land. The results are summarised in the table below.
5.6 To translate job growth by sector into demand for floorspace by use, we have
proceeded in two steps:
¡ Firstly, we estimate which sectors are based in different types of B-class space.
The method used for this is in Appendix I . Broadly, it assumes that
manufacturing, some transport and distribution activities occupy industrial /
22 Nationally Significant Infrastructure Projects
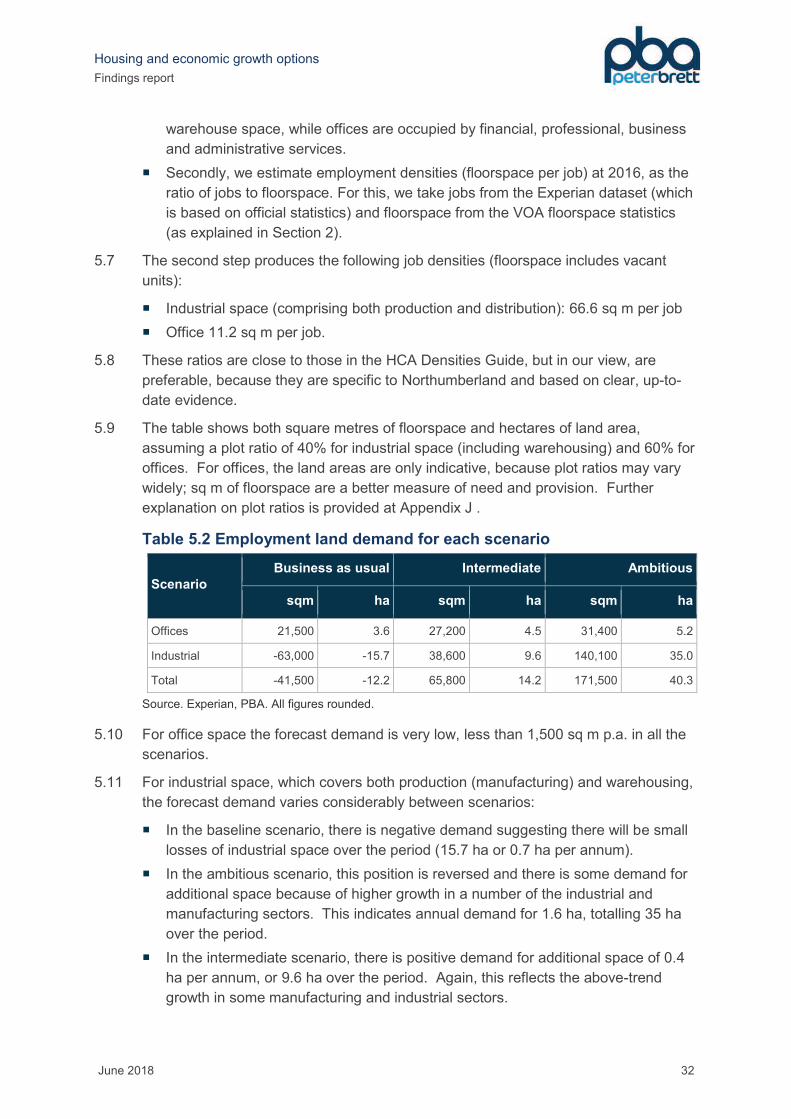
Housing and economic growth options
Findings report
June 2018 32
warehouse space, while offices are occupied by financial, professional, business
and administrative services.
¡ Secondly, we estimate employment densities (floorspace per job) at 2016, as the
ratio of jobs to floorspace. For this, we take jobs from the Experian dataset (which
is based on official statistics) and floorspace from the VOA floorspace statistics
(as explained in Section 2).
5.7 The second step produces the following job densities (floorspace includes vacant
units):
¡ Industrial space (comprising both production and distribution): 66.6 sq m per job
¡ Office 11.2 sq m per job.
5.8 These ratios are close to those in the HCA Densities Guide, but in our view, are
preferable, because they are specific to Northumberland and based on clear, up-to-
date evidence.
5.9 The table shows both square metres of floorspace and hectares of land area,
assuming a plot ratio of 40% for industrial space (including warehousing) and 60% for
offices. For offices, the land areas are only indicative, because plot ratios may vary
widely; sq m of floorspace are a better measure of need and provision. Further
explanation on plot ratios is provided at Appendix J .
Table 5.2 Employment land demand for each scenario
Scenario
Business as usual Intermediate Ambitious
sqm ha sqm ha sqm ha
Offices 21,500 3.6 27,200 4.5 31,400 5.2
Industrial -63,000 -15.7 38,600 9.6 140,100 35.0
Total -41,500 -12.2 65,800 14.2 171,500 40.3
Source. Experian, PBA. All figures rounded.
5.10 For office space the forecast demand is very low, less than 1,500 sq m p.a. in all the
scenarios.
5.11 For industrial space, which covers both production (manufacturing) and warehousing,
the forecast demand varies considerably between scenarios:
¡ In the baseline scenario, there is negative demand suggesting there will be small
losses of industrial space over the period (15.7 ha or 0.7 ha per annum).
¡ In the ambitious scenario, this position is reversed and there is some demand for
additional space because of higher growth in a number of the industrial and
manufacturing sectors. This indicates annual demand for 1.6 ha, totalling 35 ha
over the period.
¡ In the intermediate scenario, there is positive demand for additional space of 0.4
ha per annum, or 9.6 ha over the period. Again, this reflects the above-trend
growth in some manufacturing and industrial sectors.
Housing and economic growth options
Findings report
June 2018 33
5.12 While the industrial figures could be split out further into the B1(c), B2 and B8 use
classes, we do not consider this particularly useful for planning purposes given the
extent of permitted development rights which allow space to switch without recourse
for planning permission. Although there are size restrictions on this, given the highly
rural nature of Northumberland’s economy, this will in reality equate to a great deal of
fluidity in existing and future stock. Added to this, it is noted that industrial practices
now mean that the boundaries between the different use classes are less clear and
this is underlined by the form that planning applications often now seek flexible B
class permission across the industrial categories.
5.13 It is important to understand that the above figures in Table 5.2 relate to net change –
the new employment space created in new development less the existing
employment space. Gross development – the new space created without any
deduction for old space lost has been higher: as set out at paragraph 2.38 for the
period 2014-16, 19,000 sqm of employment has been lost. We consider this further
below.
Losses and gains of employment land
5.14 As set out in Section 2, VOA data shows that, in net terms, 19,000 sqm of
employment floorspace has been lost in Northumberland since 2014. In addition to
this, NCC has identified a pipeline of 43,400 sqm with planning permission. A further
237 hectares are allocated in the development plan but do not yet have any planning
permission in place.
5.15 MHCLG data indicates that there have been 11 prior approvals for office to residential
permitted development since April 2014. However, conversations with officers
indicate that the instances of this happening across the authority area are limited.
We do not make special allowance for this in the forthcoming supply and market
balance analysis.
Demand and supply balance
5.16 The tables below set out the floorspace need calculations that include additional jobs
resulting from forecast growth under each scenario, and the scale of commitments
(i.e. losses or gains of employment floorspace) to date and outstanding permissions
that will absorb some of the demand. The assessment only takes in known current
permissions and does not forecast what might be lost and gained in the future.

Housing and economic growth options
Findings report
June 2018 34
Table 5.3 Market balance (sqm) (2014-36)
Scenario Office Industrial Total
Demand
Business as usual 21,500 -63,000 -41,500
Intermediate 27,200 38,600 65,800
Ambitious 31,400 140,100 171,500
Committed supply
Extant permissions for losses or gains in employment floorspace (net)
600 42,700 43,400
Change in stock 2014-2016 (VOA) -17,000 -2,000 -19,000
Market balance - over (or under) supply
Business as usual -37,900 103,700 65,800
Intermediate -43,500 2,100 -41,400
Ambitious -47,700 -99,400 -147,100
Source: PBA/Valuations Office Agency/NCC. All figures rounded.
5.17 In this table, a positive figure in the market balance rows indicates oversupply and a
negative figure undersupply. This shows that in the business as usual scenario, there
is a significant oversupply of floorspace. For the ambitious and intermediate
scenarios, there is a total undersupply. However, in all cases, there is shortfall in
office supply and only in the ambitious scenario is there also a shortfall in industrial
floorspace supply.
5.18 In the table below, we convert the floorspace market balance into land, and factor in
the supply of allocated land. To convert floorspace to land, we apply the plot ratios
outlined at paragraph 5.9 and explained in Appendix J
Table 5.4 Market balance (ha) (2014-36)
Scenario Office Industrial Total
Market balance excluding allocations - over (or under) supply
Business as usual -6 26 20
Intermediate -7 1 -7
Ambitious -8 -25 -33
Potential supply
Extant permissions 237
Market balance including allocations - over (or under) supply
Business as usual 257
Intermediate 230
Ambitious 204
Source: PBA
5.19 This shows that in all cases, there is an oversupply of allocated employment land.
While the oversupply is lowest in the ambitious scenario, the difference between the
three scenarios is not significant in the context of the oversupply. This confirms that

Housing and economic growth options
Findings report
June 2018 35
the position has not changed from the previous 2011, 2013 and 2015 employment
studies reviewed in Section 2.
Future allocations
5.20 Both the existing NPPF and the draft revisions published on 5 March advise that
plans should aim to meet needs for development across all land uses, unless an area
does not have enough sustainable capacity – in which case authorities should seek to
agree for neighbouring authorities to provide for some of their unmet needs through
the duty to co-operate process. In this context, it is generally accepted that ‘need’ is
synonymous with ‘demand’. The forecasts shown above provide a measure of that
demand.
5.21 Before translating the demand forecasts into plan targets, it will be essential to adjust
them to take account of any future losses of existing employment space. As
discussed earlier, the forecasts show net growth, whereas the Local Plan must
provide land not only to accommodate that net growth, but also to replace any space
that has been lost between 2014-16 (i.e. gross demand).
5.22 In translating the forecasts into plan targets, there are four further issues to be
considered.
5.23 The first issue is that forecasts are highly imperfect and approximate, so they should
not be accepted uncritically. They should be considered in conjunction with a
commercial property market assessment that considers demand and viability for the
different types of employment space.
5.24 Under current national guidance, such assessment is part of an economic
development needs assessment (HEDNA), formerly known as an employment land
review. We do not know if the revisions to the guidance will require a HEDNA. But
we know that NCC commissioned employment land review evidence published in
2011, 2013 and 2015 and reviewed in Section 2. We have not undertaken a full
review as part of this study; however, the stakeholder discussions undertaken
indicate that the overall conclusions in relation to where the market is strongest and
for what uses remains valid.
5.25 Secondly, the Council will need to decide which version of the forecast to choose –
whether the business-as-usual scenario, the ambitious scenario or an intermediate
version. This choice should take account of the market analysis mentioned above. In
the interest of maximising economic growth, it may be right to allocate enough land to
match the job-led scenarios, even if we cannot be certain that the corresponding
demand will materialise.
5.26 In line with current Government proposals, authorities will be required to review local
plans every five years, which would allow for allocations to be revised in future.
Nevertheless, excessive oversupply is to be avoided, especially if the land concerned
may be in demand for alternative uses, or if it requires infrastructure investment which
will be wasted if it is not developed.
Housing and economic growth options
Findings report
June 2018 36
5.27 The third point to be considered is whether the plan should allow a margin for
competition, choice and uncertainty. There is no Government guidance on this point,
In our view, a simple and effective approach is to ensure that the plan provides at
least five years supply of immediately available employment land at any one time, as
it must do for housing. The British Chambers of Commerce support this approach. It
means that a developer or occupier looking for land should always have a reasonable
choice, and more than one landowner competing for their custom.
5.28 In deciding on total land supply, the NCC should also have regard to the balance of
jobs and housing. In the current context of national planning reform this is a complex
issue. We will return to it in Section 6 below.
5.29 Finally, these figures represent quantitative outputs and do not factor in uneven
spatial distribution of market demand and economic activity against the supply of
suitable employment land. This is something we consider further in the
recommendations.

Housing and economic growth options
Findings report
June 2018 37
6 HOUSING NEED IMPLICATIONS
Introduction
6.1 Before we provide evidence to inform housing policy in the Local Plan, we need to
understand Government requirements.
6.2 Current national planning guidance includes a detailed method for calculating housing
need. This starts from the official household projections, which roll forward past
demographic trends. By established practice, the projected household numbers are
adjusted to allow for vacant and second homes (usually about 2-4% of the stock23),
although the Guidance does not mention this. The Guidance allows four possible
adjustments to the numbers:
i Technical – to correct for any anomalies that mean the projections are not a good
reflection of past trends
ii For market signals – to correct for any past undersupply that might have
suppressed past household growth. The Guidance lists the market signals that
should be considered, but is unclear about how they should be used.
iii For future jobs – to ensure that there is enough population in future to meet the
demand for labour (fill the available jobs)
iv For affordable housing need – possibly to increase the number of market homes
so they provide more developer contributions towards affordable housing.
6.3 As noted earlier, the Government intends to replace the above with a new standard
method. On 5 March the Government issued a response to the consultation, which
confirmed that the new method would be taken forward. On 9th March 2018, it issued
draft revisions to the PPG that included a new version of the method set out in
September. This new version is for information rather than consultation.
6.4 In the new method, the assessments still start from the official household projections.
This time there is no adjustment for vacant and second homes, and plan-makers are
to use the annual average for a 10-year period. The adjustments to the projections
are much reduced and simplified:
i The method allows the projections to be set aside in ‘exceptional circumstances’.
The exceptional circumstances are not defined. We believe they must include
anomalies in the projections, as described above.
ii Market signals are replaced by a single signal, the housing affordability ratio
(house prices divided by earning). The method provides a fixed formula for
translating this into housing need.
iii-iv Future jobs and affordable need no longer impact on the total housing need. The
only link between housing and job numbers is the general advice in the Framework –
which appears both in the current draft and proposed revisions – that planning should
23 Though in Northumberland’s case, the figure is higher at 6.4%
Housing and economic growth options
Findings report
June 2018 38
‘ensure an integrated approach to the location of housing, economic uses and
community facilities and services’.
6.5 Under the new method and the draft revised Framework, ‘the number produced by
the above method sets a minimum for the housing target (requirement, provision) to
be made in the Local Plan. While they cannot reduce that number; -plan-makers may
put forward proposals that lead to a local housing need above that given by [the new
method]. This could be as a result of a strategic infrastructure project, or through
increased employment (and hence housing) ambition as a result of a Local Economic
Partnership investment strategy, a bespoke housing deal with Government or through
delivering the modern Industrial Strategy.’
6.6 The consultation document that introduces the new method adds that, the
Government wants to encourage such ambitious authorities:
‘To facilitate this we propose to amend planning guidance so that where a plan is
based on an assessment of local housing need in excess of that which the
standard method would provide, Planning Inspectors are advised to work on the
assumption that the approach adopted is sound unless there are compelling
reasons to indicate otherwise. We will also look to use the Housing Infrastructure
Fund to support local planning authorities to step up their plans for growth,
releasing more land for housing and getting homes built at pace and scale.’
6.7 The draft revisions to the PPG published on 9 March adds that, when the plan target
is above the standard-method minimum, the housing number may be expressed as a
range, of which the lower end is the standard-method minimum (and the higher end is
presumably the uplifted target, though this is not stated).
6.8 Alongside the proposed method the Government provided illustrative numbers, to
show its results for the period 2016-26, based on the latest official household
projections – which are 2014-based. For Northumberland, the numbers showed:
¡ Projected growth 624 net new dwellings p.a. (dpa)
¡ Market signals (affordability) adjustment 13.2%
¡ Housing need 624 x 1.13% = 707 dpa.
6.9 Thus, while the 2014-based projections remain the latest available, 707 dpa is the
minimum housing target that the Northumberland Local Plan should set. But it is free
to set a higher number, which may be based on expected future job growth among
other reasons. But once the 2016-based projections are published the number will
change. Indeed, the latest affordability data24 shows that Northumberland’s relative
affordability in 2017 has worsened from the previously published to 2016 level of 6.11
to 6.38. This has the effect of increasing the standard-method minimum number to
717 dpa.
24 Published by ONS 26 April 2018 https://www.ons.gov.uk/peoplepopulationandcommunity/housing/datasets/ratioofhousepricetoworkplacebasedearningslowerquartileandmedian
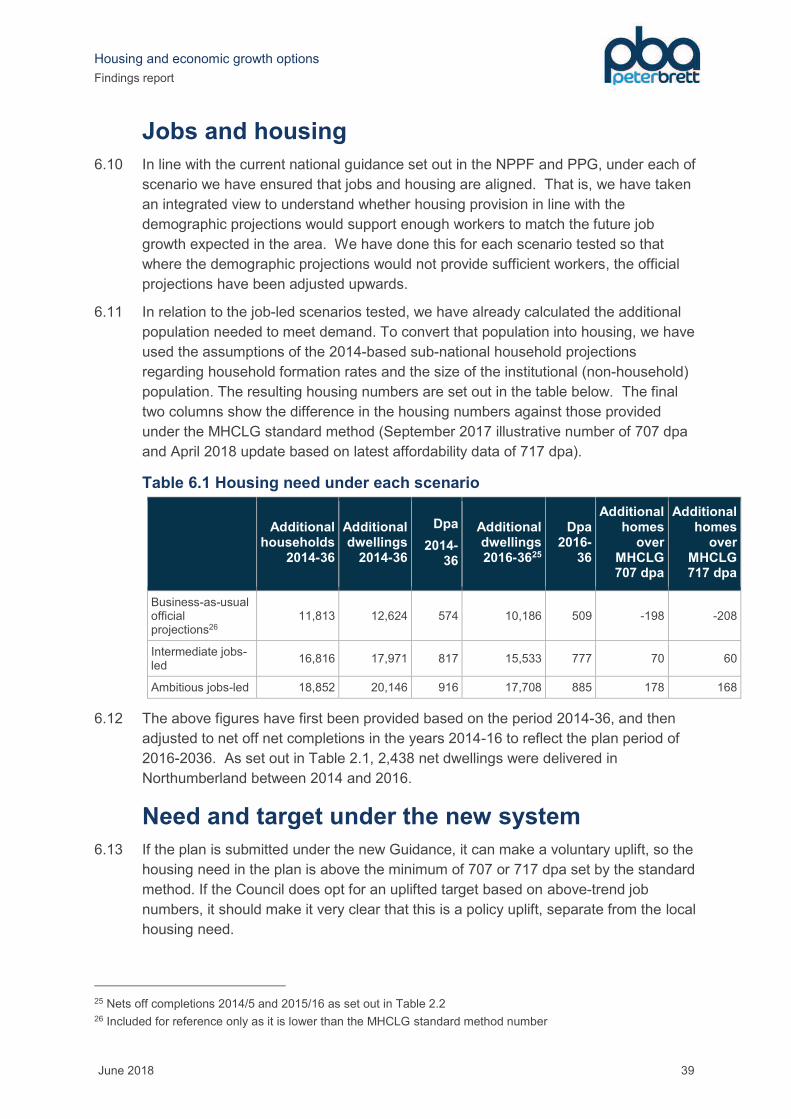
Housing and economic growth options
Findings report
June 2018 39
Jobs and housing
6.10 In line with the current national guidance set out in the NPPF and PPG, under each of
scenario we have ensured that jobs and housing are aligned. That is, we have taken
an integrated view to understand whether housing provision in line with the
demographic projections would support enough workers to match the future job
growth expected in the area. We have done this for each scenario tested so that
where the demographic projections would not provide sufficient workers, the official
projections have been adjusted upwards.
6.11 In relation to the job-led scenarios tested, we have already calculated the additional
population needed to meet demand. To convert that population into housing, we have
used the assumptions of the 2014-based sub-national household projections
regarding household formation rates and the size of the institutional (non-household)
population. The resulting housing numbers are set out in the table below. The final
two columns show the difference in the housing numbers against those provided
under the MHCLG standard method (September 2017 illustrative number of 707 dpa
and April 2018 update based on latest affordability data of 717 dpa).
Table 6.1 Housing need under each scenario
Additional
households 2014-36
Additional dwellings
2014-36
Dpa
2014-36
Additional dwellings 2016-3625
Dpa 2016-
36
Additional homes
over MHCLG 707 dpa
Additional homes
over MHCLG 717 dpa
Business-as-usual official projections26
11,813 12,624 574 10,186 509 -198 -208
Intermediate jobs-led
16,816 17,971 817 15,533 777 70 60
Ambitious jobs-led 18,852 20,146 916 17,708 885 178 168
6.12 The above figures have first been provided based on the period 2014-36, and then
adjusted to net off net completions in the years 2014-16 to reflect the plan period of
2016-2036. As set out in Table 2.1, 2,438 net dwellings were delivered in
Northumberland between 2014 and 2016.
Need and target under the new system
6.13 If the plan is submitted under the new Guidance, it can make a voluntary uplift, so the
housing need in the plan is above the minimum of 707 or 717 dpa set by the standard
method. If the Council does opt for an uplifted target based on above-trend job
numbers, it should make it very clear that this is a policy uplift, separate from the local
housing need.
25 Nets off completions 2014/5 and 2015/16 as set out in Table 2.2 26 Included for reference only as it is lower than the MHCLG standard method number

Housing and economic growth options
Findings report
June 2018 40
6.14 This voluntary uplift can be based on a wide range of factors, of which future jobs is
only one. But if the Council did choose to base it on future jobs, it would be advisable
to present housing need as a range, with the minimum at 707 dpa and the maximum
at 885. The assessment of five-year land supply and the delivery test would be
based on 707/717 dpa, while housing land allocations would logically be based on
885 dpa.
6.15 Under the draft revisions to the PPG, the higher number in the range will be
considered sound, unless there are compelling reasons to indicate otherwise.
Housing and economic growth options
Findings report
June 2018 41
7 SUMMARY OF FINDINGS
7.1 Northumberland’s new plan is emerging at a time when the Government is in the
process of revising much of the policy which relates to planning for housing and also
employment. For the purposes of this study, we have used the emerging NPPF and
associated guidance as the framework for our method.
7.2 In order to plan for the future, it is important to understand how Northumberland has
performed in the past. In reviewing previous evidence base documents, as well as
the latest population and household projections, we identified several points pertinent
to planning for Northumberland’s economic future. While there will be some
population growth going forward, the population of the county is ageing and will
continue to age faster than the national population so that the size of the working age
population is becoming increasingly squeezed. However, recent levels of housing
completions have been high. In relation to employment, while there have been net
losses in space within the county, there is a significant stock of allocated employment
land but there are qualitative gaps in the more economically active areas in the
county such as Hexham, Ponteland and Prudhoe.
7.3 Northumberland’s future growth will be influenced by the range of strategies in place
including the emerging devolution deal and the SEP which outline key infrastructure
improvements to enable growth such as enhancement of broadband provision and
coverage, electrification to local rail lines and upgrades to the East Coast mainline, as
well as improvement to major road links across the county. The focus of much of
these planned and potential improvements is on building on the relationship with the
Newcastle and Tyneside conurbation and facilitating growth in the network of towns
across Northumberland, including the market towns as focuses for the existing rural
economy and tourist economy.
7.4 It is in this context that we have considered how Northumberland’s economy might
grow in the future. This takes the ‘business as usual’ approach i.e. the area
continues to perform broadly as it has done in the past. However, we have also
considered two higher growth scenarios (ambitious and intermediate growth) which,
in the context of the aspirations across the NELEP area and the current SEP targets,
and linked to infrastructure improvements, factor in improvements to key sectors.
7.5 We worked with NCC and other stakeholders to identify key sectors where, under
these higher growth scenarios, job growth may exceed the business as usual
expectations for the county. An important part of this was considering the sectors
which are important to the huge rural areas which make up the majority of the county
and also the urban areas in the south which have a very different employment make
up. These key sectors include agriculture, forestry and fishing; food and
accommodation services and recreation (linked to Northumberland’s tourism growth
agenda); as well as several manufacturing sectors related to energy and ports where
Northumberland already has strengths.
7.6 In relation to manufacturing, this is currently an important component of the rural
economy in Northumberland, as well as the urban areas. Discussions with local
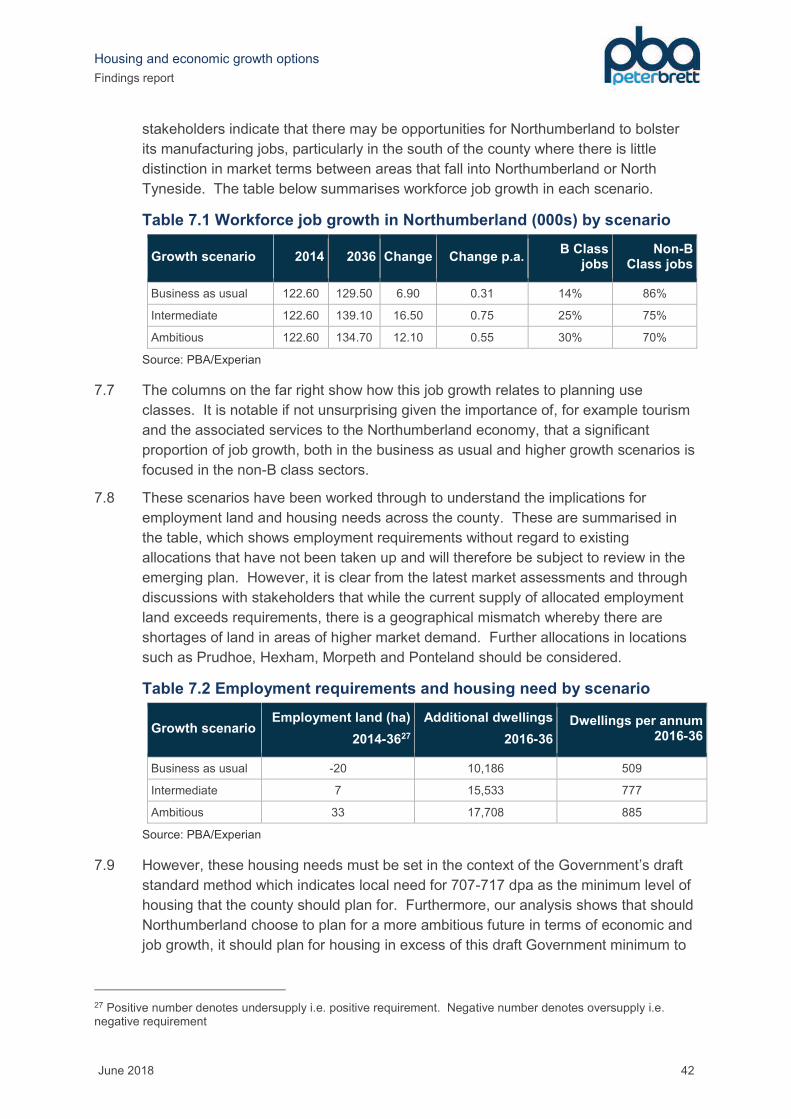
Housing and economic growth options
Findings report
June 2018 42
stakeholders indicate that there may be opportunities for Northumberland to bolster
its manufacturing jobs, particularly in the south of the county where there is little
distinction in market terms between areas that fall into Northumberland or North
Tyneside. The table below summarises workforce job growth in each scenario.
Table 7.1 Workforce job growth in Northumberland (000s) by scenario
Growth scenario 2014 2036 Change Change p.a. B Class
jobs Non-B
Class jobs
Business as usual 122.60 129.50 6.90 0.31 14% 86%
Intermediate 122.60 139.10 16.50 0.75 25% 75%
Ambitious 122.60 134.70 12.10 0.55 30% 70%
Source: PBA/Experian
7.7 The columns on the far right show how this job growth relates to planning use
classes. It is notable if not unsurprising given the importance of, for example tourism
and the associated services to the Northumberland economy, that a significant
proportion of job growth, both in the business as usual and higher growth scenarios is
focused in the non-B class sectors.
7.8 These scenarios have been worked through to understand the implications for
employment land and housing needs across the county. These are summarised in
the table, which shows employment requirements without regard to existing
allocations that have not been taken up and will therefore be subject to review in the
emerging plan. However, it is clear from the latest market assessments and through
discussions with stakeholders that while the current supply of allocated employment
land exceeds requirements, there is a geographical mismatch whereby there are
shortages of land in areas of higher market demand. Further allocations in locations
such as Prudhoe, Hexham, Morpeth and Ponteland should be considered.
Table 7.2 Employment requirements and housing need by scenario
Growth scenario Employment land (ha)
2014-3627
Additional dwellings
2016-36
Dwellings per annum 2016-36
Business as usual -20 10,186 509
Intermediate 7 15,533 777
Ambitious 33 17,708 885
Source: PBA/Experian
7.9 However, these housing needs must be set in the context of the Government’s draft
standard method which indicates local need for 707-717 dpa as the minimum level of
housing that the county should plan for. Furthermore, our analysis shows that should
Northumberland choose to plan for a more ambitious future in terms of economic and
job growth, it should plan for housing in excess of this draft Government minimum to
27 Positive number denotes undersupply i.e. positive requirement. Negative number denotes oversupply i.e. negative requirement

Housing and economic growth options
Findings report
June 2018 43
ensure that there is a sustainable population to support this growth. This will mean
setting a housing target at a level above that set out in the standard method.
7.10 In developing the scenarios tested in this study, we have looked critically at the role
Northumberland might reasonably play in the wider economic growth aspirations for
the area. This means that the highest growth option, our ambitious scenario, is
realistic; so too is the intermediate scenario. However, to realise the scale of growth
set out in the ambitious or intermediate scenarios, investment in infrastructure,
particularly improvements to broadband to support rural employment, will be needed.
So too will be housing growth in excess of the Government’s emerging minimum
need levels, in order to provide homes for the younger working age population
necessary to support growth.

Housing and economic growth options
Findings report
June 2018
APPENDIX A NPPF AND PPG SUMMARY
A.1 Introduction
This appendix provides an overview of the housing and economic development policy and
guidance set out in the current NPPF and PPG.
A.2 Housing need
The NPPF requires local planning authorities to ‘boost significantly the supply of housing’.
The first stage of this includes using ‘their evidence base to ensure that their Local Plan
meets the full, objectively assessed needs for market and affordable housing in the housing
market area, as far as is consistent with the policies set out in this Framework’ (paragraph
47).
In relation to plan making, LPAs are instructed to ‘prepare a Strategic Housing Market
Assessment to assess their full housing needs’. The housing need identified should meet
‘household and population projections, taking account of migration and demographic change’
(para. 159). The PPG provides a more detailed explanation of this in paragraphs 014-2029.
The PPG sets out the stages which LPAs are required address in order to arrive at the
‘overall housing needs figure’ at paragraph 2a-020, commonly referred to objective assessed
need (OAN).
The OAN is common-referred to as ‘policy off’ as it does not include any policy-based
judgement such as constraints on housing land or labour supply.
A.3 Economic development
In respect of economic development, as for all other land uses, the guiding principle is that
Local Plans should positively seek opportunities to meet the development needs of their
areas.
Key paragraphs from the NPPF include:
¡ Planning should do all it can positively to support sustainable economic growth. It
should not act as an impediment to such growth (paragraph 19).
¡ To help achieve economic growth, local planning authorities should plan
proactively to meet the development needs of business (paragraph 20).
¡ Local Plans should inter alia (paragraph 21):
o set out a clear economic vision and strategy for their area;
o identify strategic sites, or set criteria to help identify other sites, for
development in line with that strategy;
o support existing business sectors and where possible plan for new or
emerging sectors likely to locate in their area;
o plan positively for clusters or networks of knowledge-driven, creative or high-
technology industries;
29 Reference ID: 2a-014-20140306 to 2a-020-20140306
Housing and economic growth options
Findings report
June 2018
In respect of sites allocated for employment use the NPPF (paragraph 22) makes clear that:
¡ planning policies should avoid long term protection where there is no reasonable
prospect of a site being used for that purpose;
¡ land allocations should be regularly reviewed;
Local authorities should work strategically across local boundaries, and in particular:
¡ In building evidence bases, collaborate with neighbouring and county authorities
and Local Enterprise Partnerships (paragraph 160)
¡ In policy-making, co-ordinate strategic priorities across boundaries and
accommodate the needs of neighbouring authorities that do not have enough
sustainable capacity in their own areas (paragraphs 179-180).
Local Plans should be supported by an evidence base that (paragraph 160/1):
¡ Assesses needs for land and floor space, both quantitative and qualitative, for all
foreseeable types of economic activity over the plan period;
¡ Reflects a clear understanding of business needs
¡ Is based on close work with the business community to understand their needs
and also identify and address barriers to investment, including lack of housing,
infrastructure or viability.
The NPPF is clear that Local Plans should work proactively to identify and meet the
development needs of businesses including business sectors likely to locate in the area. It is
clear from this that business demand should be the major driver directing local strategy.
Cooperation with the LEP is important in respect of developing the evidence base.
Allocations should be reviewed on a regular basis, and strategic needs (and storage and
distribution comes into this category) should be considered across local boundaries.
Of relevance for this post-Brexit world is the Framework's advice to plan positively for growth
and not to act to impede growth. Given that the effects of Brexit cannot be predicted with
any level of assurance, and the timescales for any effect are also unknown, to prepare a 15-
year Plan on the basis of a Brexit-led economic downturn would be contrary to the
Framework.
A.4 Relationship between jobs and housing
Paragraph 70 says that planning should integrate the location of housing, economic activity
and community facilities and services. The PPG discusses the relationship between housing
need and employment at paragraph 01830. It advises that plan-makers should make an
assessment of future job growth and notes that, if future labour supply is less than this
projected job growth, this could ‘result in unsustainable commuting… or reduce the resilience
of local businesses. In such circumstances, plan-makers will need to consider how the
location of new housing and infrastructure development could help address these problems.’
Planning Inspectors have interpreted this to mean that demographic projections should be
tested against expected future jobs, to see if housing supply in line with the projections would
be enough to support those future jobs. If that is not the case, the demographically projected
30 Reference ID: 2a-018-20140306

Housing and economic growth options
Findings report
June 2018
need should be adjusted upwards accordingly; such adjustments overlap with the
adjustments for past supply and market signals discussed in Section 631. An alternative
solution may be changes in commuting, whereby a labour deficit in one area is balanced by a
labour surplus in neighbouring areas, provided that the planning authorities concerned are in
agreement and the resulting travel is sustainable.
Inspectors’ advice also suggests that future jobs cannot be used to cap demographic
projections. In other words, if the demographic projections provide more workers than are
required to fill the expected jobs, they should not be adjusted downwards. One reason for
this, as explained by the Bath & North East Somerset Inspector amongst others, is that much
of the demand for housing is not driven by job opportunities, and people who do not work
also need somewhere to live.
31 All adjustments referred here are policy-off. As confirmed by the High Court securing a ‘policy on’ regeneration led job target is outside the housing OAN (most clearly in Borough Council of Kings Lynn and West Norfolk v Secretary of State for Communities and Local Government, ELM Park Holdings Ltd. EWHC 2464.)

Housing and economic growth options
Findings report
June 2018
APPENDIX B BUSINESSES IN NORTHUMBERLAND
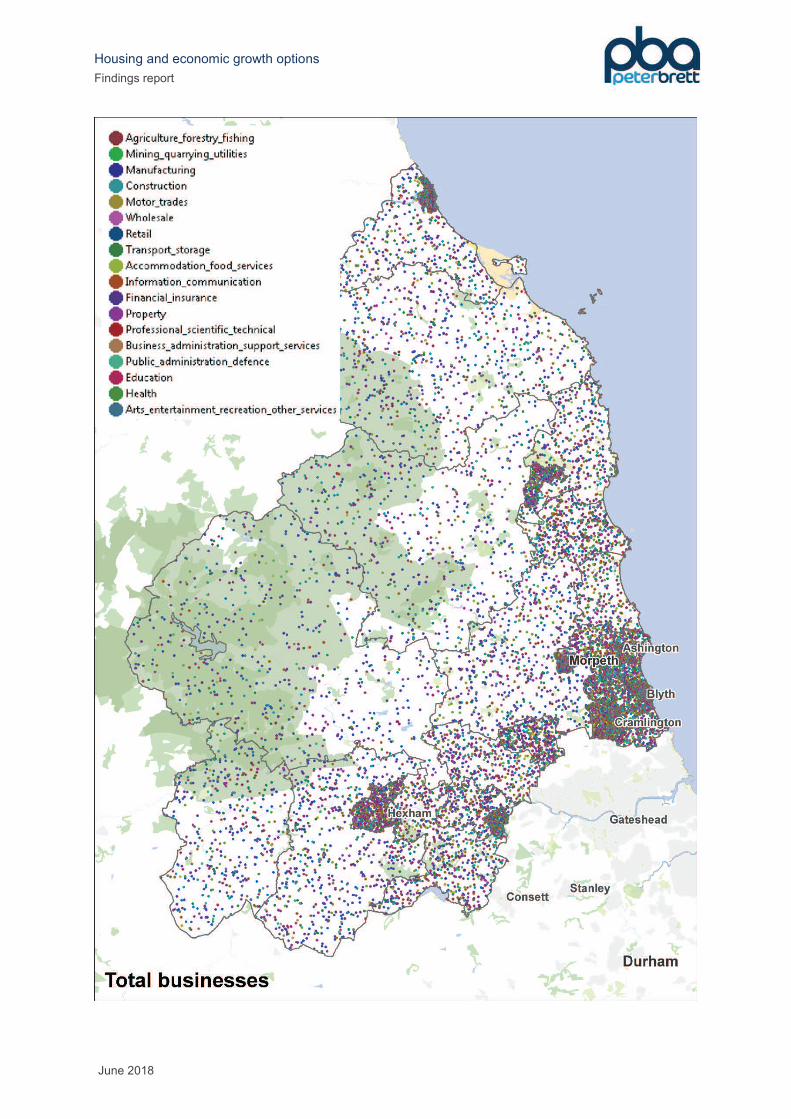
Housing and economic growth options
Findings report
June 2018
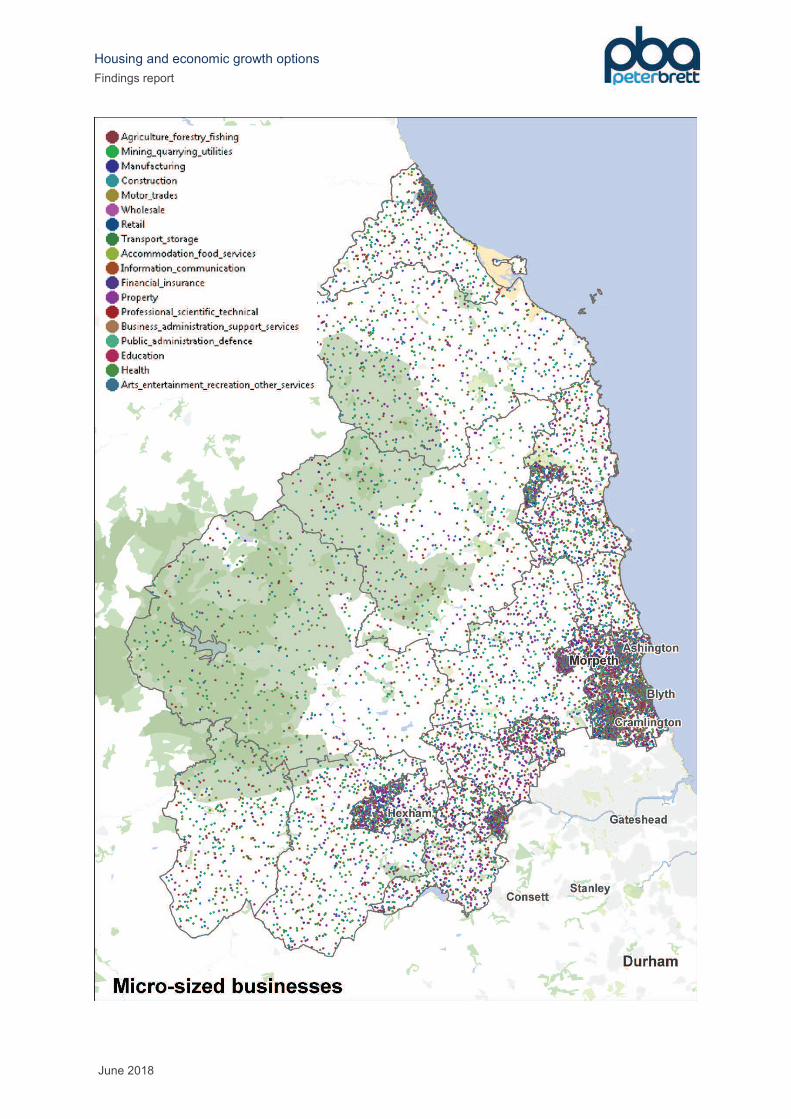
Housing and economic growth options
Findings report
June 2018
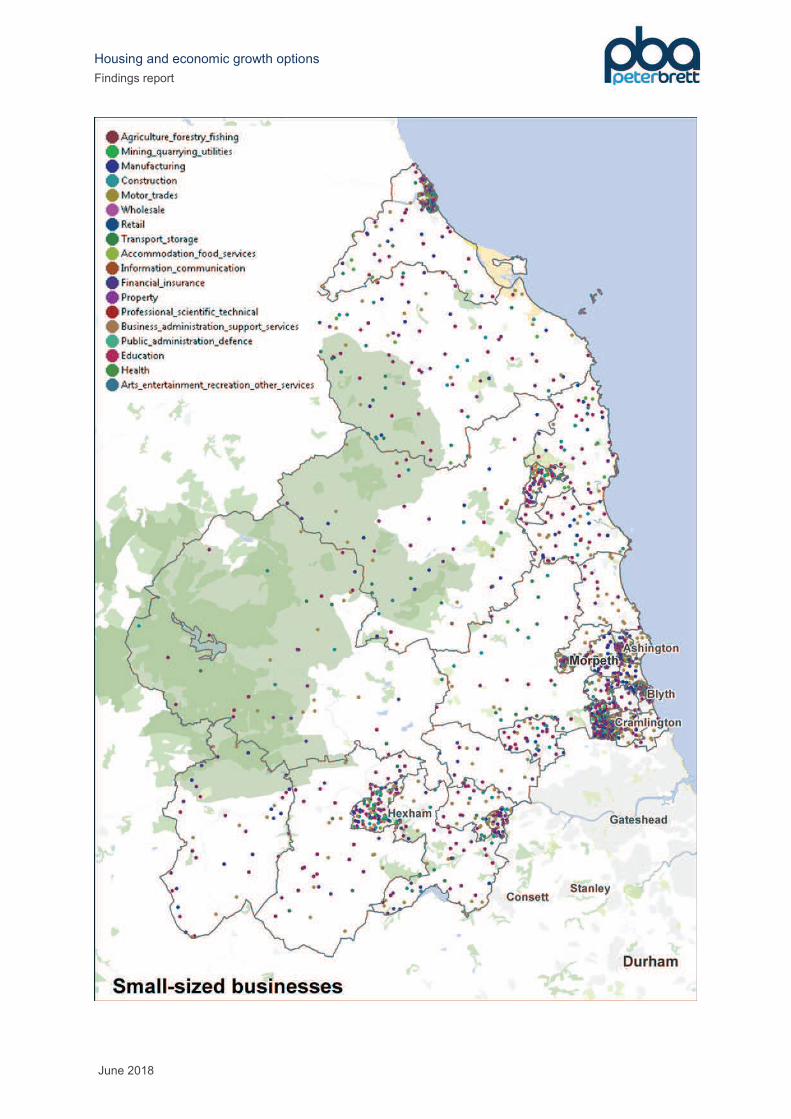
Housing and economic growth options
Findings report
June 2018
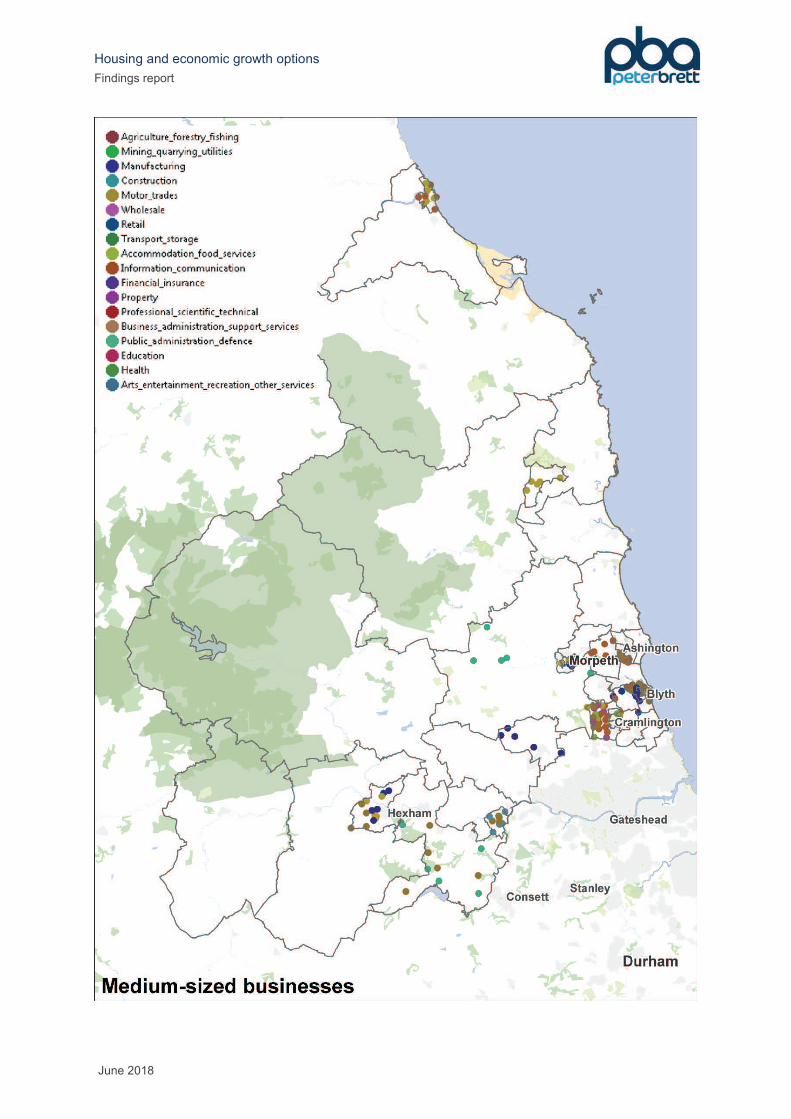
Housing and economic growth options
Findings report
June 2018

Housing and economic growth options
Findings report
June 2018

Housing and economic growth options
Findings report
June 2018
Note: all data sourced from BRES (2016) based on MSOA. Distribution of businesses within
each MSOA not geographically accurate: density-based distribution.
Business sizes
Micro: 0-9 employees
Small: 10-49 employees
Medium: 50-249 employees
Large: 250 employees plus

Housing and economic growth options
Findings report
June 2018
APPENDIX C ECONOMIC STRATEGIES
C.1 Northern Powerhouse
The Northern Powerhouse Independent Economic Review (IER) undertaken in 2013 informs
much of the economic development work relating to Northumberland. The IER identified that
there was performance gap between the North and the rest of England 25%. Within this
25%, productivity accounts for 17 percentage points of the gap and employment rate five
percentage points. The productivity gap is driven by a number of factors, most notably the
skills gap but also technology, investment, poor connectivity, limited agglomeration and low
enterprise rates.
The IER identified four main ‘prime’ capabilities where the north is very productive and able
compete at a national and international level:
¡ advanced manufacturing, focusing on materials and processes
¡ health innovation including life sciences, medical, health and social care
¡ energy, focused on generation storage and low-carbon technologies
¡ digital
The IER looks at a ‘transformed’ economic future for the North including 850,000 jobs higher
than the business as usual scenario in 2050 i.e. 1.56m additional jobs in total, GVA
increased by 15% over business as usual growth and productivity 4% higher.
The draft Transport for the North (TfN) Strategic Plan (January 2018) sets out the ‘strategic
transport interventions that the evidence suggests are required to support the
transformational growth scenario set out in the IER. This includes current commitments, as
well as the looking further to the future.
The current commitments relevant to Northumberland relate primarily to the Strategic Road
Network, rather than rail. These are:
¡ Road Investments Strategy (RIS1) covering the period up to 2020 and includes
improvements to the A69 at Hexham and Corbridge
¡ A commitment that RIS2 (2020-2025) will fund the reconstruction of the A19 Moor
Farm and Seaton Burn junctions
In relation to future schemes:
¡ Northern Powerhouse rail: this is intended to improve rail connections across the
north, as well as to facilitate greater integration with HS2. While not directly linked
into Northumberland, the existing connections into Newcastle, as a Northern
Powerhouse hub station, will improve connectivity for Northumberland. A
Strategic Outline Business Case will be completed by the end of 2018.
¡ Long-term rail strategy: the aim is delivering a ‘single, cohesive, integrated rail
network’. It is linked to Northern Powerhouse rail but other measures include
longer trains and additional services and rationalised fare structures with the aim
of promoting modal shift for both passengers and freight. While some
enhancements are already committed, TfN will be ‘developing an initial long-term
Investment Programme, which will be further developed into a pipeline of

Housing and economic growth options
Findings report
June 2018
schemes through to 2050’ and therefore has the potential to benefit
Northumberland.
¡ Additional road network enhancements: beyond the RIS structure, TfN intend to
make the case for further funding to support improvement to both the strategic
and major road network. The implications for Northumberland are not yet clear.
Related to these committed and potential upgrades, the draft TfN plan identified as number
of strategic development corridors across the region. Northumberland falls into three of
these as shown on the figure below: the energy-related links to Blyth as well as routes up to
Scotland from Yorkshire.
Strategic development corridors
Source: TfN

Housing and economic growth options
Findings report
June 2018
C.2 Borderlands Initiative
Preparatory work32 for the group identified five key economic and social challenges:
¡ Low levels of productivity
¡ Low levels employment growth and entrepreneurialism
¡ A declining and ageing population
¡ Gaps in educational attainment and skills
¡ Poor transport links and digital connectivity
Five strategic objectives are identified, namely:
¡ Support regional economic development priorities to ensure the opportunities for
economic growth and prosperity across the Borderlands are maximised.
¡ Invest in infrastructure to improve accessibility and connectivity within the region,
and beyond to major centres of commercial opportunity.
¡ Attract additional private sector investment to the Borderlands.
¡ Grow the resident population with a focus on retaining and attracting young and
working age professionals.
¡ Promote and take advantage of the regions natural environment and resources.
32 ekos (December 2016) The Borderlands Inclusive Growth Initiative: ‘A Framework for Unlocking our Potential’
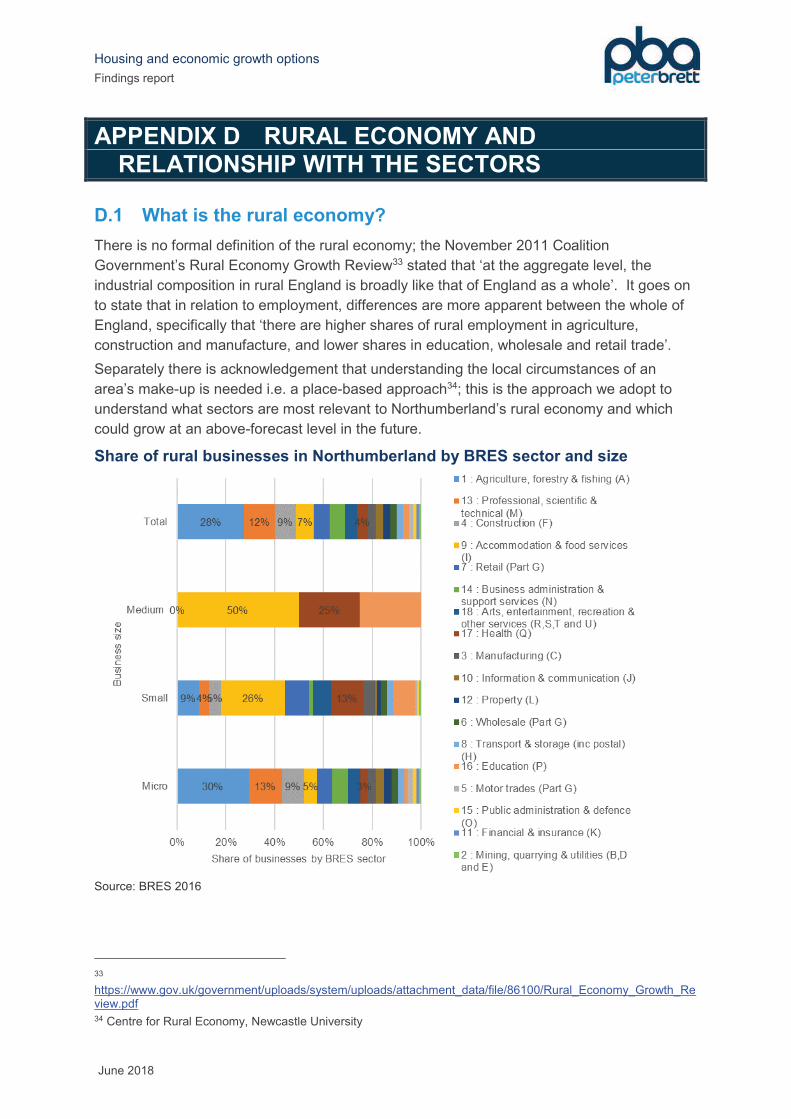
Housing and economic growth options
Findings report
June 2018
APPENDIX D RURAL ECONOMY AND
RELATIONSHIP WITH THE SECTORS
D.1 What is the rural economy?
There is no formal definition of the rural economy; the November 2011 Coalition
Government’s Rural Economy Growth Review33 stated that ‘at the aggregate level, the
industrial composition in rural England is broadly like that of England as a whole’. It goes on
to state that in relation to employment, differences are more apparent between the whole of
England, specifically that ‘there are higher shares of rural employment in agriculture,
construction and manufacture, and lower shares in education, wholesale and retail trade’.
Separately there is acknowledgement that understanding the local circumstances of an
area’s make-up is needed i.e. a place-based approach34; this is the approach we adopt to
understand what sectors are most relevant to Northumberland’s rural economy and which
could grow at an above-forecast level in the future.
Share of rural businesses in Northumberland by BRES sector and size
Source: BRES 2016
33 https://www.gov.uk/government/uploads/system/uploads/attachment_data/file/86100/Rural_Economy_Growth_Review.pdf 34 Centre for Rural Economy, Newcastle University
Housing and economic growth options
Findings report
June 2018
The figure above draws on BRES data to show the shares of businesses by BRES sector in
Northumberland. This shows that in overall terms, agriculture, forestry and fishing has the
greatest share of rural businesses but that the majority of these businesses have fewer than
10 employees (micro businesses). The same holds true for professional, scientific and
technical as the second largest sector by share. Accommodation and food services account
for less than 10% of overall businesses but they are typically larger businesses employing
between 10-50 people (small) or between 50-250 people (medium).
D.2 What does this mean for Northumberland?
With the above analysis in mind, and with reference to the current economic strategy’s aim of
growth the rural economy, tourism and port-related activities, the table below summarises the
sectors which might grow above at an above trend level. These inform our bespoke
forecasts.
Growth sectors in Northumberland
SIC category
Detailed Experian sector Relevance to Northumberland
A Agriculture, forestry and fishing Job growth is expected in forestry. This follows on from discussions with local stakeholders (January 2018) which indicate scope for above trend growth.
C Food, drink and tobacco Manufacturing sectors where Northumberland performs well relative to elsewhere and which have the potential to exceed the baseline forecast growth because of overspill from adjoining authorities (this would be subject to duty to co-operate discussions), as well as accessibility improvements (A1 dualling and Blyth Ashington rail line)
C Wood and paper
C Printing and reproduction of recorded media
C Chemicals
C Pharmaceuticals
C Rubber, plastic and other non-metallic mineral products
C Computer and electronic products
C Other manufacturing
D/E Utilities Includes port-related activities and renewable energies which have benefited from recent Enterprise Zone status at Blyth and are likely to exceed forecast growth.
H Land transport, storage and post Not currently a significant sector but long-term improvements in transport infrastructure may mean there is some potential for growth above trend.
I Accommodation and food services Tourist-related activities which, with appropriate policy support, could grow above trend
R Recreation
J Computing and information services Broadband improvements as part of the Borderlands Digital Improvement Scheme to accelerate access to superfast broadband and 4G mobile phone technology likely to result in above-trend growth.
M Professional services This sector includes R&D which, in conjunction with port-related activities and displacement from neighbouring areas, has the potential to grow above trend.
B Extraction and mining Not sectors in which Northumberland performs strongly relative to elsewhere; and little evidence to
C Textiles and clothing
C Fuel refining

Housing and economic growth options
Findings report
June 2018
SIC category
Detailed Experian sector Relevance to Northumberland
C Metal products support above trend growth as a consequence also of national trends C Machinery and equipment
C Transport equipment
F Construction of buildings
F Civil engineering
F Specialised construction activities
G Wholesale
G Retail
H Air and water transport
K Finance
J Media activities
J Telecoms
K Insurance and pensions
L Real estate
N Administrative and supportive service activities
S Other private services
O Public administration and defence
P Education
Q Health
Q Residential care and social work

Housing and economic growth options
Findings report
June 2018
APPENDIX E BUSINESS AS USUAL SCENARIO
Industry Variable Name 2014 2015 2016 2017 2018 2019 2020 2021 2022 2023 2024 2025 2026 2027 2028 2029 2030 2031 2032 2033 2034 2035 2036 2037
Northumberland Labour Force 160.80 157.90 157.60 155.60 155.70 155.60 155.60 155.50 155.40 155.20 155.10 155.00 155.20 155.50 155.80 155.90 155.90 155.90 155.90 156.10 156.40 156.60 156.90 157.40
Northumberland Labour Force - 16 to 64 154.40 151.00 150.90 148.60 148.40 148.00 147.70 147.20 146.80 146.20 145.70 145.10 144.70 144.20 143.70 143.20 142.70 142.30 142.00 141.90 142.00 142.10 142.20 142.50
Northumberland Labour Force - 65 Plus 6.30 6.80 6.70 7.00 7.30 7.60 7.90 8.20 8.60 9.00 9.40 9.90 10.50 11.30 12.10 12.70 13.20 13.60 13.90 14.20 14.40 14.50 14.80 14.90
Northumberland Population - retired 77.30 76.60 76.50 77.20 77.90 78.10 77.00 77.90 79.60 81.30 83.20 85.10 86.20 85.80 85.80 87.40 89.20 91.10 92.90 94.30 95.70 96.80 97.80 98.60
Northumberland Population - student 52.60 52.20 52.00 51.90 51.90 51.80 51.70 51.60 51.50 51.40 51.00 50.80 50.40 50.10 49.70 49.40 49.20 49.10 48.90 48.80 48.60 48.40 48.20 48.00
Northumberland Population - 16 Plus 263.40 263.90 264.30 264.70 265.10 265.60 266.20 266.70 267.30 267.90 268.60 269.20 269.90 270.60 271.20 271.70 272.00 272.30 272.60 272.90 273.20 273.50 273.70 273.80
Northumberland Population - 16 to 64 192.30 191.10 189.80 188.70 187.50 186.30 185.40 184.20 183.10 181.70 180.40 179.10 177.90 176.60 175.40 173.90 172.30 171.00 169.80 168.90 168.10 167.40 166.60 166.00
Northumberland Population - 65 Plus 71.10 72.80 74.50 76.10 77.60 79.30 80.80 82.50 84.20 86.20 88.20 90.10 92.00 93.90 95.80 97.80 99.70 101.30 102.80 104.00 105.10 106.10 107.10 107.80
Northumberland Total Population 316.00 316.00 316.30 316.60 317.00 317.40 317.90 318.30 318.80 319.20 319.60 320.00 320.30 320.60 320.90 321.10 321.30 321.40 321.60 321.70 321.80 321.90 321.90 321.90
Northumberland Working Age Population 186.10 187.30 187.90 187.50 187.20 187.50 189.20 188.80 187.80 186.60 185.40 184.10 183.70 184.80 185.40 184.30 182.80 181.20 179.80 178.60 177.60 176.70 175.90 175.20
Northumberland Economic Activity Rate (%) - 16+ 61.00 59.80 59.60 58.80 58.70 58.60 58.40 58.30 58.10 57.90 57.70 57.60 57.50 57.50 57.40 57.40 57.30 57.20 57.20 57.20 57.20 57.30 57.30 57.50
Northumberland Economic Activity Rate (%) - 16 to 64 80.30 79.10 79.50 78.80 79.10 79.40 79.70 79.90 80.20 80.50 80.70 81.00 81.30 81.60 82.00 82.40 82.80 83.20 83.60 84.00 84.50 84.90 85.40 85.80
Northumberland Economic Activity Rate (%) - 65 Plus 8.90 9.40 9.00 9.20 9.40 9.60 9.80 10.00 10.20 10.40 10.70 11.00 11.40 12.00 12.60 13.00 13.20 13.40 13.60 13.60 13.70 13.70 13.80 13.80
Northumberland Economic Activity Rate (%) - Working Age 86.40 84.30 83.90 83.00 83.20 83.00 82.20 82.30 82.80 83.20 83.60 84.20 84.50 84.20 84.00 84.60 85.30 86.00 86.70 87.40 88.10 88.60 89.20 89.80
Northumberland Employment rate (%) 56.80 55.90 56.20 56.00 55.80 55.60 55.40 55.30 55.30 55.30 55.10 55.00 54.90 54.80 54.80 54.70 54.70 54.60 54.50 54.50 54.60 54.60 54.60 54.70
Northumberland Productivity 32.20 33.50 33.10 33.60 34.00 34.60 35.10 35.60 36.20 37.00 37.70 38.40 39.00 39.60 40.10 40.50 41.10 41.70 42.20 42.70 43.20 43.70 44.20 44.70
Northumberland Total GVA 4819.80 4939.70 4926.50 4984.10 5034.00 5103.50 5174.00 5253.00 5356.70 5474.80 5584.20 5683.20 5778.90 5870.90 5954.60 6029.20 6107.50 6193.30 6279.50 6361.90 6443.40 6526.00 6610.00 6691.50
Northumberland Workforce Jobs 122.60 125.50 124.00 124.50 124.50 124.50 124.60 124.60 124.90 125.30 125.60 125.80 126.10 126.60 127.10 127.50 127.80 128.10 128.40 128.70 129.00 129.30 129.50 129.80
Northumberland Jobs Demand 122.60 125.50 124.00 124.50 124.50 124.50 124.60 124.60 124.90 125.30 125.60 125.80 126.10 126.60 127.20 127.60 127.90 128.20 128.40 128.70 129.00 129.30 129.50 129.80
Northumberland Excess Jobs 0.00 0.00 0.00 0.00 0.00 0.00 0.00 0.00 0.00 0.00 0.00 0.00 0.00 0.00 0.10 0.10 0.10 0.10 0.10 0.00 0.00 0.00 0.00 0.00
Northumberland FTE jobs 93.40 94.40 94.40 95.30 95.40 95.70 96.00 96.30 96.70 97.00 97.30 97.50 97.80 97.90 98.00 97.90 97.90 98.00 98.00 98.10 98.20 98.30 98.40 98.50
Northumberland Workplace based employment 127.80 130.20 131.30 130.90 131.00 130.70 130.50 130.40 130.60 130.90 131.10 131.20 131.40 131.70 132.10 132.40 132.60 132.70 132.80 133.10 133.30 133.50 133.80 134.10
Northumberland Residence based employment 149.70 147.50 148.60 148.20 148.00 147.70 147.40 147.40 147.80 148.00 148.10 148.10 148.10 148.30 148.50 148.70 148.70 148.70 148.70 148.80 149.10 149.30 149.50 149.80
Northumberland Net Commuting (inflow) -22.00 -17.30 -17.30 -17.30 -17.00 -17.00 -17.00 -17.10 -17.20 -17.10 -17.00 -16.90 -16.70 -16.60 -16.50 -16.30 -16.10 -16.00 -15.90 -15.80 -15.70 -15.70 -15.70 -15.70
Northumberland Unemployment 11.00 10.30 8.90 7.40 7.70 7.90 8.10 8.00 7.60 7.20 7.00 6.90 7.10 7.20 7.30 7.20 7.20 7.20 7.20 7.30 7.30 7.40 7.40 7.60
Northumberland Unemployment Rate (%) 6.80 6.50 5.70 4.80 4.90 5.10 5.20 5.20 4.90 4.60 4.50 4.50 4.60 4.60 4.70 4.60 4.60 4.60 4.60 4.70 4.70 4.70 4.70 4.80
United Kingdom Workforce Jobs 33443.00 33961.00 34509.80 34906.30 35006.40 35141.70 35309.40 35492.60 35745.90 36013.30 36238.20 36440.60 36656.80 36887.90 37131.70 37372.60 37581.20 37785.80 37984.10 38180.10 38379.30 38577.50 38773.10 38972.70
United Kingdom Productivity 52.20 52.50 52.70 53.00 53.50 54.40 55.30 56.20 57.30 58.50 59.70 60.80 61.80 62.70 63.60 64.50 65.50 66.50 67.50 68.50 69.50 70.50 71.50 72.50
United Kingdom Employment rate (%) 58.60 59.20 59.60 59.90 59.80 59.60 59.40 59.30 59.40 59.40 59.30 59.20 59.20 59.10 59.10 59.10 59.00 59.00 58.90 58.80 58.80 58.80 58.80 58.80
Northumberland Agriculture, Forestry & Fishing Workforce Jobs 4.7 4.1 3.5 3.2 3.2 3.1 3.1 3.1 3.1 3.0 3.0 3.0 3.0 3.0 3.0 3.0 3.0 3.0 3.0 3.0 3.0 3.0 3.0 3.0
Northumberland Extraction & Mining Workforce Jobs 0.5 0.4 0.3 0.3 0.3 0.3 0.3 0.3 0.3 0.3 0.3 0.3 0.3 0.3 0.3 0.3 0.3 0.3 0.3 0.3 0.3 0.3 0.2 0.2
Northumberland Food, Drink & Tobacco Workforce Jobs 1.5 1.6 1.6 1.6 1.6 1.6 1.6 1.6 1.6 1.6 1.6 1.5 1.5 1.5 1.5 1.5 1.5 1.5 1.5 1.5 1.5 1.5 1.5 1.5
Northumberland Textiles & Clothing Workforce Jobs 0.2 0.2 0.2 0.2 0.2 0.2 0.2 0.2 0.2 0.2 0.2 0.2 0.2 0.2 0.2 0.2 0.2 0.2 0.2 0.2 0.1 0.1 0.1 0.1
Northumberland Wood & Paper Workforce Jobs 1.9 2.0 2.1 2.1 2.1 2.0 2.0 1.9 1.9 1.8 1.8 1.8 1.7 1.7 1.7 1.6 1.6 1.6 1.5 1.5 1.5 1.4 1.4 1.4
Northumberland Printing and Reproduction of Recorded Media Workforce Jobs 0.7 0.7 0.7 0.7 0.7 0.7 0.7 0.7 0.6 0.6 0.6 0.6 0.6 0.6 0.6 0.6 0.5 0.5 0.5 0.5 0.5 0.5 0.4 0.4
Northumberland Fuel Refining Workforce Jobs 0.0 0.0 0.0 0.0 0.0 0.0 0.0 0.0 0.0 0.0 0.0 0.0 0.0 0.0 0.0 0.0 0.0 0.0 0.0 0.0 0.0 0.0 0.0 0.0
Northumberland Chemicals Workforce Jobs 1.0 1.0 1.0 1.0 1.0 1.0 1.0 1.0 1.0 1.0 1.0 1.0 1.0 1.0 1.0 0.9 0.9 0.9 0.9 0.9 0.9 0.9 0.9 0.9
Northumberland Pharmaceuticals Workforce Jobs 0.9 0.9 0.8 1.0 1.0 1.0 1.0 1.0 1.0 1.0 1.0 1.0 1.0 1.0 1.0 1.0 1.0 1.1 1.1 1.1 1.1 1.1 1.1 1.1
Northumberland Rubber, Plastic and Other Non-Metallic Mineral Products Workforce Jobs 1.6 1.7 1.6 1.6 1.6 1.5 1.5 1.5 1.5 1.5 1.5 1.5 1.5 1.5 1.4 1.4 1.4 1.4 1.4 1.4 1.4 1.4 1.4 1.4
Northumberland Metal Products Workforce Jobs 1.0 1.0 0.9 0.9 0.9 0.9 0.9 0.9 0.9 0.8 0.8 0.8 0.8 0.8 0.8 0.8 0.8 0.8 0.8 0.7 0.7 0.7 0.7 0.7
Northumberland Computer & Electronic Products Workforce Jobs 1.3 1.4 1.3 1.3 1.3 1.3 1.3 1.2 1.2 1.2 1.2 1.2 1.2 1.2 1.2 1.2 1.2 1.2 1.2 1.1 1.1 1.1 1.1 1.1
Northumberland Machinery & Equipment Workforce Jobs 1.1 1.1 1.0 1.1 1.0 1.0 1.0 1.0 1.0 1.0 1.0 1.0 1.0 0.9 0.9 0.9 0.9 0.9 0.9 0.8 0.8 0.8 0.8 0.8
Northumberland Transport Equipment Workforce Jobs 0.3 0.3 0.3 0.3 0.3 0.3 0.3 0.3 0.3 0.3 0.3 0.3 0.3 0.3 0.3 0.3 0.2 0.2 0.2 0.2 0.2 0.2 0.2 0.2
Northumberland Other Manufacturing Workforce Jobs 1.2 1.3 1.5 1.5 1.5 1.5 1.5 1.5 1.4 1.4 1.4 1.4 1.4 1.3 1.3 1.3 1.3 1.3 1.3 1.3 1.3 1.3 1.3 1.3
Northumberland Utilities Workforce Jobs 1.5 1.6 1.6 1.7 1.7 1.7 1.7 1.7 1.7 1.8 1.8 1.8 1.8 1.8 1.8 1.9 1.9 1.9 1.9 1.9 1.9 1.9 1.9 1.9
Northumberland Construction of Buildings Workforce Jobs 3.0 3.4 3.5 3.6 3.6 3.6 3.6 3.6 3.6 3.6 3.6 3.6 3.6 3.6 3.6 3.6 3.6 3.6 3.5 3.5 3.5 3.5 3.5 3.5
Northumberland Civil Engineering Workforce Jobs 0.8 0.7 0.7 0.7 0.7 0.7 0.7 0.7 0.7 0.7 0.7 0.7 0.7 0.7 0.7 0.7 0.7 0.7 0.7 0.7 0.7 0.7 0.7 0.7
Northumberland Specialised Construction Activities Workforce Jobs 4.6 4.6 4.7 4.8 4.8 4.8 4.8 4.9 4.9 4.9 4.9 4.9 5.0 5.0 5.0 5.0 5.0 5.0 5.0 5.0 5.0 5.0 5.0 5.0
Northumberland Wholesale Workforce Jobs 5.4 5.4 5.4 5.4 5.4 5.4 5.5 5.4 5.4 5.4 5.4 5.4 5.4 5.4 5.4 5.4 5.4 5.4 5.4 5.4 5.4 5.4 5.4 5.4
Northumberland Retail Workforce Jobs 13.8 13.5 13.0 12.7 12.6 12.6 12.5 12.5 12.5 12.5 12.5 12.4 12.4 12.4 12.4 12.4 12.4 12.4 12.4 12.3 12.3 12.3 12.3 12.3
Northumberland Land Transport, Storage & Post Workforce Jobs 4.1 4.0 4.1 4.0 4.0 4.0 4.0 4.0 4.0 4.0 3.9 3.9 4.0 4.0 4.0 4.0 4.0 4.0 4.0 4.0 4.0 4.1 4.1 4.1
Northumberland Air & Water Transport Workforce Jobs 0.1 0.1 0.1 0.1 0.1 0.1 0.1 0.1 0.1 0.1 0.1 0.1 0.1 0.1 0.1 0.1 0.1 0.1 0.1 0.1 0.1 0.1 0.1 0.1
Northumberland Accomodation & Food Services Workforce Jobs 10.4 11.5 10.9 11.7 11.7 11.8 11.9 11.9 12.0 12.1 12.1 12.1 12.2 12.2 12.3 12.3 12.3 12.3 12.4 12.4 12.4 12.4 12.4 12.4
Northumberland Recreation Workforce Jobs 4.6 4.5 4.5 4.6 4.7 4.7 4.7 4.7 4.8 4.8 4.8 4.8 4.9 4.9 4.9 5.0 5.0 5.0 5.1 5.1 5.1 5.2 5.2 5.2
Northumberland Media Activities Workforce Jobs 0.6 0.6 0.6 0.6 0.6 0.6 0.6 0.6 0.6 0.6 0.6 0.6 0.6 0.6 0.6 0.6 0.6 0.6 0.6 0.6 0.6 0.6 0.6 0.6
Northumberland Telecoms Workforce Jobs 0.2 0.1 0.1 0.1 0.1 0.1 0.1 0.1 0.1 0.1 0.1 0.1 0.1 0.1 0.1 0.1 0.1 0.1 0.1 0.1 0.1 0.1 0.1 0.1
Northumberland Computing & Information Services Workforce Jobs 0.9 1.0 1.0 1.1 1.1 1.1 1.1 1.1 1.1 1.1 1.1 1.1 1.1 1.1 1.1 1.1 1.2 1.2 1.2 1.2 1.2 1.2 1.2 1.2
Northumberland Finance Workforce Jobs 1.0 1.0 1.0 1.0 1.0 1.0 1.0 1.0 1.0 1.0 1.0 1.0 1.0 1.0 1.0 1.0 1.0 1.0 1.0 1.0 1.0 1.0 1.0 1.0
Northumberland Insurance & Pensions Workforce Jobs 0.0 0.0 0.0 0.0 0.0 0.0 0.0 0.0 0.0 0.0 0.0 0.0 0.0 0.0 0.0 0.0 0.0 0.0 0.0 0.0 0.0 0.0 0.0 0.0
Northumberland Real Estate Workforce Jobs 2.0 2.0 2.0 2.0 2.0 2.1 2.1 2.1 2.1 2.1 2.1 2.2 2.2 2.2 2.2 2.2 2.2 2.3 2.3 2.3 2.3 2.3 2.3 2.4
Northumberland Professional Services Workforce Jobs 6.6 8.0 8.0 7.6 7.7 7.7 7.7 7.7 7.8 7.8 7.9 7.9 8.0 8.1 8.1 8.2 8.3 8.3 8.4 8.5 8.6 8.6 8.7 8.8
Northumberland Administrative & Supportive Service Activities Workforce Jobs 5.9 6.1 6.3 6.7 6.7 6.8 6.8 6.8 6.8 6.9 6.9 6.9 7.0 7.0 7.1 7.1 7.2 7.3 7.3 7.4 7.5 7.5 7.6 7.7
Northumberland Other Private Services Workforce Jobs 3.8 4.1 4.4 4.2 4.2 4.2 4.2 4.2 4.2 4.2 4.2 4.2 4.2 4.3 4.3 4.3 4.3 4.3 4.3 4.3 4.3 4.3 4.3 4.3
Northumberland Public Administration & Defence Workforce Jobs 5.5 4.8 4.6 4.5 4.3 4.2 4.1 4.0 4.0 3.9 3.9 3.8 3.7 3.7 3.6 3.6 3.5 3.5 3.4 3.4 3.3 3.3 3.2 3.2
Northumberland Education Workforce Jobs 9.7 10.7 10.7 10.8 10.8 10.8 10.8 10.8 10.9 10.9 11.0 11.0 11.1 11.1 11.2 11.2 11.3 11.3 11.4 11.4 11.4 11.5 11.5 11.5
Northumberland Health Workforce Jobs 11.1 11.1 11.2 11.3 11.3 11.3 11.4 11.5 11.6 11.6 11.7 11.8 11.9 12.0 12.1 12.2 12.3 12.4 12.5 12.6 12.7 12.8 12.9 13.0
Northumberland Residential Care & Social Work Workforce Jobs 9.2 9.0 8.8 8.6 8.7 8.8 8.9 9.0 9.2 9.4 9.5 9.6 9.8 10.0 10.1 10.3 10.4 10.6 10.7 10.8 10.9 11.0 11.1 11.2

Industry Variable Name 2014 2015 2016 2017 2018 2019 2020 2021 2022 2023 2024 2025 2026 2027 2028 2029 2030 2031 2032 2033 2034 2035 2036 2037
Northumberland Agriculture, Forestry & Fishing GVA 237.8 234.3 217.8 220.4 223.6 225.9 226.8 227.4 229.2 231.3 232.7 233.6 234.4 235.1 235.4 235.1 235.0 235.1 235.1 234.8 234.5 234.0 233.6 233.1
Northumberland Extraction & Mining GVA 52.5 48.8 34.7 33.8 33.7 33.9 33.7 33.7 33.8 33.9 33.9 33.8 33.6 33.4 33.1 32.7 32.3 31.8 31.3 30.7 30.0 29.2 28.5 27.8
Northumberland Food, Drink & Tobacco GVA 75.9 80.3 80.6 81.5 81.6 82.3 82.8 83.1 83.5 84.0 84.5 84.8 85.1 85.2 85.2 85.1 84.9 84.9 84.8 84.6 84.4 84.3 84.1 83.8
Northumberland Textiles & Clothing GVA 5.3 5.5 5.2 5.7 5.8 5.9 5.9 6.0 6.0 6.1 6.1 6.2 6.2 6.3 6.3 6.3 6.4 6.4 6.5 6.5 6.5 6.6 6.6 6.6
Northumberland Wood & Paper GVA 75.4 80.4 80.2 85.7 86.2 86.6 86.6 86.1 85.7 85.5 85.2 84.7 84.2 83.7 83.2 82.6 82.1 81.5 80.9 80.2 79.5 78.7 77.9 77.1
Northumberland Printing and Reproduction of Recorded Media GVA 15.6 17.4 18.1 18.1 18.1 18.2 18.2 18.1 18.1 18.1 18.1 18.1 18.0 17.8 17.7 17.6 17.4 17.2 17.0 16.8 16.5 16.3 16.0 15.7
Northumberland Fuel Refining GVA 4.7 4.9 4.7 4.8 4.8 4.8 4.7 4.7 4.6 4.6 4.6 4.5 4.5 4.4 4.4 4.4 4.3 4.3 4.2 4.2 4.1 4.0 3.9 3.9
Northumberland Chemicals GVA 58.4 61.1 58.2 61.5 63.0 64.3 65.1 65.7 66.2 66.6 67.0 67.2 67.3 67.4 67.4 67.3 67.2 67.1 67.1 66.9 66.8 66.6 66.4 66.2
Northumberland Pharmaceuticals GVA 175.7 178.4 183.9 176.3 181.1 185.0 188.2 191.7 196.2 201.0 204.9 208.6 212.5 216.7 220.9 224.8 228.9 233.2 237.5 241.5 245.5 249.4 253.3 256.9
Northumberland Rubber, Plastic and Other Non-Metallic Mineral Products GVA 77.7 83.1 85.7 85.7 86.7 88.6 90.0 91.4 93.2 95.2 96.9 98.9 100.9 102.7 104.2 105.5 106.9 108.5 110.0 111.5 113.0 114.4 115.9 117.2
Northumberland Metal Products GVA 39.1 38.1 36.2 36.4 36.6 37.1 37.5 37.7 38.0 38.3 38.7 39.0 39.3 39.5 39.8 40.0 40.3 40.5 40.7 40.8 40.9 40.9 40.9 40.8
Northumberland Computer & Electronic Products GVA 49.1 51.3 50.7 52.6 53.7 54.6 55.4 56.3 57.4 58.8 59.8 60.7 61.6 62.5 63.4 64.4 65.4 66.4 67.2 67.8 68.5 69.0 69.7 70.4
Northumberland Machinery & Equipment GVA 61.1 55.8 55.4 58.6 59.7 62.2 63.9 65.7 67.8 70.1 72.0 73.5 74.8 75.8 76.9 77.8 78.8 79.9 81.1 82.2 83.2 84.2 85.3 86.4
Northumberland Transport Equipment GVA 14.3 14.6 14.5 14.8 15.0 15.4 15.8 16.0 16.3 16.6 16.9 17.0 17.1 17.1 17.1 17.2 17.3 17.3 17.4 17.5 17.5 17.6 17.7 17.8
Northumberland Other Manufacturing GVA 42.1 43.8 46.0 47.5 48.0 48.8 49.5 50.1 50.6 51.3 51.9 52.3 52.7 53.1 53.4 53.7 54.1 54.4 54.7 54.9 55.0 55.2 55.2 55.2
Northumberland Utilities GVA 134.0 141.8 145.8 146.1 147.8 150.3 152.4 154.5 156.6 158.8 160.5 162.2 163.8 165.3 166.5 167.4 168.3 169.2 170.0 170.5 170.8 171.0 171.0 170.9
Northumberland Construction of Buildings GVA 174.2 182.9 185.2 186.9 188.0 191.0 194.5 198.1 202.1 206.7 211.0 214.7 217.9 220.5 222.5 224.1 225.6 227.2 228.9 230.4 232.0 233.6 235.2 236.7
Northumberland Civil Engineering GVA 68.0 67.6 66.4 67.0 67.6 68.9 70.2 71.5 72.9 74.5 76.0 77.5 79.0 80.4 81.7 82.9 84.0 85.2 86.5 87.6 88.8 89.9 91.1 92.2
Northumberland Specialised Construction Activities GVA 128.3 132.4 132.2 133.4 134.2 135.9 138.3 141.0 144.0 147.5 150.7 153.7 156.6 159.4 161.8 164.0 166.3 168.7 171.2 173.5 175.9 178.4 180.9 183.4
Northumberland Wholesale GVA 207.5 217.6 223.6 227.5 229.3 232.3 236.3 240.8 246.7 253.5 260.3 266.4 272.2 277.2 280.9 283.6 286.1 288.9 291.6 294.2 296.7 299.3 302.0 304.4
Northumberland Retail GVA 322.8 335.3 340.5 345.9 350.1 355.4 360.9 368.2 378.0 387.5 395.6 403.2 410.9 418.9 426.7 434.1 441.7 449.8 458.0 465.8 473.5 481.5 489.3 496.7
Northumberland Land Transport, Storage & Post GVA 139.2 138.5 133.8 134.9 135.5 136.8 138.0 139.8 142.6 145.6 148.3 150.6 152.6 154.5 156.2 157.7 159.2 160.9 162.6 164.2 165.7 167.3 168.9 170.4
Northumberland Air & Water Transport GVA 5.0 5.7 6.1 6.0 6.1 6.1 6.2 6.3 6.4 6.6 6.8 6.9 7.0 7.2 7.3 7.5 7.7 7.9 8.1 8.3 8.5 8.7 9.0 9.2
Northumberland Accomodation & Food Services GVA 186.1 192.5 196.9 205.0 207.7 210.4 212.2 214.4 218.2 222.9 227.1 230.5 233.8 236.9 239.3 241.3 243.4 245.9 248.4 250.8 253.1 255.4 257.7 259.7
Northumberland Recreation GVA 89.0 82.0 78.3 79.8 80.8 81.9 83.3 84.9 87.0 89.4 91.6 93.4 95.2 96.8 98.2 99.6 101.1 102.7 104.4 106.1 107.8 109.5 111.3 113.1
Northumberland Media Activities GVA 20.8 23.9 25.3 26.4 27.1 27.7 28.5 29.4 30.6 32.1 33.4 34.6 35.7 36.7 37.7 38.7 39.7 40.8 42.0 43.1 44.2 45.4 46.6 47.7
Northumberland Telecoms GVA 12.9 11.9 10.4 10.1 10.3 10.5 10.9 11.4 11.9 12.6 13.2 13.8 14.4 14.9 15.3 15.8 16.4 16.9 17.4 18.0 18.6 19.2 19.8 20.3
Northumberland Computing & Information Services GVA 35.3 37.4 40.1 40.1 41.0 42.0 42.9 43.9 45.4 47.3 48.9 50.3 51.7 53.1 54.4 55.8 57.3 58.9 60.5 62.1 63.8 65.5 67.3 69.0
Northumberland Finance GVA 63.2 60.2 60.0 60.0 60.1 60.4 61.3 62.4 64.0 65.9 67.7 69.3 70.8 72.1 73.5 75.0 76.6 78.4 80.4 82.5 84.7 87.0 89.4 91.8
Northumberland Insurance & Pensions GVA 3.2 3.1 3.1 3.0 3.0 2.9 2.9 2.9 2.9 2.9 2.9 2.9 2.8 2.8 2.8 2.8 2.7 2.7 2.7 2.7 2.6 2.6 2.6 2.5
Northumberland Real Estate GVA 745.1 750.5 740.7 744.2 748.5 756.6 764.7 774.0 785.9 799.7 813.4 826.0 838.5 850.4 860.4 868.0 876.0 885.1 893.2 900.4 907.3 914.4 921.9 929.6
Northumberland Professional Services GVA 189.7 215.5 228.7 235.3 239.1 243.4 247.2 251.2 257.6 265.5 273.5 280.7 287.0 293.1 298.9 304.9 311.8 319.7 328.2 337.0 346.1 355.5 365.2 375.0
Northumberland Administrative & Supportive Service Activities GVA 124.7 136.2 139.4 144.8 148.4 151.9 156.3 161.4 167.5 174.4 181.3 187.8 194.3 200.7 207.2 213.9 220.9 228.4 236.1 244.0 252.1 260.5 269.3 278.2
Northumberland Other Private Services GVA 100.6 99.0 102.7 103.1 103.6 104.7 105.6 106.8 108.6 110.6 112.2 113.3 114.3 115.4 116.4 117.2 117.9 118.8 119.8 120.7 121.6 122.4 123.2 123.9
Northumberland Public Administration & Defence GVA 260.0 240.1 222.6 217.7 212.9 209.9 208.1 206.2 205.4 205.2 204.7 203.7 202.6 201.3 199.7 197.8 195.9 194.3 192.6 190.7 188.7 186.8 184.8 182.7
Northumberland Education GVA 321.0 342.3 341.5 344.3 346.5 349.6 352.6 355.9 361.0 366.9 372.2 376.7 381.0 385.4 389.1 391.6 394.1 397.0 399.9 402.5 404.8 407.1 409.1 410.7
Northumberland Health GVA 366.6 387.0 394.7 402.2 410.2 420.1 432.7 447.0 463.6 482.1 500.7 519.2 538.0 557.2 576.1 594.7 614.1 634.6 655.5 676.3 697.4 718.8 740.7 762.6
Northumberland Residential Care & Social Work GVA 137.5 138.6 136.8 137.5 138.7 141.1 144.0 147.1 150.9 155.1 159.1 162.8 166.4 170.0 173.3 176.4 179.5 182.8 186.2 189.4 192.6 195.7 198.8 201.8
Northumberland Agriculture, Forestry & Fishing Productivity 50.1 56.7 62.8 69.2 70.5 72.2 73.2 74.0 74.9 75.9 76.6 77.2 77.7 78.1 78.3 78.3 78.4 78.5 78.6 78.6 78.6 78.6 78.6 78.6
Northumberland Extraction & Mining Productivity 114.0 112.8 106.8 110.7 115.0 116.1 115.8 116.5 117.1 118.2 118.9 119.9 120.2 120.7 120.9 120.7 120.7 120.5 120.1 119.3 118.1 116.9 115.6 114.3
Northumberland Food, Drink & Tobacco Productivity 50.7 49.6 51.4 52.2 52.1 52.3 52.5 53.0 53.5 53.9 54.4 54.9 55.3 55.5 55.7 55.7 55.8 55.9 56.1 56.1 56.2 56.3 56.4 56.4
Northumberland Textiles & Clothing Productivity 28.1 28.4 24.3 26.9 27.6 28.3 29.1 30.1 31.0 32.0 33.0 34.0 34.8 35.6 36.5 37.5 38.7 40.0 41.4 42.7 44.2 45.7 47.2 48.8
Northumberland Wood & Paper Productivity 38.9 40.6 38.3 41.2 41.6 42.5 43.6 44.5 45.3 46.3 47.3 48.2 48.9 49.7 50.4 51.0 51.8 52.6 53.3 53.9 54.6 55.2 55.7 56.2
Northumberland Printing and Reproduction of Recorded Media Productivity 22.8 25.0 27.8 26.7 26.9 27.2 27.4 27.8 28.1 28.5 28.8 29.3 29.9 30.4 30.9 31.5 32.1 32.8 33.5 34.2 35.0 35.8 36.7 37.5
Northumberland Fuel Refining Productivity 97.6 115.3 104.8 105.7 106.9 108.3 107.3 106.2 104.4 103.9 104.4 104.4 104.1 103.7 103.2 102.7 102.4 102.4 102.2 101.9 101.3 100.6 100.0 99.3
Northumberland Chemicals Productivity 61.1 63.8 60.2 62.2 63.0 64.0 64.5 65.3 66.3 67.1 67.9 68.6 69.4 70.0 70.6 71.1 71.7 72.5 73.2 73.9 74.5 75.2 75.9 76.5
Northumberland Pharmaceuticals Productivity 190.7 200.2 217.8 174.0 188.8 193.5 195.3 198.3 202.6 206.5 208.8 210.8 212.6 214.4 215.9 217.1 218.4 219.8 221.0 221.8 222.4 223.1 224.1 224.7
Northumberland Rubber, Plastic and Other Non-Metallic Mineral Products Productivity 48.5 50.1 54.0 54.8 55.7 57.5 59.1 60.7 62.4 64.2 65.8 67.5 69.3 70.8 72.1 73.1 74.4 75.8 77.4 78.9 80.2 81.7 83.2 84.5
Northumberland Metal Products Productivity 37.7 39.0 40.0 39.9 40.5 41.1 41.9 43.1 44.3 45.4 46.6 47.6 48.6 49.5 50.4 51.3 52.2 53.1 54.0 54.7 55.5 56.2 56.8 57.3
Northumberland Computer & Electronic Products Productivity 37.8 37.7 38.0 39.8 41.2 42.5 43.7 45.1 46.6 48.1 49.5 50.7 51.8 52.8 53.8 54.8 55.9 57.1 58.2 59.3 60.3 61.2 62.2 63.2
Northumberland Machinery & Equipment Productivity 55.4 50.1 54.4 55.7 58.3 60.5 62.4 65.1 68.0 71.1 73.7 76.0 78.5 81.1 83.7 86.3 89.0 91.8 94.6 97.3 100.0 102.7 105.5 108.4
Northumberland Transport Equipment Productivity 44.7 46.1 46.1 48.4 49.1 51.1 53.3 54.7 56.3 58.0 59.7 61.1 62.7 64.4 66.1 67.9 69.9 72.0 74.0 76.0 78.1 80.2 82.4 85.0
Northumberland Other Manufacturing Productivity 35.8 32.7 31.0 31.0 31.5 32.4 33.4 34.5 35.4 36.4 37.4 38.2 38.8 39.4 39.9 40.4 40.9 41.5 42.0 42.4 42.8 43.2 43.5 43.7
Northumberland Utilities Productivity 86.6 87.3 89.4 88.3 88.1 88.6 89.2 89.7 90.2 90.5 90.6 90.8 90.9 90.9 90.8 90.5 90.3 90.1 89.9 89.6 89.1 88.7 88.3 87.7
Northumberland Construction of Buildings Productivity 58.3 54.1 53.4 52.6 52.8 53.7 54.7 55.7 56.8 58.0 59.2 60.2 60.9 61.6 62.2 62.7 63.3 63.9 64.6 65.2 65.7 66.3 66.8 67.3
Northumberland Civil Engineering Productivity 84.2 92.3 91.0 91.1 91.5 93.1 95.0 97.0 99.0 101.2 103.2 105.0 106.8 108.7 110.4 112.1 114.0 116.0 118.0 119.8 121.5 123.3 125.0 126.4
Northumberland Specialised Construction Activities Productivity 28.1 28.8 28.0 27.5 27.8 28.1 28.6 29.1 29.6 30.1 30.7 31.1 31.6 32.0 32.4 32.8 33.3 33.8 34.3 34.7 35.2 35.6 36.1 36.5
Northumberland Wholesale Productivity 38.7 40.2 41.3 42.0 42.1 42.7 43.3 44.3 45.3 46.6 47.8 49.0 50.1 51.0 51.7 52.2 52.7 53.3 53.9 54.4 54.9 55.4 55.9 56.4
Northumberland Retail Productivity 23.4 24.9 26.2 27.3 27.7 28.3 28.8 29.5 30.2 31.0 31.7 32.4 33.1 33.8 34.4 35.0 35.6 36.3 37.0 37.7 38.4 39.1 39.8 40.5
Northumberland Land Transport, Storage & Post Productivity 33.9 34.2 32.6 33.3 33.7 34.2 34.7 35.3 36.0 36.8 37.6 38.2 38.6 39.0 39.3 39.5 39.8 40.1 40.5 40.7 41.0 41.3 41.6 41.8
Northumberland Air & Water Transport Productivity 85.2 82.0 75.4 74.3 75.5 76.5 77.8 79.2 81.9 84.6 86.9 88.8 90.5 92.1 93.9 95.8 97.9 100.3 102.8 105.3 108.0 110.6 113.2 115.8
Northumberland Accomodation & Food Services Productivity 17.9 16.7 18.0 17.5 17.7 17.8 17.9 18.0 18.2 18.5 18.8 19.0 19.2 19.4 19.5 19.6 19.8 19.9 20.1 20.3 20.4 20.6 20.8 21.0
Northumberland Recreation Productivity 19.4 18.1 17.5 17.3 17.2 17.4 17.6 17.9 18.2 18.7 19.0 19.3 19.6 19.8 19.9 20.1 20.3 20.5 20.7 20.9 21.1 21.3 21.5 21.6
Northumberland Media Activities Productivity 35.9 41.2 45.5 44.9 47.0 47.8 48.6 49.7 51.3 53.3 55.3 56.9 58.4 59.6 60.8 62.0 63.3 64.7 66.2 67.6 69.0 70.6 72.1 73.5
Northumberland Telecoms Productivity 84.2 85.3 77.6 74.2 74.8 76.8 79.8 83.4 87.6 92.3 97.2 101.7 106.0 109.5 113.1 116.7 120.7 124.9 129.0 133.1 137.3 141.6 145.7 149.4
Northumberland Computing & Information Services Productivity 37.3 37.7 38.8 37.6 38.4 39.0 39.6 40.5 41.7 43.1 44.3 45.3 46.2 47.1 47.9 48.6 49.5 50.5 51.4 52.3 53.2 54.1 55.1 55.9
Northumberland Finance Productivity 64.0 62.7 59.1 59.0 59.0 59.8 60.9 62.3 64.1 66.1 68.0 69.8 71.4 72.8 74.1 75.4 77.0 78.7 80.6 82.6 84.6 86.7 88.9 91.1
Northumberland Insurance & Pensions Productivity 267.7 259.0 255.6 255.7 257.5 259.5 261.9 265.4 268.5 272.0 275.7 278.4 280.8 281.6 281.8 282.5 283.4 284.5 285.1 285.4 285.9 286.3 286.6 286.4
Northumberland Real Estate Productivity 374.8 378.3 376.0 372.8 366.3 366.7 367.6 370.2 373.1 376.7 380.5 383.4 385.9 388.2 389.6 390.1 391.2 392.4 393.1 393.1 392.9 392.8 392.6 392.0
Northumberland Professional Services Productivity 28.8 27.0 28.6 30.9 31.1 31.6 32.1 32.5 33.2 33.9 34.7 35.3 35.8 36.3 36.7 37.1 37.7 38.3 39.1 39.8 40.5 41.2 41.9 42.6
Northumberland Administrative & Supportive Service Activities Productivity 21.2 22.4 22.2 21.7 22.0 22.5 23.1 23.8 24.6 25.5 26.3 27.1 27.9 28.6 29.2 29.9 30.6 31.4 32.2 33.0 33.8 34.6 35.5 36.3
Northumberland Other Private Services Productivity 26.2 24.3 23.4 24.7 24.6 24.8 25.0 25.3 25.6 26.1 26.4 26.7 26.9 27.1 27.3 27.4 27.5 27.7 27.9 28.0 28.2 28.3 28.4 28.5
Northumberland Public Administration & Defence Productivity 47.6 50.3 48.7 48.3 49.2 49.9 50.7 51.2 51.7 52.3 53.0 53.6 54.0 54.5 54.8 55.0 55.3 55.7 56.1 56.4 56.7 56.9 57.2 57.4
Northumberland Education Productivity 33.2 31.9 31.9 32.0 32.2 32.5 32.7 32.9 33.1 33.5 33.9 34.2 34.4 34.6 34.8 34.8 34.9 35.1 35.2 35.3 35.4 35.5 35.5 35.6
Northumberland Health Productivity 32.9 34.8 35.2 35.6 36.4 37.1 38.0 39.0 40.1 41.4 42.7 44.0 45.2 46.4 47.5 48.6 49.8 51.0 52.3 53.5 54.8 56.1 57.4 58.7
Northumberland Residential Care & Social Work Productivity 14.9 15.5 15.6 16.0 16.0 16.1 16.2 16.3 16.4 16.6 16.7 16.9 17.0 17.1 17.1 17.1 17.2 17.3 17.4 17.5 17.6 17.8 17.9 18.0

Housing and economic growth options
Findings report
June 2018
APPENDIX F AMBITIOUS GROWTH SCENARIO
Industry Variable Name 2014 2015 2016 2017 2018 2019 2020 2021 2022 2023 2024 2025 2026 2027 2028 2029 2030 2031 2032 2033 2034 2035 2036 2037
Northumberland Labour Force 160.80 157.90 157.90 156.80 157.20 157.20 157.90 159.10 160.90 163.00 165.10 165.70 165.90 166.10 166.40 166.60 166.70 166.70 166.70 166.80 167.00 167.10 167.30 167.50
Northumberland Labour Force - 16 to 64 154.40 151.00 151.20 149.80 149.90 149.60 150.00 150.80 152.30 154.00 155.60 155.80 155.40 154.80 154.40 153.90 153.50 153.00 152.70 152.60 152.60 152.60 152.50 152.70
Northumberland Labour Force - 65 Plus 6.30 6.80 6.70 7.00 7.30 7.60 7.90 8.20 8.60 9.00 9.40 9.90 10.50 11.30 12.10 12.70 13.20 13.60 14.00 14.20 14.40 14.50 14.80 14.90
Northumberland Population - retired 77.30 76.60 76.50 77.20 77.90 78.10 77.00 77.90 79.60 81.30 83.20 85.10 86.20 85.80 85.80 87.40 89.20 91.10 92.90 94.30 95.70 96.80 97.80 98.60
Northumberland Population - student 52.60 52.20 52.10 52.30 52.30 52.30 52.30 52.60 53.00 53.50 53.80 53.80 53.40 53.00 52.60 52.40 52.20 52.00 51.90 51.60 51.40 51.20 51.00 50.80
Northumberland Population - 16 Plus 263.40 263.90 264.80 266.50 267.20 267.70 269.20 271.60 275.00 278.70 282.50 284.20 284.80 285.30 285.90 286.40 286.70 286.90 287.00 287.20 287.40 287.40 287.50 287.50
Northumberland Population - 16 to 64 192.30 191.10 190.20 190.20 189.40 188.20 188.00 188.50 189.80 191.20 192.60 192.20 190.90 189.50 188.20 186.70 185.10 183.70 182.40 181.40 180.40 179.60 178.60 177.90
Northumberland Population - 65 Plus 71.10 72.80 74.60 76.30 77.90 79.50 81.20 83.10 85.20 87.60 89.90 92.00 93.90 95.80 97.70 99.70 101.60 103.20 104.60 105.80 106.90 107.80 108.90 109.50
Northumberland Total Population 316.00 316.00 316.90 318.80 319.50 320.00 321.60 324.20 328.00 332.30 336.40 338.00 338.20 338.30 338.50 338.70 338.90 338.90 338.90 338.90 338.80 338.60 338.50 338.20
Northumberland Working Age Population 186.10 187.30 187.90 187.50 187.20 187.50 189.20 188.80 187.80 186.60 185.40 184.10 183.70 184.80 185.40 184.30 182.80 181.20 179.80 178.60 177.60 176.70 175.90 175.20
Northumberland Economic Activity Rate (%) - 16+ 61.00 59.80 59.60 58.80 58.80 58.70 58.60 58.60 58.50 58.50 58.40 58.30 58.20 58.20 58.20 58.20 58.10 58.10 58.10 58.10 58.10 58.10 58.20 58.30
Northumberland Economic Activity Rate (%) - 16 to 64 80.30 79.10 79.50 78.80 79.20 79.50 79.80 80.00 80.30 80.50 80.80 81.10 81.40 81.70 82.00 82.50 82.90 83.30 83.70 84.20 84.60 85.00 85.40 85.80
Northumberland Economic Activity Rate (%) - 65 Plus 8.90 9.40 9.00 9.20 9.40 9.60 9.70 9.90 10.10 10.30 10.50 10.80 11.20 11.80 12.30 12.70 13.00 13.20 13.40 13.40 13.50 13.50 13.60 13.60
Northumberland Economic Activity Rate (%) - Working Age 86.40 84.30 83.90 83.00 83.20 83.10 82.30 82.50 82.90 83.30 83.70 84.30 84.50 84.20 84.10 84.70 85.40 86.10 86.90 87.60 88.20 88.70 89.20 89.80
Northumberland Employment rate (% of 16+ population) 56.80 55.90 56.30 55.90 56.00 56.00 55.90 55.90 55.80 55.80 55.70 55.60 55.50 55.50 55.50 55.50 55.40 55.40 55.40 55.40 55.40 55.40 55.50 55.60
Northumberland Productivity (£GVA per hour) 26.30 26.60 26.60 26.60 26.80 27.10 27.40 27.70 28.10 28.60 29.00 29.50 29.90 30.30 30.70 31.10 31.50 31.90 32.30 32.70 33.10 33.50 33.90 34.30
Northumberland Total GVA (£mn 2013 prices) 4819.80 4939.70 4937.30 5011.40 5082.90 5180.30 5288.00 5413.80 5575.00 5761.10 5946.50 6079.30 6179.60 6275.60 6362.70 6440.50 6522.40 6612.20 6702.20 6788.00 6872.70 6958.50 7046.00 7130.20
Northumberland Workforce Jobs 122.60 125.50 124.30 125.30 125.80 126.50 127.50 128.70 130.40 132.40 134.40 135.30 135.70 136.10 136.60 137.10 137.40 137.70 137.90 138.30 138.60 138.80 139.10 139.40
Northumberland Jobs Demand 122.70 125.60 124.30 125.30 125.80 126.50 127.50 128.70 130.40 132.40 134.40 135.30 135.70 136.10 136.60 137.10 137.40 137.70 137.90 138.30 138.60 138.80 139.10 139.40
Northumberland Excess Jobs 0.00 0.10 0.00 0.00 0.00 0.00 0.00 0.00 0.00 0.00 0.00 0.00 0.00 0.00 0.00 0.00 0.00 0.00 0.00 0.00 0.00 0.00 0.00 0.00
Northumberland FTE jobs 93.30 94.40 94.60 95.90 96.40 97.30 98.30 99.50 101.00 102.60 104.20 105.00 105.20 105.40 105.40 105.40 105.30 105.40 105.40 105.50 105.60 105.70 105.80 105.90
Northumberland Workplace based employment 127.80 130.20 131.60 131.70 132.30 132.80 133.50 134.70 136.40 138.30 140.30 141.10 141.30 141.60 142.00 142.30 142.50 142.60 142.70 143.00 143.20 143.40 143.60 144.00
Northumberland Residence based employment 149.70 147.50 149.00 149.10 149.60 149.90 150.60 151.70 153.50 155.50 157.40 158.10 158.10 158.30 158.60 158.90 158.90 158.90 159.00 159.10 159.20 159.30 159.50 159.70
Northumberland Net Commuting (inflow) -22.00 -17.30 -17.30 -17.30 -17.30 -17.10 -17.00 -17.10 -17.10 -17.10 -17.10 -16.90 -16.80 -16.70 -16.70 -16.60 -16.50 -16.30 -16.20 -16.10 -16.00 -15.90 -15.80 -15.70
Northumberland Unemployment 11.00 10.30 8.90 7.80 7.60 7.30 7.30 7.40 7.40 7.50 7.60 7.70 7.70 7.80 7.80 7.70 7.70 7.70 7.70 7.80 7.80 7.80 7.80 7.90
Northumberland Unemployment Rate (% of labour force) 6.80 6.50 5.70 5.00 4.80 4.70 4.60 4.60 4.60 4.60 4.60 4.60 4.70 4.70 4.70 4.60 4.60 4.60 4.60 4.70 4.70 4.70 4.70 4.70
Northumberland Agriculture, Forestry & Fishing Workforce Jobs 4.7 4.1 3.5 3.2 3.3 3.3 3.3 3.3 3.4 3.5 3.6 3.6 3.6 3.6 3.6 3.6 3.6 3.6 3.6 3.6 3.5 3.5 3.5 3.5
Northumberland Extraction & Mining Workforce Jobs 0.5 0.4 0.3 0.3 0.3 0.3 0.3 0.3 0.3 0.3 0.3 0.3 0.3 0.3 0.3 0.3 0.3 0.3 0.3 0.3 0.3 0.3 0.2 0.2
Northumberland Food, Drink & Tobacco Workforce Jobs 1.5 1.6 1.6 1.6 1.6 1.7 1.7 1.7 1.8 1.8 1.9 1.9 1.9 1.9 1.9 1.9 1.9 1.9 1.9 1.9 1.9 1.9 1.9 1.8
Northumberland Textiles & Clothing Workforce Jobs 0.2 0.2 0.2 0.2 0.2 0.2 0.2 0.2 0.2 0.2 0.2 0.2 0.2 0.2 0.2 0.2 0.2 0.2 0.2 0.2 0.1 0.1 0.1 0.1
Northumberland Wood & Paper Workforce Jobs 1.9 2.0 2.1 2.1 2.1 2.1 2.1 2.1 2.2 2.2 2.2 2.2 2.2 2.1 2.1 2.1 2.0 2.0 2.0 1.9 1.9 1.9 1.9 1.8
Northumberland Printing and Reproduction of Recorded Media Workforce Jobs 0.7 0.7 0.7 0.7 0.7 0.7 0.7 0.7 0.7 0.8 0.8 0.8 0.8 0.8 0.7 0.7 0.7 0.7 0.7 0.7 0.6 0.6 0.6 0.6
Northumberland Fuel Refining Workforce Jobs 0.0 0.0 0.0 0.0 0.0 0.0 0.0 0.0 0.0 0.0 0.0 0.0 0.0 0.0 0.0 0.0 0.0 0.0 0.0 0.0 0.0 0.0 0.0 0.0
Northumberland Chemicals Workforce Jobs 1.0 1.0 1.0 1.0 1.0 1.1 1.1 1.1 1.1 1.2 1.2 1.2 1.2 1.2 1.2 1.2 1.2 1.2 1.2 1.1 1.1 1.1 1.1 1.1
Northumberland Pharmaceuticals Workforce Jobs 0.9 0.9 0.9 1.0 1.0 1.0 1.0 1.1 1.1 1.1 1.2 1.2 1.2 1.2 1.2 1.3 1.3 1.3 1.3 1.3 1.3 1.3 1.3 1.4
Northumberland Rubber, Plastic and Other Non-Metallic Mineral Products Workforce Jobs 1.6 1.7 1.6 1.6 1.6 1.6 1.6 1.7 1.7 1.8 1.8 1.8 1.8 1.8 1.8 1.8 1.8 1.8 1.8 1.8 1.8 1.8 1.8 1.8
Northumberland Metal Products Workforce Jobs 1.0 1.0 0.9 0.9 0.9 0.9 0.9 0.9 0.9 0.8 0.8 0.8 0.8 0.8 0.8 0.8 0.8 0.8 0.8 0.7 0.7 0.7 0.7 0.7
Northumberland Computer & Electronic Products Workforce Jobs 1.3 1.4 1.3 1.3 1.3 1.4 1.4 1.4 1.4 1.5 1.5 1.5 1.5 1.5 1.5 1.5 1.5 1.5 1.5 1.5 1.4 1.4 1.4 1.4
Northumberland Machinery & Equipment Workforce Jobs 1.1 1.1 1.0 1.1 1.0 1.0 1.0 1.0 1.0 1.0 1.0 1.0 1.0 0.9 0.9 0.9 0.9 0.9 0.9 0.8 0.8 0.8 0.8 0.8
Northumberland Transport Equipment Workforce Jobs 0.3 0.3 0.3 0.3 0.3 0.3 0.3 0.3 0.3 0.3 0.3 0.3 0.3 0.3 0.3 0.3 0.2 0.2 0.2 0.2 0.2 0.2 0.2 0.2
Northumberland Other Manufacturing Workforce Jobs 1.2 1.3 1.5 1.6 1.6 1.6 1.6 1.6 1.6 1.6 1.7 1.7 1.6 1.6 1.6 1.6 1.6 1.6 1.6 1.6 1.6 1.6 1.6 1.6
Northumberland Utilities Workforce Jobs 1.5 1.6 1.6 1.7 1.7 1.8 1.8 1.9 1.9 2.0 2.1 2.1 2.2 2.2 2.2 2.2 2.2 2.2 2.3 2.3 2.3 2.3 2.3 2.3
Northumberland Construction of Buildings Workforce Jobs 3.0 3.4 3.5 3.6 3.6 3.6 3.6 3.6 3.6 3.6 3.6 3.6 3.6 3.6 3.6 3.6 3.6 3.6 3.5 3.5 3.5 3.5 3.5 3.5
Northumberland Civil Engineering Workforce Jobs 0.8 0.7 0.7 0.7 0.7 0.7 0.7 0.7 0.7 0.7 0.7 0.7 0.7 0.7 0.7 0.7 0.7 0.7 0.7 0.7 0.7 0.7 0.7 0.7
Northumberland Specialised Construction Activities Workforce Jobs 4.6 4.6 4.7 4.8 4.8 4.8 4.8 4.9 4.9 4.9 4.9 4.9 5.0 5.0 5.0 5.0 5.0 5.0 5.0 5.0 5.0 5.0 5.0 5.0
Northumberland Wholesale Workforce Jobs 5.4 5.4 5.4 5.4 5.4 5.4 5.5 5.4 5.4 5.4 5.4 5.4 5.4 5.4 5.4 5.4 5.4 5.4 5.4 5.4 5.4 5.4 5.4 5.4
Northumberland Retail Workforce Jobs 13.8 13.5 13.0 12.7 12.7 12.6 12.6 12.6 12.6 12.6 12.7 12.6 12.6 12.6 12.6 12.6 12.6 12.6 12.6 12.5 12.5 12.5 12.5 12.5
Northumberland Land Transport, Storage & Post Workforce Jobs 4.1 4.0 4.1 4.1 4.1 4.1 4.2 4.3 4.4 4.5 4.6 4.7 4.7 4.7 4.7 4.7 4.7 4.7 4.7 4.7 4.7 4.8 4.8 4.8
Northumberland Air & Water Transport Workforce Jobs 0.1 0.1 0.1 0.1 0.1 0.1 0.1 0.1 0.1 0.1 0.1 0.1 0.1 0.1 0.1 0.1 0.1 0.1 0.1 0.1 0.1 0.1 0.1 0.1
Northumberland Accomodation & Food Services Workforce Jobs 10.4 11.5 11.0 11.9 12.1 12.3 12.7 13.0 13.5 13.9 14.4 14.6 14.7 14.7 14.8 14.8 14.8 14.8 14.9 14.9 14.9 14.9 14.9 14.9
Northumberland Recreation Workforce Jobs 4.6 4.5 4.5 4.7 4.8 5.0 5.1 5.3 5.5 5.7 5.9 6.0 6.1 6.1 6.1 6.2 6.2 6.2 6.3 6.3 6.3 6.4 6.4 6.4
Northumberland Media Activities Workforce Jobs 0.6 0.6 0.6 0.6 0.6 0.6 0.6 0.6 0.6 0.6 0.6 0.6 0.6 0.6 0.6 0.6 0.6 0.6 0.6 0.6 0.6 0.6 0.6 0.6
Northumberland Telecoms Workforce Jobs 0.2 0.1 0.1 0.1 0.1 0.1 0.1 0.1 0.1 0.1 0.1 0.1 0.1 0.1 0.1 0.1 0.1 0.1 0.1 0.1 0.1 0.1 0.1 0.1
Northumberland Computing & Information Services Workforce Jobs 0.9 1.0 1.0 1.1 1.1 1.1 1.1 1.1 1.2 1.2 1.2 1.2 1.2 1.2 1.2 1.3 1.3 1.3 1.3 1.3 1.3 1.3 1.3 1.3
Northumberland Finance Workforce Jobs 1.0 1.0 1.0 1.0 1.0 1.0 1.0 1.0 1.0 1.0 1.0 1.0 1.0 1.0 1.0 1.0 1.0 1.0 1.0 1.0 1.0 1.0 1.0 1.0
Northumberland Insurance & Pensions Workforce Jobs 0.0 0.0 0.0 0.0 0.0 0.0 0.0 0.0 0.0 0.0 0.0 0.0 0.0 0.0 0.0 0.0 0.0 0.0 0.0 0.0 0.0 0.0 0.0 0.0
Northumberland Real Estate Workforce Jobs 2.0 2.0 2.0 2.0 2.0 2.1 2.1 2.1 2.1 2.1 2.1 2.2 2.2 2.2 2.2 2.2 2.2 2.3 2.3 2.3 2.3 2.3 2.3 2.4
Northumberland Professional Services Workforce Jobs 6.6 8.0 8.0 7.7 7.8 7.9 8.0 8.1 8.2 8.4 8.6 8.7 8.8 8.9 8.9 9.0 9.1 9.1 9.2 9.3 9.3 9.4 9.5 9.6
Northumberland Administrative & Supportive Service Activities Workforce Jobs 5.9 6.1 6.3 6.7 6.8 6.8 6.8 6.8 6.9 7.0 7.1 7.1 7.2 7.2 7.3 7.3 7.4 7.5 7.5 7.6 7.6 7.7 7.8 7.8
Northumberland Other Private Services Workforce Jobs 3.8 4.1 4.4 4.2 4.2 4.2 4.2 4.2 4.3 4.3 4.3 4.3 4.3 4.3 4.3 4.3 4.3 4.3 4.3 4.4 4.4 4.4 4.4 4.4
Northumberland Public Administration & Defence Workforce Jobs 5.5 4.8 4.6 4.5 4.3 4.2 4.1 4.0 4.0 3.9 3.9 3.8 3.7 3.7 3.6 3.6 3.5 3.5 3.4 3.4 3.3 3.3 3.2 3.2
Northumberland Education Workforce Jobs 9.7 10.7 10.7 10.8 10.8 10.8 10.8 10.9 11.0 11.1 11.2 11.3 11.3 11.4 11.5 11.5 11.6 11.6 11.6 11.7 11.7 11.7 11.8 11.8
Northumberland Health Workforce Jobs 11.1 11.1 11.2 11.3 11.3 11.3 11.4 11.5 11.6 11.7 11.8 11.9 12.0 12.1 12.2 12.3 12.4 12.5 12.6 12.7 12.8 12.9 13.0 13.1
Northumberland Residential Care & Social Work Workforce Jobs 9.2 9.0 8.8 8.6 8.7 8.8 8.9 9.0 9.2 9.4 9.6 9.7 9.8 10.0 10.2 10.3 10.5 10.6 10.8 10.9 11.0 11.1 11.1 11.2

Industry Variable Name 2014 2015 2016 2017 2018 2019 2020 2021 2022 2023 2024 2025 2026 2027 2028 2029 2030 2031 2032 2033 2034 2035 2036 2037
Northumberland Agriculture, Forestry & Fishing GVA 237.8 234.3 218.9 223.3 229.1 234.9 240.2 246.0 254.0 263.4 272.8 277.2 278.4 279.3 279.6 279.4 279.4 279.4 279.5 279.3 278.9 278.5 278.0 277.5
Northumberland Extraction & Mining GVA 52.5 48.7 34.7 33.8 33.7 33.9 33.7 33.7 33.8 33.9 33.9 33.8 33.6 33.4 33.1 32.7 32.3 31.8 31.3 30.7 30.0 29.2 28.5 27.8
Northumberland Food, Drink & Tobacco GVA 75.9 80.3 81.2 82.9 84.2 86.5 88.9 91.7 94.8 98.6 102.7 104.6 105.1 105.3 105.3 105.2 105.1 105.0 105.0 104.8 104.7 104.6 104.4 104.1
Northumberland Textiles & Clothing GVA 5.3 5.5 5.2 5.7 5.8 5.9 5.9 6.0 6.0 6.1 6.1 6.2 6.2 6.3 6.3 6.3 6.4 6.4 6.5 6.5 6.5 6.6 6.6 6.6
Northumberland Wood & Paper GVA 75.4 80.5 80.7 87.1 88.8 90.9 93.0 95.1 97.9 101.3 105.2 106.7 106.6 106.4 106.2 106.0 105.8 105.6 105.3 104.9 104.4 104.0 103.4 102.8
Northumberland Printing and Reproduction of Recorded Media GVA 15.6 17.4 18.2 18.4 18.7 19.2 19.6 20.2 20.9 21.7 22.6 23.0 23.0 23.0 22.9 22.9 22.8 22.7 22.7 22.5 22.4 22.3 22.2 22.0
Northumberland Fuel Refining GVA 4.7 4.9 4.7 4.8 4.8 4.8 4.7 4.7 4.6 4.6 4.6 4.5 4.5 4.4 4.4 4.4 4.3 4.3 4.2 4.2 4.1 4.0 3.9 3.9
Northumberland Chemicals GVA 58.4 61.1 58.7 62.6 65.1 67.7 70.1 72.7 75.6 78.7 82.1 83.7 84.0 84.3 84.4 84.4 84.4 84.6 84.7 84.7 84.7 84.7 84.6 84.6
Northumberland Pharmaceuticals GVA 175.6 178.6 185.4 179.1 186.8 194.3 201.8 210.8 221.9 234.4 246.9 254.2 258.5 263.1 267.6 271.8 276.2 280.8 285.3 289.6 293.7 297.7 301.8 305.6
Northumberland Rubber, Plastic and Other Non-Metallic Mineral Products GVA 77.7 83.1 86.3 87.3 89.7 93.5 97.4 101.8 107.3 113.7 120.4 124.9 127.5 130.0 132.0 133.7 135.5 137.7 139.8 141.9 143.9 145.9 147.9 149.7
Northumberland Metal Products GVA 39.1 38.1 36.2 36.4 36.6 37.1 37.5 37.7 38.0 38.3 38.7 39.0 39.3 39.5 39.8 40.0 40.3 40.5 40.7 40.8 40.9 40.9 40.9 40.8
Northumberland Computer & Electronic Products GVA 49.1 51.3 51.1 53.5 55.4 57.6 59.8 62.6 66.0 70.0 74.2 76.6 77.8 79.0 80.2 81.5 82.9 84.3 85.4 86.4 87.3 88.2 89.1 90.1
Northumberland Machinery & Equipment GVA 61.1 55.7 55.4 58.6 59.7 62.2 63.9 65.7 67.8 70.1 72.0 73.5 74.8 75.8 76.9 77.8 78.8 79.9 81.1 82.2 83.2 84.2 85.3 86.4
Northumberland Transport Equipment GVA 14.3 14.6 14.5 14.8 15.0 15.4 15.8 16.0 16.3 16.6 16.9 17.0 17.1 17.1 17.1 17.2 17.3 17.3 17.4 17.5 17.5 17.6 17.7 17.8
Northumberland Other Manufacturing GVA 42.1 43.9 46.3 48.1 49.3 50.9 52.6 54.5 56.6 59.1 61.9 63.4 63.9 64.5 64.9 65.4 65.9 66.4 66.8 67.1 67.4 67.6 67.8 67.8
Northumberland Utilities GVA 134.0 141.9 146.8 148.5 152.2 157.4 162.8 168.9 175.7 183.2 190.8 195.0 196.6 198.1 199.3 200.1 200.9 201.8 202.5 202.8 203.0 203.0 202.9 202.5
Northumberland Construction of Buildings GVA 174.2 182.8 185.2 186.9 188.0 191.0 194.5 198.1 202.1 206.7 211.0 214.7 217.9 220.5 222.5 224.1 225.6 227.2 228.9 230.4 232.0 233.6 235.2 236.7
Northumberland Civil Engineering GVA 68.0 67.5 66.4 67.0 67.6 68.9 70.2 71.5 72.9 74.5 76.0 77.5 79.0 80.4 81.7 82.9 84.0 85.2 86.5 87.6 88.8 89.9 91.1 92.2
Northumberland Specialised Construction Activities GVA 128.3 132.3 132.2 133.4 134.2 135.9 138.3 141.0 144.0 147.5 150.7 153.7 156.6 159.4 161.8 164.0 166.3 168.7 171.2 173.5 175.9 178.4 180.9 183.4
Northumberland Wholesale GVA 207.4 217.4 223.6 227.5 229.3 232.3 236.3 240.8 246.7 253.5 260.3 266.4 272.2 277.2 280.9 283.6 286.1 288.9 291.6 294.2 296.7 299.3 302.0 304.4
Northumberland Retail GVA 322.7 335.1 340.7 346.6 350.9 356.2 362.1 370.3 381.2 392.3 401.8 410.0 417.8 425.8 433.7 441.2 448.9 457.1 465.3 473.2 481.0 489.0 496.8 504.3
Northumberland Land Transport, Storage & Post GVA 139.1 138.5 134.6 136.9 138.8 141.5 145.0 149.9 156.8 164.9 173.1 177.8 180.0 182.2 184.1 185.8 187.5 189.4 191.2 192.9 194.6 196.2 198.0 199.6
Northumberland Air & Water Transport GVA 5.0 5.7 6.1 6.0 6.1 6.2 6.2 6.4 6.6 6.9 7.1 7.3 7.4 7.5 7.7 7.9 8.0 8.2 8.5 8.7 8.9 9.1 9.4 9.6
Northumberland Accomodation & Food Services GVA 186.1 192.6 198.2 208.3 213.8 220.2 226.6 234.5 244.9 257.5 270.8 278.1 281.9 285.4 288.1 290.3 292.9 295.7 298.7 301.5 304.2 307.0 309.8 312.2
Northumberland Recreation GVA 89.0 82.1 78.9 81.4 83.6 86.4 89.9 94.3 99.7 106.1 112.9 116.7 118.8 120.7 122.2 123.8 125.5 127.3 129.3 131.2 133.1 135.1 137.2 139.2
Northumberland Media Activities GVA 20.8 23.9 25.3 26.4 27.1 27.7 28.5 29.4 30.6 32.1 33.4 34.6 35.7 36.7 37.7 38.7 39.7 40.8 42.0 43.1 44.2 45.4 46.6 47.7
Northumberland Telecoms GVA 12.9 11.9 10.4 10.1 10.3 10.5 10.9 11.4 11.9 12.6 13.2 13.8 14.4 14.9 15.3 15.8 16.4 16.9 17.4 18.0 18.6 19.2 19.8 20.3
Northumberland Computing & Information Services GVA 35.3 37.4 40.2 40.4 41.6 43.0 44.3 45.9 48.1 50.8 53.4 55.2 56.7 58.2 59.6 61.1 62.6 64.3 66.1 67.8 69.6 71.4 73.3 75.0
Northumberland Finance GVA 63.2 60.2 60.0 60.1 60.2 60.5 61.4 62.6 64.3 66.3 68.3 69.9 71.4 72.8 74.2 75.6 77.2 79.1 81.1 83.2 85.5 87.7 90.1 92.5
Northumberland Insurance & Pensions GVA 3.2 3.1 3.1 3.0 3.0 3.0 2.9 2.9 2.9 2.9 2.9 2.9 2.9 2.8 2.8 2.8 2.8 2.7 2.7 2.7 2.6 2.6 2.6 2.5
Northumberland Real Estate GVA 744.9 750.0 740.7 744.2 748.5 756.6 764.7 774.0 785.9 799.7 813.4 826.0 838.5 850.4 860.4 868.0 876.0 885.1 893.2 900.4 907.3 914.4 921.9 929.6
Northumberland Professional Services GVA 189.7 215.5 229.4 237.1 242.5 248.9 255.4 262.7 273.0 285.6 299.1 308.7 315.4 321.9 328.1 334.4 341.7 350.1 359.2 368.6 378.2 388.2 398.4 408.8
Northumberland Administrative & Supportive Service Activities GVA 124.7 136.1 139.5 145.3 148.9 152.5 157.2 162.8 169.8 177.7 185.8 192.7 199.4 205.9 212.5 219.4 226.6 234.2 242.1 250.1 258.3 266.9 275.8 284.9
Northumberland Other Private Services GVA 100.5 98.9 102.7 103.3 103.8 104.8 105.9 107.2 109.2 111.4 113.3 114.5 115.5 116.6 117.6 118.4 119.1 120.0 121.0 122.0 122.8 123.6 124.5 125.1
Northumberland Public Administration & Defence GVA 259.9 239.9 222.6 217.7 212.9 209.9 208.1 206.2 205.4 205.2 204.7 203.7 202.6 201.3 199.7 197.8 195.9 194.3 192.6 190.7 188.7 186.8 184.8 182.7
Northumberland Education GVA 320.9 342.0 341.7 345.3 347.7 350.8 354.3 358.7 365.3 373.2 380.4 385.6 390.1 394.5 398.3 401.0 403.5 406.4 409.4 412.0 414.3 416.5 418.6 420.1
Northumberland Health GVA 366.5 386.8 394.7 402.4 410.6 420.4 433.2 447.8 465.0 484.0 503.3 522.2 541.0 560.2 579.3 598.0 617.5 638.0 659.0 679.9 701.0 722.5 744.5 766.4
Northumberland Residential Care & Social Work GVA 137.5 138.5 136.8 137.6 138.8 141.2 144.2 147.3 151.4 155.8 159.9 163.7 167.3 170.9 174.2 177.3 180.5 183.8 187.2 190.4 193.6 196.7 199.8 202.8
Northumberland Agriculture, Forestry & Fishing Productivity (£GVA per hour) 64.7 67.8 61.5 62.3 63.2 63.8 64.3 65.0 65.9 66.9 67.5 68.2 69.0 69.7 70.3 70.7 70.9 71.1 71.3 71.4 71.4 71.5 71.5 71.6
Northumberland Extraction & Mining Productivity (£GVA per hour) 62.5 72.3 68.7 73.2 73.2 73.6 73.4 73.9 74.4 75.1 75.5 75.9 76.2 76.8 77.6 78.2 78.4 78.5 78.5 78.2 77.6 76.9 76.2 75.6
Northumberland Food, Drink & Tobacco Productivity (£GVA per hour) 26.2 28.2 28.0 28.2 28.1 28.1 28.2 28.3 28.5 28.7 28.9 29.1 29.3 29.4 29.5 29.6 29.7 29.8 29.9 29.9 30.0 30.0 30.0 30.0
Northumberland Textiles & Clothing Productivity (£GVA per hour) 15.9 15.9 13.5 14.6 15.0 15.3 15.7 16.1 16.6 17.1 17.6 18.1 18.5 18.9 19.4 20.0 20.6 21.3 22.1 22.8 23.5 24.3 25.1 25.9
Northumberland Wood & Paper Productivity (£GVA per hour) 19.2 20.2 18.8 20.3 20.5 20.9 21.2 21.5 21.8 22.1 22.5 22.8 23.2 23.6 23.9 24.3 24.7 25.1 25.4 25.8 26.0 26.3 26.6 26.8
Northumberland Printing and Reproduction of Recorded Media Productivity (£GVA per hour) 12.0 13.1 14.5 14.0 14.1 14.2 14.4 14.5 14.7 15.0 15.2 15.5 15.8 16.2 16.6 17.0 17.4 17.8 18.3 18.8 19.3 19.9 20.5 21.0
Northumberland Fuel Refining Productivity (£GVA per hour) 48.6 59.2 52.8 53.5 53.0 53.1 52.0 50.9 49.5 48.6 48.1 47.7 47.4 47.1 46.9 46.6 46.4 46.1 45.8 45.3 44.7 44.0 43.3 42.7
Northumberland Chemicals Productivity (£GVA per hour) 32.3 34.1 31.8 32.9 33.6 33.8 33.9 34.2 34.6 35.0 35.3 35.6 36.0 36.3 36.6 36.9 37.2 37.6 38.0 38.4 38.7 39.0 39.4 39.7
Northumberland Pharmaceuticals Productivity (£GVA per hour) 109.1 121.6 127.3 118.4 119.4 120.1 121.4 123.4 126.0 128.5 130.2 132.0 133.9 136.0 138.0 140.0 141.9 143.9 145.8 147.4 148.9 150.1 151.4 152.6
Northumberland Rubber, Plastic and Other Non-Metallic Mineral Products Productivity (£GVA per hour) 22.8 24.7 26.7 26.9 27.5 28.4 29.1 29.8 30.6 31.5 32.4 33.3 34.2 35.1 35.9 36.6 37.3 38.2 39.0 39.9 40.6 41.4 42.1 42.8
Northumberland Metal Products Productivity (£GVA per hour) 18.0 19.3 19.6 19.4 19.6 19.9 20.4 20.9 21.4 22.0 22.5 22.9 23.4 23.8 24.3 24.8 25.3 25.7 26.1 26.5 26.8 27.1 27.4 27.6
Northumberland Computer & Electronic Products Productivity (£GVA per hour) 19.3 19.4 19.6 20.5 21.1 21.6 22.2 22.9 23.6 24.4 25.1 25.7 26.3 26.8 27.4 28.0 28.6 29.2 29.8 30.4 30.9 31.4 31.9 32.4
Northumberland Machinery & Equipment Productivity (£GVA per hour) 26.7 25.7 28.3 29.1 30.2 31.2 32.0 33.2 34.6 36.1 37.3 38.3 39.5 40.7 42.0 43.3 44.6 45.9 47.2 48.5 49.7 50.9 52.1 53.4
Northumberland Transport Equipment Productivity (£GVA per hour) 20.4 22.9 26.8 26.1 26.5 27.0 27.8 28.3 29.0 29.9 30.7 31.3 31.9 32.5 33.2 34.0 34.8 35.6 36.4 37.1 37.8 38.5 39.2 40.1
Northumberland Other Manufacturing Productivity (£GVA per hour) 18.8 17.8 16.9 16.8 17.1 17.6 18.2 18.7 19.2 19.8 20.3 20.8 21.2 21.5 21.9 22.2 22.6 23.0 23.3 23.6 23.8 24.0 24.3 24.4
Northumberland Utilities Productivity (£GVA per hour) 45.7 48.3 47.9 47.2 46.9 47.0 47.2 47.5 47.7 47.9 47.9 48.1 48.2 48.3 48.4 48.5 48.6 48.6 48.6 48.5 48.4 48.2 48.0 47.8
Northumberland Construction of Buildings Productivity (£GVA per hour) 44.9 42.5 40.6 39.0 39.2 39.8 40.5 41.1 41.8 42.7 43.4 44.0 44.6 45.1 45.7 46.3 46.9 47.5 48.2 48.7 49.2 49.7 50.2 50.6
Northumberland Civil Engineering Productivity (£GVA per hour) 45.9 49.4 49.0 48.1 48.7 49.4 50.2 51.1 52.1 53.1 54.0 54.8 55.7 56.7 57.7 58.7 59.8 60.9 62.0 62.9 63.9 64.8 65.6 66.4
Northumberland Specialised Construction Activities Productivity (£GVA per hour) 19.8 21.2 19.2 18.6 18.8 19.0 19.3 19.6 20.0 20.4 20.7 21.0 21.4 21.7 22.1 22.5 22.9 23.4 23.8 24.2 24.6 25.0 25.4 25.8
Northumberland Wholesale Productivity (£GVA per hour) 21.3 22.7 23.5 23.9 24.0 24.2 24.5 24.9 25.5 26.2 26.8 27.4 28.0 28.6 29.0 29.4 29.7 30.1 30.4 30.7 31.0 31.3 31.6 31.8
Northumberland Retail Productivity (£GVA per hour) 17.1 18.4 19.2 20.0 20.3 20.6 21.0 21.3 21.8 22.4 22.8 23.3 23.7 24.2 24.6 25.1 25.6 26.1 26.6 27.1 27.5 28.0 28.5 29.0
Northumberland Land Transport, Storage & Post Productivity (£GVA per hour) 18.5 18.4 17.1 17.2 17.4 17.7 17.9 18.1 18.5 18.9 19.3 19.5 19.7 19.9 20.1 20.2 20.4 20.5 20.7 20.8 20.9 21.0 21.1 21.2
Northumberland Air & Water Transport Productivity (£GVA per hour) 50.7 46.7 42.6 42.1 42.7 43.1 43.7 44.3 45.7 47.3 48.6 49.6 50.5 51.4 52.5 53.7 54.9 56.2 57.7 59.1 60.6 62.1 63.5 65.0
Northumberland Accomodation & Food Services Productivity (£GVA per hour) 15.3 13.4 14.0 13.5 13.5 13.6 13.6 13.6 13.7 13.9 14.1 14.3 14.4 14.6 14.7 14.8 15.0 15.1 15.3 15.4 15.6 15.7 15.9 16.1
Northumberland Recreation Productivity (£GVA per hour) 19.4 16.4 15.0 14.5 14.6 14.7 14.8 15.0 15.3 15.6 15.9 16.1 16.3 16.4 16.6 16.7 16.8 17.0 17.1 17.3 17.4 17.5 17.6 17.7
Northumberland Media Activities Productivity (£GVA per hour) 35.9 39.6 41.8 41.9 42.8 43.5 44.1 44.9 46.2 48.0 49.7 51.2 52.5 53.7 54.9 56.2 57.5 58.9 60.4 61.8 63.4 65.0 66.6 68.1
Northumberland Telecoms Productivity (£GVA per hour) 44.8 47.7 40.4 38.3 38.9 39.9 41.5 43.3 45.6 48.0 50.6 53.1 55.4 57.5 59.6 61.9 64.3 66.7 69.1 71.5 73.9 76.4 78.8 81.0
Northumberland Computing & Information Services Productivity (£GVA per hour) 21.1 21.8 22.4 22.0 22.4 22.7 23.1 23.5 24.2 25.0 25.7 26.3 26.8 27.4 28.0 28.6 29.2 29.8 30.4 31.0 31.5 32.1 32.7 33.2
Northumberland Finance Productivity (£GVA per hour) 38.6 40.0 37.4 36.7 36.7 37.1 37.8 38.5 39.6 40.8 41.9 43.0 44.0 44.9 45.8 46.8 47.8 48.9 50.1 51.3 52.6 53.9 55.3 56.6
Northumberland Insurance & Pensions Productivity (£GVA per hour) 161.9 152.2 150.3 145.9 146.1 146.5 147.0 148.2 149.7 151.5 153.4 154.7 156.0 156.7 157.1 158.1 158.8 159.6 160.0 160.3 160.6 160.8 161.0 161.0
Northumberland Real Estate Productivity (£GVA per hour) 244.6 235.5 229.7 226.3 224.1 223.8 224.0 225.1 226.7 228.9 231.0 232.4 234.0 235.6 237.0 238.0 239.1 240.1 240.7 240.9 240.9 240.8 240.8 240.8
Northumberland Professional Services Productivity (£GVA per hour) 20.9 18.5 20.5 22.0 22.4 22.8 23.2 23.5 24.1 24.6 25.2 25.7 26.1 26.5 26.9 27.3 27.8 28.3 28.9 29.4 30.0 30.5 31.0 31.5
Northumberland Administrative & Supportive Service Activities Productivity (£GVA per hour) 13.1 14.2 14.5 14.1 14.4 14.7 15.0 15.5 16.1 16.7 17.3 17.9 18.4 19.0 19.6 20.2 20.8 21.4 22.1 22.7 23.4 24.0 24.7 25.4
Northumberland Other Private Services Productivity (£GVA per hour) 23.7 24.4 22.7 24.6 24.5 24.6 24.7 25.0 25.4 25.8 26.1 26.3 26.5 26.8 27.0 27.2 27.4 27.6 27.8 28.0 28.2 28.3 28.5 28.6
Northumberland Public Administration & Defence Productivity (£GVA per hour) 27.5 29.5 29.7 29.5 29.9 30.1 30.4 30.5 30.6 30.9 31.2 31.5 31.8 32.1 32.4 32.7 33.0 33.3 33.6 33.8 34.0 34.2 34.4 34.6
Northumberland Education Productivity (£GVA per hour) 23.9 23.2 23.5 23.3 23.5 23.6 23.7 23.7 23.9 24.2 24.4 24.6 24.8 25.1 25.3 25.5 25.7 25.8 26.0 26.2 26.3 26.5 26.6 26.7
Northumberland Health Productivity (£GVA per hour) 20.0 21.7 22.7 22.8 23.2 23.6 24.1 24.6 25.2 26.0 26.8 27.6 28.4 29.2 30.0 30.8 31.7 32.6 33.5 34.3 35.2 36.0 36.9 37.8
Northumberland Residential Care & Social Work Productivity (£GVA per hour) 9.4 10.2 9.9 10.1 10.1 10.0 10.0 10.0 10.0 10.1 10.1 10.2 10.2 10.2 10.3 10.3 10.3 10.4 10.5 10.5 10.6 10.7 10.8 10.8

Housing and economic growth options
Findings report
June 2018
APPENDIX G INTERMEDIATE GROWTH SCENARIO
Industry Variable Name 2014 2015 2016 2017 2018 2019 2020 2021 2022 2023 2024 2025 2026 2027 2028 2029 2030 2031 2032 2033 2034 2035 2036 2037
Northumberland Labour Force 160.80 157.90 157.80 156.60 156.80 156.50 156.80 157.50 158.80 160.30 161.80 162.20 162.40 162.70 163.00 163.30 163.30 163.40 163.40 163.60 163.80 163.90 164.10 164.40
Northumberland Labour Force - 16 to 64 154.40 151.00 151.10 149.60 149.50 148.90 148.90 149.30 150.30 151.40 152.40 152.30 151.90 151.40 151.00 150.60 150.10 149.80 149.50 149.40 149.40 149.40 149.40 149.50
Northumberland Labour Force - 65 Plus 6.30 6.80 6.70 7.00 7.30 7.60 7.90 8.20 8.60 9.00 9.40 9.90 10.50 11.30 12.10 12.70 13.20 13.60 14.00 14.20 14.40 14.50 14.70 14.80
Northumberland Population - retired 77.30 76.60 76.50 77.20 77.90 78.10 77.00 77.90 79.60 81.30 83.20 85.10 86.20 85.80 85.80 87.40 89.20 91.10 92.90 94.30 95.70 96.80 97.80 98.60
Northumberland Population - student 52.60 52.20 52.10 52.20 52.20 52.10 52.10 52.20 52.40 52.80 53.00 52.80 52.50 52.10 51.70 51.50 51.30 51.20 51.00 50.80 50.60 50.40 50.20 50.00
Northumberland Population - 16 Plus 263.40 263.90 264.70 266.20 266.80 266.90 267.80 269.60 272.20 275.20 278.10 279.50 280.10 280.70 281.30 281.90 282.30 282.50 282.80 283.00 283.20 283.30 283.40 283.40
Northumberland Population - 16 to 64 192.30 191.10 190.10 190.00 189.00 187.50 186.80 186.70 187.40 188.10 188.70 188.00 186.80 185.50 184.20 182.80 181.30 179.90 178.70 177.70 176.80 176.00 175.10 174.40
Northumberland Population - 65 Plus 71.10 72.80 74.60 76.20 77.80 79.40 81.00 82.90 84.90 87.10 89.40 91.40 93.30 95.20 97.10 99.10 101.00 102.60 104.10 105.30 106.40 107.30 108.40 109.00
Northumberland Total Population 316.00 316.00 316.70 318.50 319.00 319.00 319.90 321.80 324.70 328.00 331.10 332.30 332.60 332.80 333.10 333.40 333.60 333.70 333.70 333.80 333.80 333.70 333.60 333.40
Northumberland Working Age Population 186.10 187.30 187.90 187.50 187.20 187.50 189.20 188.80 187.80 186.60 185.40 184.10 183.70 184.80 185.40 184.30 182.80 181.20 179.80 178.60 177.60 176.70 175.90 175.20
Northumberland Economic Activity Rate (%) - 16+ 61.00 59.80 59.60 58.80 58.80 58.70 58.50 58.40 58.40 58.30 58.20 58.00 58.00 57.90 57.90 57.90 57.90 57.80 57.80 57.80 57.80 57.90 57.90 58.00
Northumberland Economic Activity Rate (%) - 16 to 64 80.30 79.10 79.50 78.70 79.10 79.40 79.70 79.90 80.20 80.50 80.70 81.00 81.30 81.60 82.00 82.40 82.80 83.20 83.70 84.10 84.50 84.90 85.30 85.70
Northumberland Economic Activity Rate (%) - 65 Plus 8.90 9.40 9.00 9.20 9.40 9.60 9.70 9.90 10.10 10.30 10.50 10.80 11.30 11.80 12.40 12.80 13.00 13.30 13.40 13.50 13.50 13.50 13.60 13.60
Northumberland Economic Activity Rate (%) - Working Age 86.40 84.30 83.90 83.00 83.20 83.00 82.30 82.40 82.80 83.20 83.60 84.20 84.40 84.10 84.00 84.60 85.30 86.00 86.80 87.50 88.10 88.60 89.20 89.70
Northumberland Employment rate (% of 16+ population) 56.80 55.90 56.20 55.90 55.90 55.90 55.80 55.70 55.70 55.60 55.50 55.40 55.30 55.20 55.20 55.20 55.20 55.10 55.10 55.10 55.10 55.20 55.20 55.30
Northumberland Productivity (£GVA per hour) 26.30 26.60 26.60 26.60 26.80 27.10 27.40 27.70 28.10 28.60 29.10 29.50 30.00 30.40 30.80 31.20 31.60 32.00 32.40 32.80 33.20 33.60 34.00 34.40
Northumberland Total GVA (£mn 2013 prices) 4819.80 4939.70 4932.20 4999.20 5060.20 5143.10 5232.30 5335.70 5470.10 5624.60 5774.20 5891.00 5989.20 6083.40 6169.10 6245.60 6326.00 6414.00 6502.20 6586.50 6669.80 6754.00 6840.00 6922.90
Northumberland Workforce Jobs 122.60 125.50 124.20 125.00 125.20 125.60 126.10 126.70 127.80 129.10 130.30 130.90 131.20 131.70 132.20 132.60 132.90 133.20 133.50 133.80 134.20 134.40 134.70 135.00
Northumberland Jobs Demand 122.70 125.60 124.20 125.00 125.20 125.60 126.10 126.70 127.80 129.10 130.30 130.90 131.20 131.70 132.20 132.60 132.90 133.20 133.50 133.80 134.20 134.40 134.70 135.00
Northumberland Excess Jobs 0.00 0.10 0.00 0.00 0.00 0.00 0.00 0.00 0.00 0.00 0.00 0.00 0.00 0.00 0.00 0.00 0.00 0.00 0.00 0.00 0.00 0.00 0.00 0.00
Northumberland FTE jobs 93.30 94.40 94.50 95.70 96.00 96.50 97.20 98.00 98.90 99.90 101.00 101.50 101.70 101.90 101.90 101.90 101.90 101.90 102.00 102.10 102.10 102.20 102.40 102.40
Northumberland Workplace based employment 127.80 130.20 131.50 131.40 131.70 131.80 132.10 132.60 133.70 134.90 136.00 136.50 136.70 137.00 137.40 137.70 137.90 138.00 138.20 138.40 138.60 138.80 139.10 139.40
Northumberland Residence based employment 149.70 147.50 148.90 148.80 149.20 149.20 149.50 150.20 151.50 152.90 154.30 154.70 154.80 155.10 155.40 155.70 155.80 155.80 155.80 156.00 156.10 156.30 156.40 156.70
Northumberland Net Commuting (inflow) -22.00 -17.30 -17.40 -17.50 -17.40 -17.40 -17.40 -17.60 -17.80 -18.10 -18.30 -18.20 -18.10 -18.10 -18.00 -18.00 -17.90 -17.80 -17.70 -17.60 -17.50 -17.40 -17.30 -17.20
Northumberland Unemployment 11.00 10.30 8.90 7.80 7.70 7.40 7.30 7.30 7.30 7.40 7.50 7.50 7.60 7.60 7.60 7.60 7.60 7.60 7.60 7.60 7.60 7.60 7.70 7.70
Northumberland Unemployment Rate (% of labour force) 6.80 6.50 5.70 5.00 4.90 4.70 4.60 4.60 4.60 4.60 4.60 4.60 4.70 4.70 4.70 4.60 4.60 4.60 4.60 4.70 4.70 4.70 4.70 4.70
Northumberland Agriculture, Forestry & Fishing Workforce Jobs 4.7 4.1 3.5 3.2 3.2 3.2 3.2 3.2 3.2 3.3 3.3 3.3 3.3 3.3 3.3 3.3 3.3 3.3 3.3 3.3 3.3 3.3 3.3 3.3
Northumberland Extraction & Mining Workforce Jobs 0.5 0.4 0.3 0.3 0.3 0.3 0.3 0.3 0.3 0.3 0.3 0.3 0.3 0.3 0.3 0.3 0.3 0.3 0.3 0.3 0.3 0.3 0.2 0.2
Northumberland Food, Drink & Tobacco Workforce Jobs 1.5 1.6 1.6 1.6 1.6 1.6 1.6 1.7 1.7 1.7 1.7 1.7 1.7 1.7 1.7 1.7 1.7 1.7 1.7 1.7 1.7 1.7 1.7 1.7
Northumberland Textiles & Clothing Workforce Jobs 0.2 0.2 0.2 0.2 0.2 0.2 0.2 0.2 0.2 0.2 0.2 0.2 0.2 0.2 0.2 0.2 0.2 0.2 0.2 0.2 0.1 0.1 0.1 0.1
Northumberland Wood & Paper Workforce Jobs 1.9 2.0 2.1 2.1 2.1 2.1 2.1 2.0 2.0 2.0 2.0 2.0 1.9 1.9 1.9 1.8 1.8 1.8 1.7 1.7 1.7 1.6 1.6 1.6
Northumberland Printing and Reproduction of Recorded Media Workforce Jobs 0.7 0.7 0.7 0.7 0.7 0.7 0.7 0.7 0.7 0.7 0.7 0.7 0.7 0.7 0.7 0.7 0.6 0.6 0.6 0.6 0.6 0.6 0.5 0.5
Northumberland Fuel Refining Workforce Jobs 0.0 0.0 0.0 0.0 0.0 0.0 0.0 0.0 0.0 0.0 0.0 0.0 0.0 0.0 0.0 0.0 0.0 0.0 0.0 0.0 0.0 0.0 0.0 0.0
Northumberland Chemicals Workforce Jobs 1.0 1.0 1.0 1.0 1.0 1.0 1.0 1.1 1.1 1.1 1.1 1.1 1.1 1.1 1.1 1.0 1.0 1.0 1.0 1.0 1.0 1.0 1.0 1.0
Northumberland Pharmaceuticals Workforce Jobs 0.9 0.9 0.8 1.0 1.0 1.0 1.0 1.0 1.0 1.0 1.1 1.1 1.1 1.1 1.1 1.1 1.1 1.2 1.2 1.2 1.2 1.2 1.2 1.2
Northumberland Rubber, Plastic and Other Non-Metallic Mineral Products Workforce Jobs 1.6 1.7 1.6 1.6 1.6 1.6 1.6 1.6 1.6 1.6 1.7 1.7 1.7 1.7 1.6 1.6 1.6 1.6 1.6 1.6 1.6 1.6 1.6 1.6
Northumberland Metal Products Workforce Jobs 1.0 1.0 0.9 0.9 0.9 0.9 0.9 0.9 0.9 0.8 0.8 0.8 0.8 0.8 0.8 0.8 0.8 0.8 0.8 0.7 0.7 0.7 0.7 0.7
Northumberland Computer & Electronic Products Workforce Jobs 1.3 1.4 1.3 1.3 1.3 1.3 1.3 1.3 1.4 1.4 1.4 1.4 1.4 1.4 1.4 1.4 1.4 1.4 1.4 1.3 1.3 1.3 1.3 1.3
Northumberland Machinery & Equipment Workforce Jobs 1.1 1.1 1.0 1.1 1.0 1.0 1.0 1.0 1.0 1.0 1.0 1.0 1.0 0.9 0.9 0.9 0.9 0.9 0.9 0.8 0.8 0.8 0.8 0.8
Northumberland Transport Equipment Workforce Jobs 0.3 0.3 0.3 0.3 0.3 0.3 0.3 0.3 0.3 0.3 0.3 0.3 0.3 0.3 0.3 0.3 0.2 0.2 0.2 0.2 0.2 0.2 0.2 0.2
Northumberland Other Manufacturing Workforce Jobs 1.2 1.3 1.5 1.5 1.5 1.5 1.5 1.5 1.5 1.5 1.5 1.5 1.5 1.4 1.4 1.4 1.4 1.4 1.4 1.4 1.4 1.4 1.4 1.4
Northumberland Utilities Workforce Jobs 1.5 1.6 1.6 1.7 1.7 1.7 1.8 1.8 1.9 1.9 2.0 2.0 2.0 2.0 2.0 2.1 2.1 2.1 2.1 2.1 2.1 2.1 2.1 2.1
Northumberland Construction of Buildings Workforce Jobs 3.0 3.4 3.5 3.6 3.6 3.6 3.6 3.6 3.6 3.6 3.6 3.6 3.6 3.6 3.6 3.6 3.6 3.6 3.5 3.5 3.5 3.5 3.5 3.5
Northumberland Civil Engineering Workforce Jobs 0.8 0.7 0.7 0.7 0.7 0.7 0.7 0.7 0.7 0.7 0.7 0.7 0.7 0.7 0.7 0.7 0.7 0.7 0.7 0.7 0.7 0.7 0.7 0.7
Northumberland Specialised Construction Activities Workforce Jobs 4.6 4.6 4.7 4.8 4.8 4.8 4.8 4.9 4.9 4.9 4.9 4.9 5.0 5.0 5.0 5.0 5.0 5.0 5.0 5.0 5.0 5.0 5.0 5.0
Northumberland Wholesale Workforce Jobs 5.4 5.4 5.4 5.4 5.4 5.4 5.5 5.4 5.4 5.4 5.4 5.4 5.4 5.4 5.4 5.4 5.4 5.4 5.4 5.4 5.4 5.4 5.4 5.4
Northumberland Retail Workforce Jobs 13.8 13.5 13.0 12.7 12.6 12.6 12.6 12.5 12.6 12.6 12.6 12.6 12.6 12.5 12.6 12.6 12.5 12.5 12.5 12.5 12.5 12.4 12.4 12.4
Northumberland Land Transport, Storage & Post Workforce Jobs 4.1 4.0 4.1 4.1 4.1 4.1 4.1 4.1 4.1 4.2 4.3 4.3 4.3 4.3 4.3 4.3 4.3 4.4 4.4 4.4 4.4 4.4 4.4 4.4
Northumberland Air & Water Transport Workforce Jobs 0.1 0.1 0.1 0.1 0.1 0.1 0.1 0.1 0.1 0.1 0.1 0.1 0.1 0.1 0.1 0.1 0.1 0.1 0.1 0.1 0.1 0.1 0.1 0.1
Northumberland Accomodation & Food Services Workforce Jobs 10.4 11.5 11.0 11.8 11.9 12.1 12.3 12.5 12.8 13.0 13.3 13.4 13.5 13.5 13.6 13.6 13.6 13.6 13.7 13.7 13.7 13.7 13.7 13.7
Northumberland Recreation Workforce Jobs 4.6 4.5 4.5 4.7 4.8 4.8 4.9 5.0 5.1 5.3 5.4 5.5 5.5 5.6 5.6 5.6 5.7 5.7 5.7 5.7 5.8 5.8 5.9 5.9
Northumberland Media Activities Workforce Jobs 0.6 0.6 0.6 0.6 0.6 0.6 0.6 0.6 0.6 0.6 0.6 0.6 0.6 0.6 0.6 0.6 0.6 0.6 0.6 0.6 0.6 0.6 0.6 0.6
Northumberland Telecoms Workforce Jobs 0.2 0.1 0.1 0.1 0.1 0.1 0.1 0.1 0.1 0.1 0.1 0.1 0.1 0.1 0.1 0.1 0.1 0.1 0.1 0.1 0.1 0.1 0.1 0.1
Northumberland Computing & Information Services Workforce Jobs 0.9 1.0 1.0 1.1 1.1 1.1 1.1 1.1 1.1 1.2 1.2 1.2 1.2 1.2 1.2 1.2 1.3 1.3 1.3 1.3 1.3 1.3 1.3 1.3
Northumberland Finance Workforce Jobs 1.0 1.0 1.0 1.0 1.0 1.0 1.0 1.0 1.0 1.0 1.0 1.0 1.0 1.0 1.0 1.0 1.0 1.0 1.0 1.0 1.0 1.0 1.0 1.0
Northumberland Insurance & Pensions Workforce Jobs 0.0 0.0 0.0 0.0 0.0 0.0 0.0 0.0 0.0 0.0 0.0 0.0 0.0 0.0 0.0 0.0 0.0 0.0 0.0 0.0 0.0 0.0 0.0 0.0
Northumberland Real Estate Workforce Jobs 2.0 2.0 2.0 2.0 2.0 2.1 2.1 2.1 2.1 2.1 2.1 2.2 2.2 2.2 2.2 2.2 2.2 2.3 2.3 2.3 2.3 2.3 2.3 2.4
Northumberland Professional Services Workforce Jobs 6.6 8.0 8.0 7.7 7.7 7.8 7.8 7.9 8.0 8.1 8.3 8.3 8.4 8.5 8.5 8.6 8.7 8.7 8.8 8.9 9.0 9.0 9.1 9.2
Northumberland Administrative & Supportive Service Activities Workforce Jobs 5.9 6.1 6.3 6.7 6.8 6.8 6.8 6.8 6.9 6.9 7.0 7.0 7.1 7.1 7.2 7.3 7.3 7.4 7.5 7.5 7.6 7.6 7.7 7.8
Northumberland Other Private Services Workforce Jobs 3.8 4.1 4.4 4.2 4.2 4.2 4.2 4.2 4.2 4.3 4.3 4.3 4.3 4.3 4.3 4.3 4.3 4.3 4.3 4.3 4.3 4.4 4.4 4.4
Northumberland Public Administration & Defence Workforce Jobs 5.5 4.8 4.6 4.5 4.3 4.2 4.1 4.0 4.0 3.9 3.9 3.8 3.7 3.7 3.6 3.6 3.5 3.5 3.4 3.4 3.3 3.3 3.2 3.2
Northumberland Education Workforce Jobs 9.7 10.7 10.7 10.8 10.8 10.8 10.8 10.9 11.0 11.1 11.2 11.2 11.3 11.3 11.4 11.4 11.5 11.5 11.5 11.6 11.6 11.7 11.7 11.7
Northumberland Health Workforce Jobs 11.1 11.1 11.2 11.3 11.3 11.3 11.4 11.5 11.6 11.7 11.8 11.9 11.9 12.1 12.2 12.3 12.4 12.5 12.6 12.7 12.8 12.9 12.9 13.0
Northumberland Residential Care & Social Work Workforce Jobs 9.2 9.0 8.8 8.6 8.7 8.8 8.9 9.0 9.2 9.4 9.5 9.7 9.8 10.0 10.2 10.3 10.5 10.6 10.7 10.9 11.0 11.0 11.1 11.2

Industry Variable Name 2014 2015 2016 2017 2018 2019 2020 2021 2022 2023 2024 2025 2026 2027 2028 2029 2030 2031 2032 2033 2034 2035 2036 2037
Northumberland Agriculture, Forestry & Fishing GVA 237.8 234.3 218.4 221.9 226.6 230.7 233.9 237.3 242.4 248.3 254.0 256.8 257.7 258.5 258.8 258.6 258.6 258.6 258.6 258.4 258.0 257.6 257.2 256.7
Northumberland Extraction & Mining GVA 52.5 48.7 34.7 33.8 33.7 33.9 33.7 33.7 33.8 33.9 33.9 33.8 33.6 33.4 33.1 32.7 32.3 31.8 31.3 30.7 30.0 29.2 28.5 27.8
Northumberland Food, Drink & Tobacco GVA 75.9 80.3 80.9 82.3 83.0 84.6 86.2 87.9 89.8 92.1 94.6 95.8 96.2 96.4 96.4 96.2 96.1 96.0 96.0 95.8 95.7 95.5 95.3 95.0
Northumberland Textiles & Clothing GVA 5.3 5.5 5.2 5.7 5.8 5.9 5.9 6.0 6.0 6.1 6.1 6.2 6.2 6.3 6.3 6.3 6.4 6.4 6.5 6.5 6.5 6.6 6.6 6.6
Northumberland Wood & Paper GVA 75.4 80.4 80.4 86.3 87.3 88.4 89.4 90.1 91.1 92.4 94.0 94.4 94.0 93.7 93.3 92.9 92.4 92.0 91.6 91.0 90.4 89.8 89.1 88.3
Northumberland Printing and Reproduction of Recorded Media GVA 15.6 17.4 18.2 18.3 18.4 18.8 19.0 19.4 19.8 20.3 20.8 21.0 21.0 20.9 20.8 20.7 20.6 20.5 20.4 20.2 20.0 19.8 19.7 19.4
Northumberland Fuel Refining GVA 4.7 4.9 4.7 4.8 4.8 4.8 4.7 4.7 4.6 4.6 4.6 4.5 4.5 4.4 4.4 4.4 4.3 4.3 4.2 4.2 4.1 4.0 3.9 3.9
Northumberland Chemicals GVA 58.4 61.1 58.4 61.9 63.9 65.7 67.1 68.6 70.1 71.6 73.3 74.0 74.3 74.4 74.5 74.4 74.4 74.4 74.4 74.3 74.2 74.1 74.0 73.8
Northumberland Pharmaceuticals GVA 175.6 178.5 184.6 177.6 183.7 189.3 194.5 200.5 208.1 216.4 224.3 229.6 233.8 238.1 242.5 246.5 250.8 255.2 259.6 263.7 267.7 271.7 275.7 279.4
Northumberland Rubber, Plastic and Other Non-Metallic Mineral Products GVA 77.7 83.1 86.0 86.5 88.3 91.1 93.9 96.8 100.6 104.9 109.1 112.4 114.7 116.9 118.6 120.1 121.8 123.6 125.5 127.3 129.0 130.8 132.5 134.1
Northumberland Metal Products GVA 39.1 38.1 36.2 36.4 36.6 37.1 37.5 37.7 38.0 38.3 38.7 39.0 39.3 39.5 39.8 40.0 40.3 40.5 40.7 40.8 40.9 40.9 40.9 40.8
Northumberland Computer & Electronic Products GVA 49.1 51.3 50.9 53.2 54.8 56.5 58.3 60.3 62.9 66.0 69.0 70.9 72.0 73.1 74.2 75.4 76.6 77.8 78.8 79.7 80.5 81.3 82.1 83.0
Northumberland Machinery & Equipment GVA 61.1 55.7 55.4 58.6 59.7 62.2 63.9 65.7 67.8 70.1 72.0 73.5 74.8 75.8 76.9 77.8 78.8 79.9 81.1 82.2 83.2 84.2 85.3 86.4
Northumberland Transport Equipment GVA 14.3 14.6 14.5 14.8 15.0 15.4 15.8 16.0 16.3 16.6 16.9 17.0 17.1 17.1 17.1 17.2 17.3 17.3 17.4 17.5 17.5 17.6 17.7 17.8
Northumberland Other Manufacturing GVA 42.1 43.8 46.1 47.7 48.4 49.5 50.6 51.6 52.7 54.0 55.3 56.2 56.6 57.0 57.4 57.8 58.2 58.5 58.9 59.1 59.3 59.5 59.6 59.5
Northumberland Utilities GVA 134.0 141.9 146.4 147.4 150.2 154.2 158.2 162.5 167.2 172.4 177.3 180.4 182.0 183.5 184.7 185.5 186.4 187.3 188.0 188.4 188.6 188.7 188.7 188.4
Northumberland Construction of Buildings GVA 174.2 182.8 185.2 186.9 188.0 191.0 194.5 198.1 202.1 206.7 211.0 214.7 217.9 220.5 222.5 224.1 225.6 227.2 228.9 230.4 232.0 233.6 235.2 236.7
Northumberland Civil Engineering GVA 68.0 67.5 66.4 67.0 67.6 68.9 70.2 71.5 72.9 74.5 76.0 77.5 79.0 80.4 81.7 82.9 84.0 85.2 86.5 87.6 88.8 89.9 91.1 92.2
Northumberland Specialised Construction Activities GVA 128.3 132.3 132.2 133.4 134.2 135.9 138.3 141.0 144.0 147.5 150.7 153.7 156.6 159.4 161.8 164.0 166.3 168.7 171.2 173.5 175.9 178.4 180.9 183.4
Northumberland Wholesale GVA 207.4 217.5 223.6 227.5 229.3 232.3 236.3 240.8 246.7 253.5 260.3 266.4 272.2 277.2 280.9 283.6 286.1 288.9 291.6 294.2 296.7 299.3 302.0 304.4
Northumberland Retail GVA 322.7 335.1 340.6 346.5 350.8 355.9 361.6 369.4 380.0 390.7 399.9 407.8 415.7 423.7 431.5 439.0 446.7 454.9 463.2 471.0 478.8 486.7 494.6 502.1
Northumberland Land Transport, Storage & Post GVA 139.1 138.5 134.2 136.1 137.2 138.9 141.0 144.3 149.2 154.8 160.2 163.6 165.7 167.7 169.6 171.2 172.8 174.6 176.4 178.0 179.6 181.2 182.9 184.5
Northumberland Air & Water Transport GVA 5.0 5.7 6.1 6.0 6.1 6.1 6.2 6.3 6.5 6.8 7.0 7.2 7.3 7.4 7.6 7.7 7.9 8.1 8.3 8.6 8.8 9.0 9.3 9.5
Northumberland Accomodation & Food Services GVA 186.1 192.6 197.6 206.7 210.8 215.5 219.7 224.8 232.1 240.9 249.8 255.2 258.7 262.1 264.6 266.8 269.1 271.8 274.5 277.1 279.6 282.2 284.8 287.0
Northumberland Recreation GVA 89.0 82.1 78.7 80.7 82.4 84.3 86.9 90.0 93.9 98.6 103.3 106.2 108.2 109.9 111.4 112.9 114.5 116.3 118.1 119.9 121.8 123.6 125.6 127.5
Northumberland Media Activities GVA 20.8 23.9 25.3 26.4 27.1 27.7 28.5 29.4 30.6 32.1 33.4 34.6 35.7 36.7 37.7 38.7 39.7 40.8 42.0 43.1 44.2 45.4 46.6 47.7
Northumberland Telecoms GVA 12.9 11.9 10.4 10.1 10.3 10.5 10.9 11.4 11.9 12.6 13.2 13.8 14.4 14.9 15.3 15.8 16.4 16.9 17.4 18.0 18.6 19.2 19.8 20.3
Northumberland Computing & Information Services GVA 35.3 37.4 40.2 40.4 41.5 42.9 44.2 45.7 47.9 50.5 53.0 54.8 56.3 57.8 59.2 60.7 62.2 63.9 65.6 67.4 69.1 71.0 72.8 74.6
Northumberland Finance GVA 63.2 60.2 60.0 60.1 60.2 60.5 61.4 62.5 64.2 66.2 68.1 69.7 71.2 72.6 74.0 75.4 77.0 78.9 80.9 83.0 85.2 87.5 89.9 92.3
Northumberland Insurance & Pensions GVA 3.2 3.1 3.1 3.0 3.0 2.9 2.9 2.9 2.9 2.9 2.9 2.9 2.9 2.8 2.8 2.8 2.8 2.7 2.7 2.7 2.6 2.6 2.6 2.5
Northumberland Real Estate GVA 744.9 750.2 740.7 744.2 748.5 756.6 764.7 774.0 785.9 799.7 813.4 826.0 838.5 850.4 860.4 868.0 876.0 885.1 893.2 900.4 907.3 914.4 921.9 929.6
Northumberland Professional Services GVA 189.7 215.4 229.1 236.2 240.8 246.2 251.4 257.0 265.4 275.6 286.4 294.8 301.3 307.6 313.6 319.8 326.9 335.0 343.8 352.9 362.3 371.9 381.9 392.1
Northumberland Administrative & Supportive Service Activities GVA 124.7 136.2 139.5 145.2 148.8 152.2 156.8 162.2 168.9 176.7 184.4 191.2 197.8 204.2 210.9 217.7 224.9 232.5 240.3 248.3 256.5 265.0 273.9 282.9
Northumberland Other Private Services GVA 100.5 99.0 102.7 103.2 103.7 104.8 105.8 107.0 109.0 111.2 113.0 114.2 115.2 116.2 117.2 118.0 118.8 119.7 120.7 121.6 122.5 123.3 124.1 124.7
Northumberland Public Administration & Defence GVA 259.9 240.0 222.6 217.7 212.9 209.9 208.1 206.2 205.4 205.2 204.7 203.7 202.6 201.3 199.7 197.8 195.9 194.3 192.6 190.7 188.7 186.8 184.8 182.7
Northumberland Education GVA 320.9 342.1 341.6 345.1 347.4 350.4 353.5 357.5 363.8 371.1 377.8 382.8 387.3 391.7 395.5 398.2 400.7 403.6 406.6 409.2 411.5 413.7 415.8 417.4
Northumberland Health GVA 366.5 386.9 394.7 402.4 410.5 420.3 433.0 447.5 464.5 483.4 502.5 521.2 540.1 559.3 578.3 597.0 616.5 637.0 658.0 678.9 700.0 721.4 743.4 765.3
Northumberland Residential Care & Social Work GVA 137.5 138.5 136.8 137.6 138.8 141.2 144.1 147.2 151.2 155.6 159.6 163.4 167.0 170.6 174.0 177.0 180.2 183.5 186.9 190.1 193.3 196.4 199.5 202.5
Northumberland Agriculture, Forestry & Fishing Productivity (£GVA per hour) 64.7 67.8 61.5 62.3 63.2 63.8 64.3 65.0 65.9 66.9 67.5 68.2 69.0 69.7 70.3 70.7 70.9 71.1 71.3 71.4 71.4 71.5 71.5 71.6
Northumberland Extraction & Mining Productivity (£GVA per hour) 62.5 72.3 68.7 73.2 73.2 73.6 73.4 73.9 74.4 75.1 75.5 75.9 76.2 76.8 77.6 78.2 78.4 78.5 78.5 78.2 77.6 76.9 76.2 75.6
Northumberland Food, Drink & Tobacco Productivity (£GVA per hour) 26.2 28.2 28.0 28.2 28.1 28.1 28.2 28.3 28.5 28.7 28.9 29.1 29.3 29.4 29.5 29.6 29.7 29.8 29.9 29.9 30.0 30.0 30.0 30.0
Northumberland Textiles & Clothing Productivity (£GVA per hour) 15.9 15.9 13.5 14.6 15.0 15.3 15.7 16.1 16.6 17.1 17.6 18.1 18.5 18.9 19.4 20.0 20.6 21.3 22.1 22.8 23.5 24.3 25.1 25.9
Northumberland Wood & Paper Productivity (£GVA per hour) 19.2 20.2 18.8 20.3 20.5 20.9 21.2 21.5 21.8 22.1 22.5 22.8 23.2 23.6 23.9 24.3 24.7 25.1 25.4 25.8 26.0 26.3 26.6 26.8
Northumberland Printing and Reproduction of Recorded Media Productivity (£GVA per hour) 12.0 13.1 14.5 14.0 14.1 14.2 14.4 14.5 14.7 15.0 15.2 15.5 15.8 16.2 16.6 17.0 17.4 17.8 18.3 18.8 19.3 19.9 20.5 21.0
Northumberland Fuel Refining Productivity (£GVA per hour) 48.6 59.2 52.8 53.5 53.0 53.1 52.0 50.9 49.5 48.6 48.1 47.7 47.4 47.1 46.9 46.6 46.4 46.1 45.8 45.3 44.7 44.0 43.3 42.7
Northumberland Chemicals Productivity (£GVA per hour) 32.3 34.1 31.8 32.9 33.6 33.8 33.9 34.2 34.6 35.0 35.3 35.6 36.0 36.3 36.6 36.9 37.2 37.6 38.0 38.4 38.7 39.0 39.4 39.7
Northumberland Pharmaceuticals Productivity (£GVA per hour) 109.1 121.6 127.3 118.4 119.4 120.1 121.4 123.4 126.0 128.5 130.2 132.0 133.9 136.0 138.0 140.0 141.9 143.9 145.8 147.4 148.9 150.1 151.4 152.6
Northumberland Rubber, Plastic and Other Non-Metallic Mineral Products Productivity (£GVA per hour) 22.8 24.7 26.7 26.9 27.5 28.4 29.1 29.8 30.6 31.5 32.4 33.3 34.2 35.1 35.9 36.6 37.3 38.2 39.0 39.9 40.6 41.4 42.1 42.8
Northumberland Metal Products Productivity (£GVA per hour) 18.0 19.3 19.6 19.4 19.6 19.9 20.4 20.9 21.4 22.0 22.5 22.9 23.4 23.8 24.3 24.8 25.3 25.7 26.1 26.5 26.8 27.1 27.4 27.6
Northumberland Computer & Electronic Products Productivity (£GVA per hour) 19.3 19.4 19.6 20.5 21.1 21.6 22.2 22.9 23.6 24.4 25.1 25.7 26.3 26.8 27.4 28.0 28.6 29.2 29.8 30.4 30.9 31.4 31.9 32.4
Northumberland Machinery & Equipment Productivity (£GVA per hour) 26.7 25.7 28.3 29.1 30.2 31.2 32.0 33.2 34.6 36.1 37.3 38.3 39.5 40.7 42.0 43.3 44.6 45.9 47.2 48.5 49.7 50.9 52.1 53.4
Northumberland Transport Equipment Productivity (£GVA per hour) 20.4 22.9 26.8 26.1 26.5 27.0 27.8 28.3 29.0 29.9 30.7 31.3 31.9 32.5 33.2 34.0 34.8 35.6 36.4 37.1 37.8 38.5 39.2 40.1
Northumberland Other Manufacturing Productivity (£GVA per hour) 18.8 17.8 16.9 16.8 17.1 17.6 18.2 18.7 19.2 19.8 20.3 20.8 21.2 21.5 21.9 22.2 22.6 23.0 23.3 23.6 23.8 24.0 24.3 24.4
Northumberland Utilities Productivity (£GVA per hour) 45.7 48.3 47.9 47.2 46.9 47.0 47.2 47.5 47.7 47.9 47.9 48.1 48.2 48.3 48.4 48.5 48.6 48.6 48.6 48.5 48.4 48.2 48.0 47.8
Northumberland Construction of Buildings Productivity (£GVA per hour) 44.9 42.5 40.6 39.0 39.2 39.8 40.5 41.1 41.8 42.7 43.4 44.0 44.6 45.1 45.7 46.3 46.9 47.5 48.2 48.7 49.2 49.7 50.2 50.6
Northumberland Civil Engineering Productivity (£GVA per hour) 45.9 49.4 49.0 48.1 48.7 49.4 50.2 51.1 52.1 53.1 54.0 54.8 55.7 56.7 57.7 58.7 59.8 60.9 62.0 62.9 63.9 64.8 65.6 66.4
Northumberland Specialised Construction Activities Productivity (£GVA per hour) 19.8 21.2 19.2 18.6 18.8 19.0 19.3 19.6 20.0 20.4 20.7 21.0 21.4 21.7 22.1 22.5 22.9 23.4 23.8 24.2 24.6 25.0 25.4 25.8
Northumberland Wholesale Productivity (£GVA per hour) 21.3 22.7 23.5 23.9 24.0 24.2 24.5 24.9 25.5 26.2 26.8 27.4 28.0 28.6 29.0 29.4 29.7 30.1 30.4 30.7 31.0 31.3 31.6 31.8
Northumberland Retail Productivity (£GVA per hour) 17.1 18.4 19.2 20.0 20.3 20.6 21.0 21.3 21.8 22.4 22.8 23.3 23.7 24.2 24.6 25.1 25.6 26.1 26.6 27.1 27.5 28.0 28.5 29.0
Northumberland Land Transport, Storage & Post Productivity (£GVA per hour) 18.5 18.4 17.1 17.2 17.4 17.7 17.9 18.1 18.5 18.9 19.3 19.5 19.7 19.9 20.1 20.2 20.4 20.5 20.7 20.8 20.9 21.0 21.1 21.2
Northumberland Air & Water Transport Productivity (£GVA per hour) 50.7 46.7 42.6 42.1 42.7 43.1 43.7 44.3 45.7 47.3 48.6 49.6 50.5 51.4 52.5 53.7 54.9 56.2 57.7 59.1 60.6 62.1 63.5 65.0
Northumberland Accomodation & Food Services Productivity (£GVA per hour) 15.3 13.4 14.0 13.5 13.5 13.6 13.6 13.6 13.7 13.9 14.1 14.3 14.4 14.6 14.7 14.8 15.0 15.1 15.3 15.4 15.6 15.7 15.9 16.1
Northumberland Recreation Productivity (£GVA per hour) 19.4 16.4 15.0 14.5 14.6 14.7 14.8 15.0 15.3 15.6 15.9 16.1 16.3 16.4 16.6 16.7 16.8 17.0 17.1 17.3 17.4 17.5 17.6 17.7
Northumberland Media Activities Productivity (£GVA per hour) 35.9 39.6 41.8 41.9 42.8 43.5 44.1 44.9 46.2 48.0 49.7 51.2 52.5 53.7 54.9 56.2 57.5 58.9 60.4 61.8 63.4 65.0 66.6 68.1
Northumberland Telecoms Productivity (£GVA per hour) 44.8 47.7 40.4 38.3 38.9 39.9 41.5 43.3 45.6 48.0 50.6 53.1 55.4 57.5 59.6 61.9 64.3 66.7 69.1 71.5 73.9 76.4 78.8 81.0
Northumberland Computing & Information Services Productivity (£GVA per hour) 21.1 21.8 22.4 22.0 22.4 22.7 23.1 23.5 24.2 25.0 25.7 26.3 26.8 27.4 28.0 28.6 29.2 29.8 30.4 31.0 31.5 32.1 32.7 33.2
Northumberland Finance Productivity (£GVA per hour) 38.6 40.0 37.4 36.7 36.7 37.1 37.8 38.5 39.6 40.8 41.9 43.0 44.0 44.9 45.8 46.8 47.8 48.9 50.1 51.3 52.6 53.9 55.3 56.6
Northumberland Insurance & Pensions Productivity (£GVA per hour) 161.9 152.2 150.3 145.9 146.1 146.5 147.0 148.2 149.7 151.5 153.4 154.7 156.0 156.7 157.1 158.1 158.8 159.6 160.0 160.3 160.6 160.8 161.0 161.0
Northumberland Real Estate Productivity (£GVA per hour) 244.6 235.5 229.7 226.3 224.1 223.8 224.0 225.1 226.7 228.9 231.0 232.4 234.0 235.6 237.0 238.0 239.1 240.1 240.7 240.9 240.9 240.8 240.8 240.8
Northumberland Professional Services Productivity (£GVA per hour) 20.9 18.5 20.5 22.0 22.4 22.8 23.2 23.5 24.1 24.6 25.2 25.7 26.1 26.5 26.9 27.3 27.8 28.3 28.9 29.4 30.0 30.5 31.0 31.5
Northumberland Administrative & Supportive Service Activities Productivity (£GVA per hour) 13.1 14.2 14.5 14.1 14.4 14.7 15.0 15.5 16.1 16.7 17.3 17.9 18.4 19.0 19.6 20.2 20.8 21.4 22.1 22.7 23.4 24.0 24.7 25.4
Northumberland Other Private Services Productivity (£GVA per hour) 23.7 24.4 22.7 24.6 24.5 24.6 24.7 25.0 25.4 25.8 26.1 26.3 26.5 26.8 27.0 27.2 27.4 27.6 27.8 28.0 28.2 28.3 28.5 28.6
Northumberland Public Administration & Defence Productivity (£GVA per hour) 27.5 29.5 29.7 29.5 29.9 30.1 30.4 30.5 30.6 30.9 31.2 31.5 31.8 32.1 32.4 32.7 33.0 33.3 33.6 33.8 34.0 34.2 34.4 34.6
Northumberland Education Productivity (£GVA per hour) 23.9 23.2 23.5 23.3 23.5 23.6 23.7 23.7 23.9 24.2 24.4 24.6 24.8 25.1 25.3 25.5 25.7 25.8 26.0 26.2 26.3 26.5 26.6 26.7
Northumberland Health Productivity (£GVA per hour) 20.0 21.7 22.7 22.8 23.2 23.6 24.1 24.6 25.2 26.0 26.8 27.6 28.4 29.2 30.0 30.8 31.7 32.6 33.5 34.3 35.2 36.0 36.9 37.8
Northumberland Residential Care & Social Work Productivity (£GVA per hour) 9.4 10.2 9.9 10.1 10.1 10.0 10.0 10.0 10.0 10.1 10.1 10.2 10.2 10.2 10.3 10.3 10.3 10.4 10.5 10.5 10.6 10.7 10.8 10.8
Housing and economic growth options
Findings report
June 2018
APPENDIX H SECTORS TO USE CLASSES
Employment land use
Sector (Experian) Industry (5 digit SIC)
Manufacturing Food, Drink & Tobacco 10110 : Processing and preserving of meat
Manufacturing Food, Drink & Tobacco 10120 : Processing and preserving of poultry meat
Manufacturing Food, Drink & Tobacco 10130 : Production of meat and poultry meat products
Manufacturing Food, Drink & Tobacco 10200 : Processing and preserving of fish, crustaceans and molluscs
Manufacturing Food, Drink & Tobacco 10310 : Processing and preserving of potatoes
Manufacturing Food, Drink & Tobacco 10320 : Manufacture of fruit and vegetable juice
Manufacturing Food, Drink & Tobacco 10390 : Other processing and preserving of fruit and vegetables
Manufacturing Food, Drink & Tobacco 10410 : Manufacture of oils and fats
Manufacturing Food, Drink & Tobacco 10420 : Manufacture of margarine and similar edible fats
Manufacturing Food, Drink & Tobacco 10511 : Liquid milk and cream production
Manufacturing Food, Drink & Tobacco 10512 : Butter and cheese production
Manufacturing Food, Drink & Tobacco 10519 : Manufacture of milk products (other than liquid milk and cream,butter, cheese) nec
Manufacturing Food, Drink & Tobacco 10520 : Manufacture of ice cream
Manufacturing Food, Drink & Tobacco 10611 : Grain milling
Manufacturing Food, Drink & Tobacco 10612 : Manufacture of breakfast cereals and cereals-based foods
Manufacturing Food, Drink & Tobacco 10620 : Manufacture of starches and starch products
Manufacturing Food, Drink & Tobacco 10710 : Manufacture of bread; manufacture of fresh pastry goods and cakes
Manufacturing Food, Drink & Tobacco 10720 : Manufacture of rusks and biscuits; manufacture of preserved pastry goods and cakes
Manufacturing Food, Drink & Tobacco 10730 : Manufacture of macaroni, noodles, couscous and similar farinaceous products
Manufacturing Food, Drink & Tobacco 10810 : Manufacture of sugar
Manufacturing Food, Drink & Tobacco 10821 : Manufacture of cocoa, and chocolate confectionery
Manufacturing Food, Drink & Tobacco 10822 : Manufacture of sugar confectionery
Manufacturing Food, Drink & Tobacco 10831 : Tea processing
Manufacturing Food, Drink & Tobacco 10832 : Production of coffee and coffee substitutes
Manufacturing Food, Drink & Tobacco 10840 : Manufacture of condiments and seasonings
Manufacturing Food, Drink & Tobacco 10850 : Manufacture of prepared meals and dishes
Manufacturing Food, Drink & Tobacco 10860 : Manufacture of homogenised food preparations and dietetic food
Housing and economic growth options
Findings report
June 2018
Employment land use
Sector (Experian) Industry (5 digit SIC)
Manufacturing Food, Drink & Tobacco 10890 : Manufacture of other food products nec
Manufacturing Food, Drink & Tobacco 10910 : Manufacture of prepared feeds for farm animals
Manufacturing Food, Drink & Tobacco 10920 : Manufacture of prepared pet foods
Manufacturing Food, Drink & Tobacco 11010 : Distilling, rectifying and blending of spirits
Manufacturing Food, Drink & Tobacco 11020 : Manufacture of wine from grape
Manufacturing Food, Drink & Tobacco 11030 : Manufacture of cider and other fruit wines
Manufacturing Food, Drink & Tobacco 11040 : Manufacture of other non-distilled fermented beverages
Manufacturing Food, Drink & Tobacco 11050 : Manufacture of beer
Manufacturing Food, Drink & Tobacco 11060 : Manufacture of malt
Manufacturing Food, Drink & Tobacco 11070 : Manufacture of soft drinks; production of mineral waters and other bottled waters
Manufacturing Food, Drink & Tobacco 12000 : Manufacture of tobacco products
Manufacturing Textiles & Clothing 13100 : Preparation and spinning of textile fibres
Manufacturing Textiles & Clothing 13200 : Weaving of textiles
Manufacturing Textiles & Clothing 13300 : Finishing of textiles
Manufacturing Textiles & Clothing 13910 : Manufacture of knitted and crocheted fabrics
Manufacturing Textiles & Clothing 13921 : Manufacture of soft furnishings
Manufacturing Textiles & Clothing 13922 : Manufacture of canvas goods, sacks etc
Manufacturing Textiles & Clothing 13923 : Manufacture of household textiles (other than soft furnishings of 13921)
Manufacturing Textiles & Clothing 13931 : Manufacture of woven or tufted carpets and rugs
Manufacturing Textiles & Clothing 13939 : Manufacture of carpets and rugs (other than woven or tufted) nec
Manufacturing Textiles & Clothing 13940 : Manufacture of cordage, rope, twine and netting
Manufacturing Textiles & Clothing 13950 : Manufacture of non-wovens and articles made from non-wovens, except apparel
Manufacturing Textiles & Clothing 13960 : Manufacture of other technical and industrial textiles
Manufacturing Textiles & Clothing 13990 : Manufacture of other textiles nec
Manufacturing Textiles & Clothing 14110 : Manufacture of leather clothes
Manufacturing Textiles & Clothing 14120 : Manufacture of workwear
Manufacturing Textiles & Clothing 14131 : Manufacture of men's outerwear, other than leather clothes and workwear
Manufacturing Textiles & Clothing 14132 : Manufacture of women's outerwear, other than leather clothes and workwear
Manufacturing Textiles & Clothing 14141 : Manufacture of men's underwear
Housing and economic growth options
Findings report
June 2018
Employment land use
Sector (Experian) Industry (5 digit SIC)
Manufacturing Textiles & Clothing 14142 : Manufacture of women's underwear
Manufacturing Textiles & Clothing 14190 : Manufacture of other wearing apparel and accessories
Manufacturing Textiles & Clothing 14200 : Manufacture of articles of fur
Manufacturing Textiles & Clothing 14310 : Manufacture of knitted and crocheted hosiery
Manufacturing Textiles & Clothing 14390 : Manufacture of other knitted and crocheted apparel
Manufacturing Textiles & Clothing 15110 : Tanning and dressing of leather; dressing and dyeing of fur
Manufacturing Textiles & Clothing 15120 : Manufacture of luggage, handbags and the like, saddlery and harness
Manufacturing Textiles & Clothing 15200 : Manufacture of footwear
Manufacturing Wood & Paper 16100 : Sawmilling and planing of wood
Manufacturing Wood & Paper 16210 : Manufacture of veneer sheets and wood-based panels
Manufacturing Wood & Paper 16220 : Manufacture of assembled parquet floors
Manufacturing Wood & Paper 16230 : Manufacture of other builders' carpentry and joinery
Manufacturing Wood & Paper 16240 : Manufacture of wooden containers
Manufacturing Wood & Paper 16290 : Manufacture of other products of wood; manufacture of articles of cork, straw and plaiting materials
Manufacturing Wood & Paper 17110 : Manufacture of pulp
Manufacturing Wood & Paper 17120 : Manufacture of paper and paperboard
Manufacturing Wood & Paper 17211 : Manufacture of corrugated paper and paperboard; manufacture of sacks and bags of paper
Manufacturing Wood & Paper 17219 : Manufacture of paper and paperboard containers other than sacks and bags
Manufacturing Wood & Paper 17220 : Manufacture of household and sanitary goods and of toilet requisites
Manufacturing Wood & Paper 17230 : Manufacture of paper stationery
Manufacturing Wood & Paper 17240 : Manufacture of wallpaper
Manufacturing Wood & Paper 17290 : Manufacture of other articles of paper and paperboard
Manufacturing Printing and Reproduction of Recorded Media
18110 : Printing of newspapers
Manufacturing Printing and Reproduction of Recorded Media
18121 : Manufacture of printed labels
Manufacturing Printing and Reproduction of Recorded Media
18129 : Printing (other than printing of newspaper s and printing on labels and tags) nec
Manufacturing Printing and Reproduction of Recorded Media
18130 : Pre-press and pre-media services
Manufacturing Printing and Reproduction of Recorded Media
18140 : Binding and related services
Housing and economic growth options
Findings report
June 2018
Employment land use
Sector (Experian) Industry (5 digit SIC)
Manufacturing Printing and Reproduction of Recorded Media
18201 : Reproduction of sound recording
Manufacturing Printing and Reproduction of Recorded Media
18202 : Reproduction of video recording
Manufacturing Printing and Reproduction of Recorded Media
18203 : Reproduction of computer media
Manufacturing Fuel Refining 19100 : Manufacture of coke oven products
Manufacturing Fuel Refining 19201 : Mineral oil refining
Manufacturing Fuel Refining 19209 : Other treatment of petroleum products (excluding mineral oil refining petrochemicals manufacture)
Manufacturing Chemicals 20110 : Manufacture of industrial gases
Manufacturing Chemicals 20120 : Manufacture of dyes and pigments
Manufacturing Chemicals 20130 : Manufacture of other inorganic basic chemicals
Manufacturing Chemicals 20140 : Manufacture of other organic basic chemicals
Manufacturing Chemicals 20150 : Manufacture of fertilisers and nitrogen compounds
Manufacturing Chemicals 20160 : Manufacture of plastics in primary forms
Manufacturing Chemicals 20170 : Manufacture of synthetic rubber in primary forms
Manufacturing Chemicals 20200 : Manufacture of pesticides and other agrochemical products
Manufacturing Chemicals 20301 : Manufacture of paints, varnishes and similar coatings, mastics and sealants
Manufacturing Chemicals 20302 : Manufacture of printing ink
Manufacturing Chemicals 20411 : Manufacture of soap and detergents
Manufacturing Chemicals 20412 : Manufacture of cleaning and polishing preparations
Manufacturing Chemicals 20420 : Manufacture of perfumes and toilet preparations
Manufacturing Chemicals 20510 : Manufacture of explosives
Manufacturing Chemicals 20520 : Manufacture of glues
Manufacturing Chemicals 20530 : Manufacture of essential oils
Manufacturing Chemicals 20590 : Manufacture of other chemical products nec
Manufacturing Chemicals 20600 : Manufacture of man-made fibres
Manufacturing Pharmaceuticals 21100 : Manufacture of basic pharmaceutical products
Manufacturing Pharmaceuticals 21200 : Manufacture of pharmaceutical preparations
Manufacturing Rubber, Plastic and Other Non-Metallic Mineral Products
22110 : Manufacture of rubber tyres and tubes; retreading and rebuilding of rubber tyres
Manufacturing Rubber, Plastic and Other Non-Metallic Mineral Products
22190 : Manufacture of other rubber products
Housing and economic growth options
Findings report
June 2018
Employment land use
Sector (Experian) Industry (5 digit SIC)
Manufacturing Rubber, Plastic and Other Non-Metallic Mineral Products
22210 : Manufacture of plastic plates, sheets, tubes and profiles
Manufacturing Rubber, Plastic and Other Non-Metallic Mineral Products
22220 : Manufacture of plastic packing goods
Manufacturing Rubber, Plastic and Other Non-Metallic Mineral Products
22230 : Manufacture of builders� ware of plastic
Manufacturing Rubber, Plastic and Other Non-Metallic Mineral Products
22290 : Manufacture of other plastic products
Manufacturing Rubber, Plastic and Other Non-Metallic Mineral Products
23110 : Manufacture of flat glass
Manufacturing Rubber, Plastic and Other Non-Metallic Mineral Products
23120 : Shaping and processing of flat glass
Manufacturing Rubber, Plastic and Other Non-Metallic Mineral Products
23130 : Manufacture of hollow glass
Manufacturing Rubber, Plastic and Other Non-Metallic Mineral Products
23140 : Manufacture of glass fibres
Manufacturing Rubber, Plastic and Other Non-Metallic Mineral Products
23190 : Manufacture and processing of other glass, including technical glassware
Manufacturing Rubber, Plastic and Other Non-Metallic Mineral Products
23200 : Manufacture of refractory products
Manufacturing Rubber, Plastic and Other Non-Metallic Mineral Products
23310 : Manufacture of ceramic tiles a nd flags
Manufacturing Rubber, Plastic and Other Non-Metallic Mineral Products
23320 : Manufacture of bricks, tiles a nd construction products, in baked clay
Manufacturing Rubber, Plastic and Other Non-Metallic Mineral Products
23410 : Manufacture of ceramic household and ornamental articles
Manufacturing Rubber, Plastic and Other Non-Metallic Mineral Products
23420 : Manufacture of ceramic sanitary fixtures
Manufacturing Rubber, Plastic and Other Non-Metallic Mineral Products
23430 : Manufacture of ceramic insulating fittings
Manufacturing Rubber, Plastic and Other Non-Metallic Mineral Products
23440 : Manufacture of other technical ceramic products
Manufacturing Rubber, Plastic and Other Non-Metallic Mineral Products
23490 : Manufacture of other ceramic products
Manufacturing Rubber, Plastic and Other Non-Metallic Mineral Products
23510 : Manufacture of cement
Manufacturing Rubber, Plastic and Other Non-Metallic Mineral Products
23520 : Manufacture of lime and plaster
Manufacturing Rubber, Plastic and Other Non-Metallic Mineral Products
23610 : Manufacture of concrete products for construction purposes
Manufacturing Rubber, Plastic and Other Non-Metallic Mineral Products
23620 : Manufacture of plaster products for construction purposes
Manufacturing Rubber, Plastic and Other Non-Metallic Mineral Products
23630 : Manufacture of ready-mixed concrete
Manufacturing Rubber, Plastic and Other Non-Metallic Mineral Products
23640 : Manufacture of mortars
Manufacturing Rubber, Plastic and Other Non-Metallic Mineral Products
23650 : Manufacture of fibre cement
Manufacturing Rubber, Plastic and Other Non-Metallic Mineral Products
23690 : Manufacture of other articles of concrete plaster and cement
Manufacturing Rubber, Plastic and Other Non-Metallic Mineral Products
23700 : Cutting, shaping and finishing of stone
Housing and economic growth options
Findings report
June 2018
Employment land use
Sector (Experian) Industry (5 digit SIC)
Manufacturing Rubber, Plastic and Other Non-Metallic Mineral Products
23910 : Production of abrasive products
Manufacturing Rubber, Plastic and Other Non-Metallic Mineral Products
23990 : Manufacture of other non-metallic mineral products
Manufacturing Metal products 24100 : Manufacture of basic iron and steel and of ferro-alloys
Manufacturing Metal products 24200 : Manufacture of tubes, pipes, hollow profiles and related fittings, of steel
Manufacturing Metal products 24310 : Cold drawing of bars
Manufacturing Metal products 24320 : Cold rolling of narrow strip
Manufacturing Metal products 24330 : Cold forming or folding
Manufacturing Metal products 24340 : Cold drawing of wire
Manufacturing Metal products 24410 : Precious metals production
Manufacturing Metal products 24420 : Aluminium production
Manufacturing Metal products 24430 : Lead, zinc and tin production
Manufacturing Metal products 24440 : Copper production
Manufacturing Metal products 24450 : Other non-ferrous metal production
Manufacturing Metal products 24460 : Processing of nuclear fuel
Manufacturing Metal products 24510 : Casting of iron
Manufacturing Metal products 24520 : Casting of steel
Manufacturing Metal products 24530 : Casting of light metals
Manufacturing Metal products 24540 : Casting of other non-ferrous metals
Manufacturing Metal products 25110 : Manufacture of metal structures and parts of structures
Manufacturing Metal products 25120 : Manufacture of doors and windows of metals
Manufacturing Metal products 25210 : Manufacture of central heating radiators and boilers
Manufacturing Metal products 25290 : Manufacture of other tanks, reservoirs and containers of metal
Manufacturing Metal products 25300 : Manufacture of steam generators, except central heating hot water boilers
Manufacturing Metal products 25400 : Manufacture of weapons and ammunition
Manufacturing Metal products 25500 : Forging, pressing, stamping and roll-forming of metal; powder metallurgy
Manufacturing Metal products 25610 : Treatment and coating of metals
Manufacturing Metal products 25620 : Machining
Manufacturing Metal products 25710 : Manufacture of cutlery
Manufacturing Metal products 25720 : Manufacture of locks and hinges
Housing and economic growth options
Findings report
June 2018
Employment land use
Sector (Experian) Industry (5 digit SIC)
Manufacturing Metal products 25730 : Manufacture of tools
Manufacturing Metal products 25910 : Manufacture of steel drums and similar containers
Manufacturing Metal products 25920 : Manufacture of light metal packaging
Manufacturing Metal products 25930 : Manufacture of wire products, chain and springs
Manufacturing Metal products 25940 : Manufacture of fasteners and screw machine products
Manufacturing Metal products 25990 : Manufacture of other fabricated metal products nec
Manufacturing Computer & Electronic Products 26110 : Manufacture of electronic components
Manufacturing Computer & Electronic Products 26120 : Manufacture of loaded electronic boards
Manufacturing Computer & Electronic Products 26200 : Manufacture of computers and peripheral equipment
Manufacturing Computer & Electronic Products 26301 : Manufacture of telegraph and telephone apparatus and equipment
Manufacturing Computer & Electronic Products 26309 : Manufacture of communication equipment (other than telegraph and telephone apparatus and equipment
Manufacturing Computer & Electronic 26400 : Manufacture of consumer electronics
Manufacturing Computer & Electronic
26511 : Manufacture of electronic instruments and appliances for measuring, testing, and navigation, except industrial process control equipment navigation, except industrial process control equipment
Manufacturing Computer & Electronic 26512 : Manufacture of electronic industrial process control equipment
Manufacturing Computer & Electronic 26513 : Manufacture of non-electronic instruments and appliances for measuring, testing and navigation, except industrial process control equipment
Manufacturing Computer & Electronic Products 26514 : Manufacture of non-electronic industrial process control equipment
Manufacturing Computer & Electronic Products 26520 : Manufacture of watches and clocks
Manufacturing Computer & Electronic Products 26600 : Manufacture of irradiation, electromedical and electrotherapeutic equipment
Manufacturing Computer & Electronic Products 26701 : Manufacture of optical precision instruments
Manufacturing Computer & Electronic Products 26702 : Manufacture of photographic and cinematographic equipment
Manufacturing Computer & Electronic Products 26800 : Manufacture of magnetic and optical media
Manufacturing Computer & Electronic Products 27110 : Manufacture of electric motors, generators and transformers
Manufacturing Computer & Electronic Products 27120 : Manufacture of electricity distribution and control apparatus
Manufacturing Computer & Electronic Products 27200 : Manufacture of batteries and accumulators
Manufacturing Computer & Electronic Products 27310 : Manufacture of fibre optic cables
Manufacturing Computer & Electronic Products 27320 : Manufacture of other electronic and electric wires and cables

Housing and economic growth options
Findings report
June 2018
Employment land use
Sector (Experian) Industry (5 digit SIC)
Manufacturing Computer & Electronic Products 27330 : Manufacture of wiring devices
Manufacturing Computer & Electronic Products 27400 : Manufacture of electric lighting equipment
Manufacturing Computer & Electronic Products 27510 : Manufacture of electric domestic appliances
Manufacturing Computer & Electronic Products 27520 : Manufacture of non-electric domestic appliances
Manufacturing Computer & Electronic Products 27900 : Manufacture of other electrical equipment
Manufacturing Machinery & Equipment 28110 : Manufacture of engines and turbines, except aircraft, vehicle and cycle engines
Manufacturing Machinery & Equipment 28120 : Manufacture of fluid power equipment
Manufacturing Machinery & Equipment 28131 : Manufacture of pumps
Manufacturing Machinery & Equipment 28132 : Manufacture of compressors
Manufacturing Machinery & Equipment 28140 : Manufacture of other taps and valves
Manufacturing Machinery & Equipment 28150 : Manufacture of bearings, gears, gearing and driving elements
Manufacturing Machinery & Equipment 28210 : Manufacture of ovens, furnaces and furnace burners
Manufacturing Machinery & Equipment 28220 : Manufacture of lifting and handling equipment
Manufacturing Machinery & Equipment 28230 : Manufacture of office machinery and equipment (except computers and peripheral equipment)
Manufacturing Machinery & Equipment 28240 : Manufacture of power-driven hand tools
Manufacturing Machinery & Equipment 28250 : Manufacture of non-domestic cooling and ventilation equipment
Manufacturing Machinery & Equipment 28290 : Manufacture of other general-purpose machinery nec
Manufacturing Machinery & Equipment 28301 : Manufacture of agricultural tractors
Manufacturing Machinery & Equipment 28302 : Manufacture of agricultural and forestry machinery (other than a gricultural tractors)
Manufacturing Machinery & Equipment 28410 : Manufacture of metal forming machinery
Manufacturing Machinery & Equipment 28490 : Manufacture of other machine tools
Manufacturing Machinery & Equipment 28910 : Manufacture of machinery for metallurgy
Manufacturing Machinery & Equipment 28921 : Manufacture of machinery for mining
Manufacturing Machinery & Equipment 28922 : Manufacture of earthmoving equipment
Manufacturing Machinery & Equipment 28923 : Manufacture of equipment for concrete crushing and screening roadworks
Manufacturing Machinery & Equipment 28930 : Manufacture of machinery for food, beverage and tobacco processing
Manufacturing Machinery & Equipment 28940 : Manufacture of machinery for textile, apparel and leather production
Manufacturing Machinery & Equipment 28950 : Manufacture of machinery for paper and paperboard production
Housing and economic growth options
Findings report
June 2018
Employment land use
Sector (Experian) Industry (5 digit SIC)
Manufacturing Machinery & Equipment 28960 : Manufacture of plastics and rubber machinery
Manufacturing Machinery & Equipment 28990 : Manufacture of other special-purpose machinery nec
Manufacturing Machinery & Equipment 29100 : Manufacture of motor vehicles
Manufacturing Machinery & Equipment 29201 : Manufacture of bodies (coachwork) for motor vehicles (except caravans)
Manufacturing Machinery & Equipment 29202 : Manufacture of trailers and semi-trailers
Manufacturing Machinery & Equipment 29203 : Manufacture of caravans
Manufacturing Machinery & Equipment 29310 : Manufacture of electrical and electronic equipment for motor vehicles
Manufacturing Machinery & Equipment 29320 : Manufacture of other parts and accessories for motor vehicles
Manufacturing Machinery & Equipment 30110 : Building of ships and floating structures
Manufacturing Machinery & Equipment 30120 : Building of pleasure and sporting boats
Manufacturing Machinery & Equipment 30200 : Manufacture of railway locomotives and rolling stock
Manufacturing Machinery & Equipment 30300 : Manufacture of air and spacecraft and related machinery
Manufacturing Machinery & Equipment 30400 : Manufacture of military fighting vehicles
Manufacturing Machinery & Equipment 30910 : Manufacture of motorcycles
Manufacturing Machinery & Equipment 30920 : Manufacture of bicycles and invalid carriages
Manufacturing Machinery & Equipment 30990 : Manufacture of other transport equipment nec
Manufacturing Other Manufacturing 31010 : Manufacture of office and shop furniture
Manufacturing Other Manufacturing 31020 : Manufacture of kitchen furniture
Manufacturing Other Manufacturing 31030 : Manufacture of mattresses
Manufacturing Other Manufacturing 31090 : Manufacture of other furniture
Manufacturing Other Manufacturing 32110 : Striking of coins
Manufacturing Other Manufacturing 32120 : Manufacture of jewellery and related articles
Manufacturing Other Manufacturing 32130 : Manufacture of imitation jewellery and related articles
Manufacturing Other Manufacturing 32200 : Manufacture of musical instruments
Manufacturing Other Manufacturing 32300 : Manufacture of sports goods
Manufacturing Other Manufacturing 32401 : Manufacture of professional and arcade games and toys
Manufacturing Other Manufacturing 32409 : Manufacture of games and toys (other than professional and arcade games and toys)
Manufacturing Other Manufacturing 32500 : Manufacture of medical and dental instruments and supplies
Manufacturing Other Manufacturing 32910 : Manufacture of brooms and brushes
Housing and economic growth options
Findings report
June 2018
Employment land use
Sector (Experian) Industry (5 digit SIC)
Manufacturing Other Manufacturing 32990 : Other manufacturing nec
Manufacturing Other Manufacturing 33110 : Repair of fabricated metal products
Manufacturing Other Manufacturing 33120 : Repair of machinery
Manufacturing Other Manufacturing 33130 : Repair of electronic and optical equipment
Manufacturing Other Manufacturing 33140 : Repair of electrical equipment
Manufacturing Other Manufacturing 33150 : Repair and maintenance of ships and boats
Manufacturing Other Manufacturing 33160 : Repair and maintenance of aircraft and spacecraft
Manufacturing Other Manufacturing 33170 : Repair and maintenance of other transport equipment
Manufacturing Other Manufacturing 33190 : Repair of other equipment
Manufacturing Other Manufacturing 33200 : Installation of industrial machinery and equipment
Other industrial Utilities 37000 : Sewerage
Other industrial Utilities 38110 : Collection of non-hazardous waste
Other industrial Utilities 38120 : Collection of hazardous waste
Other industrial Utilities 38210 : Treatment and disposal of non-hazardous waste
Other industrial Utilities 38220 : Treatment and disposal of hazardous waste
Other industrial Utilities 38310 : Dismantling of wrecks
Other industrial Utilities 38320 : Recovery of sorted materials
Other industrial Specialised Construction Activities 43210 : Electrical installation
Other industrial Specialised Construction Activities 43220 : Plumbing, heat and air-conditioning installation
Other industrial Specialised Construction Activities 43290 : Other construction installation
Other industrial Specialised Construction Activities 43310 : Plastering
Other industrial Specialised Construction Activities 43320 : Joinery installation
Other industrial Specialised Construction Activities 43330 : Floor and wall covering
Other industrial Specialised Construction Activities 43341 : Painting
Other industrial Specialised Construction Activities 43342 : Glazing
Other industrial Specialised Construction Activities 43390 : Other building completion and finishing
Other industrial Specialised Construction Activities 43910 : Roofing activities
Other industrial Specialised Construction Activities 43991 : Scaffold erection
Other industrial Specialised Construction Activities 43999 : Specialised construction activities (other than scaffold erection)
Other industrial Wholesale 45200 : Maintenance and repair of motor vehicles
Housing and economic growth options
Findings report
June 2018
Employment land use
Sector (Experian) Industry (5 digit SIC)
Other industrial Wholesale 45400 : Sale, maintenance and repair of motorcycles and related parts and accessories
Warehousing Wholesale 46110 : Agents involved in the sale of agricultural raw materials, live animals, texti and semi-finished goods
Warehousing Wholesale 46120 : Agents involved in the sale of fuels, ores, metals and industrial chemicals
Warehousing Wholesale 46130 : Agents involved in the sale of timber and building materials
Warehousing Wholesale 46140 : Agents involved in the sale of machinery, industrial equipment, ships and aircraft
Warehousing Wholesale 46150 : Agents involved in the sale of furniture, household goods, hardware and ironmongery
Warehousing Wholesale 46160 : Agents involved in the sale of textiles, clothing, fur, footwear and leather goods
Warehousing Wholesale 46170 : Agents involved in the sale of food, beverages and tobacco
Warehousing Wholesale 46180 : Agents specialised in the sale of other particular products
Warehousing Wholesale 46190 : Agents involved in the sale of a variety of goods
Warehousing Wholesale 46210 : Wholesale of grain, unmanufactured tobacco, seeds and animal feeds
Warehousing Wholesale 46220 : Wholesale of flowers and plants
Warehousing Wholesale 46230 : Wholesale of live animals
Warehousing Wholesale 46240 : Wholesale of hides, skins and leather
Warehousing Wholesale 46310 : Wholesale of fruit and vegetables
Warehousing Wholesale 46320 : Wholesale of meat and meat products
Warehousing Wholesale 46330 : Wholesale of dairy products, eggs and edible oils and fats
Warehousing Wholesale 46341 : Wholesale of fruit and vegetable juices, mineral waters and soft drinks
Warehousing Wholesale 46342 : Wholesale of wine, beer, spirits and other alcoholic beverages
Warehousing Wholesale 46350 : Wholesale of tobacco products
Warehousing Wholesale 46360 : Wholesale of sugar and chocolate and sugar confectionery
Warehousing Wholesale 46370 : Wholesale of coffee, tea, cocoa and spices
Warehousing Wholesale 46380 : Wholesale of other food, including fish, crustaceans and molluscs
Warehousing Wholesale 46390 : Non-specialised wholesale of food, beverages and tobacco
Warehousing Wholesale 46410 : Wholesale of textiles
Warehousing Wholesale 46420 : Wholesale of clothing and footwear
Warehousing Wholesale 46431 : Wholesale of gramophone records, audio tapes, compact discs and video tapes and of the equipment on which these are played)
Housing and economic growth options
Findings report
June 2018
Employment land use
Sector (Experian) Industry (5 digit SIC)
Warehousing Wholesale
46439 : Wholesale of radio and television goods and of electrical household appliances (other than of gramophone records, audio tapes, compact discs and video tapes and the equipment on which these are played)
Warehousing Wholesale 46440 : Wholesale of china and glassware and cleaning materials
Warehousing Wholesale 46450 : Wholesale of perfume and cosmetics
Warehousing Wholesale 46460 : Wholesale of pharmaceutical goods
Warehousing Wholesale 46470 : Wholesale of furniture, carpets and lighting equipment
Warehousing Wholesale 46480 : Wholesale of watches and jewellery
Warehousing Wholesale 46491 : Wholesale of musical instruments
Warehousing Wholesale 46499 : Wholesale of household goods (other than musical instruments) nec
Warehousing Wholesale 46510 : Wholesale of computers, computer peripheral equipment and software
Warehousing Wholesale 46520 : Wholesale of electronic and telecommunications equipment and parts
Warehousing Wholesale 46610 : Wholesale of agricultural machinery, equipment and supplies
Warehousing Wholesale 46620 : Wholesale of machine tools
Warehousing Wholesale 46630 : Wholesale of mining, construction and civil engineering machinery
Warehousing Wholesale 46640 : Wholesale of machinery for the textile industry and of sewing and knitting machines
Warehousing Wholesale 46650 : Wholesale of office furniture
Warehousing Wholesale 46660 : Wholesale of other office machinery and equipment
Warehousing Wholesale 46690 : Wholesale of other machinery and equipment
Warehousing Wholesale 46711 : Wholes ale of petroleum and petroleum products
Warehousing Wholesale 46719 : Wholes ale of fuels and related products (other than petroleum and petroleum products)
Warehousing Wholesale 46720 : Wholesale of metals and metal ores
Warehousing Wholesale 46730 : Wholesale of wood, construction materials and sanitary equipment
Warehousing Wholesale 46740 : Wholesale of hardware, plumbing and heating equipment and supplies
Warehousing Wholesale 46750 : Wholesale of chemical products
Warehousing Wholesale 46760 : Wholesale of other intermediate products
Warehousing Wholesale 46770 : Wholesale of waste and scrap
Warehousing Wholesale 46900 : Non-specialised wholesale trade
Warehousing Land Transport, Storage & Post 49410 : Freight transport by road
Housing and economic growth options
Findings report
June 2018
Employment land use
Sector (Experian) Industry (5 digit SIC)
Warehousing Land Transport, Storage & Post 49420 : Removal services
Warehousing Land Transport, Storage & Post 52101 : Operation of warehousing and storage facilities for water transport activities of division 50
Warehousing Land Transport, Storage & Post 52102 : Operation of warehousing and storage facilities for air transport activities of division 51
Warehousing Land Transport, Storage & Post 52103 : Operation of warehousing and storage facilities for land transport activities of division 49
Warehousing Land Transport, Storage & Post 52211 : Operation of rail freight terminals
Warehousing Land Transport, Storage & Post 52212 : Operation of rail passenger facilities at railway stations
Warehousing Land Transport, Storage & Post 52213 : Operation of bus and coach passenger facilities at bus and coach stations
Warehousing Land Transport, Storage & Post
52219 : Other service activities incidental to land transportation, nec (not including operation of rail freight terminals, passenger facilities at railway stations or passenger facilities at bus and coach stations or passenger facilities at railway stations or passenger facilities at bus and coach stations)
Warehousing Land Transport, Storage & Post 52241 : Cargo handling for water transport activities of division 50
Warehousing Land Transport, Storage & Post 52242 : Cargo handling for air transport activities of division 51
Warehousing Land Transport, Storage & Post 52243 : Cargo handling for land transport activities of division 49
Warehousing Land Transport, Storage & Post 53100 : Postal activities under universal service obligation
Warehousing Land Transport, Storage & Post 53201 : Licensed Carriers
Warehousing Land Transport, Storage & Post 53202 : Unlicensed Carriers
Office Media Activities 58110 : Book publishing
Office Media Activities 58120 : Publishing of directories and mailing lists
Office Media Activities 58130 : Publishing of newspapers
Office Media Activities 58141 : Publishing of learned journals
Office Media Activities 58142 : Publishing of consumer, business and professional journals and periodicals
Office Media Activities 58190 : Other publishing activities
Office Media Activities 59111 : Motion picture production activities
Office Media Activities 59112 : Video production activities
Office Media Activities 59113 : Television programme production activities
Office Media Activities 59120 : Motion picture, video and television programme post-production activities
Office Media Activities 59131 : Motion picture distribution activities
Office Media Activities 59132 : Video distribution activities
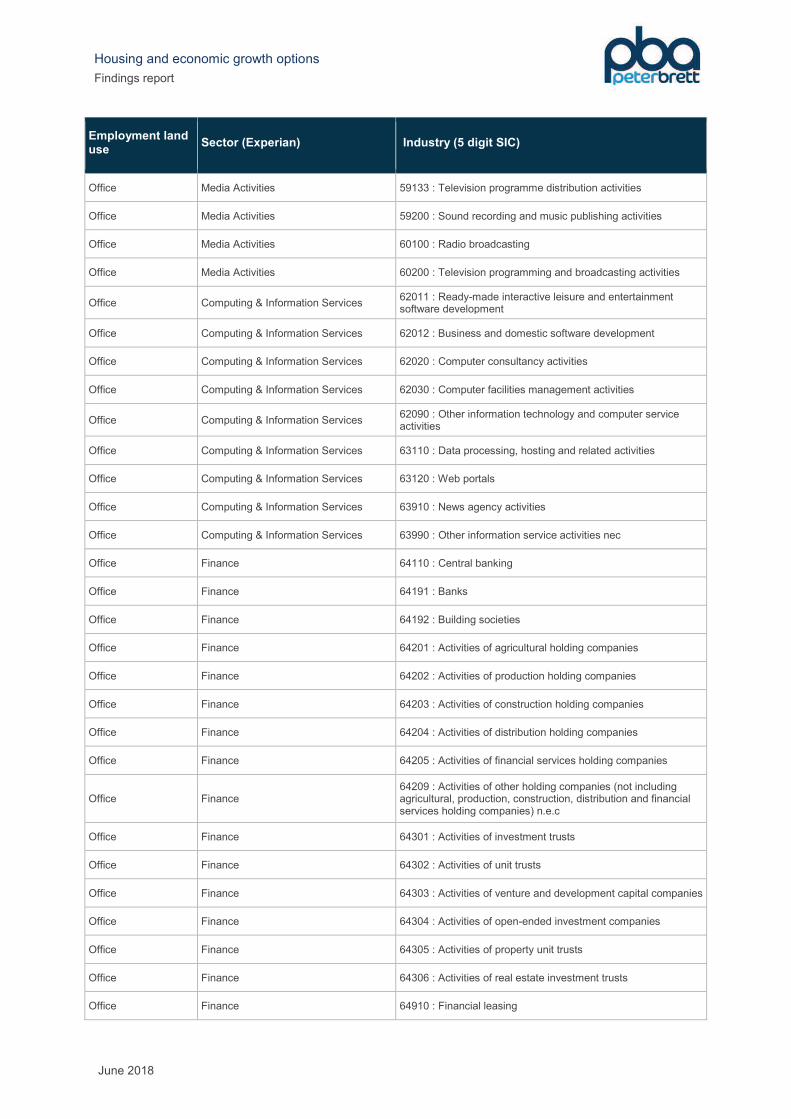
Housing and economic growth options
Findings report
June 2018
Employment land use
Sector (Experian) Industry (5 digit SIC)
Office Media Activities 59133 : Television programme distribution activities
Office Media Activities 59200 : Sound recording and music publishing activities
Office Media Activities 60100 : Radio broadcasting
Office Media Activities 60200 : Television programming and broadcasting activities
Office Computing & Information Services 62011 : Ready-made interactive leisure and entertainment software development
Office Computing & Information Services 62012 : Business and domestic software development
Office Computing & Information Services 62020 : Computer consultancy activities
Office Computing & Information Services 62030 : Computer facilities management activities
Office Computing & Information Services 62090 : Other information technology and computer service activities
Office Computing & Information Services 63110 : Data processing, hosting and related activities
Office Computing & Information Services 63120 : Web portals
Office Computing & Information Services 63910 : News agency activities
Office Computing & Information Services 63990 : Other information service activities nec
Office Finance 64110 : Central banking
Office Finance 64191 : Banks
Office Finance 64192 : Building societies
Office Finance 64201 : Activities of agricultural holding companies
Office Finance 64202 : Activities of production holding companies
Office Finance 64203 : Activities of construction holding companies
Office Finance 64204 : Activities of distribution holding companies
Office Finance 64205 : Activities of financial services holding companies
Office Finance 64209 : Activities of other holding companies (not including agricultural, production, construction, distribution and financial services holding companies) n.e.c
Office Finance 64301 : Activities of investment trusts
Office Finance 64302 : Activities of unit trusts
Office Finance 64303 : Activities of venture and development capital companies
Office Finance 64304 : Activities of open-ended investment companies
Office Finance 64305 : Activities of property unit trusts
Office Finance 64306 : Activities of real estate investment trusts
Office Finance 64910 : Financial leasing

Housing and economic growth options
Findings report
June 2018
Employment land use
Sector (Experian) Industry (5 digit SIC)
Office Finance 64921 : Credit granting by non-deposit taking finance houses and other specialist consumer credit grantors
Office Finance 64922 : Activities of mortgage finance companies
Office Finance
64929 : Other credit granting (not including credit granting by non-deposit taking finance houses and other specialist consumer credit grantors and activities of mortgage finance companies) n.e.c.
Office Finance 64991 : Security dealing on own account
Office Finance 64992 : Factoring
Office Finance 64999 : Other financial service activities, except insurance and pension funding, (not including security dealing on own account and factoring) n.e.c.
Office Insurance & Pensions 65110 : Life insurance
Office Insurance & Pensions 65120 : Non-life insurance
Office Insurance & Pensions 65201 : Life reinsurance
Office Insurance & Pensions 65202 : Non-life reinsurance
Office Insurance & Pensions 65300 : Pension funding
Office Finance 66110 : Administration of financial markets
Office Finance 66120 : Security and commodity contracts brokerage
Office Finance 66190 : Other activities auxiliary to financial services, except insurance and pension funding
Office Finance 66210 : Risk and damage evaluation
Office Finance 66220 : Activities ofinsurance agents and brokers
Office Finance 66290 : Other activities auxiliary to insurance and pension funding
Office Finance 66300 : Fund management activities
Office Real Estate 68100 : Buying and selling of own real estate
Office Real Estate 68201 : Renting and operating of Housing Association real estate
Office Real Estate 68202 : Letting and operating of conference and exhibition centres
Office Real Estate 68209 : Letting and operating of own or leased real estate (other than Housing Association real estate and conference and exhibition services) n.e.c.
Office Real Estate 68310 : Real estate agencies
Office Real Estate 68320 : Management of real estate on a fee or contract basis
Office Professional services 69101 : Barristers at law
Office Professional services 69102 : Solicitors

Housing and economic growth options
Findings report
June 2018
Employment land use
Sector (Experian) Industry (5 digit SIC)
Office Professional services 69109 : Activities of patent and copyright agents; other legal activities (other than those of barristers and solicitors) nec
Office Professional services 69201 : Accounting, and auditing activities
Office Professional services 69202 : Bookkeeping activities
Office Professional services 69203 : Tax consultancy
Office Professional services 70100 : Activities of head offices
Office Professional services 70210 : Public relations and communication activities
Office Professional services 70221 : Financial management
Office Professional services 70229 : Management consultancy activities (other than financial management)
Office Professional services 71111 : Architectural activities
Office Professional services 71112 : Urban planning and landscape architectural activities
Office Professional services 71121 : Engineering design activities for industrial process and production
Office Professional services 71122 : Engineering related scientific and technical consulting activities
Office Professional services 71129 : Other engineering activities (not including engineering design for industrial process and production or engineering related scientific and technical consulting activities)
Office Professional services 71200 : Technical testing and analysis
Office Professional services 72110 : Research and experimental development on biotechnology
Office Professional services 72190 : Other research and experimental development on natural sciences and engineering
Office Professional services 72200 : Research and experimental development on social sciences and humanities
Office Professional services 73110 : Advertising agencies
Office Professional services 73120 : Media representation
Office Professional services 73200 : Market research and public opinion polling
Office Professional services 74300 : Translation and interpretation activities
Office Professional services 74901 : Environmental consulting activities
Office Professional services 74902 : Quantity surveying activities
Office Professional services 74909 : Other professional, scientific and technical activities (not including environmental consultancy or quantity surveying)
Office Administrative & Supportive Service Activities
77400 : Leasing of intellectual property and similar products, except copyrighted works
Office Administrative & Supportive Service Activities
78101 : Motion picture, television and other theatrical casting

Housing and economic growth options
Findings report
June 2018
Employment land use
Sector (Experian) Industry (5 digit SIC)
Office Administrative & Supportive Service Activities
78109 : Activities of employment placement agencies (other than motion picture, television and other theatrical casting) nec
Office Administrative & Supportive Service Activities
78200 : Temporary employment agency activities
Office Administrative & Supportive Service Activities
78300 : Other human resources provision
Office Administrative & Supportive Service Activities
80100 : Private security activities
Office Administrative & Supportive Service Activities
80200 : Security systems service activities
Office Administrative & Supportive Service Activities
80300 : Investigation activities
Office Administrative & Supportive Service Activities
82110 : Combined office administrative service activities
Office Administrative & Supportive Service Activities
82190 : Photocopying, document preparation and other specialised office support activities
Office Administrative & Supportive Service Activities
82200 : Activities of call centres
Office Administrative & Supportive Service Activities
82301 : Activities of exhibition and fair organizers
Office Administrative & Supportive Service Activities
82302 : Activities of conference organizers
Office Administrative & Supportive Service Activities
82911 : Activities of collection agencies
Office Administrative & Supportive Service Activities
82912 : Activities of credit bureaus
Warehousing Administrative & Supportive Service Activities
82920 : Packaging activities
Office Administrative & Supportive Service Activities
82990 : Other business support service activities nec
Office Public Administration & Defence 84110 : General public administration activities
Office Public Administration & Defence 84120 : Regulation of the activities of providing health care, education, cultural services and other social services, excluding social security
Office Public Administration & Defence 84130 : Regulation of and contribution to more efficient operation of businesses
Office Public Administration & Defence 84210 : Foreign affairs
Office Public Administration & Defence 84300 : Compulsory social security activities
Office Other Private Services 94110 : Activities of business and employers membership organisations
Office Other Private Services 94120 : Activities of professional membership organisations
Office Other Private Services 94200 : Activities of trade unions
Office Other Private Services 94910 : Activities of religious organisations
Office Other Private Services 94920 : Activities of political organisations
Office Other Private Services 94990 : Activities of other membership organisations nec
Other industrial Other Private Services 95110 : Repair of computers and peripheral equipment

Housing and economic growth options
Findings report
June 2018
Employment land use
Sector (Experian) Industry (5 digit SIC)
Other industrial Other Private Services 95120 : Repair of communication equipment
Other industrial Other Private Services 95210 : Repair of consumer electronics
Other industrial Other Private Services 95220 : Repair of household appliances and home and garden equipment
Other industrial Other Private Services 95230 : Repair of footwear and leather goods
Other industrial Other Private Services 95240 : Repair of furniture and home furnishings
Other industrial Other Private Services 95250 : Repair of watches, clocks and jewellery
Other industrial Other Private Services 95290 : Repair of other personal and household goods
Housing and economic growth options
Findings report
June 2018
APPENDIX I EMPLOYMENT DENSITIES AND PLOT
RATIOS
Land use plans commonly make new land allocations by releasing hectares of land. But at
the plan making stage we can only estimate the likely use and format of the land being
allocated. So this process is very uncertain.
To help inform planners’ decisions it is common for employment land reviews and other
evidence base documents to estimate the capacity of land to accommodate new employment
floorspace. Most planners firstly estimate the number of jobs; then the amount of floorspace
required to accommodate them; followed by the amount of land required to build the
floorspace. The first part is typically done with reference to the Homes and Communities
Agency Employment Density Guide35. The assumptions that inform the second part are less
well-established.
The capacity of land to accommodate floorspace is commonly described as the ‘plot ratio’
and is expressed as the floorspace capacity of a hectare of land. For example a plot ratio of
1:4,000 indicates that each hectare can accommodate 4,000 sqm of floorspace. This is
sometimes expressed as a percentage; for example 40%. This also indicates a nominal
capacity of 4,000 sqm (i.e. 40% of a hectare).
But there is little evidence to support any assumptions planners make about plot ratios. Most
recent studies still rely on research undertaken by Roger Tym & Partners in 2010 for the
Yorkshire and Humberside region which involved surveying approximately 330 recent
development schemes.
The research showed that there was very limited potential to increase plot ratios for general
industrial or warehouse type sites. Most of these units are single story and the amount of
circulation space means they cannot be built to a higher plot ratio. The only way of
intensifying the employment capacity of these sites will be to dilute them with higher density
office uses.
Office plot ratios are much more variable; in locations outside of town centres, a 40% plot
ratio remains appropriate but within town centres density assumptions are almost
meaningless. This is because they can be virtually infinite. What controls plot ratios in town
centres is related to what the development capacity of the site is rather than any set plot ratio
target. This can only be estimated site by site.
Alternatively, inconsistent and un-evidenced ‘rules of thumb’ are used. The most common
‘rule of thumb’ estimate is that each hectare of new greenfield land can accommodate
between 3,500 and 4,000 sq metres of employment floorspace; either offices, warehouses or
general industrial units (i.e. 35% - 40%). Separate ratios for brownfield redevelopment are
rarely quoted.
35 3rd edition (November 2015)

Housing and economic growth options
Findings report
June 2018
APPENDIX J SUB-COUNTY FINDINGS
J.1 Introduction
This appendix provides an indicative breakdown of the overall study findings in terms of jobs,
employment land and housing need into the county�s four delivery areas, which we refer to
as sub areas, shown on Figure 3.2 and used in the current Economic Strategy, namely:
¡ Central area
¡ North area
¡ South East area
¡ West area
These findings should be used as a broad guide because the smallest geography at which
the economic forecasts which underpin this study are available is local authority level i.e.
Northumberland county. We have therefore had to make a number of assumptions about the
distribution of future job, employment land need and housing growth across the sub areas.
We outline the method below under each topic.
J.2 Workforce job growth
The method used to attribute the forecast growth to the sub areas assumes that the existing
distribution of employment by broad sector is apportioned across the sub areas based on the
existing distribution. The method uses a four-stage approach as follows:
1. identify which Mid-Level Super Output Areas (MSOA) comprise each sub area.
2. attribute the existing employment (number of employees, including self-employed) at
MSOA level by broad industry group from the BRES data to each of the sub areas.
3. calculates the proportion of existing employment in each broad industry by sub area.
4. applies these proportions to attribute the growth of workforce jobs in the Experian
forecasts to each of the sub areas.
Because of limitations in the BRES data which includes rounding for lower statistical returns,
we use BRES�s 18 broad industry categories to understand the distribution of existing
employment in the county. It should be noted that the BRES broad industry groups and the
Experian sectors (either 38 detailed sectors which are set out for each of the scenarios
underpinning this study, or 12 combined sectors) are classified differently. We use the same
approach as set out in Section 5 of the main study (and Appendix H) to reconcile the two
datasets. The sub area results are therefore reported based on 11 broad sectors as set out
in the table below.

Housing and economic growth options
Findings report
June 2018
Aggregation of employment groups
Sub area broad sectors (11)
Experian broad sectors (12)
Experian detailed sectors (38)
BRES broad industry groups36 (18)
Accommodation, Food Services & Recreation
Accommodation, Food Services & Recreation
Accommodation & Food Services
Recreation
9 : Accommodation & food services (I)
18 : Arts, entertainment, recreation & other services (R,S,T and U)
Agriculture, Forestry & Fishing
Agriculture, Forestry & Fishing
Agriculture, Forestry & Fishing
1 : Agriculture, forestry & fishing (A)
Construction Construction Civil Engineering
Construction of Buildings
Specialised Construction Activities
4 : Construction (F)
Extraction & Mining & Utilities
Extraction & Mining Extraction & Mining 2 : Mining, quarrying & utilities (B,D and E) Utilities Utilities
Finance & Insurance Finance & Insurance Finance
Insurance & Pensions
11 : Financial & insurance (K)
Information & communication
Information & communication
Computing & Information Services
Media Activities
Telecoms
10 : Information & communication (J)
Manufacturing Manufacturing Chemicals
Computer & Electronic Products
Food, Drink & Tobacco
Fuel Refining
Machinery & Equipment
Metal Products
Other Manufacturing
Pharmaceuticals
Printing and Reproduction of Recorded Media
Rubber, Plastic and Other Non-Metallic Mineral Products
Textiles & Clothing
Wood & Paper
3 : Manufacturing (C)
Professional & Other Private Services
Professional & Other Private Services
Administrative & Supportive Service Activities
Other Private Services
Professional Services
Real Estate
12 : Property (L)
13 : Professional, scientific & technical (M)
14 : Business administration & support services (N)
Public services Public services Education
Health
Public Administration & Defence
Residential Care & Social Work
15 : Public administration & defence (O)
16 : Education (P)
17 : Health (Q)
Transport & Storage Transport & Storage Air & Water Transport
Land Transport, Storage & Post
8 : Transport & storage (inc postal) (H)
Wholesale & Retail Wholesale & Retail Retail
Wholesale
5 : Motor trades (Part G)
6 : Wholesale (Part G)
7 : Retail (Part G)
36 UK SIC sections provided in brackets for each group
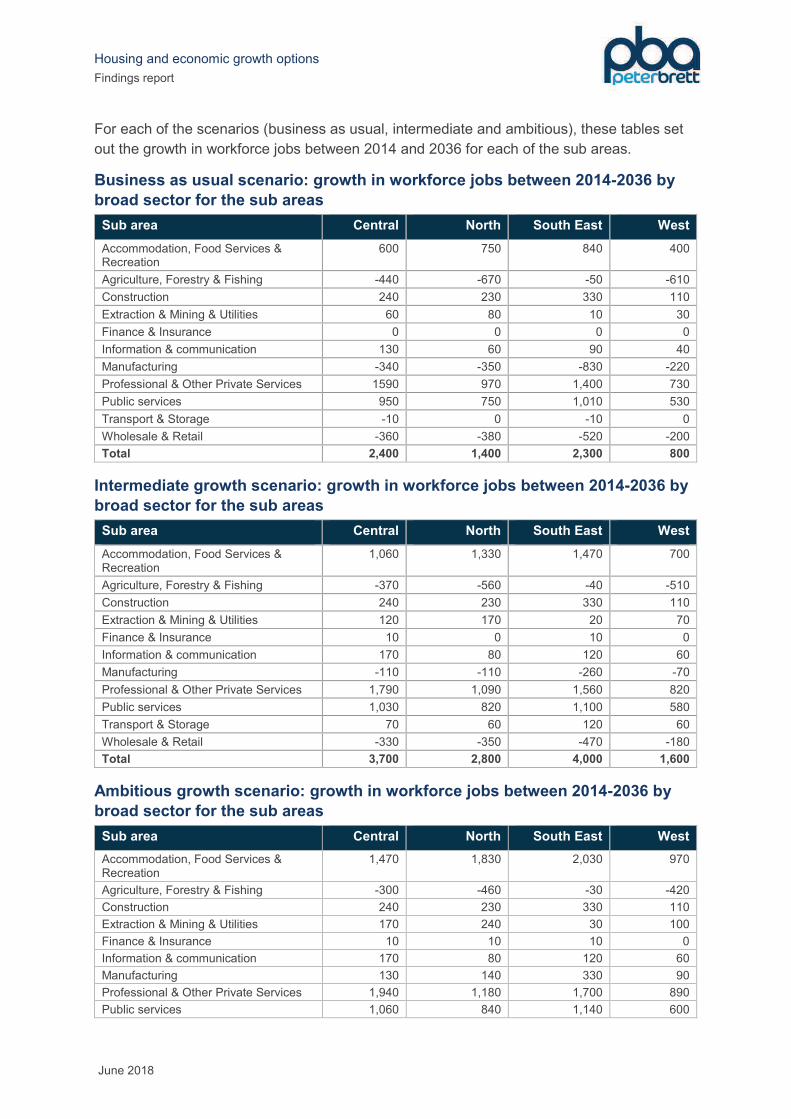
Housing and economic growth options
Findings report
June 2018
For each of the scenarios (business as usual, intermediate and ambitious), these tables set
out the growth in workforce jobs between 2014 and 2036 for each of the sub areas.
Business as usual scenario: growth in workforce jobs between 2014-2036 by
broad sector for the sub areas
Sub area Central North South East West
Accommodation, Food Services & Recreation
600 750 840 400
Agriculture, Forestry & Fishing -440 -670 -50 -610
Construction 240 230 330 110
Extraction & Mining & Utilities 60 80 10 30
Finance & Insurance 0 0 0 0
Information & communication 130 60 90 40
Manufacturing -340 -350 -830 -220
Professional & Other Private Services 1590 970 1,400 730
Public services 950 750 1,010 530
Transport & Storage -10 0 -10 0
Wholesale & Retail -360 -380 -520 -200
Total 2,400 1,400 2,300 800
Intermediate growth scenario: growth in workforce jobs between 2014-2036 by
broad sector for the sub areas
Sub area Central North South East West
Accommodation, Food Services & Recreation
1,060 1,330 1,470 700
Agriculture, Forestry & Fishing -370 -560 -40 -510
Construction 240 230 330 110
Extraction & Mining & Utilities 120 170 20 70
Finance & Insurance 10 0 10 0
Information & communication 170 80 120 60
Manufacturing -110 -110 -260 -70
Professional & Other Private Services 1,790 1,090 1,560 820
Public services 1,030 820 1,100 580
Transport & Storage 70 60 120 60
Wholesale & Retail -330 -350 -470 -180
Total 3,700 2,800 4,000 1,600
Ambitious growth scenario: growth in workforce jobs between 2014-2036 by
broad sector for the sub areas
Sub area Central North South East West
Accommodation, Food Services & Recreation
1,470 1,830 2,030 970
Agriculture, Forestry & Fishing -300 -460 -30 -420
Construction 240 230 330 110
Extraction & Mining & Utilities 170 240 30 100
Finance & Insurance 10 10 10 0
Information & communication 170 80 120 60
Manufacturing 130 140 330 90
Professional & Other Private Services 1,940 1,180 1,700 890
Public services 1,060 840 1,140 600
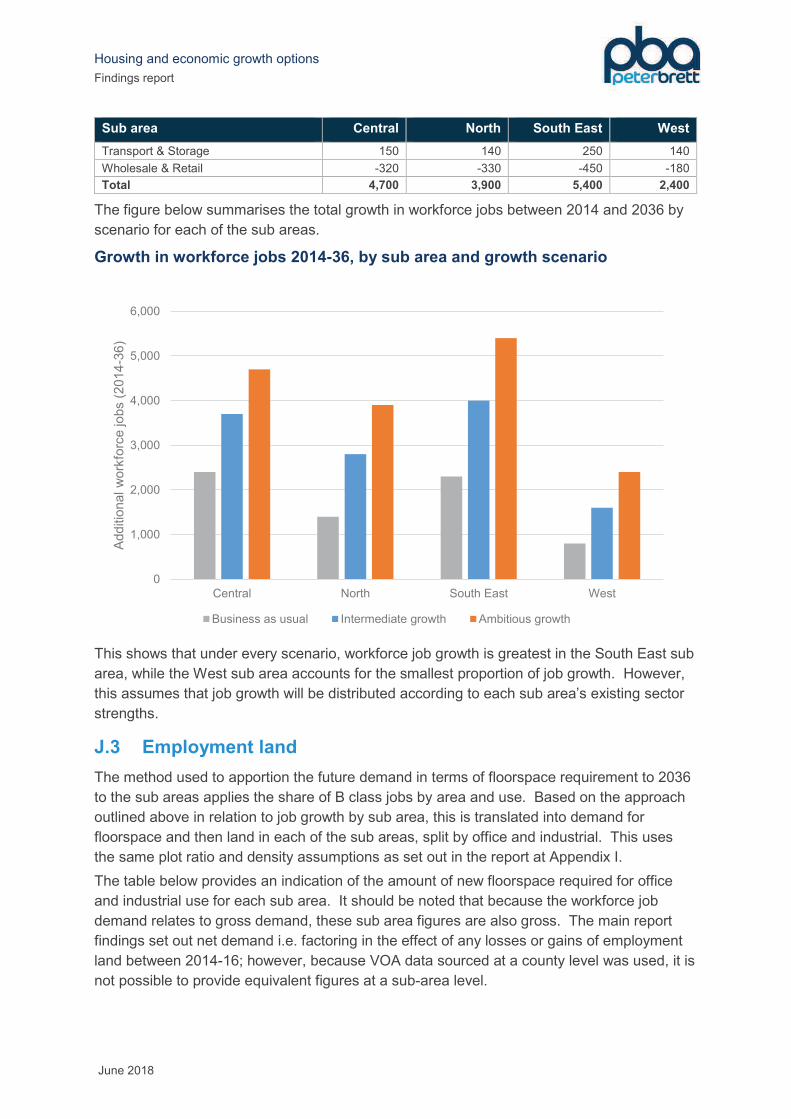
Housing and economic growth options
Findings report
June 2018
Sub area Central North South East West
Transport & Storage 150 140 250 140
Wholesale & Retail -320 -330 -450 -180
Total 4,700 3,900 5,400 2,400
The figure below summarises the total growth in workforce jobs between 2014 and 2036 by
scenario for each of the sub areas.
Growth in workforce jobs 2014-36, by sub area and growth scenario
This shows that under every scenario, workforce job growth is greatest in the South East sub
area, while the West sub area accounts for the smallest proportion of job growth. However,
this assumes that job growth will be distributed according to each sub area�s existing sector
strengths.
J.3 Employment land
The method used to apportion the future demand in terms of floorspace requirement to 2036
to the sub areas applies the share of B class jobs by area and use. Based on the approach
outlined above in relation to job growth by sub area, this is translated into demand for
floorspace and then land in each of the sub areas, split by office and industrial. This uses
the same plot ratio and density assumptions as set out in the report at Appendix I.
The table below provides an indication of the amount of new floorspace required for office
and industrial use for each sub area. It should be noted that because the workforce job
demand relates to gross demand, these sub area figures are also gross. The main report
findings set out net demand i.e. factoring in the effect of any losses or gains of employment
land between 2014-16; however, because VOA data sourced at a county level was used, it is
not possible to provide equivalent figures at a sub-area level.
0
1,000
2,000
3,000
4,000
5,000
6,000
Central North South East West
Additio
nal w
ork
forc
e jobs (
2014
-36)
Business as usual Intermediate growth Ambitious growth

Housing and economic growth options
Findings report
June 2018
Gross employment land requirements for each scenario and sub area 2014-
2036 (ha)
Sub area Central North South East West
Scenario Office Industrial Office Industrial Office Industrial Office Industrial
Business as usual
1.20 -2.60 0.70 -2.90 1.10 -8.30 0.60 -1.90
Intermediate growth
1.5 6.6 0.9 5.5 1.3 -5.4 0.7 2.9
Ambitious growth
1.8 8.6 1.1 8.6 1.5 12.4 0.8 5.3
Source: County-wide employment land requirements set out at Table 5.2
In broad terms, this shows that office land requirements are relatively evenly spread across
the county. The requirements for industrial land are more varied: it is only the ambitious
growth scenario that further land is needed in every sub area, and in that scenario, the South
East sub area has the highest theoretical need.
However, these figures must be treated with caution: this represents on the long-term
demand position and is premised on jobs, and therefore land requirements, being distributed
in line with the current distribution of employment in the county. Land supply and market
viability, together with planning policy decisions, will be critical influences in how this need is
met within the county.
J.4 Housing need
The same overall method has been used to apportion the additional housing required
between 2016-2036 to the sub areas. We have used 2011 Census data on dwelling type37
as the baseline position in terms of the existing distribution across Northumberland. This is
the latest available data at MSOA level. By attributing the MSOAs to the appropriate sub
areas, it is possible to identify a broad distribution of dwellings which has then been used to
apportion the dwelling growth for each scenario to the different sub areas. The table below
shows the new housing required for each Scenario by each sub area.
Additional dwellings 2016-2036 for the sub areas
Central North South East West
Business as usual 2,360 2,180 4,560 1,090
Intermediate growth 3,600 3,320 6,960 1,670
Ambitious growth 4,100 3,780 7,930 1,900
Because the business as usual scenario does not deliver enough homes against the
Government�s draft standard method outputs of 707-717 dpa, this is only shown indicatively
in the table above.
37 Census 2011: Nomis Key Statistics table KS401EW Dwellings, household spaces and accommodation type
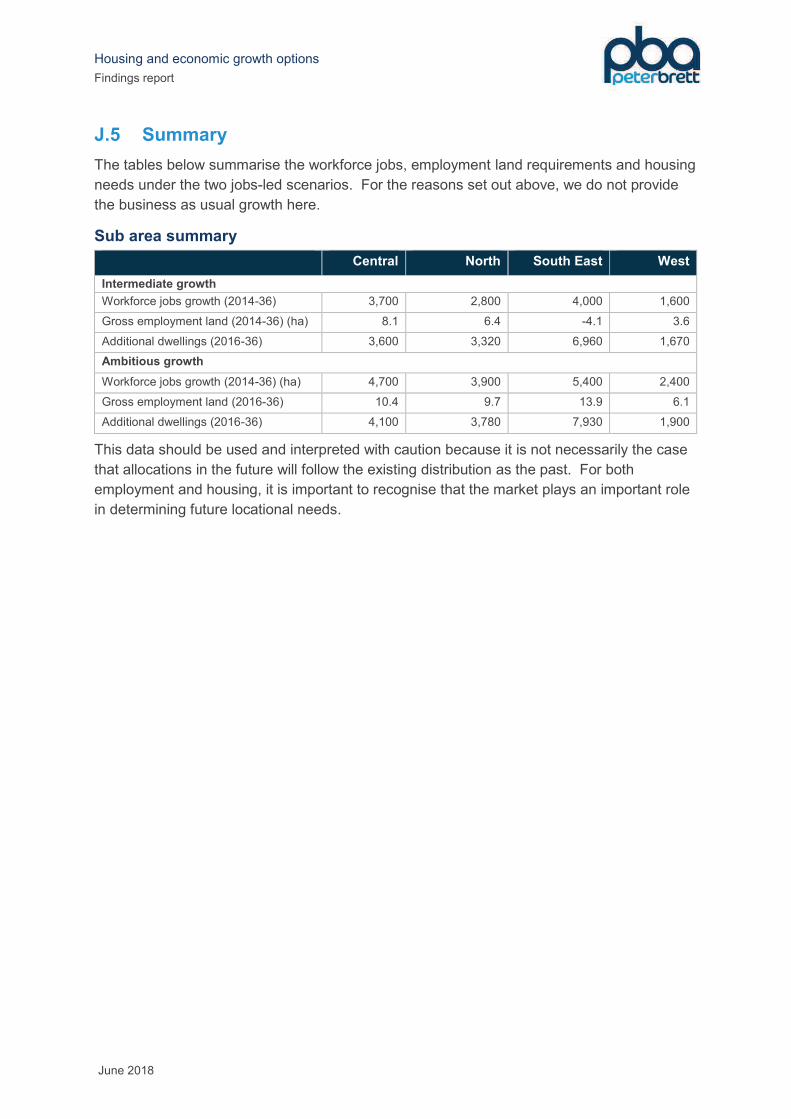
Housing and economic growth options
Findings report
June 2018
J.5 Summary
The tables below summarise the workforce jobs, employment land requirements and housing
needs under the two jobs-led scenarios. For the reasons set out above, we do not provide
the business as usual growth here.
Sub area summary
Central North South East West
Intermediate growth
Workforce jobs growth (2014-36) 3,700 2,800 4,000 1,600
Gross employment land (2014-36) (ha) 8.1 6.4 -4.1 3.6
Additional dwellings (2016-36) 3,600 3,320 6,960 1,670
Ambitious growth
Workforce jobs growth (2014-36) (ha) 4,700 3,900 5,400 2,400
Gross employment land (2016-36) 10.4 9.7 13.9 6.1
Additional dwellings (2016-36) 4,100 3,780 7,930 1,900
This data should be used and interpreted with caution because it is not necessarily the case
that allocations in the future will follow the existing distribution as the past. For both
employment and housing, it is important to recognise that the market plays an important role
in determining future locational needs.

Housing and economic growth options
Findings report
June 2018
APPENDIX K STAKEHOLDER WORKSHOP
Attended by representatives from
¡ Northumberland County Council
¡ Newcastle City Council
¡ North East LEP
¡ Forestry Commission
¡ Northumberland Tourism
¡ Northumberland College
¡ Harworth Estates
¡ Northumberland Estates
¡ Northumbrian Water
¡ Lugano
¡ Port of Blyth
¡ Hexham & Northern Marts
¡ Arch
¡ Greater Morpeth Development Trust
¡ Bradley Hall
¡ Edwin Thompson
¡ Gavin Black & Partners
¡ HTA Real Estate
¡ Knight Frank
¡ Fusion PR (UK) Limited
¡ Northern Farmers & Landowners
¡ Northumberland Business Network
¡ Community Action Northumberland
¡ Federation of Northumberland Development Trusts
¡ Ethical Partnership

1
Peter Brett Associates LLP
Northumberland Economic growth
options workshop
17 January 2018
Peter Brett Associates LLP
Introduction
Paul Johnston
NCC Interim Service Director: Place
Local Plan and economic strategy
• Northumberland Core Strategy was withdrawn in July 2017 – In part to ensure it can better reflect the aspirations of the Strategic Economic Plan
• The Council is preparing a new full Local Plan and will be refreshing the Economic Strategy later in 2018.
• The Local Plan timetable is set out in the Local Development Scheme (LDS)
• Local Plan initial consultation - Spring 2018
• Peter Brett Associates have been commissioned to identify housing and economic growth options for Northumberland which will inform both the Local Plan and economic strategy.
• The draft Local Plan which will be subject to consultation in summer 2018.
• The draft Local Plan will identify the quantity and distribution of housing and employment land which is required to deliver the strategy from 2016 to 2036.
• The Council is committed to delivering the Local Plan in accordance with the timetable set out in the LDS with submission in summer 2019.
Economic growth workshopBackground
• The Council supports economic growth• It is committed to making its contribution to deliver the aspirations of the
North East Strategic Economic Plan• It has signed up to a North of Tyne Devolution Deal with Newcastle City
Council and North Tyneside Metropolitan Borough Council
• It has signed up to the Borderlands Initiative (with Scottish Borders and Carlisle Councils) to support economic growth across rural areas.
Purpose of the study
• To provide robust, up to date evidence to support the Local Plan and Economic Strategy.
Purpose of the workshop
• To enable the Council to draw upon the knowledge and expertise of stakeholders across Northumberland.
• To ensure that factors which are unique in the county, and that Northumberland’s strengths and opportunities, are appropriately reflected in Northumberland’s economic forecasts.
Peter Brett Associates LLP
Overview of the study
Our brief
• Develop growth options for Northumberland
• Future jobs by sector 2016-36
• Two versions• ‘Policy off’
• Aspirational (but also realistic)
• Policy implications of each• Including employment land allocations
• For industry, warehousing, offices (‘B-class uses’)
• Other job-creating uses
• Including for ‘non-B uses’
• E.g. tourism, rural economy
• How many new houses
• Feed into the emerging local plan and economic strategy
2
Purpose of today’s session
• At the beginning of our programme of work
• We haven’t fixed any of our growth scenarios yet
• Other than looking at ‘business as usual’
• And we’ll share a bit with you on this
• We want your input to shape the scenarios
• Because you all have interests in and know the area
• This is an informal session
• We have no fixed ideas (yet)
• We’re here to listen to you
• Do share your thoughts
Peter Brett Associates LLP
What’s happening in Northumberland now?
Our starting point• You’ve been asked about some of this before, not long ago
• Why are we asking again?
• We will reuse evidence supporting the withdrawn plan• Including the previous employment studies
• Land and Premises Demand Study (2015, ES Group) - parts
• Land Take-Up Study (2017, NCC)
• We aim to fill gaps and update for what has changed
• But we’re not reviewing the property market• So please tell us about it now
• We’ll ask you some questions in a minute
• What needs updating?• We’re setting aside earlier forecasts / scenarios
• Partly because pre-Brexit
• And any studies that relied on these• This includes part of the Land and Premises Demand Study
• Specifically the land requirements identified
• And we also extend the period covered• Now 2016-2036
The Northumberland market
• 1,763 hectares employment land in the county
• Of which 240 hectares is available for development
• Majority (1,215 hectares) in the south east
• Close to Tyneside
• Just over 1,000 hectares is in the main towns
• But a significant proportion located outside the main towns
• This reflects the largely rural geography
• And the importance of smaller businesses
Businesses in NorthumberlandMicro (<10 employees) Medium (50-250 employees)
Source: BRES 2016
Employment land across Northumberland
71%
16%
11%
2%
South east Central North West

3
South east Northumberland
• Main towns
• Amble
• Ashington
• Blyth
• Bedlington
• Cramlington
• 1,215 hectares employment land
• 166 hectares available
• 255 hectares for expansion
• 17.76 hectares employment land
developed (2011-16)
• But change is expected
• Alcan site redevelopment
• Energy Central
South east Northumberland
2861
292
146
368
18
168
27
0
50
100
150
200
250
300
350
400
He
cta
res
Total land Available land
Central Northumberland
• Main towns
• Hexham
• Morpeth
• Ponteland
• Prudhoe
• 318 hectares
employment land
• 31 hectares available
• Very limited change
• Net loss of employment
land 2011-16
• -5.4 hectares
Central Northumberland
69
78
69
1
31
2
115
0 00
10
20
30
40
50
60
70
80
90
Hexham Morpeth Prudhoe Corbridge Ponteland
Hecta
res
Total land Available land
North Northumberland
• Main towns
• Alnwick
• Berwick-upon-Tweed
• Includes large swathes of
national park
• 117 ha employment land
• 35 hectares available
• Net loss of employment
land 2011-16
• -2.5 hectares
North Northumberland
84
58
2
14
7
20
7
0 2 20
10
20
30
40
50
60
70
80
90
Berwick Alnwick Rothbury Belford &Seahouses
Wooler
He
cta
res
Total land Available land
4
West Northumberland
• Main town
• Haltwhistle
• Several service centres
• Includes national park and
AONB
• Smallest portion of
employment land
• 44 hectares in total
• 8 hectares available
• Between 2011-16 little
change
• 0.4 hectares land
developed
West Northumberland
32
31
0
5
10
15
20
25
30
35
Haltwhistle Allendale & Haydon Br Bellingham
He
cta
res
Total land Available land
Northumberland in the North East LEP area
• Offices
• Newcastle city centre main location in the LEP
• Little new development since the recession
• Speculative office development not currently viable
• But may return in locations on the edge of Tyne and Wear
• Northumberland Business Park, Ponteland
• Across the LEP, oversupply of out-of-town space
• Including Berwick, Alnwick and Cramlington
• For industrial
• Within Northumberland, Cramlington strongest location
• But speculative development still not viable
• May return but subject to competition from Tyneside
• Enterprise zones haven’t had a huge impact (by 2015)
What’s happening in the wider North East
0
100
200
300
400
500
600
700
800
900
1000
Flo
ors
pace (
sq
m)
Offices
County Durham UA Northumberland UA Gateshead
Newcastle upon Tyne North Tyneside South Tyneside
Sunderland
Source: VOA 2016
What’s happening in the wider North East
0
500
1,000
1,500
2,000
2,500
3,000
3,500
4,000
4,500
Flo
ors
pace (
sq
m)
Industrial
County Durham UA Northumberland UA Gateshead
Newcastle upon Tyne North Tyneside South Tyneside
Sunderland
Source: VOA 2016
Discussion session 1
The commercial property market
• Who has been taking up business space?
• i.e. industrial units, workshops, warehousing, offices?
• Business activity - where from (local or further afield?)
• Where?
• Why do they want to be there?
• What have they been looking for?
• Can they get it?
• What’s changing?
• Supply and market conditions
• Is availability (vacancy) high or low?
• What has been / is being built?
• Is development viable?
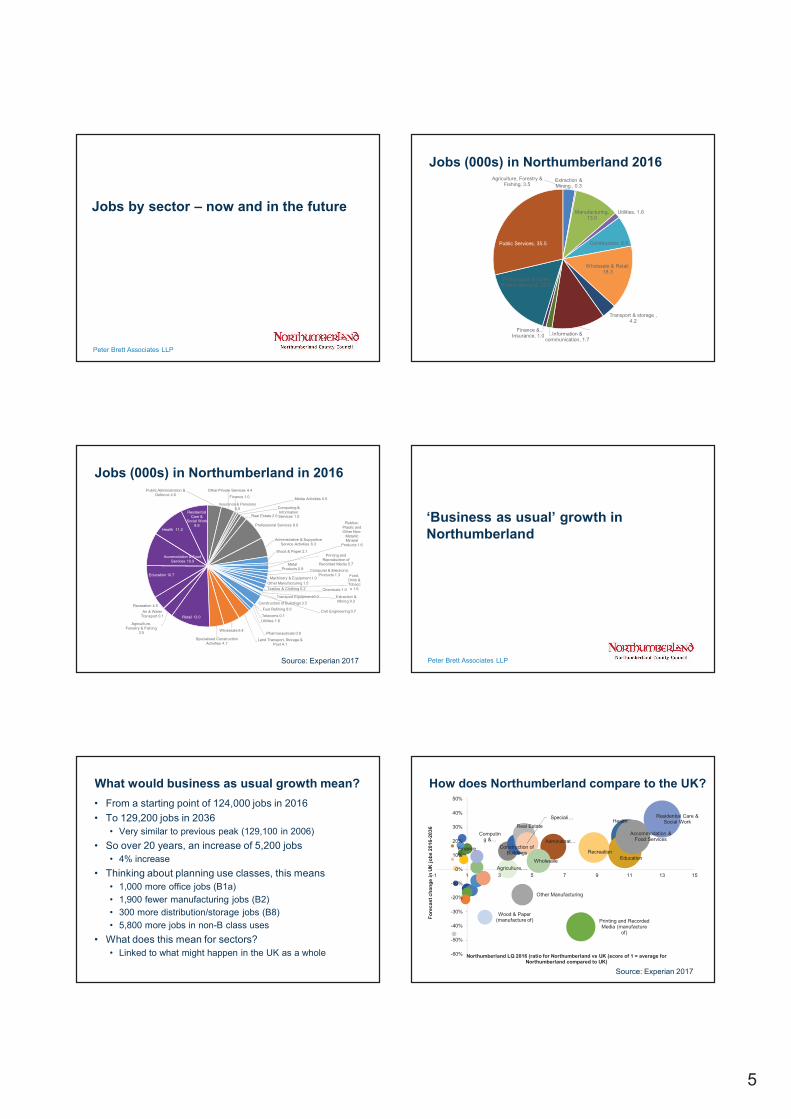
5
Peter Brett Associates LLP
Jobs by sector – now and in the future
Jobs (000s) in Northumberland 2016Agriculture, Forestry &
Fishing, 3.5Extraction & Mining , 0.3
Manufacturing, 13.0
Utilities, 1.6
Construction, 8.9
Wholesale & Retail, 18.3
Transport & storage , 4.2
Accommodation, Food Services & Recreation, 15.3
Information & communication, 1.7
Finance & Insurance, 1.0
Professional & Other Private Services, 20.6
Public Services, 35.5
Jobs (000s) in Northumberland in 2016Public Administration &
Defence 4.6Other Private Services 4.4
Finance 1.0
Insurance & Pensions0.0
Media Activities 0.6
Computing & Information Services 1.0Real Estate 2.0
Professional Services 8.0
Administrative & Supportive Service Activities 6.3
Wood & Paper 2.1Printing and
Reproduction of Recorded Media 0.7
Rubber, Plastic and Other Non-
Metallic Mineral
Products 1.6
Metal Products 0.9 Computer & Electronic
Products 1.3Machinery & Equipment 1.0
Other Manufacturing 1.5
Food, Drink & Tobacco 1.6Textiles & Clothing 0.2 Chemicals 1.0
Extraction & Mining 0.3
Transport Equipment 0.3
Civil Engineering 0.7
Construction of Buildings 3.5
Fuel Refining 0.0
Telecoms 0.1
Utilities 1.6
Pharmaceuticals 0.8
Land Transport, Storage & Post 4.1
Wholesale 5.4
Specialised Construction Activities 4.7
Retail 13.0
Agriculture, Forestry & Fishing
3.5
Air & Water Transport 0.1
Recreation 4.5
Education 10.7
Accomodation & Food Services 10.9
Health 11.2
Residential Care &
Social Work8.8
Source: Experian 2017 Peter Brett Associates LLP
‘Business as usual’ growth in
Northumberland
What would business as usual growth mean?
• From a starting point of 124,000 jobs in 2016
• To 129,200 jobs in 2036
• Very similar to previous peak (129,100 in 2006)
• So over 20 years, an increase of 5,200 jobs
• 4% increase
• Thinking about planning use classes, this means
• 1,000 more office jobs (B1a)
• 1,900 fewer manufacturing jobs (B2)
• 300 more distribution/storage jobs (B8)
• 5,800 more jobs in non-B class uses
• What does this mean for sectors?
• Linked to what might happen in the UK as a whole
How does Northumberland compare to the UK?
Accommodation & Food ServicesAdministrat…
Agriculture, …
Computing & …
Construction of Buildings
Education
Finance
Health
Other Manufacturing
Printing and Recorded Media (manufacture
of)
Real Estate
Recreation
Residential Care & Social Work
Speciali…
Wholesale
Wood & Paper (manufacture of)
-60%
-50%
-40%
-30%
-20%
-10%
0%
10%
20%
30%
40%
50%
-1 1 3 5 7 9 11 13 15
Fo
rec
as
t c
ha
ng
e i
n U
K j
ob
s 2
01
6-2
03
6
Northumberland LQ 2016 (ratio for Northumberland vs UK (score of 1 = average for Northumberland compared to UK)
Source: Experian 2017
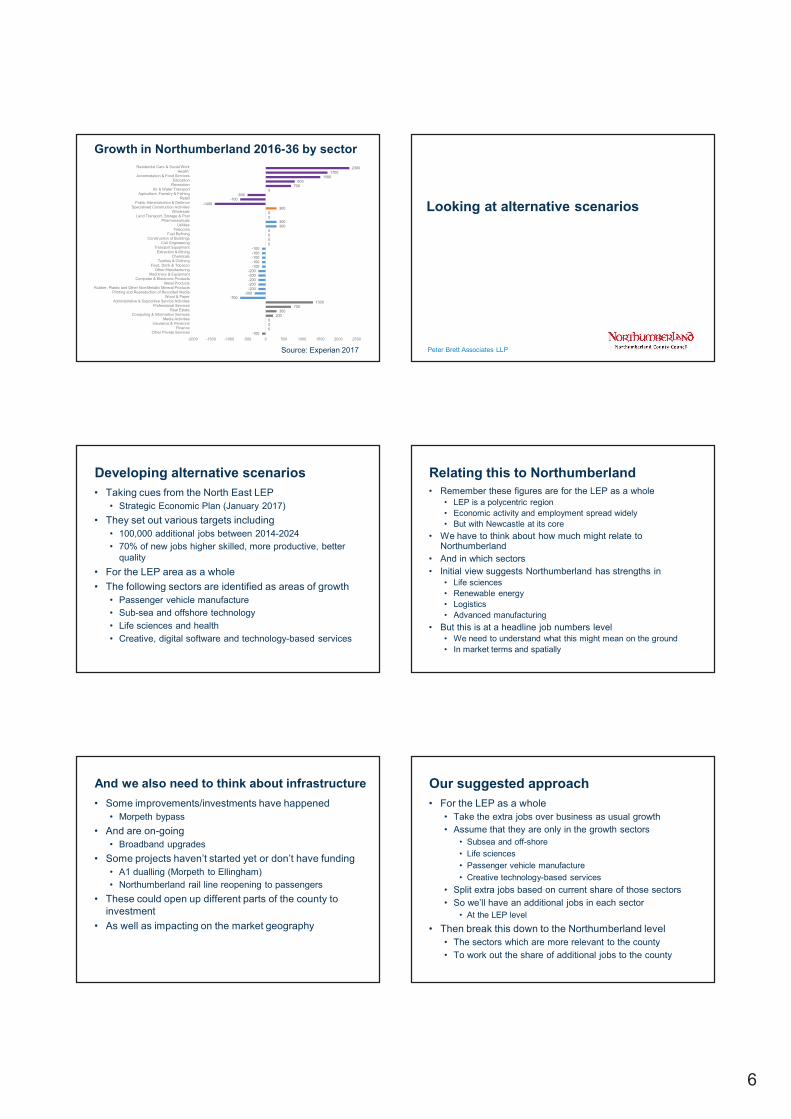
6
Growth in Northumberland 2016-36 by sector
-100000
200300
7001300
-700-300
-200-200-200-200-200
-100-100-100-100-100
0000
300300
00
300-1400
-700-500
0700
8001500
17002300
-2000 -1500 -1000 -500 0 500 1000 1500 2000 2500
Other Private ServicesFinance
Insurance & PensionsMedia Activities
Computing & Information ServicesReal Estate
Professional ServicesAdministrative & Supportive Service Activities
Wood & PaperPrinting and Reproduction of Recorded Media
Rubber, Plastic and Other Non-Metallic Mineral ProductsMetal Products
Computer & Electronic ProductsMachinery & Equipment
Other ManufacturingFood, Drink & Tobacco
Textiles & ClothingChemicals
Extraction & Mining
Transport EquipmentCivil Engineering
Construction of BuildingsFuel Refining
TelecomsUtilities
PharmaceuticalsLand Transport, Storage & Post
WholesaleSpecialised Construction Activities
Public Administration & DefenceRetail
Agriculture, Forestry & FishingAir & Water Transport
RecreationEducation
Accomodation & Food ServicesHealth
Residential Care & Social Work
Source: Experian 2017 Peter Brett Associates LLP
Looking at alternative scenarios
Developing alternative scenarios
• Taking cues from the North East LEP
• Strategic Economic Plan (January 2017)
• They set out various targets including
• 100,000 additional jobs between 2014-2024
• 70% of new jobs higher skilled, more productive, better
quality
• For the LEP area as a whole
• The following sectors are identified as areas of growth
• Passenger vehicle manufacture
• Sub-sea and offshore technology
• Life sciences and health
• Creative, digital software and technology-based services
Relating this to Northumberland
• Remember these figures are for the LEP as a whole
• LEP is a polycentric region
• Economic activity and employment spread widely
• But with Newcastle at its core
• We have to think about how much might relate to Northumberland
• And in which sectors
• Initial view suggests Northumberland has strengths in
• Life sciences
• Renewable energy
• Logistics
• Advanced manufacturing
• But this is at a headline job numbers level
• We need to understand what this might mean on the ground
• In market terms and spatially
And we also need to think about infrastructure
• Some improvements/investments have happened
• Morpeth bypass
• And are on-going
• Broadband upgrades
• Some projects haven’t started yet or don’t have funding
• A1 dualling (Morpeth to Ellingham)
• Northumberland rail line reopening to passengers
• These could open up different parts of the county to
investment
• As well as impacting on the market geography
Our suggested approach
• For the LEP as a whole
• Take the extra jobs over business as usual growth
• Assume that they are only in the growth sectors
• Subsea and off-shore
• Life sciences
• Passenger vehicle manufacture
• Creative technology-based services
• Split extra jobs based on current share of those sectors
• So we’ll have an additional jobs in each sector
• At the LEP level
• Then break this down to the Northumberland level
• The sectors which are more relevant to the county
• To work out the share of additional jobs to the county

7
Peter Brett Associates LLP
Discussion session 2
Implications for the sectors
Sector-based break out discussions
• Topics
• Rural and tourist economy
• Port-related activities
• Life sciences and health
• Town centres and business parks
Break out discussion• What are Northumberland good at?
• What are the main business activities?
• What kinds of businesses are growing?
• Or have potential to grow?
• What places are growing?
• Or have potential to grow?
• What are Northumberland’s opportunities?• What could they be good at in the future?
• What are the barriers to growth?• More / different development sites?
• For what kinds of businesses?
• Where?
• More /better infrastructure?• What?
• Where
• What could be done to unlock growth?• Potential for inward investment?
• Public sector intervention?
Housing and economic growth options
Findings report
June 2018
Discussion notes
What is Northumberland good at? What are the main business activities?
Food and agricultural sectors - not just farming
Tourism key sector � view that the contribution of tourism to the economy is underestimated
�Energy Central� has been a successful rebranding, concentrating on advanced
manufacturing.
Offshore energy, wind, oil and gas / �subsea� and decommissioning of sea related
infrastructure.
What kinds of businesses are growing? Or have potential to grow?
Potential for further growth in Northumberland of Energy Central, the pharmaceuticals and
life sciences
Recent take-up of office space by service providers (e.g. recruitment consultancies, general
service offices, veterinary clinics, gymnasiums and physiotherapy)
SEP growth sectors should not be applied to Northumberland blindly without further thought:
tourism was mentioned again as a Northumberland-specific growth sector. Northumberland
is an atypical part of the LEP
Port-related activities also growing
What places are growing? Or have potential to grow?
Transport for the North Spatial Vision has just been released. Within Northumberland, it
places emphasis on the Airport, Ashington, the Port of Blyth and Morpeth in terms of future
communications networks. The significance of this (e.g. the absence of Cramlington from
that list) needs to be considered carefully. The continuing importance of the main north-south
and east-west transport corridors is also emphasised.
Important not to consider boundaries too much. For example the �Quorum� and �Cobalt� office
areas in N. Tyneside have a strong draw on Northumberland. Similarly, Northumberland
may have a future role in accommodating workspace as North Tyneside becomes �filled up�.
Former Alcan Site at Lynemouth is seeing a lot of interest from small businesses who want a
place to start, but with the capacity to grow/develop - office/warehouse space with outside
space desirable, but with flexible contracts.
Many land and waterfront opportunities for port related uses still remain to be fully exploited
but there is a great deal of interest, including in the former Blyth Power Station site.
Hexham noted as a strong office market area (some workspace being delivered, including
shared working spaces) but in most centres, land is constrained.
What are Northumberland�s opportunities? What could they be good at in the future?
Freeing up agricultural land assets (farms) to enable tourism and recreation.
Developing a higher-end visitor accommodation offer � oversupplied in self-catering etc.
Housing and economic growth options
Findings report
June 2018
Unmet demand around airport and north of the Tyneside conurbation � office demand in
Northumberland suppressed for a long time due to Quorum and Cobalt developments but
now growing. In the future, unmet manufacturing needs may also spill over in
Northumberland
A1 dualling likely to improve accessibility and open up some areas to business growth
Future jobs may have to reflect and cater for the ageing population and mobility issues
What are the barriers to growth?
¡ More / different development sites?
¡ For what kinds of businesses? Where?
¡ More /better infrastructure? What? Where?
Lack of space for short-term business needs.
No speculative building of offices or workshops, although some refurbishments have been
successful in attracting new users. One factor is that rental levels have not gone up so new
stock not viable.
Residential value of land is placing constraints on retail opportunities in popular towns (i.e.
Morpeth).
Need to consider how businesses will be impacted by some infrastructure improvement e.g.
some concern expressed that the reopening of the Ashington, Blyth and Tyne rail line to
passengers could have an adverse impact on the ability of freight rail traffic to access the
port via the branch line that runs from that line.
What could be done to unlock growth? Potential for inward investment? Public
sector intervention?
Broadband and mobile coverage to be key to the successful blossoming of business away
from dedicated business areas. At present this was considered to be inadequate and patchy.
Rural Growth Network hubs as a way of keeping people (and their spending) local � benefits
in terms of sharing information, networking, reducing social isolation associated with home
working. For small businesses, often easier and cheaper to work from home and not take on
the cost and liability of rent/business rates.