housing demand fueling land sales - colliers · housing demand fueling land sales ... land sales...
TRANSCRIPT
Research & Forecast Report
GREATER PHOENIX | LAND1H 2017
Housing Demand Fueling Land SalesKey Takeaways > The Greater Phoenix housing market has been improving at a healthy pace, a trend that continued in the first half of 2017. Single-family construction is gaining momentum and prices for new homes are trending higher at a modest pace. Prices and sales for existing homes are also on the rise.
> Permitting for single-family units rose during the first half of this year, while activity for multifamily housing slowed. Approximately 22,000 single-family permits are forecast to be issued in 2017, along with 7,000 multifamily permits.
> Land sales accelerated in the first half of this year and are well ahead of the pace established in 2016. Sales of land for commercial and industrial development have recorded the strongest increases. Pricing trends have been mixed.
> Property fundamentals in commercial real estate are improving, prompting new development. Strong tenant demand for both industrial and office properties is driving spec construction in these sectors, while retail development will be modest in 2017.
Residential Market Overview > Home prices are on the rise, with steady gains having been recorded over the past 36 months. According to the S&P/Case Shiller Home Price Index, prices in Phoenix rose 5.7 percent year over year through May, a pace that is nearly identical to the national rate of price growth.
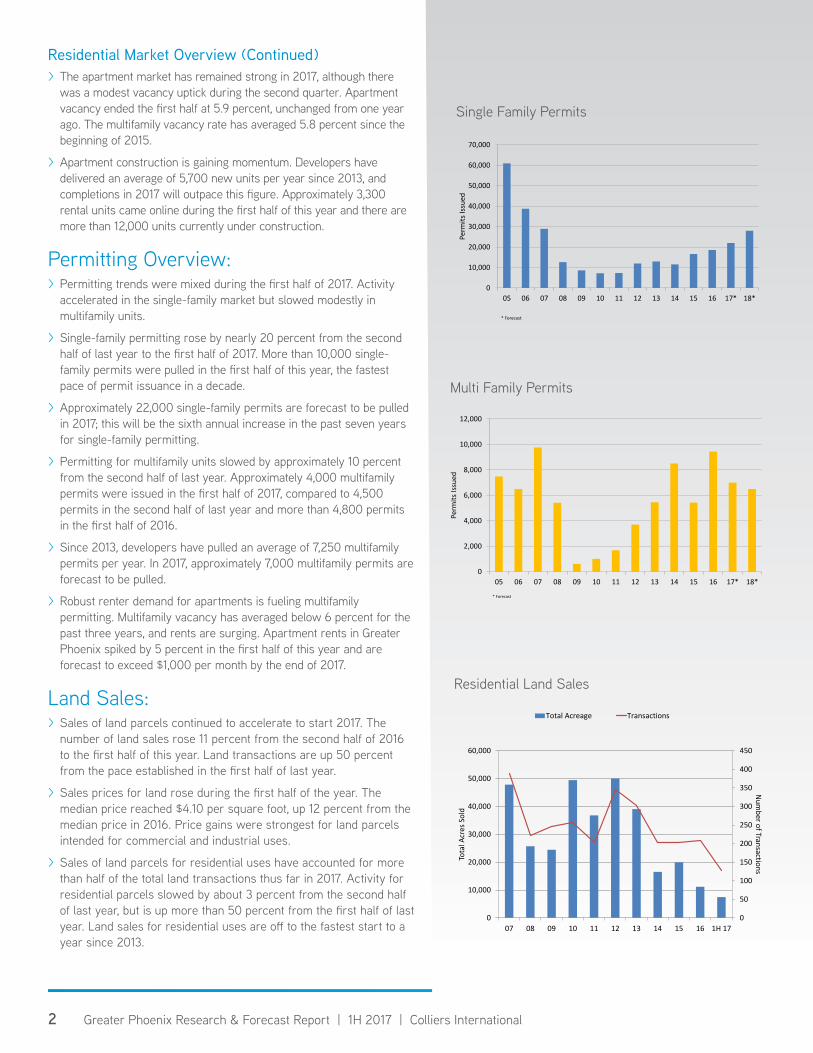
> New home prices are gradually inching higher. The median sales price for new homes sold in the first half of 2017 was approximately $310,000 approximately 3 percent higher than the median price in the first half of last year. The number of new homes sold in the first half of 2017 is up more than 25 percent from the same period of last year.
Market IndicatorsRelative to prior period
Market1H 2017
Market 1H 2016
Land Sales
Land Prices
Residential Sales
Single-Family Permits
Multi-Family Permits
Construction Employment
-20%
-10%
0%
10%
20%
30%
40%
$50,000
$100,000
$150,000
$200,000
$250,000
$300,000
$350,000
96 98 00 02 04 06 08 10 12 14 16 1H17
Percent Change
New
Hom
e Sa
les P
rice
Median Price Annual Change
New Homes Sales Price
2 Greater Phoenix Research & Forecast Report | 1H 2017 | Colliers International
> The apartment market has remained strong in 2017, although there was a modest vacancy uptick during the second quarter. Apartment vacancy ended the first half at 5.9 percent, unchanged from one year ago. The multifamily vacancy rate has averaged 5.8 percent since the beginning of 2015.
> Apartment construction is gaining momentum. Developers have delivered an average of 5,700 new units per year since 2013, and completions in 2017 will outpace this figure. Approximately 3,300 rental units came online during the first half of this year and there are more than 12,000 units currently under construction.
Permitting Overview: > Permitting trends were mixed during the first half of 2017. Activity accelerated in the single-family market but slowed modestly in multifamily units.
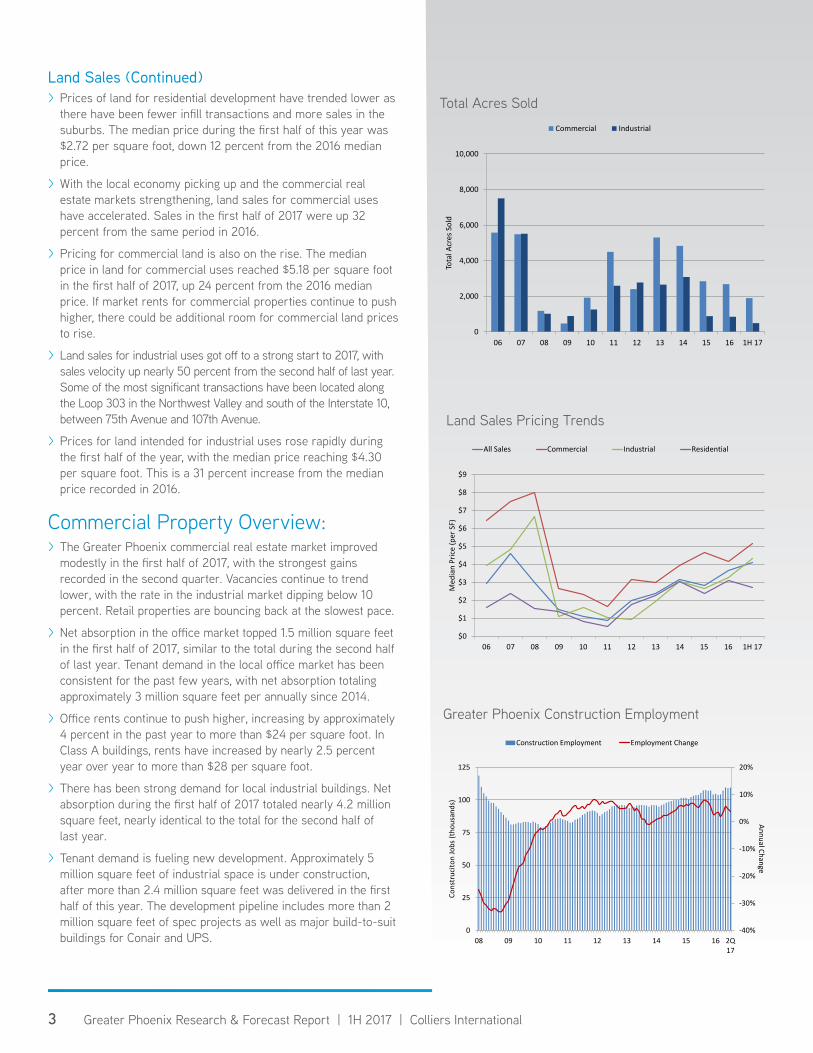
> Single-family permitting rose by nearly 20 percent from the second half of last year to the first half of 2017. More than 10,000 single-family permits were pulled in the first half of this year, the fastest pace of permit issuance in a decade.
> Approximately 22,000 single-family permits are forecast to be pulled in 2017; this will be the sixth annual increase in the past seven years for single-family permitting.
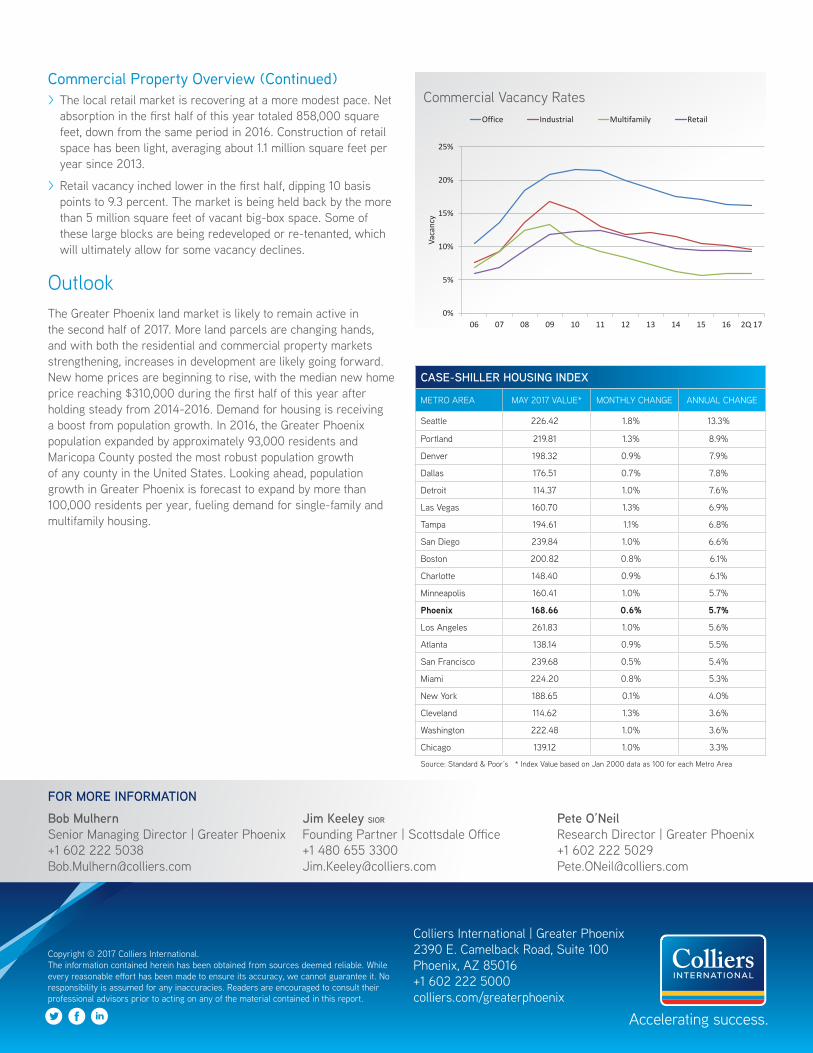
> Permitting for multifamily units slowed by approximately 10 percent from the second half of last year. Approximately 4,000 multifamily permits were issued in the first half of 2017, compared to 4,500 permits in the second half of last year and more than 4,800 permits in the first half of 2016.
> Since 2013, developers have pulled an average of 7,250 multifamily permits per year. In 2017, approximately 7,000 multifamily permits are forecast to be pulled.
> Robust renter demand for apartments is fueling multifamily permitting. Multifamily vacancy has averaged below 6 percent for the past three years, and rents are surging. Apartment rents in Greater Phoenix spiked by 5 percent in the first half of this year and are forecast to exceed $1,000 per month by the end of 2017.
Land Sales: > Sales of land parcels continued to accelerate to start 2017. The number of land sales rose 11 percent from the second half of 2016 to the first half of this year. Land transactions are up 50 percent from the pace established in the first half of last year.
> Sales prices for land rose during the first half of the year. The median price reached $4.10 per square foot, up 12 percent from the median price in 2016. Price gains were strongest for land parcels intended for commercial and industrial uses.
> Sales of land parcels for residential uses have accounted for more than half of the total land transactions thus far in 2017. Activity for residential parcels slowed by about 3 percent from the second half of last year, but is up more than 50 percent from the first half of last year. Land sales for residential uses are off to the fastest start to a year since 2013.
0
10,000
20,000
30,000
40,000
50,000
60,000
70,000
05 06 07 08 09 10 11 12 13 14 15 16 17* 18*
Perm
its Is
sued
Single-Family Permits
* Forecast
Residential Market Overview (Continued)
0
2,000
4,000
6,000
8,000
10,000
12,000
05 06 07 08 09 10 11 12 13 14 15 16 17* 18*
Perm
its Is
sued
Multifamily Permits
* Forecast
0
50
100
150
200
250
300
350
400
450
0
10,000
20,000
30,000
40,000
50,000
60,000
07 08 09 10 11 12 13 14 15 16 1H 17
Number of Transactions
Tota
l Acr
es S
old
Total Acreage Transactions
Residential Land Sales
Single Family Permits
Multi Family Permits
3 Greater Phoenix Research & Forecast Report | 1H 2017 | Colliers International
> Prices of land for residential development have trended lower as there have been fewer infill transactions and more sales in the suburbs. The median price during the first half of this year was $2.72 per square foot, down 12 percent from the 2016 median price.
> With the local economy picking up and the commercial real estate markets strengthening, land sales for commercial uses have accelerated. Sales in the first half of 2017 were up 32 percent from the same period in 2016.
> Pricing for commercial land is also on the rise. The median price in land for commercial uses reached $5.18 per square foot in the first half of 2017, up 24 percent from the 2016 median price. If market rents for commercial properties continue to push higher, there could be additional room for commercial land prices to rise.
> Land sales for industrial uses got off to a strong start to 2017, with sales velocity up nearly 50 percent from the second half of last year. Some of the most significant transactions have been located along the Loop 303 in the Northwest Valley and south of the Interstate 10, between 75th Avenue and 107th Avenue.
> Prices for land intended for industrial uses rose rapidly during the first half of the year, with the median price reaching $4.30 per square foot. This is a 31 percent increase from the median price recorded in 2016.
Commercial Property Overview: > The Greater Phoenix commercial real estate market improved modestly in the first half of 2017, with the strongest gains recorded in the second quarter. Vacancies continue to trend lower, with the rate in the industrial market dipping below 10 percent. Retail properties are bouncing back at the slowest pace.
> Net absorption in the office market topped 1.5 million square feet in the first half of 2017, similar to the total during the second half of last year. Tenant demand in the local office market has been consistent for the past few years, with net absorption totaling approximately 3 million square feet per annually since 2014.
> Office rents continue to push higher, increasing by approximately 4 percent in the past year to more than $24 per square foot. In Class A buildings, rents have increased by nearly 2.5 percent year over year to more than $28 per square foot.
> There has been strong demand for local industrial buildings. Net absorption during the first half of 2017 totaled nearly 4.2 million square feet, nearly identical to the total for the second half of last year.
> Tenant demand is fueling new development. Approximately 5 million square feet of industrial space is under construction, after more than 2.4 million square feet was delivered in the first half of this year. The development pipeline includes more than 2 million square feet of spec projects as well as major build-to-suit buildings for Conair and UPS.
Land Sales (Continued)
Greater Phoenix Construction Employment
-40%
-30%
-20%
-10%
0%
10%
20%
0
25
50
75
100
125
08 09 10 11 12 13 14 15 16 2Q17
Annual Change
Cons
truc
iton
Jobs
(tho
usan
ds)
Construction Employment Employment Change
$0
$1
$2
$3
$4
$5
$6
$7
$8
$9
06 07 08 09 10 11 12 13 14 15 16 1H 17
Med
ian
Price
(per
SF)
All Sales Commercial Industrial Residential
Land Sales Pricing Trends
0
2,000
4,000
6,000
8,000
10,000
06 07 08 09 10 11 12 13 14 15 16 1H 17
Tota
l Acr
es S
old
Commercial Industrial
Total Acres Sold
44 North American Research & Forecast Report | Q4 2014 | Office Market Outlook | Colliers International
Copyright © 2017 Colliers International.The information contained herein has been obtained from sources deemed reliable. While every reasonable effort has been made to ensure its accuracy, we cannot guarantee it. No responsibility is assumed for any inaccuracies. Readers are encouraged to consult their professional advisors prior to acting on any of the material contained in this report.
Colliers International | Greater Phoenix2390 E. Camelback Road, Suite 100 Phoenix, AZ 85016+1 602 222 5000colliers.com/greaterphoenix
FOR MORE INFORMATIONBob MulhernSenior Managing Director | Greater Phoenix+1 602 222 5038 [email protected]
Jim Keeley SIOR
Founding Partner | Scottsdale Office+1 480 655 3300 [email protected]
Pete O’NeilResearch Director | Greater Phoenix+1 602 222 [email protected]
CASE-SHILLER HOUSING INDEX
METRO AREA MAY 2017 VALUE* MONTHLY CHANGE ANNUAL CHANGE
Seattle 226.42 1.8% 13.3%
Portland 219.81 1.3% 8.9%
Denver 198.32 0.9% 7.9%
Dallas 176.51 0.7% 7.8%
Detroit 114.37 1.0% 7.6%
Las Vegas 160.70 1.3% 6.9%
Tampa 194.61 1.1% 6.8%
San Diego 239.84 1.0% 6.6%
Boston 200.82 0.8% 6.1%
Charlotte 148.40 0.9% 6.1%
Minneapolis 160.41 1.0% 5.7%
Phoenix 168.66 0.6% 5.7%
Los Angeles 261.83 1.0% 5.6%
Atlanta 138.14 0.9% 5.5%
San Francisco 239.68 0.5% 5.4%
Miami 224.20 0.8% 5.3%
New York 188.65 0.1% 4.0%
Cleveland 114.62 1.3% 3.6%
Washington 222.48 1.0% 3.6%
Chicago 139.12 1.0% 3.3%
Source: Standard & Poor’s * Index Value based on Jan 2000 data as 100 for each Metro Area
> The local retail market is recovering at a more modest pace. Net absorption in the first half of this year totaled 858,000 square feet, down from the same period in 2016. Construction of retail space has been light, averaging about 1.1 million square feet per year since 2013.
> Retail vacancy inched lower in the first half, dipping 10 basis points to 9.3 percent. The market is being held back by the more than 5 million square feet of vacant big-box space. Some of these large blocks are being redeveloped or re-tenanted, which will ultimately allow for some vacancy declines.
OutlookThe Greater Phoenix land market is likely to remain active in the second half of 2017. More land parcels are changing hands, and with both the residential and commercial property markets strengthening, increases in development are likely going forward. New home prices are beginning to rise, with the median new home price reaching $310,000 during the first half of this year after holding steady from 2014-2016. Demand for housing is receiving a boost from population growth. In 2016, the Greater Phoenix population expanded by approximately 93,000 residents and Maricopa County posted the most robust population growth of any county in the United States. Looking ahead, population growth in Greater Phoenix is forecast to expand by more than 100,000 residents per year, fueling demand for single-family and multifamily housing.
Commercial Property Overview (Continued)
0%
5%
10%
15%
20%
25%
06 07 08 09 10 11 12 13 14 15 16 2Q 17
Vaca
ncy
Office Industrial Multifamily Retail
Commercial Vacancy Rates