housing & development bank - hdbeg - hdb-egy.comhdb-egy.com/english/housing development bank -...
TRANSCRIPT

Housing & Development Bank
Investor Presentation Q2- 2015 Results
August 2015

Disclaimer
• In this presentation Housing and Development Bank (HDB) may make forward
looking statements, including, for example, statements about management’s
expectations, strategic objectives, growth opportunities and business prospects. Such
forward looking statements by their nature may involve a number of risks, uncertainties
and assumptions that could cause actual results or events to differ materially from
those expressed or implied by these statements. Examples may include financial
market volatility; actions and initiatives taken by current and potential competitors;
general economic conditions; and the effect of current, pending and future legislation,
regulations and regulatory actions. Furthermore, forward looking statements contained
in this document that reference past trends or activities should not be taken as a
representation that such trends or activities will continue.
• Housing and Development Bank (HDB) does not undertake any obligation to update
or revise any forward looking statements. Accordingly, readers are cautioned not to
place undue reliance on forward looking statements, which speak only as of the date on
which they are made
• This document is provided for informational purposes only. It does not constitute an
offer to sell or a solicitation of an offer to buy any securities or interests described within
it in any jurisdiction. We strongly advise potential investors to seek financial guidance
when determining whether an investment is appropriate to their needs
2

Agenda
• Historical overview
• Business review
• Financial review Stand Alone
•
• Financial review Consolidated
• Stock
• CSR
• Contact Us
3
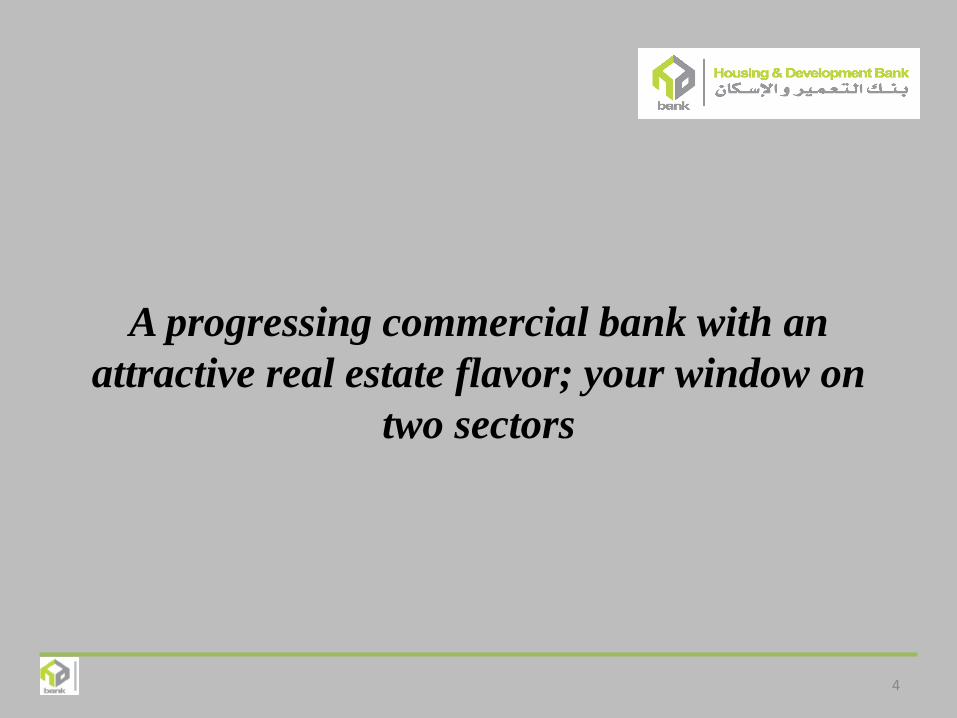
A progressing commercial bank with an
attractive real estate flavor; your window on
two sectors
4

Historical overview
5

Our Start
• Egypt’s Housing & Development Bank was established
35 years ago; in 1979, as an arm of the Ministry of
Housing. At the time of its launch it had a clear mandate
to finance moderate housing units for Egyptians, while
also bridging the gap between supply and demand in the
nation’s real estate market.
• By the late 1980s & 1990’s HD Bank had already
successfully concluded many flagship developments,
which brought new housing units to many urban
communities and strategic investments in the country’s
northern coastal resorts.
6

Ownership Structure
7
8%
7%
30%
7% 11%
22%
15%
Misr Insurance Co.
Misr Life Insurance Co.
New Urban Communities Authority
Housing Fincance Fund
Egyptian Endowment Authouriy
Regional HNWI
Free Float
Our Transformation
8
As a result we became:
• A growing commercial bank in the Egyptian market.
• Upgraded the human capital of quality to support the growth of both the
banking and real estate businesses.
• New Bank products and Real Estate Projects continue to be the key at
increasing our growing client base & performance.
• In 2003, Egyptian banking law 88 prohibited the existence of specialized banks
in Egypt, and HDB was restructured to become a conventional bank, with a new
management appointed. The bank nevertheless still owns several plots of land
which will be developed into commercial and residential projects for sale.
• Management implemented a five-year plan to turnaround the bank in 2009, by
heavily investing in new IT systems, renovating its branch network and
increasing its marketing efforts. HDB currently has a branch network of 62
branches.

Our Journey
Founded in 1979 as a specialized entity for
real estate development &
provision of housing units to different sectors of the economy
Initial capital of
EGP 18mn
Registered on
EGX in 1983
Continued
growth of
real estate
investments
1993: raised
paid-in
capital
to EGP
54mn
2000: raised
paid-in
capital to
EGP
122.3mn
through
existing
shareholders
2003:
Introduction
of new
banking
law
Bank
restructured,
increased
focus on
growth of core
banking
business
Further
expansion in
real estate
development
to be carried
out through
subsidiaries
In 2006 provided an integrated banking system to cater to the retail sector
Raised: paid-in capital increased to EGP 500mn through existing shareholders
In 2009 investment in Hyde Park Development
Paid-in capital
increased to
EGP 1.2bn
through a
private
placement and
portion through
HDB`s ESOP
First time non-
Egyptians
allowed
ownership of
HDB shares;
their ownership
reached 20%
Vitalized the
corporate
identity
campaign
Introduction of
stage I of the
new IT system
to streamline
performance
Increased
street visibility
through
increased
branches,
ATMs and
POS
Increased real
estate
activities,
investment
reached
EGP 912 mn
1979 1993 2003 2006 2010 2013
9
2014
Participation in
the CBE
Mortgage
Finance Initiative
for Medium &
Low Income
Housing
Increased street
visibility through
increased
branches, ATMs
and POS
Started the
restructuring of
Hyde Park
Development
after using the
Equity Associate
method

Board of Directors
10
Egyptian
Awkaf
Organization
2 Members
New Urban
Communities
Organization
4 Members
Misr
Insurance
Company
1 Member
Housing
Financing
Fund
1 Member
Misr For Life
Insurance
1 Member
Vice
Chairman &
MD
(Executive)
Essam Abou
Hamed
Independent
Board
Members
2 Member
MD For
Engineering
& Investments
Affairs
(Executive)
Mohamed
El Alfi
Chairman &
Managing Director
(Executive)
Fathy El Sebai
Experienced
Members
1 Members

• Board composition: 3 Executives and 12 Non-Executives
• 5 Board Committees meeting on a regular basis, namely:
Audit Committee
Risk Committee
Remuneration Committee
Governance & Nomination Committee
Executive Committee
Investment Committee
• Remuneration Committee comprised of the main shareholders and independent Board Members
• Independence of Compliance, Internal Audit and Risk Management functions
• Functioning Committees ensure that HDB Management fully complies with all regulatory requirements as well as internal policies ensuring strict adherence to best practices with respect to clients, employees and third parties dealings
11
Corporate Governance

Our Organization Chart
Chairman
Audit Division
Audit & Risk Committees
Compliance Division
Real Estate & Engineering
Real Estate Development
Consultancy
Asset Management
Support Functions*
Finance
Legal
IT
Human Resources
Strategy & Planning
Administration
Investment
Investment
Vice Chairman & MD
Credit
Treasury
Marketing
Financial Operations
Branches
MD For Engineering & Investments
Risk Division
12

Business review
13

Housing & Development Bank
Banking Business Real Estate Business
HDB has direct and indirect ownership positions in 14 subsidiaries and sister companies;
total EGP 974 million as at end of Q2-2015 and ownerships range between 16% to 92%
with activities including:
• Mortgage finance
• Property development
• Property management services
• Insurance
• Real estate development
• Management of real estate funds
• Leasing Finance
Investment Business
Includes some subsidiaries & sister companies
Our Business Model
14

Our HDBK Group Structure
15
Housing & Development Bank Group
Holding Co . For Investment &
Development
92% Ownership by HDBK
Housing & Development Co.
For Real Estate Investment 60% Ownership by HDBK
EL-Tameer Co. For Housing & Utilities
35% Ownership by HDBK
Zayed City Edge
38% Ownership by HDBK El-Tameer Co. For Security & care services
39% Ownership by HDBK
El-Tameer Co. For Mortgage Finance
24.80% Ownership by HDBK
El-Tameer Co. For Asset Management
15.70% Ownership by HDBK
El-Tameer Co. For Real Estate Investment Funds
24% Ownership by HDBK
HD Company For Trading Securities
20% Ownership by HDBK
Tameer Co. for Real Estate Investment Development
37% Ownership by HDBK
El-Tameer Co. For Financial & Real Estate Marketing
39% Ownership by HDBK
El-Tameer Co. For Technological services
40% Ownership by HDBK
Obelisk for investment fund management
30% Ownership by HDBK Hyde Park Co. for Real Estate Development
36.90% Ownership by HDBK
38%
51%
76%
31%
21% 51%
60%
60%
51%
18.2%
• Blue Line elaborate Bank Direct Investment • Red Line elaborate Holding Company Investment
2%

Our Equity Investments
16
Serial Company Name Participation
% Value in EGP
Holding
Company For
Investment &
Development
Participation %
Value in EGP
Subsidiries 1 * Holding Co . For Investment & Development 92.00% 365,000,000
2 Housing & Development Co. For Real Estate Investment 60.00% 180,000,000 38.00% 114,000,000
Sister Companies
3 EL-Tameer Co. For Housing & Utilities 35.00% 5,250,000
4 El-Tameer Co. For Mortgage Finance 24.80% 93,200,000
5 El-Tameer Co. For Asset Management 15.70% 942,000 51.00% 3,060,000
6 El-Tameer Co. For Security & care services 39.00% 1,521,000 51.00% 1,989,000
7 El-Tameer Co. For Real Estate Investment Funds 24.00% 2,400,000 76.00% 7,590,000
8 El-Tameer Co. For Financial & Real Estate Marketing 39.00% 2,178,158 60.00% 6,000,000
9 El-Tameer Co. For Technological services 40.00% 4,000,000 51.00% 5,100,000
10 Tameer Co. for Real Estate investment Development 37.00% 18,500,000 60.60% 121,345,300
11 HD Co . For trading securities 20.00% 10,000 31.00% 4,650,000
12 Obelisk for investment fund management 30.00% 10,000 21.00% 525,021
13 Zayed City Edge 38.00% 102,600,000 2% 10,800
Company Name Participation
% Value in EGP
Holding
Company For
Investment &
Development
Participation %
Value in EGP
Equity 1 Hyde Park Real Estate Co. For Development 36.90% 198,622,250 18.20% 81,900,000
Total 974,233,408

HDB Financials
• Based on the above HDB has 2 kinds of financial:
1- Standalone Financials: which compromises of the bank commercial activity & Real Estate that is 100% owned by bank.
2- Consolidated Financials: which compromises of the bank standalone & all investment activity in sister, subsidiaries and equity associates companies.
17

Real Estate Business Model
Two Real Estate Models within HDB:
• Model One: Projects directly under HDB 100% ownership being sold only
after the total completion of construction and mainly for lands allocated to
the bank before the 2003 banking law.
• Model Two: Projects that are owned by subsidiaries that are sold off Plan or
during the construction phase.
In both Models revenue is recognized & recorded upon delivery of units.
18
Ready to Sell Units across Projects 100% Owned by HDBK 30/6/2015
* All sales will be done at current market prices
Project Name Description Segment Total Number of
Units Sold Units
Available Units for Sale
October - El Montazah - Phase 1 Residential Middle 240 232 8
New Cairo - Acacia - Phase 1 Residential Upper Middle 220 218 2
Ganat El Obour Residential & Commercial Economic 1620 1490 130
6 October Project - Phae 2 and 3 Residential Middle 660 99 561
El Arish City Residential Economic 184 4 180
Qena Governerate Residential Economic 162 140 22
New Cairo - Acacia - Phase 2&3 Residential Upper Middle 593 25 568
Administrative Building Plot 28 Office Upper Middle Leasing Leasing
Diffierient Sites Residential & Commercial 63 1 62
3742 2209 1533

Potential Upside of Revenue
& Profit
19 ** All sales will be done at current market prices
Land Bank Owned by HDB 30 June 2015 **
Item Cost in EGP
Land Area Sq.
m
Ganat El Obour – El Obour 198,362 5,000
6 October Project El Montazah - Phase 2 and 3 1,011,150 4,815
New Cairo - Acacia - Phase 2&3 29,669,123 6,800
New Cairo - Plot 31 31,778,193 108,072
Hurgada - Red Sea Land 5,822,504 6,150
El Koroum Street Land Number 24 - Office Building 17,257,185 750
Helwan Land 120,757,906 105,000
Total 206,494,423 236,587
Work In Progress As of 30 June 2015 **
Project Name Number of Units Type of Units Cost in EGP
Qenna Governorate 90 Apartments 9,361,901
New Cairo -5th Settlement - El Safa 95 Villas 113,166,181
Hurgada Governerate 174 Challet 14,237,424
Different Sites 304
Mix of products
including Shops 11,783,078
Total 663 148,548,584

Years in Review
20 * Consolidated including minority interest
** Includes 3.3 million sqm in Hyde Park
*** Subsidized Loan by CBE
Item Break Down 2009 2013 2014
Revenue breakdown Banking EGP Million 930 1,251 1,322
Real Estate EGP Million 142 466 381
Deposits EGP Million 6,500+1200*** 8,800+1000*** 15,145+1000***
Loans EGP Million 6,800 6,400 7,100
Real Estate Activity Land meters squared 837,459 3,811,600** 472,000
BUA meters squared 328,447 2,900,000 662,947
Investment Activity EGP Million 399 912 912
Human Capital Spending 2503 employees EGP Million 1.7 4 2.03
Share Holders Equity Standalone EGP Million 1,070 2,100 2,200
Consolidated EGP Million 1,600 3,600 2,800
Total Assets Standalone EGP Million 17,800 24,900 23,030
What We Aim For
Our Vision
To be within the five top ranked banks in Egypt, with
direct involvement in the real estate business to both
boost our financial performance and continue
profitably to asset-back our banking business
Our Mission
Through the continuous upgrade of our human capital
we strive to excel in providing our clients, both in
banking and real estate, with an outstanding level of
services and innovative products
21

Our Strategy
Accelerate
Overall
Banking
Growth
HDB
Strategy
Capitalize On Our Housing Reputation To Attract
New Clients Into Our Banking Business
Increase
Customer
Base
Provide
Integrated
Real Estate
Services
Maximize
Profitability
Continued
Customer
Satisfaction
Provide Integrated Real Estate Services
Construction and sale of housing units through
affiliated companies
Provide real estate financing
Supervision of implementation of housing projects
Real estate business appraisal
Capitalize On Our Housing Reputation To Attract
New Clients Into Our Banking Business
Capitalize on our reputation and experience in
providing full range of housing and property
development services to attract new retail and
corporate costumers to our banking services;
marketing efforts
Increasing Customer Base
Enhance corporate lending, increase retail financing
whether through retail loans, mortgage finance or
credit card business. Improve client access through
increased street visibility, introducing a wider variety of
short, medium and long term saving schemes
Continued Customer Satisfaction
Introducing new products to capture targeted growth
in both banking and real estate business
22

Our Products Range
Retail Products
Current accounts
Saving products
Loan products
Debit/Credit /Prepaid Cards
Life insurance services
Safe deposit boxes
Payroll services
Vodafone cash
Housing installment and e-payments
Corporate Products
Credit facilities
Trade finance
Limited investment banking
services
e-payments
Financing customs & taxes
Specialized services to SMEs
Treasury & cash management
Financing customs & taxes
Specialized services to SMEs
Treasury & cash management
Real Estate Products
Real estate financing
Real estate investment & development
Construction of housing units*
Supervision of implementation of the projects owned by HDB & others
Real Estate consulting and engineering services*
Business appraisal and feasibility studies*
* Through HDB’s subsidiaries & affiliates 23

Our Way Forward
New core banking IT
system allows handling
of increased more
complex products and a
greater client base
Increasing planned
branch network set to
capture a greater
portion of retail
business to reach 100
branches by end of 2017
Low loan/deposit ratio coupled with the recent
capital increase allowing for increased and varied
lending opportunities
Hidden equity; around
3.25 million sqm of
undeveloped land
carried at an average
cost of EGP 1,317/sqm
Trading at Price to Book
of around 1 & Price to
earnings of around 7
HIGH GROWTH PROSPECTS OVER THE NEXT FIVE YEARS
24

Financial Review Stand Alone
25

26
Standalone Financial Position***
30 June 2015(EGP million)
7,575 Total Loans
10,682 Total Deposits
1,189 Total Revenue
51% Net Operating Margin
322 Net Profit After Tax
5.4% NPL/Total Loans
62% Cost/ Income Ratio
22.84% Tier 1 capital – Basel I
17.91% Tier 1 capital – Basel II
Our Bank Financial Snap Shot

27
670
1,150 1,150 1,150 1,150
1,265 1,265
0
200
400
600
800
1000
1200
1400
2009 2010 2011 2012 2013 2014 Q1-2015
EGP million Paid In Capital
• Total Number of Issued Shares is 126 million with a book Value of EGP 10
• HDB is listed & traded on the Egyptian Stock Exchange (EGX)
• Last Div. / Ex. Date EGP1.50 on 22 Apr 2015
• Est. Free Float 21.4%
• Bonus share issue announced April 2014 at a rate of 0.1% of paid up capital
• Bonus Share Distributed on 12th January 2015
Our Bank Financial Snap Shot

28
55 58 59 59 61 62 62
64 64 65 65 68 68 68
98
114 118 120
152 156 156
0
20
40
60
80
100
120
140
160
180
2009 2010 2011 2012 2013 2014 Q1-2015
Branches P.O.S A.T.M
55 Branches, 98 ATMs, 64 POS 62 Branches, 152 ATMs, 68 POS
Q2- 2015 2009
Footprint
Our Bank Visibility

29
Capital Adequacy Ratio
Capital increase:
EGP500mn to
EGP1.2bn
Return on Assets & Equity
Net Operating Margins & Cost to Income Ratios
Unusually high TB rates & auction
land sales distort ratios
Net Profit
13.7%
24.2% 24.2% 25.5% 25.2%
23.7% 22.84%
20.6% 19.8% 18.6% 17.91%
0%
5%
10%
15%
20%
25%
30%
2009 2010 2011 2012 2013 2014 Q2-2015
Tier 1 Capital to Basel I Tier 1 Capital to Basel II
29.1%
11.2% 9.4%
11.8% 13.2%
15.8% 16.2%
2.3% 1.6% 1.3% 1.7% 1.7% 1.4% 1.2%
0%
5%
10%
15%
20%
25%
30%
35%
2009 2010 2011 2012 2013 2014 Q2 -2015
Return on equity Return on assts
34.9% 37.1% 38.7%
47.1%
40.0% 42.0%
51.0%
65.1% 62.9%
61.3%
52.9%
60.0%
75.3%
62.0%
30%
35%
40%
45%
50%
55%
60%
65%
70%
75%
80%
2009 2010 2011 2012 2013 2014 Q2 -2015
Net operating margins Cost / Income ratio
1,146 1,242 1,265
1,546 1,537
1,770
1,195
882
1,012 1,062
1,244 1,202
1,332
743
264 230
203 302 335
438 451
244 203 176 206 247 306 322
0
200
400
600
800
1,000
1,200
1,400
1,600
1,800
2,000
2009 2010 2011 2012 2013 2014 Q2 -2015Total Revenue Total expenses
Net profit before tax Net profit After tax
EGP million
Our Bank Stand Alone Financial Snap Shot

30
2,149 2,622 3,981 3,584
4,607
8,835
12,710
5,792 6,563
6,646 5,760
6,023
6,514
6,949
1,822
2,282
2,095
2,195
2,570
4,322
5,035
390
630
904
944
1,004
1,056
1,058
374
447
278 366
235
360
414
0
5,000
10,000
15,000
20,000
25,000
30,000
2009 2010 2011 2012 2013 2014 Q2 - 2015
Cash,Mkt.Securities&T-Bills Net Loans Investments Real Estate Activity Fixed Assets Other
10,619
12,657
14,037
13,004
14,592
21,250
EGP million
Our Bank Stand Alone Financial Snap Shot
Development of Assets
26,327

31
Total Liabilities & Shareholder’s Equity
EGP million
Our Bank Stand Alone Financial Snap Shot
6,568 7,505 7,558 8,134 8,869 9626 10862
1,796 1,671 1,553 1,455
1,310 1282
1518
745 957 980 886
896 1192
1969
670 1,150 1,150 1,150
1,150 1265
1265
414
870 904 938 963
982
1039
426
503 1,891 442
1,400
6903
9674
0
5,000
10,000
15,000
20,000
25,000
30,000
2009 2010 2011 2012 2013 2014 Q2-2015
Customer Deposits Long Term Loans (incl.subsidised) Other
Paid In Capital Reserves & Retained earnings Down Payments - Real Estate
12,657
14,037 13,004
14,592
21,250
10617
26,327

32
Development of Loans
Loans To Deposits Raito
• Steady growth in both corporate and retail loans
• With loan to deposit ratio still remaining low, there is room for the planned growth in the loan portfolio
EGP million
6,587 5,978
5,278 4,734 4,636 4,518 4,939
10,682
9,626
8,869
8,134 7,558 7,505
6,568 61.7% 62.1%
59.5%
58.2%
61.3%
60.2%
66.9%
52%
54%
56%
58%
60%
62%
64%
66%
68%
0
2000
4000
6000
8000
10000
12000
Q2-2015201420132012201120102009
Total Loans excluding
subsidized loans
Total Deposits
Loans to Deposits Ratio
EGP Million
3,099 3,248 3,260 2,702 2,831 2,780 2,750
1,746 2,202 2,290
2,118 2,123 2,613 2,842
1,318
1,523 1,534
1,525 1,617
1,691 1,965
26
16 16
17 17
16
17
0
1,000
2,000
3,000
4,000
5,000
6,000
7,000
8,000
2009 2010 2011 2012 2013 2014 Q2-2015
Credit cards Mortgage
Retail Corporate
6,189
6,988 7,100 7,100 6,588 6,362
7,575
Our Bank Stand Alone Financial Snap Shot

33
NPL’s to Total Loans
• Quality of loan portfolio improving with NPLs fully covered
• HDB’s planned retail strategy is set to increase the net interest margins over the next five years
Our Bank Stand Alone Financial Snap Shot
Net Interest Margin
7,575 7,100 ,6588
,6362 7,100 6,989
6,189
386 385 391 433 278 245 239
5.4% 5.4%
5.9%
6.8%
3.9% 3.5% 3.9%
0%
1%
2%
3%
4%
5%
6%
7%
8%
0
1000
2000
3000
4000
5000
6000
7000
8000
Q2-2015201420132012201120102009
Total Loans Non-Performing Loans Non-Performing to Total Loans
EGP million
239 245 278
433 391 384 388
268 278 309
376 435
404 403
112.1% 113.5% 111.2%
86.8%
111.3% 105.2% 103.9%
0
50
100
150
200
250
300
350
400
450
500
2009 2010 2011 2012 2013 2014 Q2-2015
Non-Performing Loans Non-Performing Loans Coverage
Coverage %
EGP million Non-Performing Loans
300 349
392
584
464.2 501
394
0
100
200
300
400
500
600
700
2009 2010 2011 2012 2013 2014 Q2-2015
EGP million Net Interest Income
10.4% 10.6% 11.0%
11.9%
10.5% 10.1% 10.4% 5.3%
5.9% 6.1% 6.3% 6.2% 5.8% 5.7%
5.1% 4.7%
4.9%
5.6%
4.3% 4.3% 4.8%
0%
1%
2%
3%
4%
5%
6%
0%
2%
4%
6%
8%
10%
12%
14%
Q2-2015201420132012201120102009
Loans Deposits Net Interest Margins

Our Bank Standalone Financials
34
Bank Standalone Financials 1/1/2014 till 30/6/2014 On 1/1/2015 till 30/6/2015
2.55
322
451
99 95
397
783
1.63
187
240
68 59
219
550
36.1%
41.9%
46.8%
31.3%
37.9%
44.8%
29.8%
0%
5%
10%
15%
20%
25%
30%
35%
40%
45%
50%
0.00
100.00
200.00
300.00
400.00
500.00
600.00
700.00
800.00
900.00
Earnings Per ShareNet profit for the
year
Net profit for the
year before taxes
Housing projects'
profits
Net fees and
commisions income
Net interest incomeInterest From Loans
& Similar Income
1/1/2015 - 30/6/2015 1/1/2014 - 30/6/2014 Y-o-Y
EGP million

35
144
208
38 51
221
427
86
119
47
30
122
286
40.3% 42.8%
-23.7%
41.2%
44.8%
33.0%
-30%
-20%
-10%
0%
10%
20%
30%
40%
50%
0
50
100
150
200
250
300
350
400
450
Net profit for the
year
Net profit for the
year before taxes
Housing projects'
profits
Net fees and
commisions income
Net interest incomeInterest From Loans
& Similar Income
1/4/2015 - 30/6/2015 1/4/2014 - 30/6/2014 Y-o-Y
EGP million
Our Bank Standalone Financials
Bank Standalone Financials 1/4/2015 till 30/6/2015 On 1/4/2014 till 30/6/2014

36
Our Bank Net Profit Breakdown
979,136
670,763
308,373
87,937
220,437 210,801
67,305 143,496
41,885 101,612
0
200,000
400,000
600,000
800,000
1,000,000
1,200,000
Total Revenue Total Expenses Net Profit Before Taxes Taxes Net Profit After Taxes
Commercial Banking Activity Real Estate Activity
1/1/2015 till 30/6/2015 Item Commercial Banking Activity Real Estate Activity
Total Revenue 979,136 210,801
Total Expenses 670,763 67,305
Net Profit Before Taxes 308,373 143,496
Taxes 87,937 41,885
Net Profit After Taxes 220,437 101,612
Amounts in EGP Million Total Net Profit 322,048

37
Our Bank Net Profit Breakdown
Full Year 2014 Vs. H1-2015
Full Year 2014 1/1/2015 Till 30/6/2015
Item
Commercial Banking
Activity Real Estate Activity Item
Commercial Banking
Activity Real Estate Activity
Total Revenue 1,486,837 268,227 Total Revenue 979,136 210,801
Total Expenses 1,185,995 130,565 Total Expenses 670,763 67,305
Net Profit Before Taxes 300,842 137,662 Net Profit Before Taxes 308,373 143,496
Taxes 90,801 41,550 Taxes 87,937 41,885
Net Profit After Taxes 210,040 96,112 Net Profit After Taxes 220,437 101,612
Amounts in EGP Million Total Net Profit 306,152 Amounts in EGP Million Total Net Profit 322,048

38
Our Bank Participation in the CBE
Mortgage Finance Initiative
• The Central Bank of Egypt (CBE) Launched this initiative in June 2014
• This initiative states that Mortgage Finance is given to Medium and low income clients
• The Medium income clients ceiling is EGP 500 Thousands for a unit
• The low income clients ceiling is EGP 350 Thousands for a unit
• The Total initiative amounts to EGP 10 Billion
• Our Bank requested to participate in this initiative with EGP 2 Billion
• The actual activity started in November 2014
• Actual dispensed amounts till 30th June 2015 is EGP 400 Million to almost 5000
thousands clients
• The spread that our bank receives is from 3.5% to 4.5% on actual amounts dispensed

39
Financial Review Consolidated

Our Bank Consolidated Financials
40
2.3 2.7 4.2 3.8 5.0
9.12 12.90
5.6 6.3 6.5
5.6 5.8
6.54
6.94
1.4 1.8
1.4 1.4
1.9
4.30
5.04
7.5 8.2
8.8 9.2
9.2
1.76
2.00
0.9
1.2 1.3 2.0
2.9 1.15
1.12
0
5
10
15
20
25
30
2009 2010 2011 2012 2013 2014 Q2-2015
Other Fixed Assets
Real Estate Activity Securiities
Net loans Cash,Mkt.Securities&T-Bills
22.1 22.3 20.3
17.8
24.9
Development of Assets
23.03
28.25 EGP billion
6.5 7.5 7.5 8.1 8.8
15.086
10.630 1.8
2.4 2.3 2.5 2.7
1.282
1.518 2.1
1.9 2.3 2.2 2.2
1.300
1.40 5.2 5.4
7.0 5.8 7.6
2.400 10.634
0.7 1.2
1.2 1.2
1.2 1.265
1.265
1.5
1.9 2.0 2.3
2.4 2.700
2.800
0
5
10
15
20
25
30
2009 2010 2011 2012 2013 2014 Q1-2015
Networth. Excl. Capital Paid In Capital
Down Payments - Real Estate Liabilities
Long term loans * Customer deposits
22.1 22.3 20.3
17.8
24.9
28.25
Development of Liabilities & Net worth**
*Assets have decreased because Hyde Park assets has been changed from a Subsidiary to a sister company
** Includes subsidized loans
874 934 1,004 1,239 1,178 1,204
794
69 87 80 93 92 387 71 13
59 135 243
141
142 185 187
469 466 381
165
0
500
1,000
1,500
2,000
2,500
2009 2010 2011 2012 2013 2014 Q2-2015Real Estate Activity Revenues Financial Investments Revenues
Fee And Commission Income Interest And Similar Income
1,284
1,960 1,871 1,860
1,277 1,472
1,201
Development of Revenue
559 597 627 661 698 685 384
27 36 40 135 163 193
149
187 224 277
335 347 368
211
105 182
154
311 203 262
144
0
200
400
600
800
1,000
1,200
1,400
1,600
1,800
2009 2010 2011 2012 2013 2014 Q2-2015
Others Employee CostsIncome Taxes Expense Financial Investments Expenses Fee And Commission Expense Interest And Similar Expense
1,573
908
Development of Expenses
895 1,074
1,128 1,473
EGP billion
EGP billion
EGP billion
*Overall total expenses came down as cost cutting initiatives and increased efficiency procedures came into play
23.03

41
794
1204 1178 1239
1004 934 874
410 518 480
578
377 337 315
51.6%
43.0% 40.7%
46.7%
37.5%
36.1% 36.0%
0%
10%
20%
30%
40%
50%
60%
0
200
400
600
800
1000
1200
1400
Q2-2015201420132012201120102009
Total Operating Revenue Net Operating Income Operating Margins
Operating Profit Margins
603
238
196
522
591 568
476
577
203 156
387 428
374 326
0
100
200
300
400
500
600
700
2009 2010 2011 2012 2013 2014 Q2-2015
Net Profit Before Tax Net Profit After Tax
Net Profit
Our Bank Consolidated Financials
3.2% 1.0% 0.7%
1.8% 1.7% 1.6% 1.20%
35.8%
7.1% 5.2%
12.9% 13.7%
15.1% 12.7%
0%
5%
10%
15%
20%
25%
30%
35%
40%
2009 2010 2011 2012 2013 2014 Q2-2015
Return On Assets Return On Equity
Profitability Evaluation
Capital increase:
EGP500mn to
EGP1.2bn
2.49
14.02
11.47
5.66 5.83
10.67
9.10
0
2
4
6
8
10
12
14
16
2009 2010 2011 2012 2013 2014 Q2-2015
Equity Multiplier
EGP million EGP million

Our Stock
42

Our Bank Fact Sheet
43
• Total Number of Issued Shares is 125,600,000 million with a book Value of
EGP 10
• Last Div. / Ex. Date EGP1.00 on 14 Apr 2014
• Bonus share issue announced April 2014 at a rate of 0.1% of paid up capital
• Bonus Share Distribution Date on 12th January 2015
• Last Cash Dividend distribution date was 22nd April 2015 Incorporation: Egypt
Sector: Banking & Financial Services
Full Listing: The Egyptian Exchange (EGX)
Issued Shares: 125,600,000
Free Float: 21.40%
Listing Date: 13th September 1983
Market Cap: Above EGP 3 Billion
52 Week High: 31.47
52 Week Low: 18.0

Our Stock Activity
44
Stock Data:
Bloomberg / Reuters: HDBK EY / HDBK.CA
14.31 14.69 14.28 14.1 14.51 13.95
15.75 15.5 15.78 16 16.22
18.24 18.98
20.68 20.16
19 19.41 19.88
20.99
24.28
27.02
25.89
27.47
28.6
26.5 27.1
26.6
23 24
23
10
12
14
16
18
20
22
24
26
28
30

Dividend / Share
Year 2009 2010 2011 2012 2013 2014
Dividend / Share 1.25 1 1.25 1.5 1 1.5
45
• HDB has been distributing cash dividend on annual bases.
• HDB in 2013 distributed cash dividend & Bonus share with 1:10 ratio
• HDB Full Year 2014 cash dividend generate a Yield of 6%
• HDB Coupon 34 was distributed on Wednesday 22nd April 2015 for
shareholders record on Sunday 19th April 2015.
• HDB Pay Out Ratio for 2014 is 62%
Payout Ratio
Dividend / Share 1.5
Total Shares 126,500,000
Attributable Net Income 189,750,000
Attributable Net Income 189,750,000
Net Profit 306,152,601
Pay Out Ratio 62%

Why HDB Stock?
46
• HDB performance shows that there is a room for loan growth.
• HDB continued efficiency efforts bringing down cost to income
ratios to that of the peer group.
• HDB has the highest ROE and ROA amongst peers of similar size.
• HDB has the highest cash dividend on the Egyptian market with a
high upside based on peer valuations.
• HDB combination of real estate projects & commercial banking
activities has proven a solid element.
• HDB investments in subsidiaries & sister companies that
complement the business model.

Analyst Coverage
• HDBK is covered by the following coverage houses:
47
Entity Contact Person E-mail
EFG Hermes Elena Sanchez [email protected]
CI Capital Monsef Morsy [email protected]
Beltone Nancy Fahmy [email protected]
Beltone Ahmed El Shazly [email protected]
HC Monette Doss [email protected]
Prime Heba Monir [email protected]
Arqaam Capital Shadi Salman [email protected]

Our Bank CSR
48
Non-Governmental Organization & Non Profit Organizations:
Educational, Family and Society Development, Special Needs, Blind, Local Society
Development, Patient Coverage, Mothers & Infants Coverage and Social Help
Universities & Colleges:
Sponsoring Student Competition, workshops, Research & Development Projects &
Scholarship Hiring
Schools Activities:
Donation of Saving Passbooks to encourage students on saving, and a Housing
Saving Passbook to help them secure a residential unit when they reach 21 Years old.
Plus, Scholarships granted to super students until they graduate from universities too.
Talented:
Provide financial & Psychological support to Super Students
God Gifted Students:
Search for God Gifted Students across all ages & educational levels regardless it is
vocational or academic and provide support
Our Bank CSR Governorates Activities:
Charity Projects & environmental projects that governorates & Cities need to upgrade quality of people & it is done via Bank branches. (Example: street enhancements)
Hospitals Activities:
Sponsorship of Hospital units that look after children, Cancer, Liver, Kidney patients
Institutions & Organizations:
Entrepreneurship , Provide upgrade, maintain & development of schools, Cardio Research & Development, Breast Cancer Awareness, Social Research & Development, Misr El Khier Foundation and Sonaa El Hayat
Orphanages:
Provide support to Orphans & their families to complete education until university graduate
Families:
Provide & distribute food supplies in rural and Slump areas based on needs and requests
Floods & Weather Rehab & Rescue:
Build housing units at El Arish and Aswan to shelter citizens who suffered or lost their homes as a result of Floods or weather conditions
49

Our Bank CSR
Youth Graduate Sponsorships:
Plan training, secure jobs and conduct exhibitions for them
Small & Medium Size Contractors Sponsorship:
Prepare special training sessions with cooperation of the Social Fund for Development (SFD) and granting them SME’s projects to manage & execute and monitoring them to help them technical & Psychology & fund them when required
Small Manufactures & Technicians Support:
Buy & provide them the required materials to produce final products that the bank buy & use in its projects
Support & Conduct Art Exhibitions across several domains:
Conduct Exhibitions, workshops and Seminars to Artists and welcoming celebrities in across Art & Cultural aspects and domains to support Artists and even the bank buy some pieces as a support to them to enhance spiritual & mental creativity
Young Creative Sponsorship :
Prepare exhibitions that is specialized to them and providing support & financial aid to encourage them and push them to excel & continue in creativity
50

Contact Us
51
Mohamed Hamzawy
Strategic Planning & Investment Officer
Housing & Development Bank
Telephone : +2-02- 33357170 Direct Telephone: +2-02-33357327
Fax: +2-02-37627053 Mobile: +2-010-25000551
H/Q 26 El Koroum Street – Mohandessian - Giza, Cairo –Egypt
www.hdb-egy.com E-mail: [email protected]
Samir Soliman
Chief Finance Officer & Assistant CEO
Housing & Development Bank
Telephone : +2-02- 33357170 Direct Telephone: +2-02-33357327
Fax: +2-02-37627053 Mobile: +2-012-23467388
H/Q 26 El Batal Ahmed Abd Al Aziz Street – Mohandessian - Giza, Cairo –Egypt
www.hdb-egy.com E-mail: [email protected]