housing element regional housing needs allocation
TRANSCRIPT

City of Lafayette, CACity Council & Planning CommissionJoint Special Meeting November 30, 2020
HOUSING ELEMENTand
Regional Housing Needs Allocation

MEETING OVERVIEW
Here’s a quick overview of what we want to cover:
1. Why are we here?2. Why now?3. What are our opportunities and constraints?4. What is being requested of CC & PC?
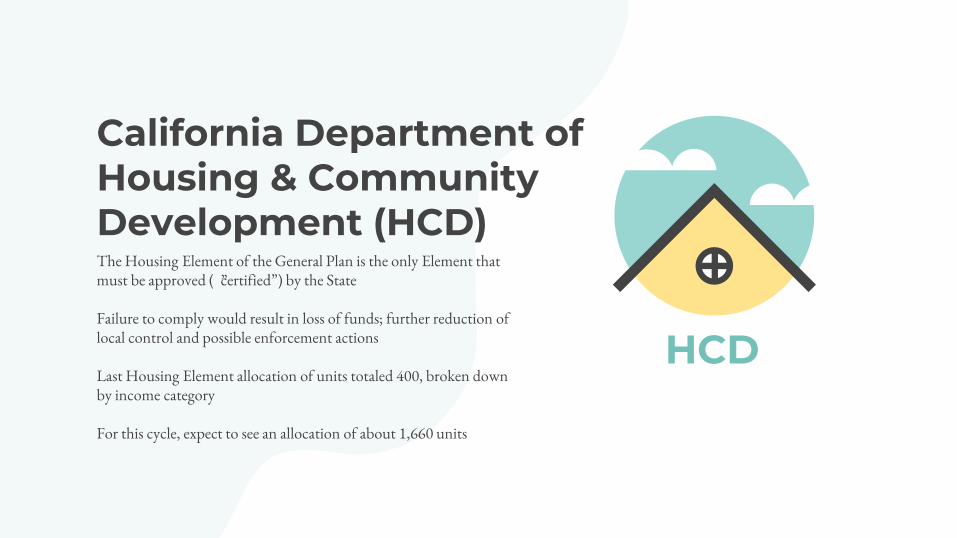
California Department of Housing & Community Development (HCD)The Housing Element of the General Plan is the only Element that must be approved (“certified”) by the State
Failure to comply would result in loss of funds; further reduction of local control and possible enforcement actions
Last Housing Element allocation of units totaled 400, broken down by income category
For this cycle, expect to see an allocation of about 1,660 units
HCD
“Requirements for the content of the Housing Element…are by far the most complex of any of the general plan elements, and it is the only element that is required to be completely updated on a fixed schedule. These requirements for regular updates and prescriptive statutory provisions, coupled with mandated review by the State
and scrutiny by housing advocates, all make housing element adoption politically, technically, and legally difficult.”
—Barbara Kautz, Partner at Goldfarb Lipman and former
Community Development Director, City of San Mateo
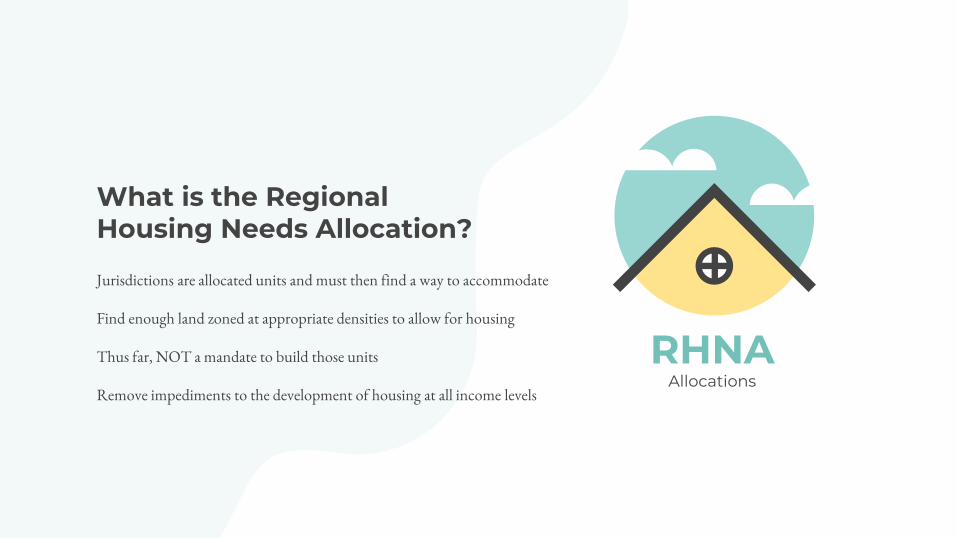
What is the Regional Housing Needs Allocation?
Jurisdictions are allocated units and must then find a way to accommodate
Find enough land zoned at appropriate densities to allow for housing
Thus far, NOT a mandate to build those units
Remove impediments to the development of housing at all income levels
RHNAAllocations
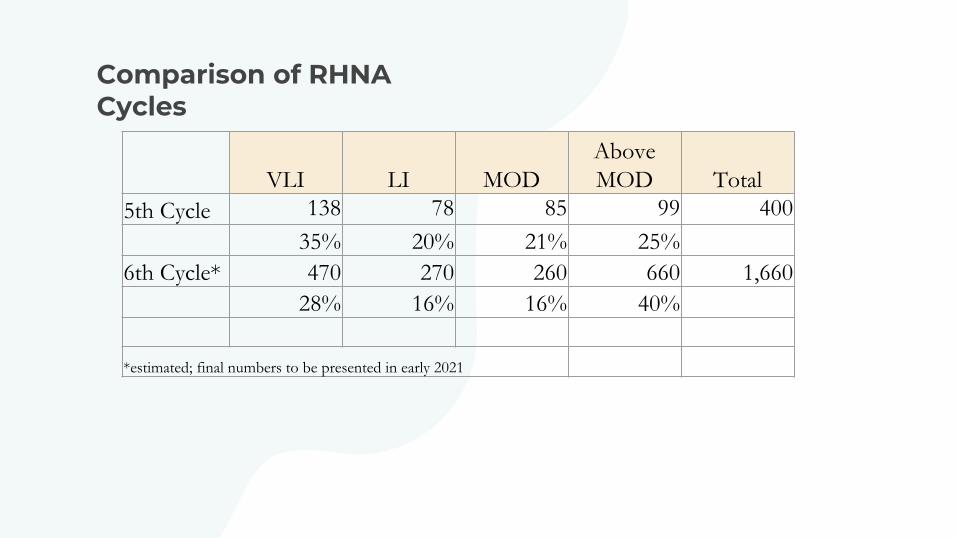
Comparison of RHNA Cycles
VLI LI MOD
Above
MOD Total
5th Cycle 138 78 85 99 400
35% 20% 21% 25%
6th Cycle* 470 270 260 660 1,660
28% 16% 16% 40%
*estimated; final numbers to be presented in early 2021
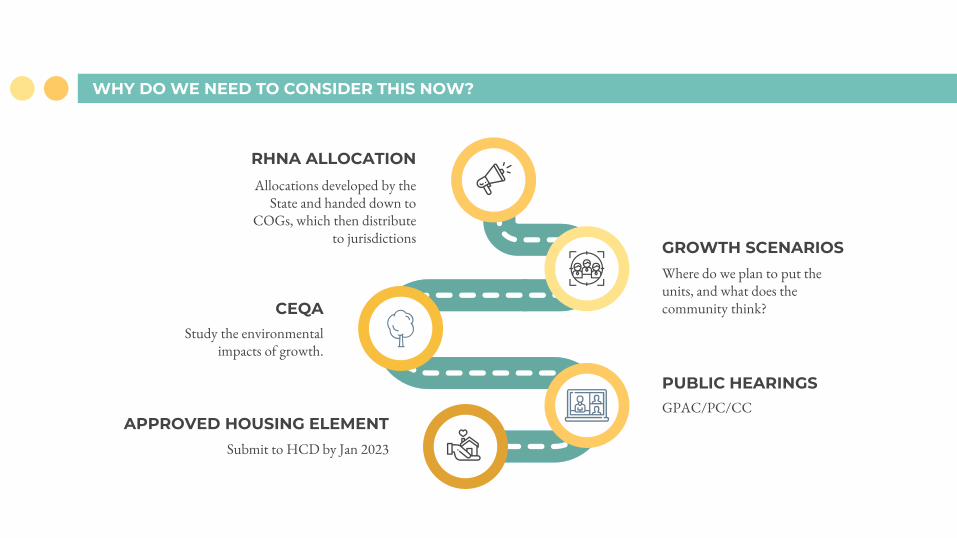
WHY DO WE NEED TO CONSIDER THIS NOW?
GPAC/PC/CC
Study the environmental impacts of growth.
Where do we plan to put the units, and what does the community think?
Submit to HCD by Jan 2023
Allocations developed by the State and handed down to
COGs, which then distribute to jurisdictions
PUBLIC HEARINGS
CEQA
GROWTH SCENARIOS
APPROVED HOUSING ELEMENT
RHNA ALLOCATION
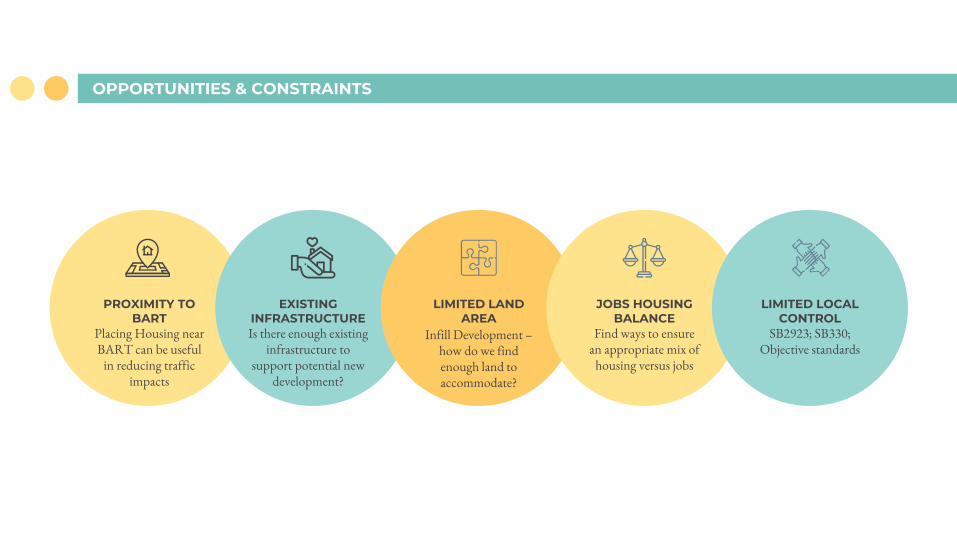
OPPORTUNITIES & CONSTRAINTS
JOBS HOUSING BALANCE
Find ways to ensure an appropriate mix of
housing versus jobs
LIMITED LOCAL CONTROL
SB2923; SB330; Objective standards
EXISTING INFRASTRUCTUREIs there enough existing
infrastructure to support potential new
development?
LIMITED LAND AREA
Infill Development –how do we find enough land to accommodate?
PROXIMITY TO BART
Placing Housing near BART can be useful
in reducing traffic impacts

WHAT DECISIONS NEED TO BE MADE?
ARE THERE OTHER SCENARIOS TO CONSIDER?
Are there areas of the City that staff may have missed to locate new units?
In order to ensure ongoing compliance with the Housing
Accountability Act, the City should have an inventory of sites that
includes a buffer of units beyond the 1,660 units allocated – at what
number?
DO WE PLAN FOR A 50% Buffer?
If areas must be rezoned to accommodate new growth, is it better to increase density in existing areas like the downtown, expand into areas not previously zoned for greater densities,
or a combination of both?
DO WE WANT TO PLAN FOR BUILDING UP OR OUT?
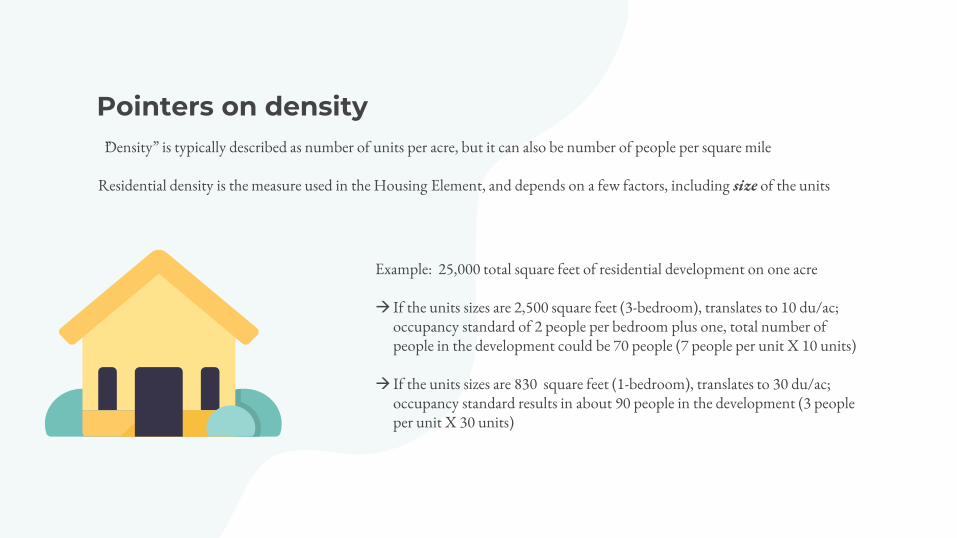
Pointers on density“Density” is typically described as number of units per acre, but it can also be number of people per square mile
Residential density is the measure used in the Housing Element, and depends on a few factors, including size of the units
Example: 25,000 total square feet of residential development on one acre
→ If the units sizes are 2,500 square feet (3-bedroom), translates to 10 du/ac; occupancy standard of 2 people per bedroom plus one, total number of people in the development could be 70 people (7 people per unit X 10 units)
→ If the units sizes are 830 square feet (1-bedroom), translates to 30 du/ac; occupancy standard results in about 90 people in the development (3 people per unit X 30 units)
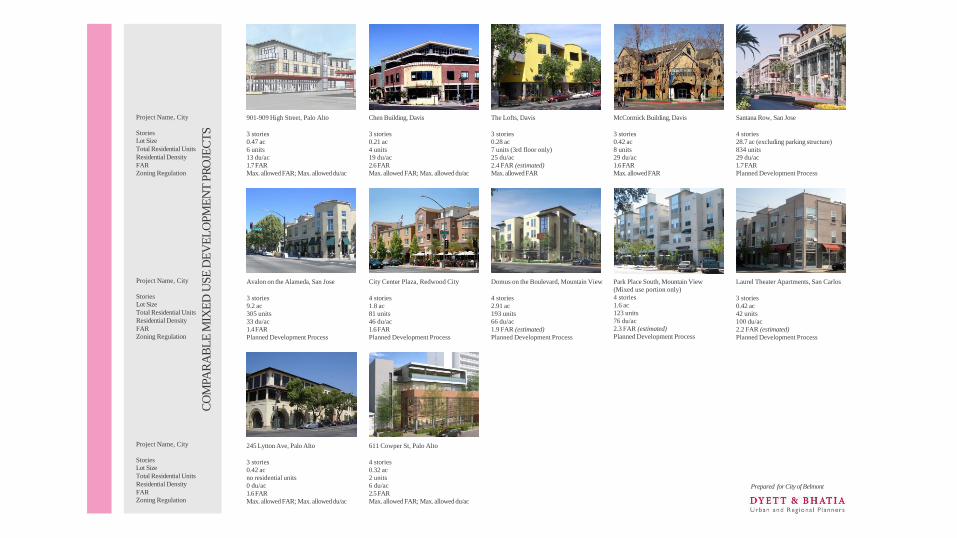
901-909 High Street, Palo Alto Chen Building, Davis The Lofts, Davis McCormick Building, Davis Santana Row, San Jose
3 stories
0.47 ac
6 units
13 du/ac
1.7 FAR
Max. allowed FAR; Max. allowed du/ac
3 stories
0.21 ac
4 units
19 du/ac
2.6 FAR
Max. allowed FAR; Max. allowed du/ac
3 stories
0.28 ac
7 units (3rd floor only)
25 du/ac
2.4 FAR (estimated)
Max. allowed FAR
3 stories
0.42 ac
8 units
29 du/ac
1.6 FAR
Max. allowed FAR
4 stories
28.7 ac (excluding parking structure)
834 units
29 du/ac
1.7 FAR
Planned Development Process
Avalon on the Alameda, San Jose City Center Plaza, Redwood City Domus on the Boulevard, Mountain View Park Place South, Mountain View
(Mixed use portion only)
4 stories
1.6 ac
123 units
76 du/ac
2.3 FAR (estimated)
Planned Development Process
Laurel Theater Apartments, San Carlos
3 stories
9.2 ac
305 units
33 du/ac
1.4 FAR
Planned Development Process
4 stories
1.8 ac
81 units
46 du/ac
1.6 FAR
Planned Development Process
4 stories
2.91 ac
193 units
66 du/ac
1.9 FAR (estimated)
Planned Development Process
3 stories
0.42 ac
42 units
100 du/ac
2.2 FAR (estimated)
Planned Development Process
245 Lytton Ave, Palo Alto 611 Cowper St, Palo Alto
3 stories
0.42 ac
no residential units
0 du/ac
1.6 FAR
Max. allowed FAR; Max. allowed du/ac
4 stories
0.32 ac
2 units
6 du/ac
2.5 FAR
Max. allowed FAR; Max. allowed du/ac
Prepared for City of Belmont
CO
MPA
RA
BL
EM
IXE
DU
SE
DE
VE
LO
PM
EN
TP
RO
JEC
TS
Project Name, City
Stories
Lot Size
Total Residential Units
Residential Density
FAR
Zoning Regulation
Project Name, City
Stories
Lot Size
Total Residential Units
Residential Density
FAR
Zoning Regulation
Project Name, City
Stories
Lot Size
Total Residential Units
Residential Density
FAR
Zoning Regulation
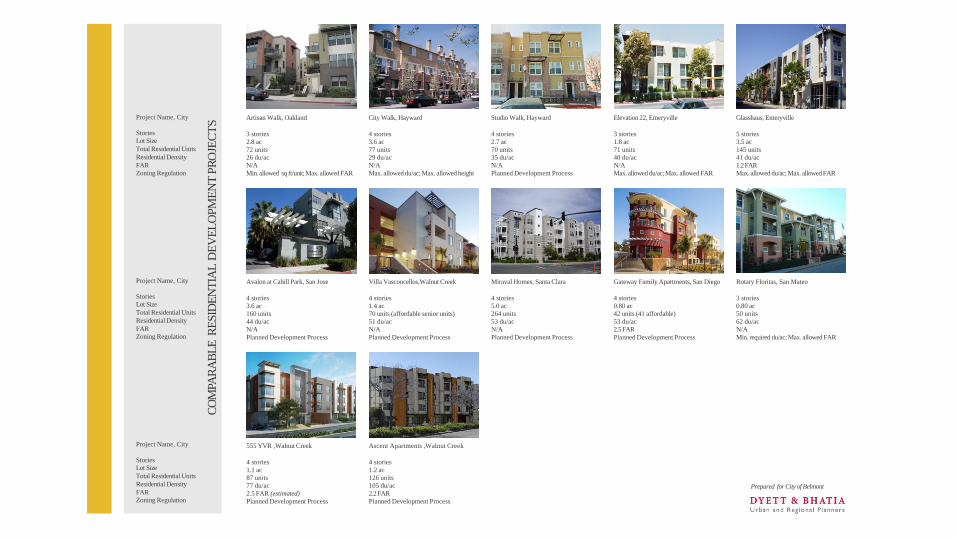
Artisan Walk, Oakland City Walk, Hayward Studio Walk, Hayward Elevation 22, Emeryville Glasshaus, Emeryville
3 stories
2.8 ac
72 units
26 du/ac
N/A
Min. allowed sq ft/unit; Max. allowed FAR
4 stories
3.6 ac
77 units
29 du/ac
N/A
Max. allowed du/ac; Max. allowed height
4 stories
2.7 ac
70 units
35 du/ac
N/A
Planned Development Process
3 stories
1.8 ac
71 units
40 du/ac
N/A
Max. allowed du/ac; Max. allowed FAR
5 stories
3.5 ac
145 units
41 du/ac
1.2 FAR
Max. allowed du/ac; Max. allowed FAR
Avalon at Cahill Park, San Jose Villa Vasconcellos,Walnut Creek Miraval Homes, Santa Clara Gateway Family Apartments, San Diego Rotary Floritas, San Mateo
4 stories
3.6 ac
160 units
44 du/ac
N/A
Planned Development Process
4 stories
1.4 ac
70 units (affordable senior units)
51 du/ac
N/A
Planned Development Process
4 stories
5.0 ac
264 units
53 du/ac
N/A
Planned Development Process
4 stories
0.80 ac
42 units (41 affordable)
53 du/ac
2.5 FAR
Planned Development Process
3 stories
0.80 ac
50 units
62 du/ac
N/A
Min. required du/ac; Max. allowed FAR
555 YVR ,Walnut Creek Ascent Apartments ,Walnut Creek
4 stories
1.1 ac
87 units
77 du/ac
2.5 FAR (estimated)
Planned Development Process
4 stories
1.2 ac
126 units
105 du/ac
2.2 FAR
Planned Development Process
Prepared for City of Belmont
CO
MPA
RA
BL
ER
ESID
EN
TIA
LD
EV
EL
OP
ME
NT
PR
OJE
CT
S
Project Name, City
Stories
Lot Size
Total Residential Units
Residential Density
FAR
Zoning Regulation
Project Name, City
Stories
Lot Size
Total Residential Units
Residential Density
FAR
Zoning Regulation
Project Name, City
Stories
Lot Size
Total Residential Units
Residential Density
FAR
Zoning Regulation
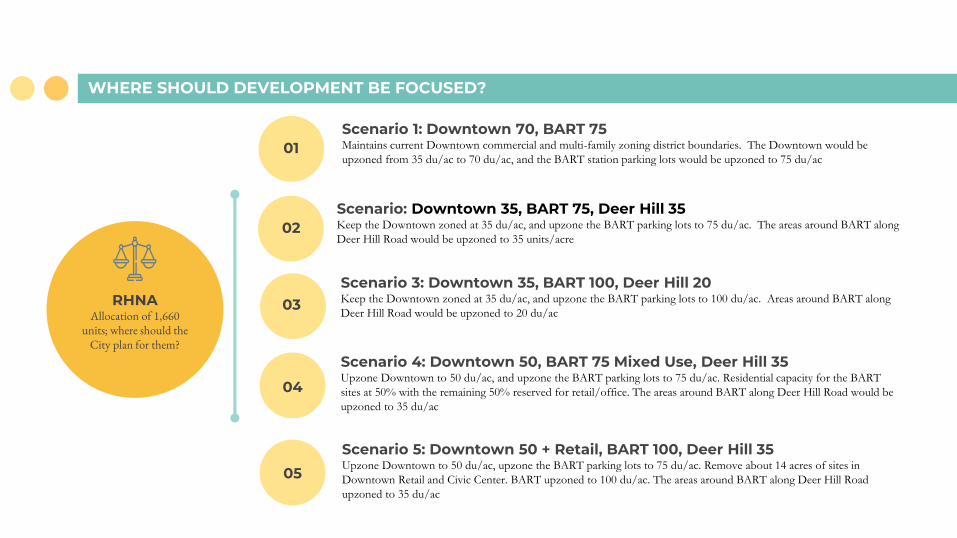
WHERE SHOULD DEVELOPMENT BE FOCUSED?
RHNAAllocation of 1,660
units; where should the City plan for them?
Scenario 1: Downtown 70, BART 75Maintains current Downtown commercial and multi-family zoning district boundaries. The Downtown would be
upzoned from 35 du/ac to 70 du/ac, and the BART station parking lots would be upzoned to 75 du/ac
Scenario: Downtown 35, BART 75, Deer Hill 35Keep the Downtown zoned at 35 du/ac, and upzone the BART parking lots to 75 du/ac. The areas around BART along
Deer Hill Road would be upzoned to 35 units/acre
01
02
Scenario 3: Downtown 35, BART 100, Deer Hill 20Keep the Downtown zoned at 35 du/ac, and upzone the BART parking lots to 100 du/ac. Areas around BART along
Deer Hill Road would be upzoned to 20 du/ac
Scenario 4: Downtown 50, BART 75 Mixed Use, Deer Hill 35Upzone Downtown to 50 du/ac, and upzone the BART parking lots to 75 du/ac. Residential capacity for the BART
sites at 50% with the remaining 50% reserved for retail/office. The areas around BART along Deer Hill Road would be
upzoned to 35 du/ac
03
04
05
Scenario 5: Downtown 50 + Retail, BART 100, Deer Hill 35Upzone Downtown to 50 du/ac, upzone the BART parking lots to 75 du/ac. Remove about 14 acres of sites in
Downtown Retail and Civic Center. BART upzoned to 100 du/ac. The areas around BART along Deer Hill Road
upzoned to 35 du/ac
map
RECOMMENDATION
Provide direction to staff:
1. Are the scenarios identified appropriate?
2. Are there other scenarios that should be studied?
3. Should we proceed with the background work and
CEQA analysis for the presented scenarios?

CREDITS: This presentation template was created by Slidesgo, including icons by Flaticon, and infographics & images by Freepik.
Please keep this slide for attribution.
QUESTIONS?