housing: issues and challenges for financial counselors · 3 u.s. real estate trends u.s. real...
TRANSCRIPT

Housing: Issues and Challenges for Financial
Counselors������
Marceline White���Maryland Consumer Rights
Coalition���May 15, 2014
Goals for the Session���* Review current foreclosure status and economic impact���
* Post-foreclosure and financial recovery ���
* Issues in post-foreclosure ���* Affordable rental market���* Buying a home in the new
marketplace
Foreclosures: Current Status

1 Home 2 > 3 U.S. Real Estate Trends
U.S. REAL ESTATE TRENDS & MARKET INFO
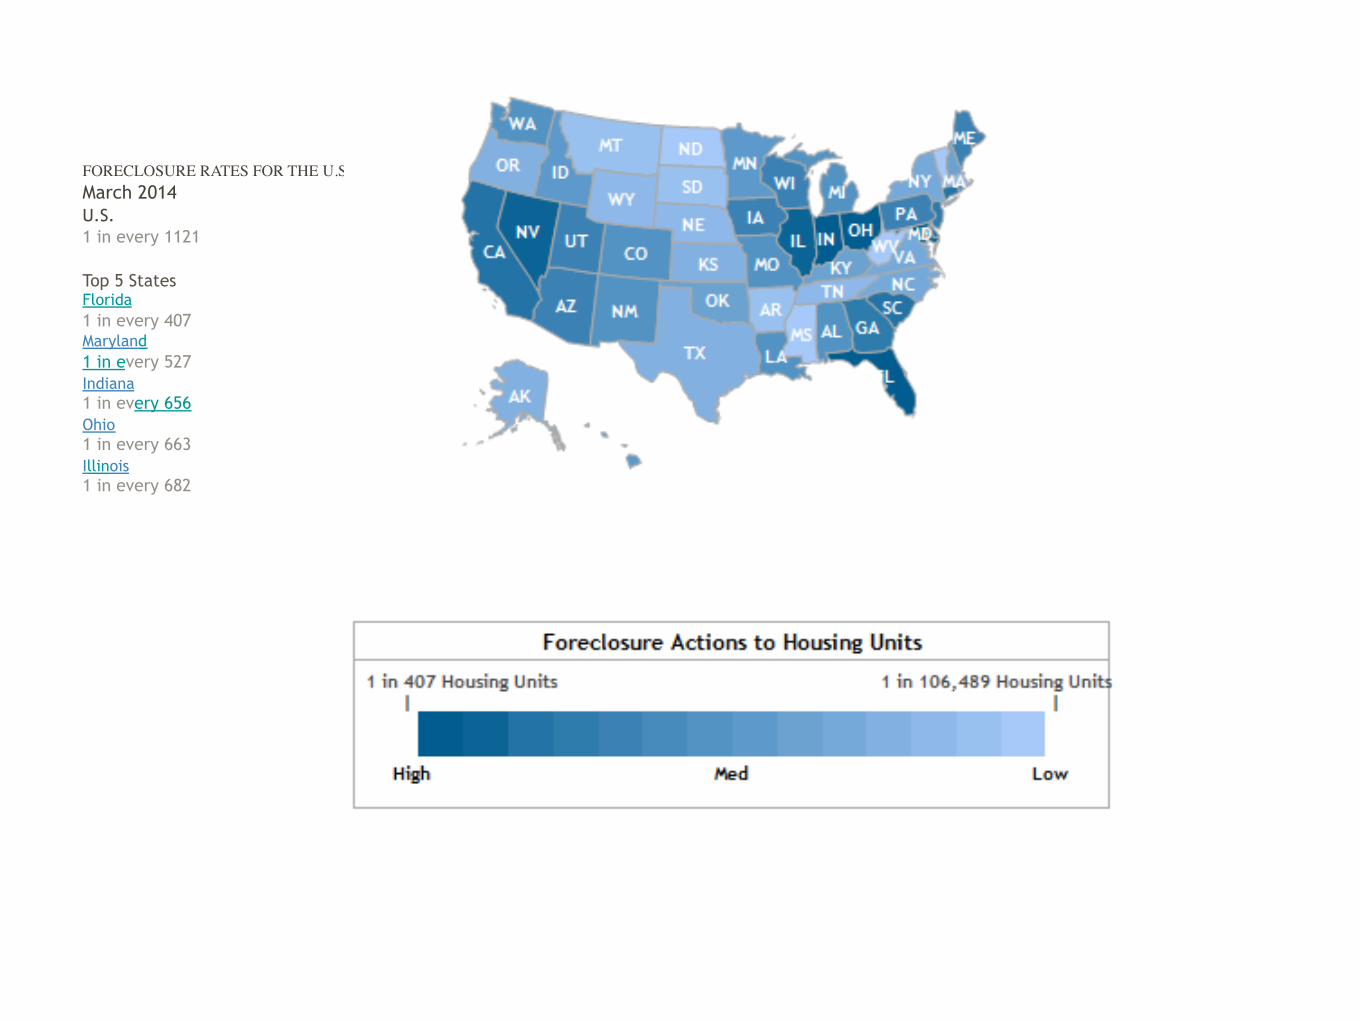
• Summary Market Trends Foreclosure Trends FORECLOSURE RATES FOR THE U.S. March 2014
U.S.
1 in every 1121
Top 5 States Florida 1 in every 407
Maryland 1 in every 527
Indiana 1 in every 656
Ohio 1 in every 663
Illinois 1 in every 682
Add this map to your website. VT NH MA RI CT NJ DE MD DC
FORECLOSURE STATUS DISTRIBUTION FOR THE U.S. March 2014 The current distribution of foreclosures based on the number of active foreclosure homes in the U.S. Pre Foreclosures
Prior Month Prior Year
10.2 %
24.6 %
Auction
Prior Month Prior Year
6.2 %
13.5 %
Bank Owned
Prior Month Prior Year
4.8 %
33.8 %
Add this chart to your website.
Interested in more detailed data or historic trends back to 2005? RealtyTrac can supply you with this data through reports or a data license. Contact us now!
FORECLOSURE FILINGS FOR THE U.S. The number of new foreclosure filings by foreclosure type. Pre Foreclosures
Prior Month Prior Year
10.2 %
24.6 %
Auction
Prior Month Prior Year
6.2 %
13.5 %
Bank Owned
Prior Month Prior Year
4.8 %
33.8 %
Add this chart to your website.
FORECLOSURE ACTIVITY FOR THE U.S. The number of new foreclosure filings compared to the 30-year interest rate. Foreclosure Activity
Foreclosure Activity and 30 Year Interest Rate.
Add this chart to your website.
<A HREF="http://adclick.g.doubleclick.net/aclk?sa=L&ai=BdpM9CgJ0U_rYHLDS0AHk74GwCOf99IsFAAAAEAEgsfHmEzgAWM-
qtOS6AWDJhoWJiKSEELIBEnd3dy5yZWFsdHl0cmFjLmNvbboBCWdmcF9pbWFnZcgBCdoBOmh0dHA6Ly93d3cucmVhbHR5dHJhYy5jb20vc3RhdHNhbmR0cmVuZHMvZm9yZWNsb3N1cmV0cmVuZHOYAognwAIC4AIA6gIeLzY1ODQ4NzkvUlRfVFJFTkRTX1JFQ1RBTkdMRV8x-AL-0R6QA-ADmAPoAqgDAeAEAaAGFg&num=0&sig=AOD64_2LN1QTIxDeiyGXp4HC2bfzpN76Rg&client=ca-pub-1024670073647094&adurl=http://ad.doubleclick.net/jump/N5755.115538.REALTYTRACINC./B7289082.108697722;sz=300x250;ord=1088010017?"> <IMG SRC="http://ad.doubleclick.net/ad/N5755.115538.REALTYTRACINC./B7289082.108697722;sz=300x250;ord=1088010017?" BORDER=0 WIDTH=300 HEIGHT=250 ALT="Advertisement"></A>
<a href="http://adclick.g.doubleclick.net/aclk%3Fsa%3DL%26ai
%3DBxNaACgJ0U_vYHLDS0AHk74GwCKex64UFAAAAEAEgsfHmEzgAWNeXsISyAWDJhoWJiKSEELIBEnd3dy5yZWFsdHl0cmFjLmNvbboBCWdmcF9pbWFnZcgBCdoBOmh0dHA6Ly93d3cucmVhbHR5dHJhYy5jb20vc3RhdHNhbmR0cmVuZHMvZm9yZWNsb3N1cmV0cmVuZHOYAr4VwAIC4AIA6gIeLzY1ODQ4NzkvUlRfVFJFTkRTX1JFQ1RBTkdMRV8y-AL-0R6QA-ADmAPoAqgDAeAEAaAGFg%26num%3D0%26sig%3DAOD64_2VaByC6swfxUsgzon2xUYauduW4Q%26client%3Dca-pub-1024670073647094%26adurl%3Dhttp://servedby.flashtalking.com/click/4/29512;694831;647737;209;647737001/?url=4492546" target="_blank"> <img border="0" src="http://cdn.flashtalking.com/xre/image/64/647737/647737.gif">
© 1996-2014 Renwood RealtyTrac LLC. All Rights reserved | Privacy | Terms of Use
Inside RealtyTrac Find a Home | Find an Agent | My RealtyTrac | Stats & Trends | Finance Center | Real Estate Guides
For Professionals Investors | Agents | Advertisers | Partners | Data Sales | Marketing Lists | InsideTrac Login Company Info About Us | Contact Us | News Room | Subscribe
<a href="http://adclick.g.doubleclick.net/aclk%3Fsa%3DL%26ai%3DBSllMCgJ0U_zYHLDS0AHk74GwC
N-q64UFAAAAEAEgsfHmEzgAWK_q9YSyAWDJhoWJiKSEELIBEnd3dy5yZWFsdHl0cmFjLmNvbboBCWdmcF9pbWFnZcgBCdoBOmh0dHA6Ly93d3cucmVhbHR5dHJhYy5jb20vc3RhdHNhbmR0cmVuZHMvZm9yZWNsb3N1cmV0cmVuZHOYAr4VwAIC4AIA6gIeLzY1ODQ4NzkvUlRfVFJFTkRTX0xFQURFUkJPQVJE-AL-0R6QA-ADmAPoAqgDAeAEAaAGFg%26num%3D0%26sig%3DAOD64_3-3od2r0UW8K5P0iPhp8cL4ad1wQ%26client%3Dca-pub-1024670073647094%26adurl%3Dhttp://servedby.flashtalking.com/click/4/29512;694832;647738;209;647738001/?url=4492548" target="_blank"> <img border="0" src="http://cdn.flashtalking.com/xre/image/64/647738/647738.gif">
• SEARCH HOMES • STATS & TRENDS ���
• FIND AN AGENT
• NEWS • MORTGAGE
• HELP • REAL ESTATE PROS ���
• ���
LOGIN
• FREE TRIAL
Stats & Trends Search a County, City or ZIP
• MY REALTYTRAC
• FREE TRIAL
• SUBSCRIBE
closure Trends FORECLOSURE RATES FOR THE U.S. March 2014
U.S.
1 in every 1121
Top 5 States Florida 1 in every 407
Maryland 1 in every 527
Indiana 1 in every 656
Ohio 1 in every 663
Illinois 1 in every 682

Policies and Foreclosures National Mortgage Settlement
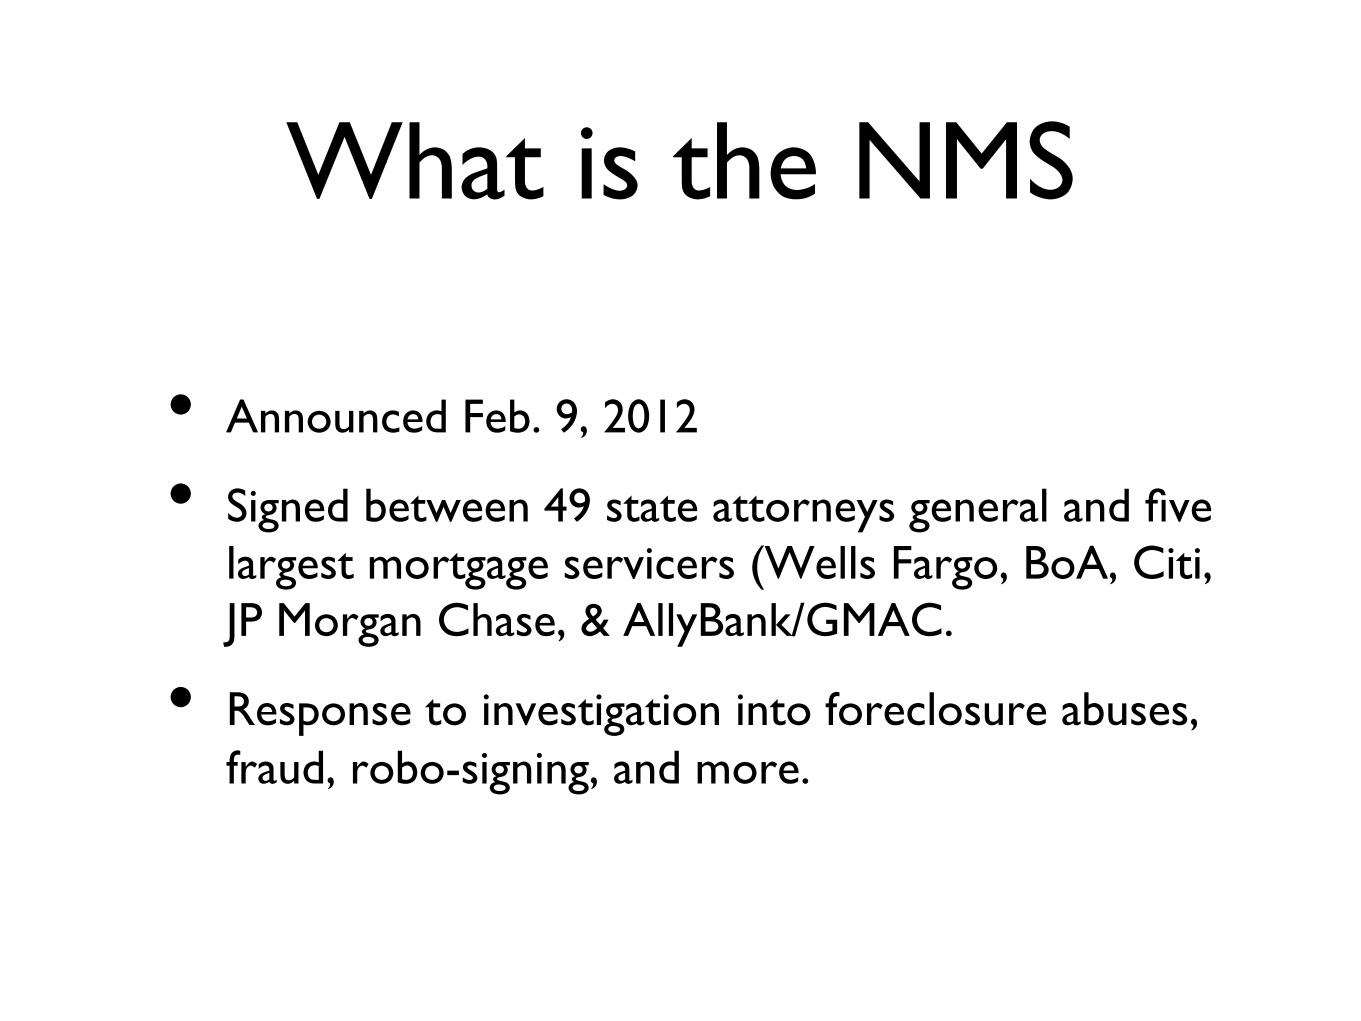
What is the NMS
• Announced Feb. 9, 2012
• Signed between 49 state attorneys general and five largest mortgage servicers (Wells Fargo, BoA, Citi, JP Morgan Chase, & AllyBank/GMAC.
• Response to investigation into foreclosure abuses, fraud, robo-signing, and more.
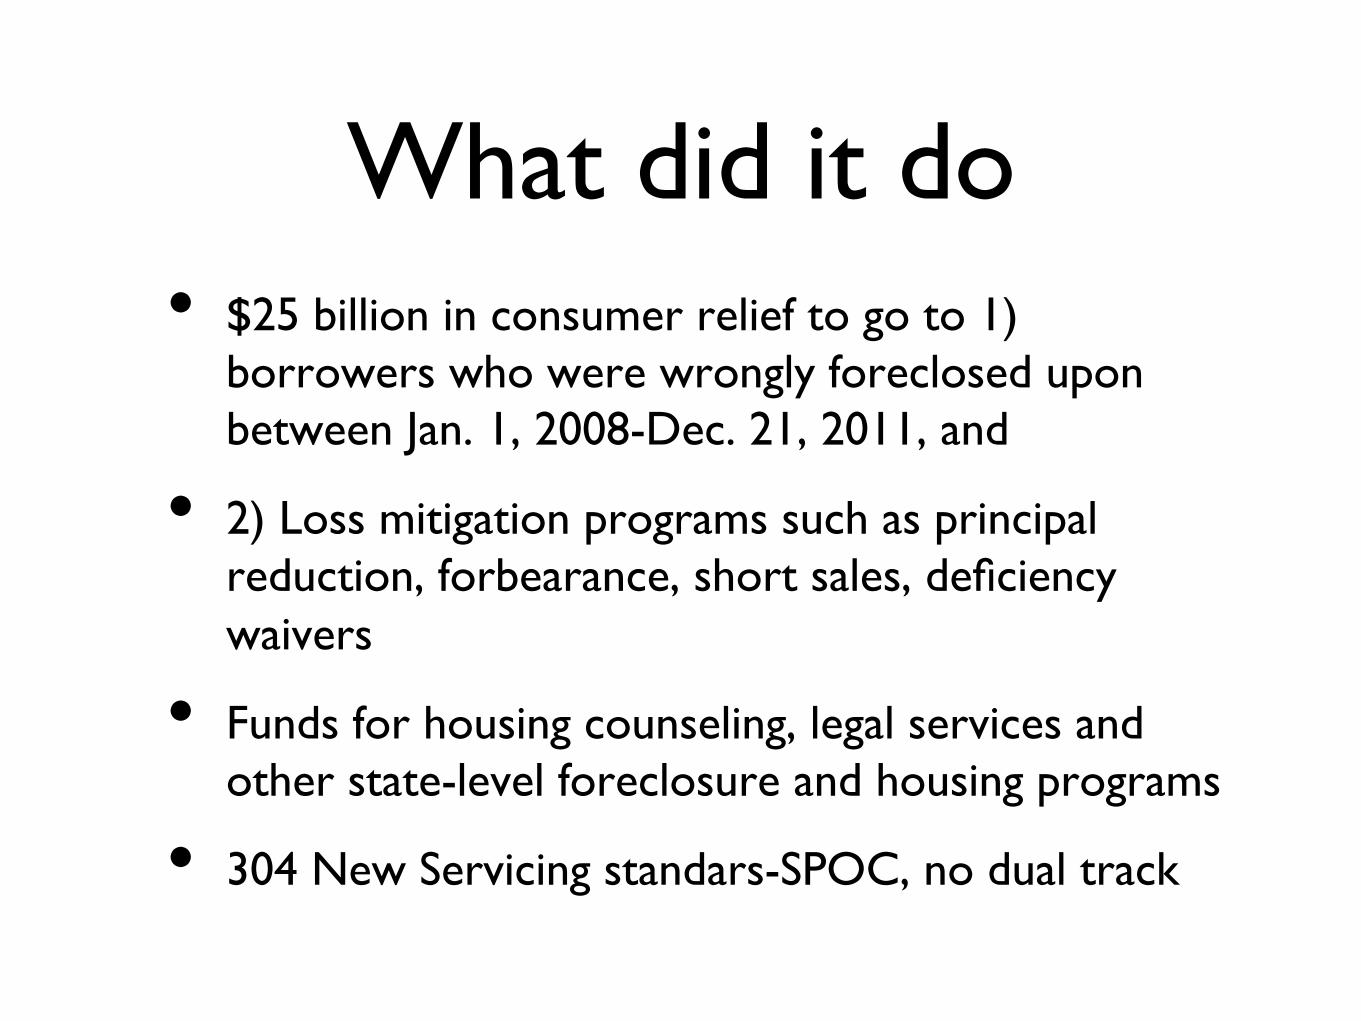
What did it do • $25 billion in consumer relief to go to 1)
borrowers who were wrongly foreclosed upon between Jan. 1, 2008-Dec. 21, 2011, and
• 2) Loss mitigation programs such as principal reduction, forbearance, short sales, deficiency waivers
• Funds for housing counseling, legal services and other state-level foreclosure and housing programs
• 304 New Servicing standars-SPOC, no dual track
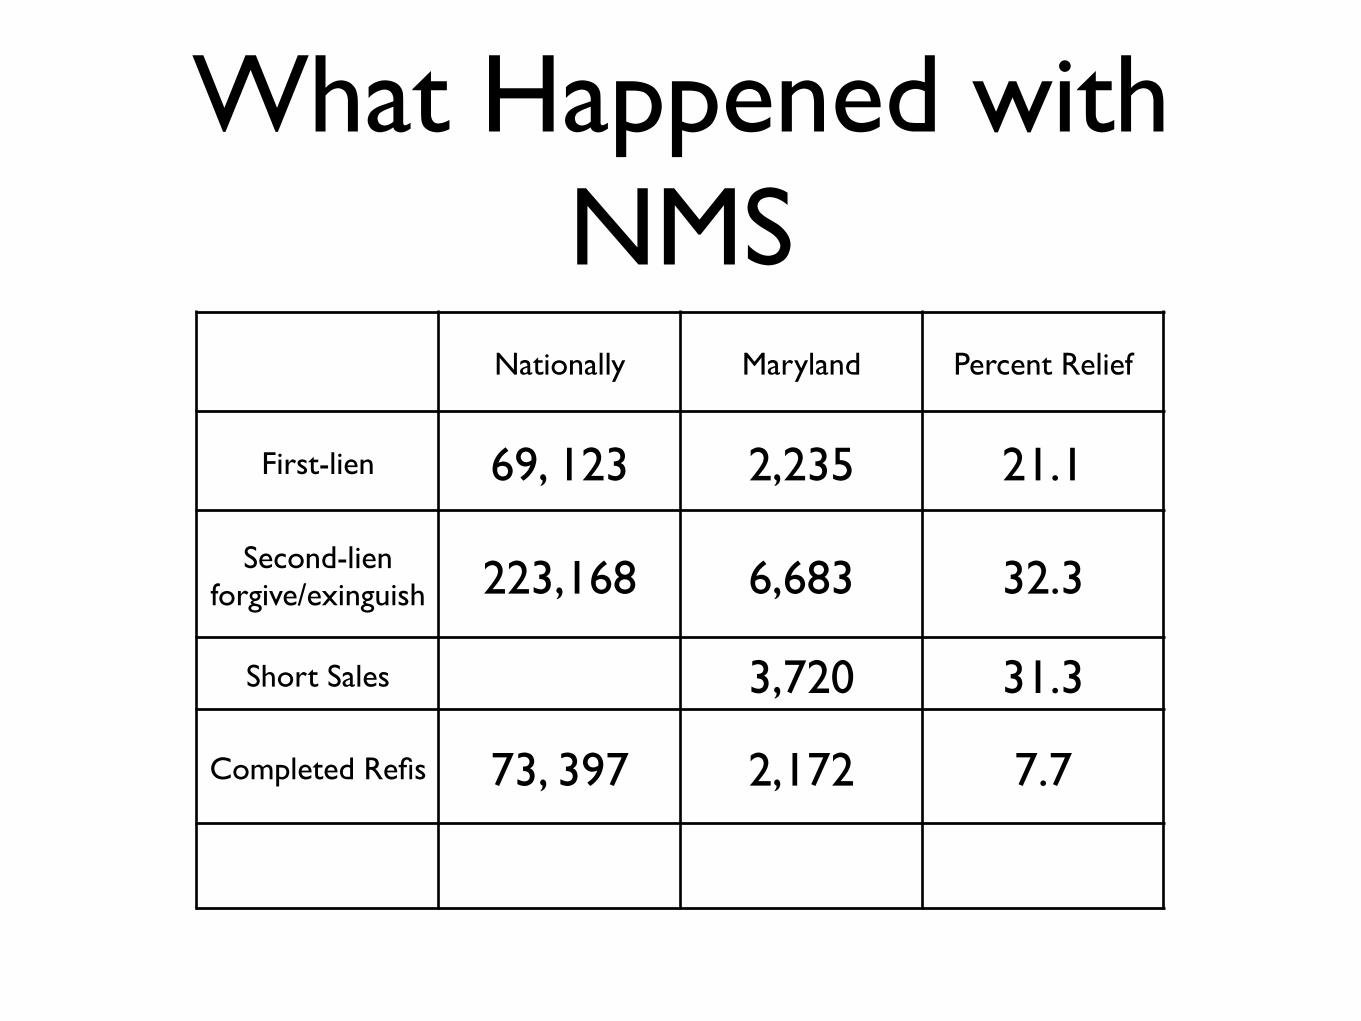
What Happened with NMS
Nationally Maryland Percent Relief
First-lien 69, 123 2,235 21.1
Second-lien forgive/exinguish 223,168 6,683 32.3
Short Sales 3,720 31.3
Completed Refis 73, 397 2,172 7.7
Economic Impacts of Foreclosure
• Equity lost-$5.6 trillion (as of 2011)
• Property Value-$502 billion due to nearby foreclosures
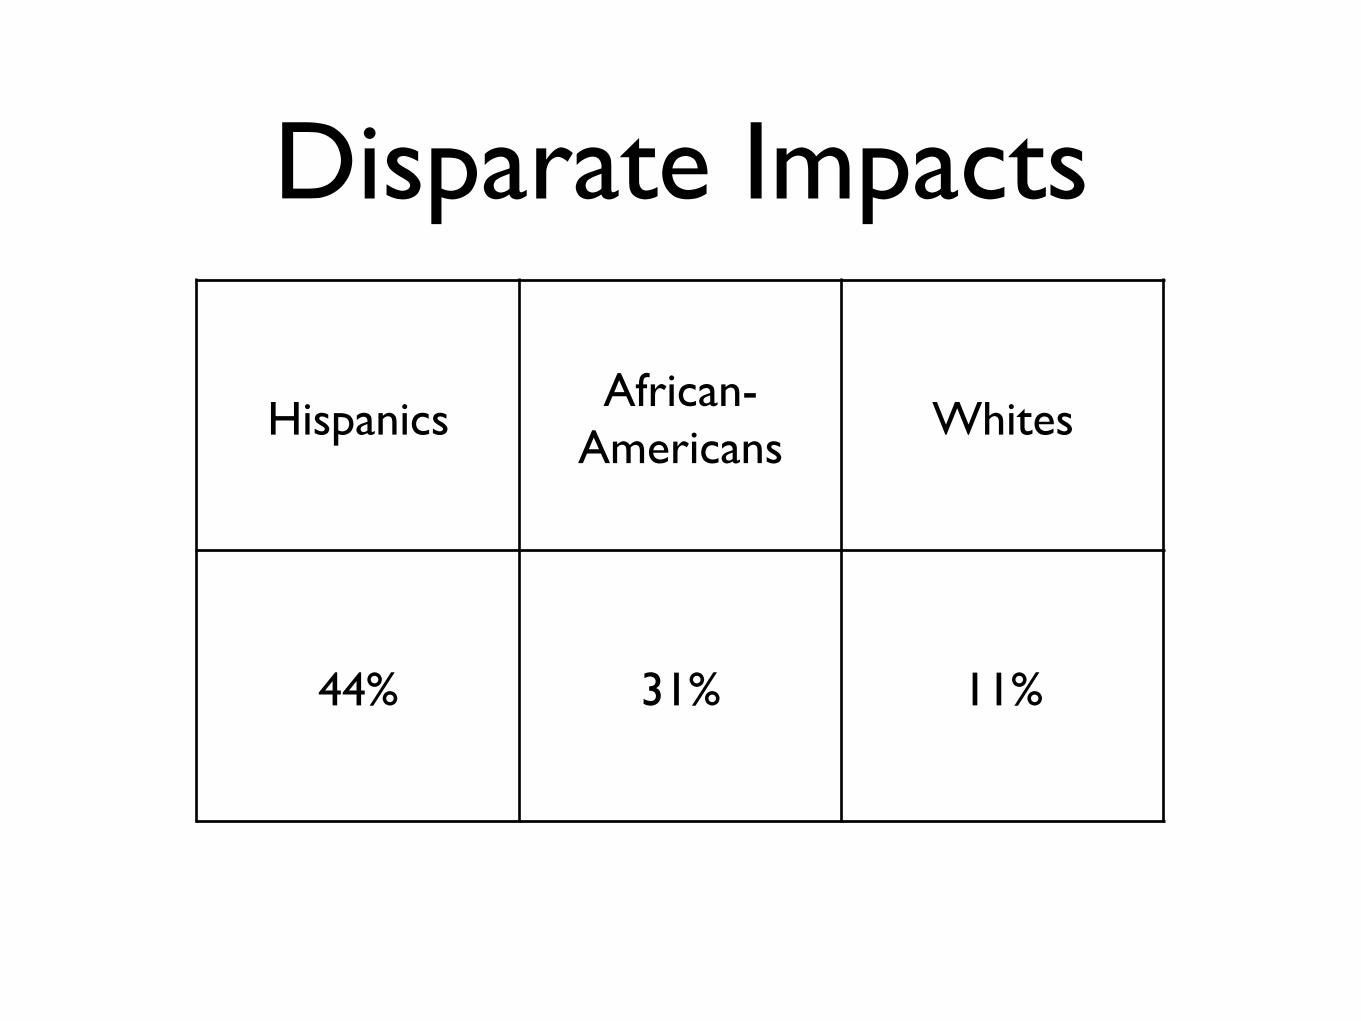
Disparate Impacts
Hispanics African-
Americans Whites
44% 31% 11%
Financial Counseling Issues
• Avoid Redefault-financial education, planning
• Deficiency judgements
• Debt relief

Housing Debt
Housing Debt: Case Study
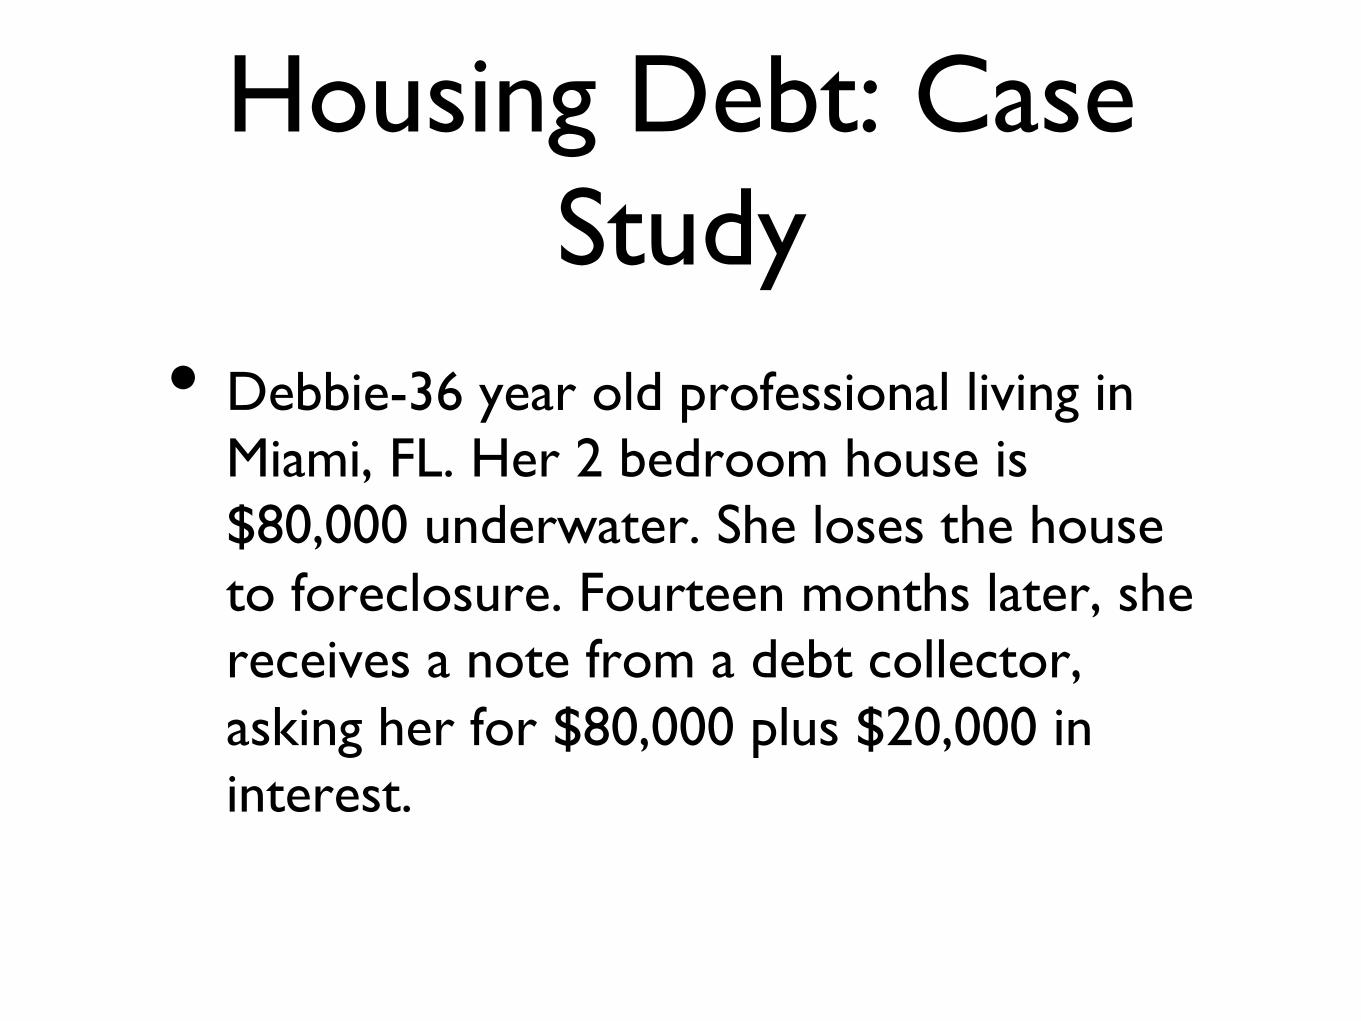
Housing Debt: Case Study
• Debbie-36 year old professional living in Miami, FL. Her 2 bedroom house is $80,000 underwater. She loses the house to foreclosure. Fourteen months later, she receives a note from a debt collector, asking her for $80,000 plus $20,000 in interest.

Housing Debt: Case Study
• Diane is a 36 year old professional who lives in Miami. She is $60,000 underwater but she negotiates a short-sale with the lender. The lender agrees to forgive the $60,000 in negative equity and sends her a letter and tax form stating this.
• Who is better off? And Why?
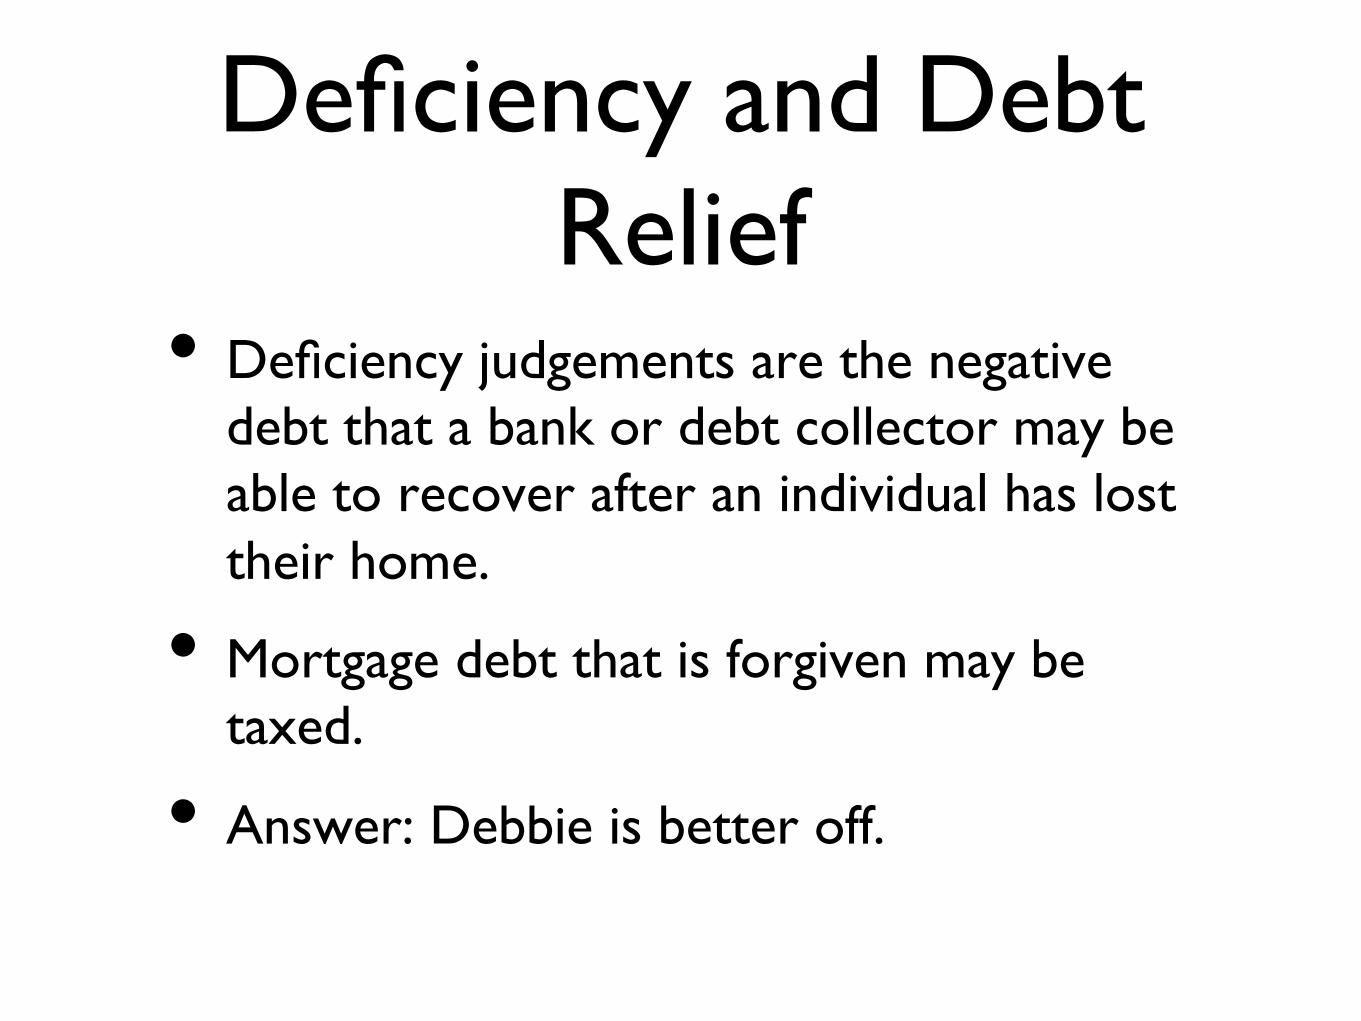
Deficiency and Debt Relief
• Deficiency judgements are the negative debt that a bank or debt collector may be able to recover after an individual has lost their home.
• Mortgage debt that is forgiven may be taxed.
• Answer: Debbie is better off.
Other issues
• Post-foreclosure credit recovery and financial planning
• Alternative credit scoring outside of FICO
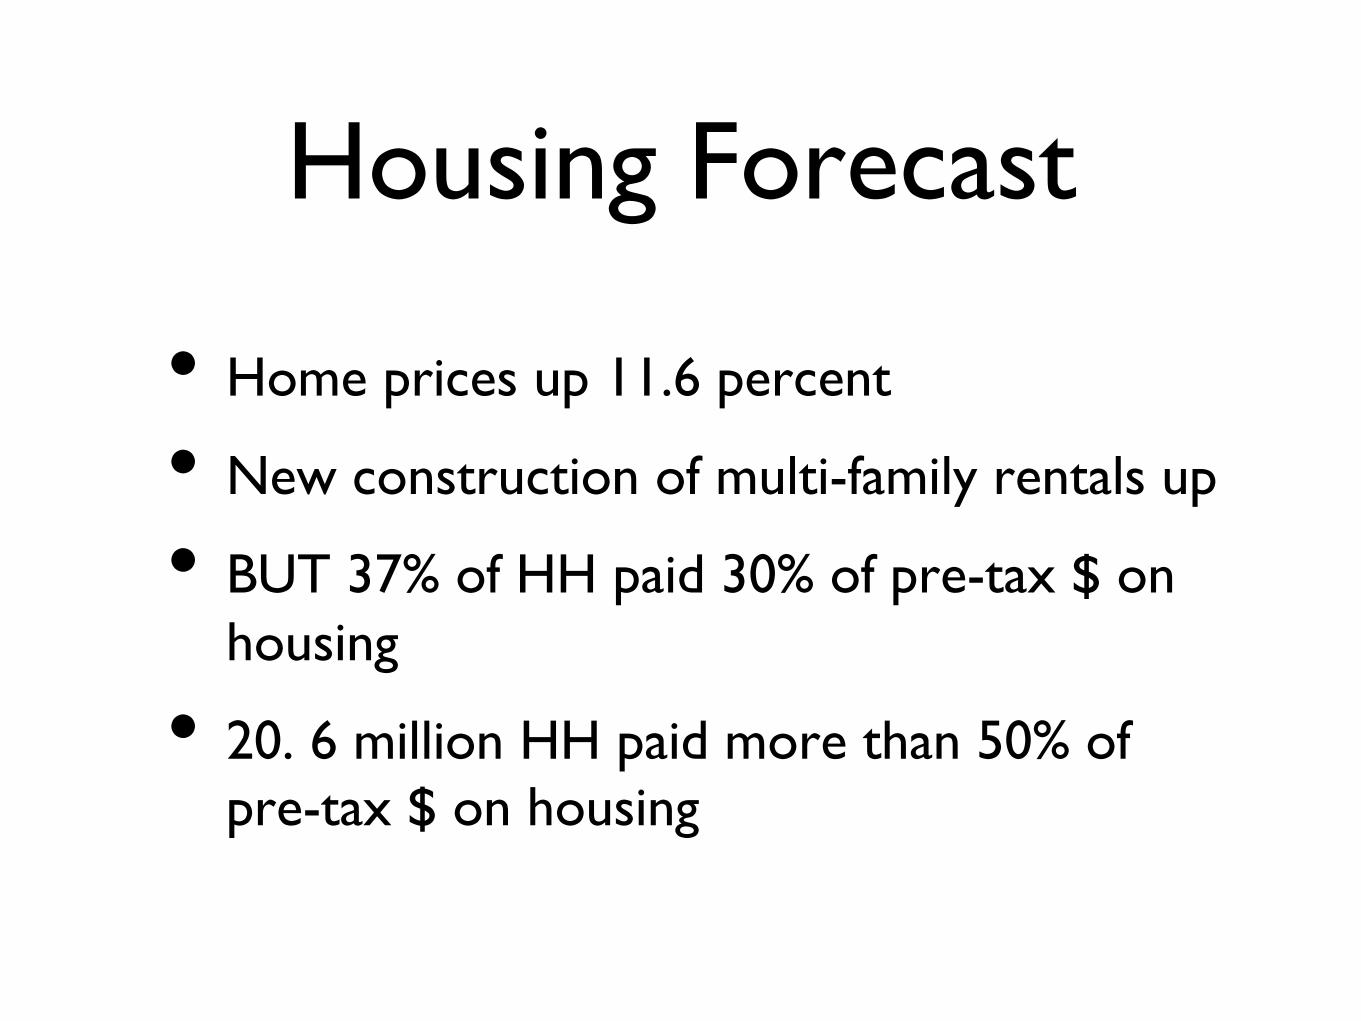
Housing Forecast
• Home prices up 11.6 percent
• New construction of multi-family rentals up
• BUT 37% of HH paid 30% of pre-tax $ on housing
• 20. 6 million HH paid more than 50% of pre-tax $ on housing
Tapping Equity
• Reverse Mortgages
• Small loans

Pro-Tips for counselors
• Counsel on reverse mortgages and small loans-CFPB resource
• look at mixed use development and TOD
• ways to build credit and savings
Housing Scams
• Loan Modifications
• Foreclosure Rescue
• Home Improvement

Thank You
• Marceli

Thank You. ������
Marceline White, Executive Director���Maryland Consumer Rights Coalition���
e: [email protected]���Ph: 410-624-8981���
www.marylandconsumers.org���www.facebook/marylandconsumers���
���

How Did It Work

1 Home 2 > 3 U.S. Real Estate Trends
U.S. REAL ESTATE TRENDS & MARKET INFO
• Summary Market Trends Foreclosure Trends FORECLOSURE RATES FOR THE U.S. March 2014
U.S.
1 in every 1121
Top 5 States Florida 1 in every 407
Maryland 1 in every 527
Indiana 1 in every 656
Ohio 1 in every 663
Illinois 1 in every 682
Add this map to your website. VT NH MA RI CT NJ DE MD DC
FORECLOSURE STATUS DISTRIBUTION FOR THE U.S. March 2014 The current distribution of foreclosures based on the number of active foreclosure homes in the U.S. Pre Foreclosures
Prior Month Prior Year
10.2 %
24.6 %
Auction
Prior Month Prior Year
6.2 %
13.5 %
Bank Owned
Prior Month Prior Year
4.8 %
33.8 %
Add this chart to your website.
Interested in more detailed data or historic trends back to 2005? RealtyTrac can supply you with this data through reports or a data license. Contact us now!
FORECLOSURE FILINGS FOR THE U.S. The number of new foreclosure filings by foreclosure type. Pre Foreclosures
Prior Month Prior Year
10.2 %
24.6 %
Auction
Prior Month Prior Year
6.2 %
13.5 %
Bank Owned
Prior Month Prior Year
4.8 %
33.8 %
Add this chart to your website.
FORECLOSURE ACTIVITY FOR THE U.S. The number of new foreclosure filings compared to the 30-year interest rate. Foreclosure Activity
Foreclosure Activity and 30 Year Interest Rate.
Add this chart to your website.
<A HREF="http://adclick.g.doubleclick.net/aclk?sa=L&ai=BdpM9CgJ0U_rYHLDS0AHk74GwCOf99IsFAAAAEAEgsfHmEzgAWM-
qtOS6AWDJhoWJiKSEELIBEnd3dy5yZWFsdHl0cmFjLmNvbboBCWdmcF9pbWFnZcgBCdoBOmh0dHA6Ly93d3cucmVhbHR5dHJhYy5jb20vc3RhdHNhbmR0cmVuZHMvZm9yZWNsb3N1cmV0cmVuZHOYAognwAIC4AIA6gIeLzY1ODQ4NzkvUlRfVFJFTkRTX1JFQ1RBTkdMRV8x-AL-0R6QA-ADmAPoAqgDAeAEAaAGFg&num=0&sig=AOD64_2LN1QTIxDeiyGXp4HC2bfzpN76Rg&client=ca-pub-1024670073647094&adurl=http://ad.doubleclick.net/jump/N5755.115538.REALTYTRACINC./B7289082.108697722;sz=300x250;ord=1088010017?"> <IMG SRC="http://ad.doubleclick.net/ad/N5755.115538.REALTYTRACINC./B7289082.108697722;sz=300x250;ord=1088010017?" BORDER=0 WIDTH=300 HEIGHT=250 ALT="Advertisement"></A>
<a href="http://adclick.g.doubleclick.net/aclk%3Fsa%3DL%26ai
%3DBxNaACgJ0U_vYHLDS0AHk74GwCKex64UFAAAAEAEgsfHmEzgAWNeXsISyAWDJhoWJiKSEELIBEnd3dy5yZWFsdHl0cmFjLmNvbboBCWdmcF9pbWFnZcgBCdoBOmh0dHA6Ly93d3cucmVhbHR5dHJhYy5jb20vc3RhdHNhbmR0cmVuZHMvZm9yZWNsb3N1cmV0cmVuZHOYAr4VwAIC4AIA6gIeLzY1ODQ4NzkvUlRfVFJFTkRTX1JFQ1RBTkdMRV8y-AL-0R6QA-ADmAPoAqgDAeAEAaAGFg%26num%3D0%26sig%3DAOD64_2VaByC6swfxUsgzon2xUYauduW4Q%26client%3Dca-pub-1024670073647094%26adurl%3Dhttp://servedby.flashtalking.com/click/4/29512;694831;647737;209;647737001/?url=4492546" target="_blank"> <img border="0" src="http://cdn.flashtalking.com/xre/image/64/647737/647737.gif">
© 1996-2014 Renwood RealtyTrac LLC. All Rights reserved | Privacy | Terms of Use
Inside RealtyTrac Find a Home | Find an Agent | My RealtyTrac | Stats & Trends | Finance Center | Real Estate Guides
For Professionals Investors | Agents | Advertisers | Partners | Data Sales | Marketing Lists | InsideTrac Login Company Info About Us | Contact Us | News Room | Subscribe
<a href="http://adclick.g.doubleclick.net/aclk%3Fsa%3DL%26ai%3DBSllMCgJ0U_zYHLDS0AHk74GwC
N-q64UFAAAAEAEgsfHmEzgAWK_q9YSyAWDJhoWJiKSEELIBEnd3dy5yZWFsdHl0cmFjLmNvbboBCWdmcF9pbWFnZcgBCdoBOmh0dHA6Ly93d3cucmVhbHR5dHJhYy5jb20vc3RhdHNhbmR0cmVuZHMvZm9yZWNsb3N1cmV0cmVuZHOYAr4VwAIC4AIA6gIeLzY1ODQ4NzkvUlRfVFJFTkRTX0xFQURFUkJPQVJE-AL-0R6QA-ADmAPoAqgDAeAEAaAGFg%26num%3D0%26sig%3DAOD64_3-3od2r0UW8K5P0iPhp8cL4ad1wQ%26client%3Dca-pub-1024670073647094%26adurl%3Dhttp://servedby.flashtalking.com/click/4/29512;694832;647738;209;647738001/?url=4492548" target="_blank"> <img border="0" src="http://cdn.flashtalking.com/xre/image/64/647738/647738.gif">
• SEARCH HOMES • STATS & TRENDS ���
• FIND AN AGENT
• NEWS • MORTGAGE
• HELP • REAL ESTATE PROS ���
• ���
LOGIN
• FREE TRIAL
Stats & Trends Search a County, City or ZIP
• MY REALTYTRAC
• FREE TRIAL
• SUBSCRIBE