housing market analysis ma-05 overview
TRANSCRIPT

Consolidated Plan CONTRA COSTA COUNTY 59
OMB Control No: 2506-0117 (exp. 06/30/2018)
HOUSING MARKET ANALYSIS
MA-05 Overview
Housing Market Analysis Overview:
Contra Costa County (CCC) encompasses several housing sub-markets in three primary
subregions - West, Central, and East. West County, which includes the city of Richmond, is
urbanized with a developed industrial base. Central County includes Concord, Walnut Creek,
and other communities. This area of the county is a developed urbanized area with extensive
office, retail, and light industrial development. Far East County was historically primarily
agricultural but has experienced considerable residential development in the last 20-25 years.
MA-10 Housing Market Analysis: Number of Housing Units - 91.410,
91.210(a)&(b)(2)
Introduction
Detached single-family homes are the predominant housing type in the County, accounting for
67 percent of all housing units. Attached single-family homes make up approximately 8
percent of housing units. Multifamily apartment units account for nearly 23 percent of the
housing stock, while the remaining 2 percent of housing units are mobile homes.
Home prices are somewhat more affordable in Contra Costa County, especially in East County,
than in most other areas in the Bay Area. However, housing affordability is still a critical issue
affecting many residents in the County. Approximately 58 percent of households under
AMI spend more than one-third of their incomes on housing costs. This level of housing
payment is considered as burdensome to households and suggests that income growth has
not kept pace with the increase in housing costs.
Detached single-family homes typically have three or more bedrooms (83%), while most
rental units have either two bedrooms (37%) or three or more bedrooms (36%).
Data below is for the entire County. Jurisdictional data is presented as well.

Consolidated Plan CONTRA COSTA COUNTY 60
OMB Control No: 2506-0117 (exp. 06/30/2018)
All residential properties by number of units
Unit Size by Tenure – County & Consortium
Owners Renters
Number % Number %
No bedroom 747 0% 5,334 4%
1 bedroom 4,430 2% 30,724 23%
2 bedrooms 37,348 15% 50,710 37%
3 or more bedrooms 206,111 83% 49,181 36%
Total 248,636 100% 135,949 100%
Describe the number and targeting (income level/type of family served) of units
assisted with federal, state, and local programs.
The County and cities continue to collaborate to expand affordable housing in communities
where such opportunities are limited. The County and many of the Consortium cities have
continued to allocate resources to encourage and facilitate the development of affordable
housing throughout the entire Consortium, resulting in the development of new affordable
housing. Additionally, provisions were made for a single-family rehabilitation program, first-
time homebuyer programs, and fair housing counseling, legal service and outreach.
Table 31 – Consortium Residential Properties by Unit Number
Table 32 – County Unit Size by Tenure
Table 33 – Consortium City Unit Size by Tenure

Consolidated Plan CONTRA COSTA COUNTY 61
OMB Control No: 2506-0117 (exp. 06/30/2018)
In addition, the County and Consortium members continue to provide CDBG financial support
for tenant/landlord services for low-income residents of the County. Lastly, the County’s
Mortgage Credit Certificate program reserves 40 percent of its allocation for households with
incomes at or below 80 percent of the area median income.
Provide an assessment of units expected to be lost from the affordable housing
inventory for any reason, such as expiration of Section 8 contracts.
Contra Costa County has affordable rental stock, which is owned by non-profit housing
developers. These owners are mission driven to maintain their units as affordable housing in
perpetuity. Therefore, even though many projects face expiring use contracts, the non-profit
owners generally restructure the financing, rehabilitate the project, and continue to provide
affordable housing.
There is a risk of affordable units converting to market rate that were financed solely with tax
exempt bonds.
Does the availability of housing units meet the needs of the population?
Census data indicate that overcrowding is not a major problem. However, these data likely do
not accurately count all individuals living in a household because it does not include
household members who have not lived at an address for at least 3 months. The count likely
missed individuals who are not on leases or are temporarily staying at an address.
There is a severe lack of affordable housing units to meet the needs of the population.
Approximately 53 percent of renters in Contra Costa are paying 30 percent or more of their
income in rent, with 44 percent of renters paying 35 percent or more of their income in rent.
More than half of all renters in Antioch, Concord, and Pittsburg spend at least 30 percent of
their income on rent as well. Approximately 47 percent of renters in Walnut Creek pay 30
percent or more of their income on rent. Pittsburg has the highest rate of cost burden with
slightly more than 60 percent of renters spending at least 30 percent of their income on rent.
Describe the need for specific types of housing:
The greatest need for housing is affordable rental apartment units. Single-family homes make
up nearly 75% of the County's housing stock. Multifamily (23%) and mobile homes (4.2%)
make up the remainder of housing units. The median home price is $582,400 (November
2019), which is not affordable to households earning less than 120% of the median income.
The median rent for a two-bedroom apartment (December 2019) is $2,250. This rent is not
affordable to households earning less than the median income.
There is also a dearth of affordable, accessible housing in a range of unit sizes, which
negatively affects people with disabilities who may need supportive services. Additionally,

Consolidated Plan CONTRA COSTA COUNTY 62
OMB Control No: 2506-0117 (exp. 06/30/2018)
there is an unmet need for supportive housing for people with psychiatric disabilities as well
as housing assistance targeted to persons with intellectual and developmental disabilities.
A third type of housing that is particularly needed is housing for low-income senior citizens.
Many senior residents are experiencing difficulties coping with rising costs and a lack of
adequate transportation.
Discussion
Strong demand and rising prices in the housing market threaten affordability and place a
financial strain on many residents. A combination of market incentives and improvements,
increased financial resources to preserve and expand the supply of affordable housing,
targeted public investments, and regulatory approaches to protect vulnerable residents will
be needed to help meet housing needs in Contra Costa. A priority should be placed on
ensuring that there is more affordable housing and more units that come in a range of sizes.
MA-15 Housing Market Analysis: Cost of Housing - 91.410, 91.210(a)
Introduction
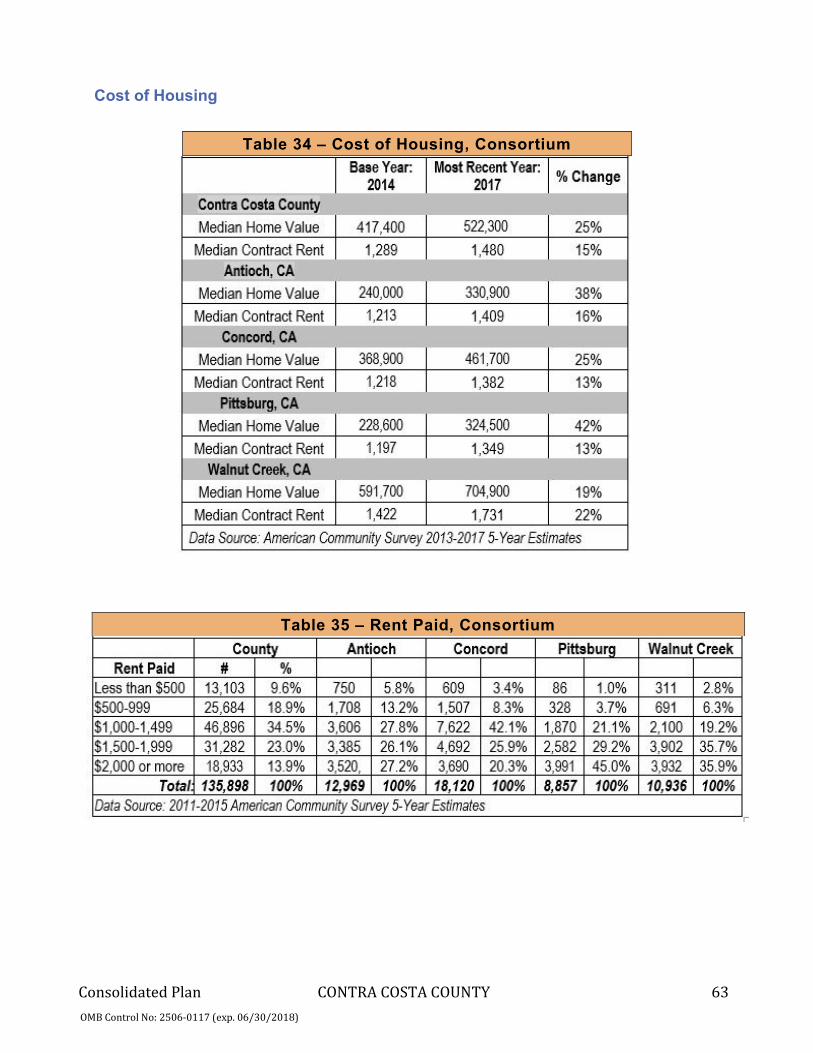
Contra Costa County, like the San Francisco Bay Area as a whole, has been experiencing an
affordable housing crisis for some time. Home prices and market rents in all areas of the
county have increased in recent years and reached all-time highs. The high cost of housing
places a severe burden on many households and contributes to residential displacement and
relocation.
According to the Urban Displacement "Rising Cost and Re-Segregration in Contra Costa
County" report, rents rose across the County between 2000 and 2015, with (inflation-
adjusted) median rent paid increasing more than 30% in parts of Brentwood, Concord,
Hercules, Pittsburg, and Richmond over the 15-year period. By 2018, the median asking rent
for a two-bedroom unit in Contra Costa County was $2,250. Per the Urban Displacement
report, a person would need to earn $43 per hour–around $90,000 annually–to afford the
median asking rent for a two-bedroom apartment in the County today.
Consolidated Plan CONTRA COSTA COUNTY 63
OMB Control No: 2506-0117 (exp. 06/30/2018)
Cost of Housing
Table 34 – Cost of Housing, Consortium
Table 35 – Rent Paid, Consortium

Consolidated Plan CONTRA COSTA COUNTY 64
OMB Control No: 2506-0117 (exp. 06/30/2018)
Housing Affordability
Monthly Rent
Table 37 – Monthly Rent
Monthly Rent ($) Efficiency
(no bedroom)
1 Bedroom 2 Bedroom 3 Bedroom 4 Bedroom
Fair Market Rent 1,397 1,693 2,109 2,902 3,558
High HOME Rent 1,390 1,491 1,791 2,060 2,279
Low HOME Rent 1,085 1,162 1,395 1,611 1,797
Data Source: HUD FMR and HOME Rents
Is there sufficient housing for households at all income levels?
There is not sufficient housing for households at all income levels. Extremely low-income and
low-income households face a substantial shortage of affordable housing. There are also
significant number of households who are cost burdened. Approximately 39 percent of all
households in Contra Costa County are cost burdened (paying more than 30% of their
income towards housing costs) while 17 percent of all households are severely cost burdened
(paying more than 50% of their income towards housing costs). Among extremely low-income
households, 80 percent are cost burdened. Among all households who make below the median
income, 51,960 households (44 percent) are cost burdened.
How is affordability of housing likely to change considering changes to home
values and/or rents?
Affordability of housing is likely to continue to decline as home values and rents continue to
increase. Market rents in Contra Costa are substantially higher than median contract rents
recorded by the American Community Survey. Median contract rent is considered actual rents
between landlords and tenants surveyed. A recent analysis by the California Housing
Partnership found that the median rent in Contra Costa in 2017 was $2,300 and that median
Table 36 – Housing Affordability by Tenure, by % of Units
Affordable to Households, Consortium

Consolidated Plan CONTRA COSTA COUNTY 65
OMB Control No: 2506-0117 (exp. 06/30/2018)
rents have increased by 25% since 2000. According to Zillow.com, the median rent in Contra
Costa is now $2.700.
In addition, the sales price for a home has increased from $473,000 in January 2014 to
$596,000 in January 2019, a 26 percent increase over 5 years. Rents and home prices in
Contra Costa remain lower than in the San Francisco Bay Area overall. However, the Bay Area
continues to experience employment and population growth and so both rents and home
values will likely continue to rise over time.
How do HOME rents / Fair Market Rent compare to Area Median Rent? How might
this impact your strategy to produce or preserve affordable housing?
The 2019 Low HOME (50% AMI) rent in Contra Costa County for a two-bedroom apartment is
$1,395. The High HOME (65% AMI) rent is $1,791. The 2019 Fair Market Rent for a two-
bedroom apartments is $2,126. The data highlights the challenges that Housing Choice
Vouchers experience in finding affordable housing, especially in high-opportunity areas, as
fair market rents are well below current market rents. Due to the high cost of construction
and the continual cuts to the CDBG and HOME programs, it may be more feasible over the next
five years to preserve existing affordable housing than to construct new affordable housing.
This approach will assist those already housed, but will not be able to assist cost burdened
households.
Discussion
Over the next five years, it will be crucial to preserve existing affordable housing, particularly
in areas undergoing gentrification and displacement and to expand the supply of affordable
housing by producing new housing units. It will be particularly important to expand the
supply of affordable housing for families in high opportunity areas where HOME rents are not
close to the market rent. Market incentives and improvements to develop new affordable
housing and increasing available county-wide financial resources for both preserving and
creating affordable housing will be important strategies.
MA-20 Housing Market Analysis: Condition of Housing - 91.410,
91.210(a)
Introduction
Maintenance and improvements of current housing stock is a key component of an overall
housing strategy. The cost to maintain existing housing is significantly less than constructing
new units. Homes, including older homes, in the more affluent areas of the County are usually
well maintained. Older homes in lower income neighborhoods often have deferred
maintenance that include items such as roof, foundation, window replacement, electrical,

Consolidated Plan CONTRA COSTA COUNTY 66
OMB Control No: 2506-0117 (exp. 06/30/2018)
plumbing, and HVAC repairs. In addition, older neighborhoods have failing infrastructure such
as sewer and water service. As more than half of the homes in the County were built before
1979, maintenance is an important issue.
Describe the jurisdiction's definition for "substandard condition" and "substandard
condition but suitable for rehabilitation:
Contra Costa uses the HUD definition of "substandard condition”: Lacks complete kitchen or
plumbing facilities." In addition, the County's owner-occupied rehabilitation program
considers code violations to be substandard housing, and incipient conditions to be
precursors to substandard housing. The definition for "substandard condition but suitable for
rehabilitation" includes repair and replacement of code violations and incipient conditions.
Homes that are not suitable for rehabilitation are those suffering from extensive damage from
fire, flood, or other structural damage that requires demolition and/or reconstruction of a
significant portion of the building.
Condition of Units
Table 38 – Condition of Units, County
Condition of Units Owner-Occupied Renter-Occupied
Number % Number %
With one selected Condition 83,000 33% 66,490 49%
With two selected Conditions 1,863 1% 7,878 6%
With three selected Conditions 98 0% 530 0%
With four selected Conditions 25 0% 4 0%
No selected Conditions 163,679 66% 61,089 45%
Total 248,665 100% 135,991 100%
Data Source: 2011 – 2015 ACS
Table 39 - Condition of Units in Consortium Cities

Consolidated Plan CONTRA COSTA COUNTY 67
OMB Control No: 2506-0117 (exp. 06/30/2018)
Year Unit Built
Table 40 – Year Unit Built, County
Year Unit Built Owner-Occupied Renter-Occupied
Number % Number %
2000 or later 35,389 14% 18,073 13%
1980-1999 69,283 28% 40,155 30%
1950-1979 117,173 47% 61,883 46%
Before 1950 26,805 11% 15,829 12%
Total 248,650 100% 135,940 101%
Data Source: 2011 – 2015 ACS
Risk of Lead-Based Paint Hazard
Table 42 – Risk of Lead-Based Paint Hazard, County
Risk of Lead-Based Paint Hazard Owner-Occupied Renter-Occupied
Number % Number %
Total Number of Units Built Before 1980 143,978 58% 77,712 57%
Housing Units build before 1980 with children present 30,782 12% 17,398 13%
Data Source: 2011-2015 ACS (Total Units) 2011-15 CHAS (Units with Children Present)
Table 41 – Year Unit Built in Consortium Cities
Table 43 – Risk of Lead-Based Paint Hazard, Consortium Cities
Consolidated Plan CONTRA COSTA COUNTY 68
OMB Control No: 2506-0117 (exp. 06/30/2018)
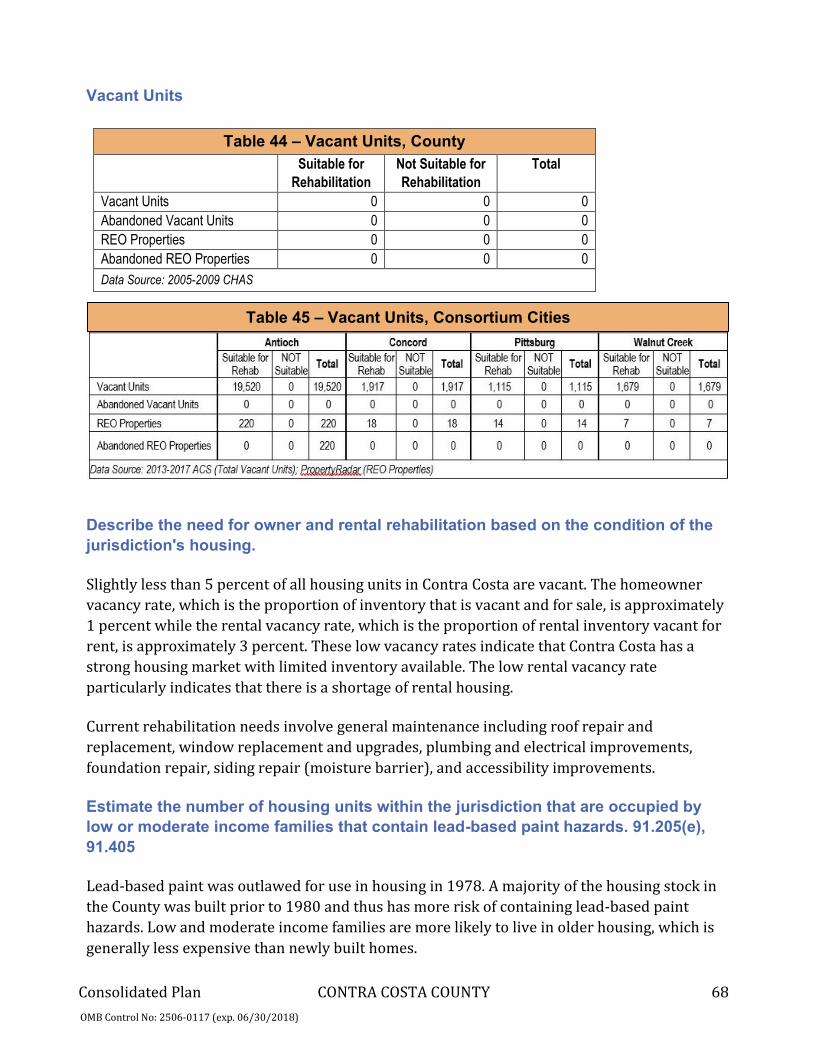
Vacant Units
Table 44 – Vacant Units, County
Suitable for
Rehabilitation
Not Suitable for
Rehabilitation
Total
Vacant Units 0 0 0
Abandoned Vacant Units 0 0 0
REO Properties 0 0 0
Abandoned REO Properties 0 0 0
Data Source: 2005-2009 CHAS
Describe the need for owner and rental rehabilitation based on the condition of the
jurisdiction's housing.
Slightly less than 5 percent of all housing units in Contra Costa are vacant. The homeowner
vacancy rate, which is the proportion of inventory that is vacant and for sale, is approximately
1 percent while the rental vacancy rate, which is the proportion of rental inventory vacant for
rent, is approximately 3 percent. These low vacancy rates indicate that Contra Costa has a
strong housing market with limited inventory available. The low rental vacancy rate
particularly indicates that there is a shortage of rental housing.
Current rehabilitation needs involve general maintenance including roof repair and
replacement, window replacement and upgrades, plumbing and electrical improvements,
foundation repair, siding repair (moisture barrier), and accessibility improvements.
Estimate the number of housing units within the jurisdiction that are occupied by
low or moderate income families that contain lead-based paint hazards. 91.205(e),
91.405
Lead-based paint was outlawed for use in housing in 1978. A majority of the housing stock in
the County was built prior to 1980 and thus has more risk of containing lead-based paint
hazards. Low and moderate income families are more likely to live in older housing, which is
generally less expensive than newly built homes.
Table 45 – Vacant Units, Consortium Cities

Consolidated Plan CONTRA COSTA COUNTY 69
OMB Control No: 2506-0117 (exp. 06/30/2018)
Based on the demographic data provided in this Consolidated Plan, approximately 39% of
HOME Consortium households (148,873 of 384,593), both renter and owner, are low-income
(at or below 80% AMI - see NA-10 above). Applying this percentage to the total number of
units (renter and owner) built before 1980 (221,690 units) results in approximately 86,459
units that may contain lead-based paint hazards occupied by low-income households.
MA-25 Public And Assisted Housing - 91.410, 91.210(b)
Introduction Three public housing authorities operate within Contra Costa County:
• The Housing Authority of Contra Costa County (HACCC), headquartered in Martinez,
CA, owns 1,091 units of public housing in 12 developments scattered throughout 9
communities in the County. The HACCC also administers approximately 9,000 units
under the Housing Choice Voucher (HCV) and Shelter Care Plus programs, and 243
other multi-family units.
• The Richmond Housing Authority (RHA), located in northwest Contra Costa County on
the San Francisco Bay, has two public housing developments, the Nystrom Village 102-
unit scattered-site development and Nevin Plaza, a 142-unit high-rise for those 60 and
older and/or individuals with disabilities.
• The Housing Authority of the City of Pittsburg (HACP), seated in north-central Contra
Costa County, manages 1,123 tenant-based HCVs and has no public housing of its own.
In the HACP jurisdiction, there are 176 public housing units administered by the
HACCC.
Totals Number of Units
Table 46 – Total Number of Units by Program Type
Program Type
Certi-
ficate
Mod-
Rehab
Public
Housing
Vouchers
Total Project
-based
Tenant
-based
Special Purpose Voucher
Veterans
Affairs
Supportive
Housing
Family
Unification
Program
Disabled
*
# of units vouchers
available 0 0 1,854 9,570 219 6,564 331 185 0
# of accessible
units
*Includes Non-Elderly Disabled, Mainstream One-Year, Mainstream Five-year, and Nursing Home Transition
Data Source: PIC (PIH Information Center)

Consolidated Plan CONTRA COSTA COUNTY 70
OMB Control No: 2506-0117 (exp. 06/30/2018)
Describe the supply of public housing developments:
Describe the number and physical condition of public housing units in the
jurisdiction, including those that are participating in an approved Public Housing
Agency Plan:
HACCC: The Housing Authority of the County of Contra Costa (HACCC) provides 1,091 public
housing units in 12 developments scattered throughout 9 communities in the County. The
properties are all in serious need of repair. The below table provides the current physical
inspection component of the REAC scores for the housing authority’s properties, which are all
out of a maximum of 40 (data provided by HACCC). The housing authority’s properties are
each inspected every year, further indicating considerable capital needs and concerns about
physical condition of the properties. Las Deltas and El Pueblo score especially lowly, according
to the below table.
RHA: The below table provides physical inspection scores from downloaded from HUD, out of
a maximum of 100. Nystrom Village and Nevin Plaza (242 total units) obtain very low scores,
indicating the need for comprehensive rehabilitation and upgrades.
Public Housing Condition
Table 47 – Public Housing Condition
Public Housing Development Average Inspection Score
Alhambra Terrace 30.4
Las Deltas 0
Las Deltas Annex 1 30.4
Elder Winds 22.8
Casa De Serena 26.4
Bayo Vista 24
Vista Del Camino 32.0
El Pueblo 23.2
Los Nogales 28.8
Richmond Hacienda 49
Richmond Village III 83
Nysytrom Village 40
Nevin Plaza 35
Richmond Village II 93
Richmond Village I 84
Describe the restoration and revitalization needs of public housing units in the
jurisdiction:

Consolidated Plan CONTRA COSTA COUNTY 71
OMB Control No: 2506-0117 (exp. 06/30/2018)
HACCC: In 2014, HACCC identified over $54 million dollars in immediate capital needs for the
properties and that number has only grown considering the housing authority only gets
approximately $2.9 million dollars per year for capital improvements.
RHA: All units are in need of comprehensive rehabilitation and upgrades.
Describe the public housing agency's strategy for improving the living environment
of low- and moderate-income families residing in public housing:
HACCC: HACCC has begun a long-term project to reposition and rehabilitate its public housing
portfolio in the face of ever-decreasing federal, state and local funding. The planning portion
of this process is expected to be completed this year and implementation has actually begun
on portions of the plan. As part of this process HACCC has been approved for four RAD
conversions that will remove 214 long-term vacant units at Las Deltas in North Richmond.
These units will be removed from the public housing portfolio and converted to project-based
voucher assistance that will be used to help fund construction or rehabilitation of more
affordable housing units.
Over the long term, HACCC intends to convert all public housing to project-based units via
RAD, although capacity to oversee that is not available at present.
HACCC anticipates utilizing approximately $3.0 million of HUD funding for a variety of
modernization improvements at all its public housing developments. Specific improvements
include:
• $1,183,000 for demolition of Las Deltas CA006/9A public housing site in North
Richmond.
• $1,131,000 for relocation costs during the RAD disposition of Las Deltas in North
Richmond.
• $245,000 for unscheduled and emergency unit modernization and site improvements
at various properties.
• $136,000 for non-routine maintenance repairs (ordinary maintenance items such as
window and flooring replacement or electrical repair where the scale of damage is
beyond the scope of day-to-day maintenance) at various properties.
• $134,000 for construction and rehabilitation of on-site management offices at various
properties.
• $63,000 for new appliances at various properties.
Discussion: HACCC: The HACCC is facing significant challenges in maintaining its public housing. Annually,
Capital Fund allocations (approximately $2.9 million) have not been sufficient to repair and
Consolidated Plan CONTRA COSTA COUNTY 72
OMB Control No: 2506-0117 (exp. 06/30/2018)
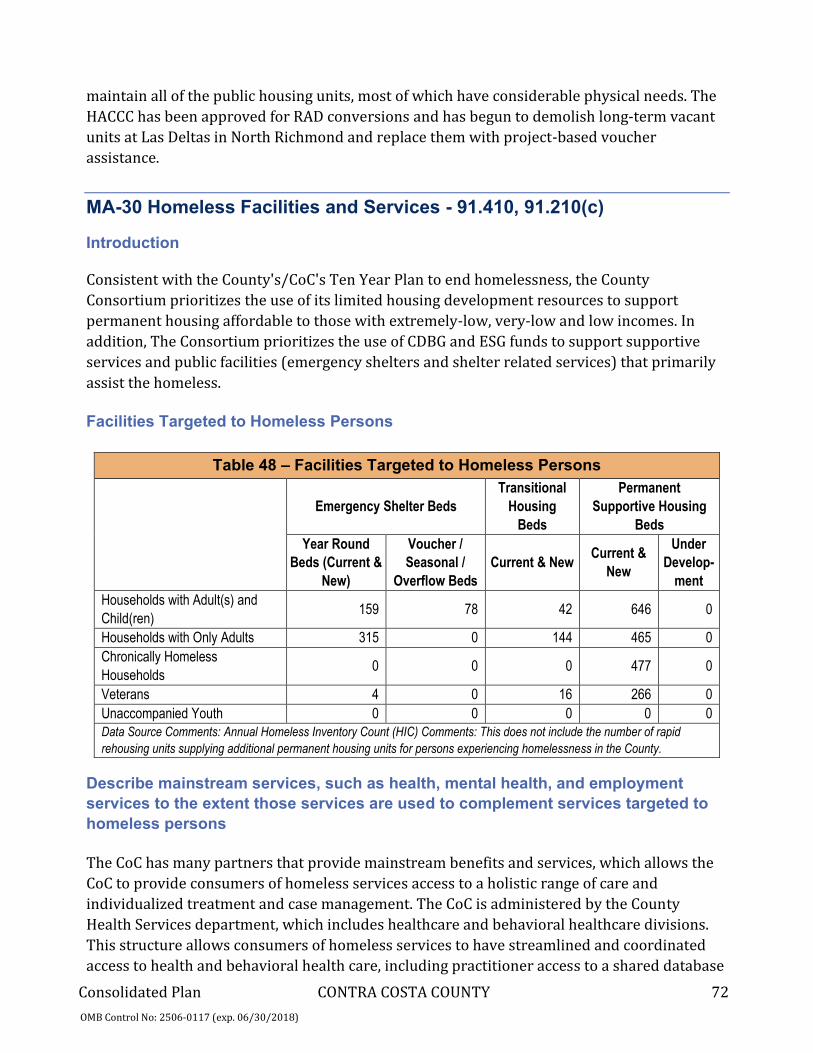
maintain all of the public housing units, most of which have considerable physical needs. The
HACCC has been approved for RAD conversions and has begun to demolish long-term vacant
units at Las Deltas in North Richmond and replace them with project-based voucher
assistance.
MA-30 Homeless Facilities and Services - 91.410, 91.210(c)
Introduction
Consistent with the County's/CoC's Ten Year Plan to end homelessness, the County
Consortium prioritizes the use of its limited housing development resources to support
permanent housing affordable to those with extremely-low, very-low and low incomes. In
addition, The Consortium prioritizes the use of CDBG and ESG funds to support supportive
services and public facilities (emergency shelters and shelter related services) that primarily
assist the homeless.
Facilities Targeted to Homeless Persons
Table 48 – Facilities Targeted to Homeless Persons
Emergency Shelter Beds
Transitional
Housing
Beds
Permanent
Supportive Housing
Beds
Year Round
Beds (Current &
New)
Voucher /
Seasonal /
Overflow Beds
Current & New Current &
New
Under
Develop-
ment
Households with Adult(s) and
Child(ren) 159 78 42 646 0
Households with Only Adults 315 0 144 465 0
Chronically Homeless
Households 0 0 0 477 0
Veterans 4 0 16 266 0
Unaccompanied Youth 0 0 0 0 0
Data Source Comments: Annual Homeless Inventory Count (HIC) Comments: This does not include the number of rapid
rehousing units supplying additional permanent housing units for persons experiencing homelessness in the County.
Describe mainstream services, such as health, mental health, and employment
services to the extent those services are used to complement services targeted to
homeless persons
The CoC has many partners that provide mainstream benefits and services, which allows the
CoC to provide consumers of homeless services access to a holistic range of care and
individualized treatment and case management. The CoC is administered by the County
Health Services department, which includes healthcare and behavioral healthcare divisions.
This structure allows consumers of homeless services to have streamlined and coordinated
access to health and behavioral health care, including practitioner access to a shared database

Consolidated Plan CONTRA COSTA COUNTY 73
OMB Control No: 2506-0117 (exp. 06/30/2018)
to ensure consistent nonduplicative service provision. Additionally, the Health, Housing, and
Homeless Services Division of the County Health Services department, also retains health and
behavioral health care clinicians and a variety of specialized staff to work on interdisciplinary
teams within housing and service programs, including on outreach teams and in multiservice
center and emergency shelter sites.
The County Employment and Human Services Department partners with the CoC, including
the Health Services Department and local nonprofit service providers serving the CoC. The
Department offers a wide range of mainstream employment, vocational, and social supports
to consumers in tandem with CoC programs and local employment service organizations. The
Department has also been instrumental in promoting best practice models of mainstream and
alternative employment and vocational programing. The CoC is working with the Workforce
Development Board and other local employment services providers to increase coordination
and access to employment services for consumers of homeless services in the County.
List and describe services and facilities that meet the needs of homeless persons, particularly chronically homeless individuals and families, families with children, veterans and their families, and unaccompanied youth. If the services and facilities are listed on screen SP-40 Institutional Delivery Structure or screen MA-35 Special Needs Facilities and Services, describe how these facilities and services specifically address the needs of these populations.
The County designed the services and facilities for the homelessness system of care alongside
its partners with the understanding that housing is a social determinant of health. The
services and facilities are designed to provide holistic supports to address the whole health
and housing readiness and stability of individuals and households experiencing or at risk of
homelessness. These services and facilities are evaluated, resourced, and updated based on
client and community need, compliance with state and federal guidance designed to best
support client and community needs, and best practices based on evidence, data, and
consumer input around what is necessary for achieving positive health and housing outcomes
for consumers of homeless services in Contra Costa.
Furthermore, these services and facilities are built around a coordinated access, assessment,
and referral system. The system maintains data on client, program, and system level needs,
inputs and outputs, which informs how services and facilities are developed and prioritized.
Additionally, the system is governed by a body of knowledgeable, concerned, and invested
citizens and stakeholders who report to the County Board of Supervisors about the function
and effectiveness of the system’s services and facilities. As the County’s understanding grows
and needs and practices related to homelessness evolve, the County and its partners make
every effort to develop and enhance the services and facilities designed to address them.
Services

Consolidated Plan CONTRA COSTA COUNTY 74
OMB Control No: 2506-0117 (exp. 06/30/2018)
• Shelter and housing assistance (housing navigation, rapid resolution/problem solving
support, housing resources, assessments, referrals)
• Case management and supportive services
• Coordinated Outreach Referral and Engagement (CORE) Teams
• Health and Behavioral health care, case management, and support
• Financial services
• Legal services
• Educational and Vocational services
• Employment and workforce development
Facilities
• Emergency Shelters (adult, transition aged youth (age 18-24), and family options)
• Coordinated Assessment Referral and Engagement (CARE) Centers and
Warming/CARE Capable Sites
• Transitional Housing
• Permanent Housing
• Food Assistance
• Physical and Behavioral Health Hospitals, Clinics, Treatment Centers
MA-35 Special Needs Facilities and Services - 91.410, 91.210(d)
Introduction
When considering the supportive housing needs of homeless individuals across the
Consortium, there is a significant gap between the supply of supportive housing and the
population that experiences homelessness who need it. Individuals and families across a
range of special needs categories have strong need for supportive housing, and the rise in the
elderly homeless population is highly concerning.
Including the elderly, frail elderly, persons with disabilities (mental, physical, developmental), persons with alcohol or other drug addictions, persons with HIV/AIDS and their families, public housing residents and any other categories the jurisdiction may specify, and describe their supportive housing needs
The 2019 Point In Time (PIT) and 2018 Annual report on homelessness show that, over the
past five years that Adults with disabilities increased 22% and Seniors 62+ increased 97%,
while Veterans decreased 11% and Families decreased 16%. PIT data showed 2,295 persons
experiencing homelessness - 668 sheltered (11% families [62], 89% single adults) and 1,627
unsheltered (3% families [37], 97% singles) - a 43% increase from 2017. Chronically

Consolidated Plan CONTRA COSTA COUNTY 75
OMB Control No: 2506-0117 (exp. 06/30/2018)
homeless individuals increased 65%. Chronically homeless individuals are more likely to need
supportive housing than other homeless individuals, and prefer supportive housing rather
than institutional or congregate settings.
The CoC 2018 Annual Report of the 7,024 people who received services during the calendar
year states that 67% self-reported having a disability:
• Developmental (743)
• Substance Abuse (1,952)
• Chronic Health Issues (1,964)
• Physical disability (2,026)
• Mental Health disability (2,241)
Seniors age 62+ numbered 659 and were 9% of those served. Almost half (46%) of the
transition age youth (TAY) respondents in the Youth and Family Needs Assessment reported
having a disability. Over 25% of those interviewed by the CORE Outreach teams report that
substance abuse, and 20% reported that an illness or health condition, led to their
homelessness.
The CoC reported 899 persons served by permanent supportive housing programs. Most
likely to be housed were Veterans and Seniors, and least likely were persons with psychiatric
disabilities. Family households were much more likely to exit to housing than adult-only
households.
Supportive housing needs for persons with HIV/AIDS is more difficult to access. The 2017 CC
Health Dept. HIV Surveillance Brief reported 2,075 individuals living with HIV or AIDS, with a
higher concentration in west County, followed by east, with central County having the lowest
rates. Although many need affordable housing, the proportion that needs supportive housing
with services is more likely to be limited to those whose viral load has not been suppressed.
The report found that 69.7% of individuals with HIV or AIDS had a suppressed viral load,
25.2% had not had a viral load test, and only 5.1% had a viral load that was not suppressed.
Therefore, the potential number of people with HIV/AIDS who may need supportive housing
numbers from 105 to some unknown portion of those 522 who have not been tested.
To address need for supportive services, CC Behavioral Health Services provides Full Service
Partnership services – the most intensive community-based services and those likely to be
utilized by individuals in need of supportive housing – to 201 children, 100 transition age
youth aged 16 to 25, and 190 adults. Some of these residents are already live in integrated,
supportive housing, but others may be living in congregate facilities or may be reliant upon
housing with family members who may not be able to accommodate them in the future. Data
from the East Bay Regional Center does not facilitate a precise breakdown of the population of
persons with developmental disabilities between Alameda and Contra Costa Counties,
respectively.

Consolidated Plan CONTRA COSTA COUNTY 76
OMB Control No: 2506-0117 (exp. 06/30/2018)
Describe programs for ensuring that persons returning from mental and physical
health institutions receive appropriate supportive housing
Contra Costa Behavioral Health Services provides a range of supportive housing options for
individuals returning from mental health institutions in addition to persons with psychiatric
disabilities who may be at risk of institutionalization. Beyond general preferences for persons
with disabilities in a variety of affordable housing programs or developments, including the
Housing Choice Voucher Program, there are no specific programs for connecting persons with
physical disabilities to supportive housing.
Specify the activities that the jurisdiction plans to undertake during the next year to address the housing and supportive services needs identified in accordance with 91.215(e) with respect to persons who are not homeless but have other special needs. Link to one-year goals. 91.315(e)
Increase the supply of permanent supportive housing for people with disabilities and services
for people with disabilities:
Contra Costa County and the Cities of Antioch, Concord, Pittsburg, and Walnut Creek will
undertake the following activities to increase the supply of permanent supportive housing for
persons with disabilities and services for people with disabilities:
• To the extent practicable, use affordable housing funds for the construction of
permanent supportive housing in developments in which 10-25% of units are set aside
for persons with disabilities. Affirmatively market units to individuals with intellectual
and developmental disabilities, their families, and service providers, such as the
Regional Center of the East Bay.
• Explore methods for nonprofit partners to assist in purchasing or master leasing
affordable units within inclusionary market-rate developments and set a portion of
those units aside for persons with disabilities.
• Explore funding options for continuing community-based services for possible
expansion of services, particularly for persons with psychiatric disabilities.
For entitlement/consortia grantees: Specify the activities that the jurisdiction plans to undertake during the next year to address the housing and supportive services needs identified in accordance with 91.215(e) with respect to persons who are not homeless but have other special needs. Link to one-year goals. (91.220(2))
Special needs groups with priority housing and supportive needs within the County include
the elderly/frail elderly, persons with HIV/AIDS, victims of domestic violence (which includes
abused/neglected children), and persons with physical/mental disabilities. Many of the
supportive needs are addressed strategically through CDBG funding of Public Service
activities for non-homeless special needs populations, which includes elderly/frail elderly,
persons with HIV/AIDS, victims of domestic violence, and persons with physical/mental

Consolidated Plan CONTRA COSTA COUNTY 77
OMB Control No: 2506-0117 (exp. 06/30/2018)
disabilities. In addition, the Consolidated Plan goal of “CD-6 Infrastructure/Public Facilities”
includes funding activities with CDBG funds to construct or improve public facilities and
infrastructure including, but not limited to, providing and improving access to facilities for
persons with disabilities. This may include directly improving or constructing facilities or
infrastructure in low-income areas or providing assistance to nonprofit agencies that serve
low-income populations, including non-homeless special needs populations.
To the extent that other funds, especially low-income housing tax credits, are available, the
County will use CDBG, HOME, and HOPWA funds to assist in the development of new units of
affordable housing for seniors (including frail elderly), persons with HIV/AIDS, and persons
with physical and mental disabilities.
MA-40 Barriers to Affordable Housing - 91.410, 91.210(e)
Describe any negative effects of public policies on affordable housing and
residential investment
There are several significant barriers to affordable housing within Contra Costa County, in
general, and the entitlement cities of Antioch, Concord, Pittsburg, and Walnut Creek. At a high
level, cross-cutting barriers include:
• Zoning and land use restrictions that prevent or otherwise limit the development of
dense housing types that are more likely to be affordable than detached single-family
homes;
• Zoning and land use approval processes that prolong the time it takes for development
to occur;
• Community opposition to the development of affordable housing;
• Local development standards for height limits, stories, lot coverage maximums, and
parking requirements which reduce the number of units allowed on any given site;
• Contra Costa County has an urban limit line to concentrate development in urban areas
and protect open space. This policy increases the cost of land, which increases the cost
of development;
• High land costs;
• Inadequate inclusionary housing policies;
• Insufficient financial resources for affordable housing development; and
• Insufficient tenant protections.
Specific barriers in each of the jurisdictions included in this Consolidated Plan are further
discussed below.

Consolidated Plan CONTRA COSTA COUNTY 78
OMB Control No: 2506-0117 (exp. 06/30/2018)
Contra Costa County: The areas of Contra Costa outside the four entitlement cities vary
widely and include some of the most affordable parts of the County as well as some of the
least affordable. They also include areas where the built environment is urban, suburban, and
rural, respectively. Leaving aside protected agricultural lands and public lands, the non-
entitlement areas within the County tend to have the most restrictive density regulations are
in the central portion of the County. Zoning and land use policies that restrict density are not
the only causes of the imbalances in the housing stock compared to the rest of the County.
Some areas may have topographical characteristics that make multifamily construction
difficult, and some areas may have few remaining buildable sites. Nonetheless, density
restrictions play a role, and easing restrictions could encourage the gradual reuse of land that
is currently devoted to detached single-family homes in addition to multifamily development
on currently unoccupied sites.
In Western Contra Costa County, by contrast, density restrictions play a much smaller role in
exacerbating housing affordability challenges. Eastern Contra Costa County has less
residential density than western Contra Costa County does, but the area also has fewer
housing affordability challenges. Although more permissive zoning might facilitate greater
housing affordability in the area, a relative abundance of available land for development and
longer commute times between eastern Contra Costa County and regional job centers make
housing more affordable. In fact, when low-income households are displaced from Inner Bay
communities like Richmond, Oakland, and San Francisco by rising housing costs, they often
move to eastern Contra Costa County.
In the context of inclusionary housing, delays in approval processes can adversely affect the
financial feasibility of providing affordable a significant number of units. Some delays may
flow from provisions in municipal ordinances that afford agencies and elected boards
excessive time to act upon applications. Others may result from factors outside of the
immediate control of Contra Costa County or its municipalities such as developers and
friendly local officials adopting an overly methodical approach in response to fears that
neighbors will file litigation under the California Environmental Quality Act. Recently enacted
state laws that expedite local zoning and land use approval processes under certain
circumstances may help to ameliorate this problem.
High land costs are a significant barrier to affordable housing in central and western Contra
Costa County. A review of current listings of unbuilt lots for sale in the southern portion of
central Contra Costa County revealed prices ranging from roughly $300,000 per acre to $2
million per acre.
City of Antioch: The City of Antioch has among the most affordable housing costs in Contra
Costa County. According to the American Community Survey 2013-2017 5-Year estimates the
median value of owner-occupied housing units was $330,900 (as opposed to $522,300
countywide). Although the city’s housing stock is skewed toward single-family homes, 12.3%
of housing units are in multifamily structures with five or more units. This reflects underlying

Consolidated Plan CONTRA COSTA COUNTY 79
OMB Control No: 2506-0117 (exp. 06/30/2018)
zoning that, while not particularly permissive, is less exclusionary than the land use controls
in several municipalities that are much closer to the job centers of the Inner Bay and the Tri-
Valley. Slow approval processes also do not appear to be a major barrier in Antioch as
reflected in the high percentage of units that have built in recent decades. Land costs are also
low by regional standards.
City of Concord: The City of Concord arguably has the most variation between neighborhoods
within its boundaries of any municipality in Contra Costa County. Concord includes the area
with the most concentrated poverty in the entire county in the vicinity of Monument
Boulevard in the western portion of the city. It also includes stable middle-class
neighborhoods and more affluent ones. Despite having lower housing production than
communities to its east like Antioch and Pittsburg in recent decades, Concord is on the
precipice of significant growth as the Naval Weapons Station is redeveloped. At a citywide
level, zoning places less of a constraint on housing density in Concord than it does in most of
the county: 24.5% of housing units are in multifamily structures of five units or more. The City
of Concord publishes its zoning maps in a manner that facilitates a fine-grained analysis of
land use regulations at a parcel by parcel level, but that does not readily facilitate a bird’s eye
view of the city. The map below reflects part of the southeastern portion of the city, which is
relatively more affluent than the city as a whole. As can be seen, there are no parcels zoned for
high density housing and few zoned for medium density housing. Restrictive zoning in the
eastern portion of the city is a barrier to housing affordability though the redevelopment of
the Naval Weapons Station will help ameliorate that problem. This planning process did not
reveal specific issues related to delays in the development approval process or community
opposition in Concord. Land costs are relatively high and are a barrier to affordable housing.
Concord has an inclusionary housing ordinance and, moreover, was involved in the
negotiation of specific community benefits with regard to the provision of affordable housing
at the Naval Weapons Station. The requirements for that site go beyond what is generally
required under the ordinance and should make the redevelopment a tremendous positive for
housing affordability in the city and the county. Nonetheless, there is room for improvement
as the ordinance only requires 10% of units to be affordable with the potential of a reduction
down to 6% if there is deeper affordability targeting. Concord suffers from the same lack of
resources as the county as a whole in the absence of an affordable housing bond issue.
City of Pittsburg: In some respects, the City of Pittsburg has the fewest barriers to affordable
housing of any community in Contra Costa County. A higher proportion of its housing units,
16.3%, are in multifamily structures with five or more units than in Antioch.
Affordable Rental Units At Risk Between 2015 And 2025 - State law requires that the City
assess the risk of losing affordable rental housing over a 10-year planning period. Though the
City has a higher proportion of multifamily rental housing, several developments are at risk of
losing its status as housing affordable for low- and moderate-income tenants due to the
expiration of federal, state, or local agreement. The at-risk analysis from the most recent
Housing Element updated in 2015 covers the period from January 31, 2015, through January

Consolidated Plan CONTRA COSTA COUNTY 80
OMB Control No: 2506-0117 (exp. 06/30/2018)
31, 2025. Pittsburg contains 261 multi-family units at risk of conversion to market rate; all
other assisted housing units are preserved or at low risk of conversion due to nonprofit
ownership or long-term affordability restrictions.
Two of the at-risk developments are financed through Section 8 and governed by HUD. One of
these developments, Lido Square, contains 162 units divided into 88 two -bedroom units and
84 three-bedrooms, is privately owned, financed through Section 8, and governed by HUD.
The 162 low-income units within Lido Square are at low risk of conversion due to a trust
agreement with HUD and an intention to maintain affordability at the complex.
The other at-risk Section 8 development is East Santa Fe Avenue Apartments, comprising 19
units divided into studio and one-bedroom apartments. The apartment complex is owned and
managed by Shelter, Inc. of Contra Costa County, an independent, charitable nonprofit
organization whose mission is to prevent and end homelessness for low-income residents of
the county. Based on the organization’s mission, the East Santa Fe Avenue Apartments are at a
low risk of conversion.
Woods Manor is a Low Income Housing Tax Credit (LIHTC) project. Woods Manor is an 80-
unit multi-family apartment complex composed of eight one-bedroom units, 32 two-bedroom
units, 28 three-bedroom units, and 12 four-bedroom units. The complex is owned by Bridge
Housing, an affordable housing developer. In 2009, Bridge Housing applied for and received
an $800,000 commitment in Contra Costa County HOME funds (at $10,000 per unit),
triggering new affordability restrictions lasting a minimum of ten years.10 Due to the new
affordability restrictions and Bridge Housing’s mission to provide housing to low-income
families, Woods Manor is currently not at risk of conversion due to new restrictions.
Preservation Options - The appropriate preservation options depend largely on the type of
project at risk and the type of financing used to make the units affordable. Two methods are
available to ensure there is no net loss of at-risk units converting to market rate within the
planning period: the units must be acquired and preserved or new affordable units must be
constructed to replace those lost in conversion. Either of those options will ensure affordable
controls and price restrictions are extended under federal, state, and local programs. The cost
of acquiring and preserving the units is estimated to be less than replacement through new
construction. Preservation typically requires rent subsidies to cover the difference between
market-rate and assisted rents.
City of Walnut Creek: With respect to zoning and land use, units in multifamily structures
with two or more units make up a higher concentration in Walnut Creek. 35% of housing units
in Walnut Creek are in multifamily structures with two or more units, a figure that nearly
matches the 37% of units that are detached single-family homes (2019 Department of Finance
Housing Estimates). Affordable housing projects within close proximity to amenities, usually
near downtown, are competitive for tax credit and other funding sources, but obtaining
vacant land to build multifamily is becoming harder to find due to limited resources.

Consolidated Plan CONTRA COSTA COUNTY 81
OMB Control No: 2506-0117 (exp. 06/30/2018)
To encourage more housing and mixed-use development downtown near transportation and
jobs, the City completed the North Downtown and West Downtown Specific Plans in 2018 and
2019 respectively. Throughout the extensive public outreach process some residents
expressed concern over increased density; however, the community overall was supportive.
The concerns are potential displacement and increase in housing cost as more activity
happens in the area. Direct displacement occurs when older homes and apartments are
replaced by newer, more expensive housing units. Indirect displacement occurs due to rising
housing costs. Existing residents may find it more difficult to remain as rent increases. These
issues are not unique to West Downtown, North Downtown, nor are they unique to Walnut
Creek. Housing production and displacement are regional issues. However, the City also has
local policies to mitigate displacement and encourage affordable housing.
Walnut Creek has inclusionary housing and commercial linkage fee regulations that support
affordable housing development. Housing in-lieu and commercial linkage fees are primarily
used for acquisition and predevelopment funding of affordable housing. Affordable housing
developers are able to leverage city funds to secure other state and federal funding sources.
Over the span of 15 years, Walnut Creek collected $26,125,000, which translated to over 300
affordable units.
Walnut Creek also has a local density bonus program that supplements the state density
bonus law. Through Walnut Creek’s local program (adopted in 2009), developments that
include substantial affordability can request density bonuses beyond 35%. Three affordable
housing developments have utilized this program to obtain the following bonuses: 150%
(Arboleda), 45% (St. Paul’s Commons, and 42% (Habitat for Humanity – 1250 Las Juntas).
These supplemental bonuses helped to generate more affordable housing as well as increase
the competitiveness of the projects for state and federal programs. Walnut Creek is in the
process of updating its local density bonus program to include broader incentives for
affordable housing development. With changes in state law, and increased savviness on the
part of developers in regards to density bonus, Walnut Creek is seeing more developers
utilizing this tool for residential development. As a result, Walnut Creek anticipates seeing less
inclusionary in lieu fees in the future and more integrated affordable housing units
throughout market rate developments.
MA-45 Non-Housing Community Development Assets - 91.410, 91.210(f)
Introduction
Contra Costa County is one of two counties (Alameda County is the other) comprising the East
Bay region of the San Francisco Bay area. Like many other regions across the country, the East
Bay was significantly impacted by one of the worst economic downturns, known as the "Great
Recession" about a decade ago. The unemployment rate in Contra Costa County more than
doubled from 5.1 percent in April 2008 to 11.1 percent in October 2009, subsequently staying
Consolidated Plan CONTRA COSTA COUNTY 82
OMB Control No: 2506-0117 (exp. 06/30/2018)
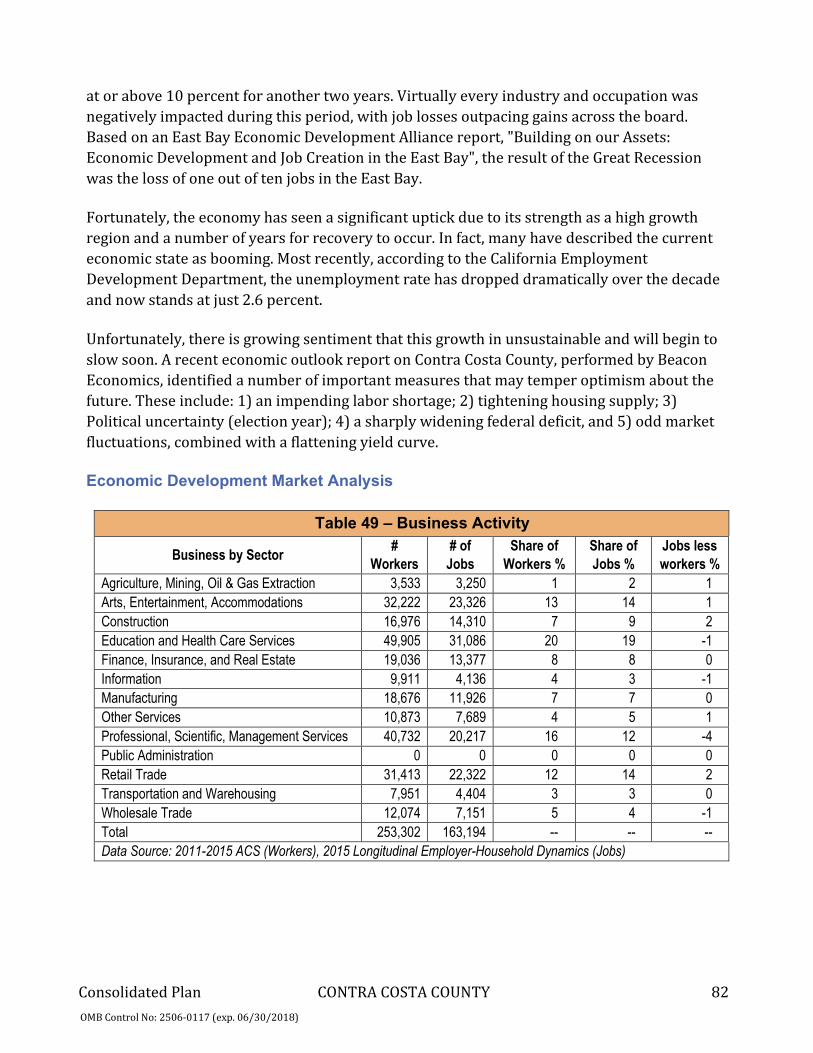
at or above 10 percent for another two years. Virtually every industry and occupation was
negatively impacted during this period, with job losses outpacing gains across the board.
Based on an East Bay Economic Development Alliance report, "Building on our Assets:
Economic Development and Job Creation in the East Bay", the result of the Great Recession
was the loss of one out of ten jobs in the East Bay.
Fortunately, the economy has seen a significant uptick due to its strength as a high growth
region and a number of years for recovery to occur. In fact, many have described the current
economic state as booming. Most recently, according to the California Employment
Development Department, the unemployment rate has dropped dramatically over the decade
and now stands at just 2.6 percent.
Unfortunately, there is growing sentiment that this growth in unsustainable and will begin to
slow soon. A recent economic outlook report on Contra Costa County, performed by Beacon
Economics, identified a number of important measures that may temper optimism about the
future. These include: 1) an impending labor shortage; 2) tightening housing supply; 3)
Political uncertainty (election year); 4) a sharply widening federal deficit, and 5) odd market
fluctuations, combined with a flattening yield curve.
Economic Development Market Analysis
Table 49 – Business Activity
Business by Sector #
Workers
# of
Jobs
Share of
Workers %
Share of
Jobs %
Jobs less
workers %
Agriculture, Mining, Oil & Gas Extraction 3,533 3,250 1 2 1
Arts, Entertainment, Accommodations 32,222 23,326 13 14 1
Construction 16,976 14,310 7 9 2
Education and Health Care Services 49,905 31,086 20 19 -1
Finance, Insurance, and Real Estate 19,036 13,377 8 8 0
Information 9,911 4,136 4 3 -1
Manufacturing 18,676 11,926 7 7 0
Other Services 10,873 7,689 4 5 1
Professional, Scientific, Management Services 40,732 20,217 16 12 -4
Public Administration 0 0 0 0 0
Retail Trade 31,413 22,322 12 14 2
Transportation and Warehousing 7,951 4,404 3 3 0
Wholesale Trade 12,074 7,151 5 4 -1
Total 253,302 163,194 -- -- --
Data Source: 2011-2015 ACS (Workers), 2015 Longitudinal Employer-Household Dynamics (Jobs)

Consolidated Plan CONTRA COSTA COUNTY 83
OMB Control No: 2506-0117 (exp. 06/30/2018)
Labor Force
Table 50 – Labor Force
Total Population in the Civilian Labor Force 373,038
Civilian Employed Population 16 years and over 343,035
Unemployment Rate 8.03
Unemployment Rate for Ages 16-24 19.24
Unemployment Rate for Ages 25-65 5.54 Data Source: 2011-2015 ACS
Travel Time
Table 52 – Travel Time
Travel Time Number Percentage
< 30 Minutes 143,530 46%
30-59 Minutes 106,235 34%
60 or More Minutes 62,167 20%
Total 311,932 100%
Table 51 - Occupations by Sector
Occupations by Sector # of People
Management, business and financial 111,558
Farming, fisheries and forestry occupations 12,895
Service 31,761
Sales and office 79,172
Construction, extraction, maintenance and repair 26,010
Production, transportation and material moving 12,826

Consolidated Plan CONTRA COSTA COUNTY 84
OMB Control No: 2506-0117 (exp. 06/30/2018)
Education:
Educational Attainment by Employment Status (Population 16 and Older)
Table 53 – Educational Attainment by Employment Status
Educational Attainment In Labor Force
Civilian Employed Unemployed Not in Labor Force
Less than high school graduate 23,658 3,317 13,271
High school graduate (inc. equivalency) 43,068 4,715 15,548
Some college or Associate's degree 84,359 6,830 24,783
Bachelor's degree or higher 139,625 6,974 27,320 Data Source: 2011-2015 ACS
Educational Attainment by Age
Table 54 – Educational Attainment by Age
Age
18–24 yrs 25–34 yrs 35–44 yrs 45–65 yrs 65+ yrs
Less than 9th grade 765 3,899 6,683 10,693 6,512
9th to 12th grade, no diploma 6,526 5,588 5,078 8,228 4,991
High school graduate, GED, or alternative 17,537 16,683 14,650 32,053 19,671
Some college, no degree 25,471 19,299 18,628 46,068 20,694
Associate's degree 3,464 6,661 7,862 17,685 7,411
Bachelor's degree 6,424 24,312 30,098 56,566 21,996
Graduate or professional degree 299 8,542 17,840 36,592 16,786 Data Source: 2011-2015 ACS
Educational Attainment – Median Earnings in the Past 12 Months
Table 55 – Median Earnings in the Past 12 Months
Educational Attainment Median Earnings in
the Past 12 Months
Less than high school graduate 1,271,590
High school graduate (includes equivalency) 1,868,854
Some college or Associate's degree 2,759,847
Bachelor's degree 4,212,005
Graduate or professional degree 4,763,883 Data Source: 2011-2015 ACS
Based on the Business Activity table above, what are the major employment sectors
within your jurisdiction?
A little less than half of all Contra Costa County jobs are management, business, science and
arts occupations. It is expected that health care and educational services jobs, in particular,
continue to grow in Contra Costa County than in the rest of the East Bay. The Business Activity
table above further confirms the strength of these sectors in Contra Costa County. The

Consolidated Plan CONTRA COSTA COUNTY 85
OMB Control No: 2506-0117 (exp. 06/30/2018)
educational services, health care, and social assistance industries currently comprise 22
percent of the jobs held by the civilian employed population, 16 years old and over.
Describe the workforce and infrastructure needs of the business community:
The County, via its Workforce Development Board (WDB) has utilized a sector approach to
address workforce and business needs in the region since 2004, and identified construction,
healthcare, manufacturing, and retail as priority sectors during the early/mid 2000s. As part
of its sector engagement process, the WDB has bundled quantitative analysis with anecdotal
information gathered through business engagement efforts (e.g. interviews, surveys, and
conversations), in order to better ascertain business needs, validate labor market projections,
and identify skills gaps in the workforce. The WDB has been able to effectively group
occupations and skill requirements into functional clusters across businesses and/or
industries. Following roughly one year of research and analysis, in July 2012, the WDB
adopted a policy to prioritize and target investments in the following four industry sectors: 1)
Advanced Manufacturing; 2) Health and Life Sciences; 3) Energy; and 4) Information
Communication Technology (ICT) and Digital Media. These four industry sectors typically
require a highly skilled and/or trained workforce.
Therefore, the primary workforce need is the provision of education/training programs in
which the County's workforce population can participate. The WDB's vision to fulfill the
workforce needs of the business community within these four sectors is to create a highly
skilled workforce, prepared through targeted training programs and dynamic education/
training systems. The WDB works towards the realization of this vision by building a
workforce development network that includes strategic partnerships with a wide range of
organizations and businesses, the use of industry sector strategies, leveraging of investments
to increase impact, a data-driven approach that includes using economic intelligence in
decision-making, and shared accountability for results.
The infrastructure needs of the County's overall business community is largely met due to the
County's location within the San Francisco Bay Area. The County has two major interstate
highways, an extensive existing freight railway system, waterfronts and ports that provide
connectivity to regional, national, and global markets. In addition to the two major interstate
highways, the County is served by the Bay Area Rapid Transit (BART) passenger rail system,
which connects County residents and workers to east, central, and west Contra Costa County,
in addition to the greater Bay Area. Given the County's geographic and demographic diversity,
there are specific areas of the County with their own unique characteristics that affect the
County's economic system. The area of west Contra Costa and east Contra Costa, are housing-
rich places with a high number of households compared to jobs, and relatively lower
connectivity to the East Bay’s dense employment nodes, such as central Contra Costa County.
These subareas have a business mix that serves the area households, and therefore do have
lower concentrations of driving industry sectors. The area of central Contra Costa has a higher
ratio of jobs to residents, stronger regional accessibility, and specific industry concentrations
in driving sectors like Advanced Manufacturing, Health and Life Sciences, Energy, and ICT and

Consolidated Plan CONTRA COSTA COUNTY 86
OMB Control No: 2506-0117 (exp. 06/30/2018)
Digital Media. However, in lower-income communities of the County, there is a continual need for
various infrastructure improvements, where the current infrastructure is antiquated and in need
of replacement or in need of a major upgrade to address efficiency and accessibility concerns.
Describe any major changes that may have an economic impact, such as planned local or regional public or private sector investments or initiatives that have affected or may affect job and business growth opportunities during the planning period. Describe any needs for workforce development, business support or infrastructure these changes may create.
One of the biggest potential changes continues to be the initiative to develop and expand the
Northern Waterfront of Contra Costa County. This initiative is currently underway, and is
examining the necessary infrastructure required to develop the waterfront area that stretch from
the City of Hercules to the City of Oakley so that the industrial lands will be marketable for
companies looking to expand and/or move into this area. In addition, the land will be used to
support complimentary industries that will help to increase skilled, high wage jobs in East Contra
Costa County. The initiative seeks to promote the County’s accessibility in terms of waterways,
highway, freight lines, and two regional airports. The expansion or creation of new businesses to
support such services may be necessary, in addition to workforce training initiatives.
How do the skills and education of the current workforce correspond to employment
opportunities in the jurisdiction?
Generalizations about the skills and knowledge needed to find employment in the priority
sectors are difficult to make. However, an analysis of the available economic and workforce
data by the East Bay Economic Development Alliance makes a number of things clear. First, in
many of the industry sectors that are expected to grow and provide high-quality employment
opportunities, scientific and technical skills and knowledge are required. Jobs in the priority
sectors mentioned above, including professional & business services, and health care & social
assistance, will largely require these kinds of skills and knowledge. This idea points to the
importance of providing educational and career pathways in the STEM (Science, Technology,
Engineering, Math) fields for local residents.
Second, many of the jobs being created by new and growing industries will require at least
some post-secondary education. A recent report by the California Employment Development
Department (EDD) estimates that eight out of ten of the fastest growing job categories in the
state will require at least a bachelor’s degree. According to the Labor Force table above, the
total civilian labor force population in the Urban County is 582,886, of which 547,323 is
employed, with over 50 percent having a bachelor's degree or higher. However, the
proportion of residents of Contra Costa County who are above the age of 62 (18.5 percent) is
nearly 2 percent higher than the statewide average for California (16.8 percent). For
employers, highly educated and/or skilled older workers who are aging out of the workforce
will need to be replaced. Yet the challenge is the upcoming younger generations, especially
those between 16-24 years of age, are not meeting the educational and or skill level necessary
to fill many of the jobs that are being vacated by the older workforce. Addressing the education

Consolidated Plan CONTRA COSTA COUNTY 87
OMB Control No: 2506-0117 (exp. 06/30/2018)
and training needs of the younger population is critically important for a number of reasons.
Disconnected youth are more likely to engage in illegal behavior and become dependent on public
aid. In addition, a lack of connection with school and work during these critical years can interfere
with the transition to a productive and self-sufficient adulthood. Finally, a lack of education and
work experience results in reduced employability and earning potential.
In addition, according to an East Bay Economic Alliance’s 2019-20 Outlook, the East Bay's
largest occupational skills gap between the skills of the region’s resident workforce and those
sought after by the region’s employers is in sales and office occupations. It further indicated
that an emphasis should be on the sales and administrative positions that are expected to
grow such as Securities, Commodities and Financial Services Sales Agents, Insurance Sales
Agents and First-Line Supervisors of Office and Administrative Support Workers. The reports
analysis of wage pressure and employment growth also showed that healthcare practitioners
and technical occupations, as well as architecture and engineering occupations, are seeing the
most substantial regional wage pressure and provide a valuable indication of where regional
job training and education should be focused moving forward.
Describe any current workforce training initiatives, including those supported by Workforce Investment Boards, community colleges and other organizations. Describe how these efforts will support the jurisdiction's Consolidated Plan.
There is currently one major workforce training initiative occurring in Contra Costa County,
the East Bay Biomedical Manufacturing Network. The East Bay Biomedical Manufacturing
Network is building a regional innovation ecosystem for technology transfer, economic
development, and workforce development in medical device and bioscience manufacturing
along the I-80/880 Corridor of the Inner San Francisco East Bay Area. This region includes
Western Alameda and Contra Costa Counties from San Pablo/Richmond in the North to
Fremont/Newark in the South and is home to world-class innovation assets such as UC
Berkeley and Lawrence Berkeley National Laboratory.
There is also a call for a second workforce training initiative for electric vehicles (EVs) and
electric vehicle service equipment (EVSE). The Contra Costa Transportation Authority
produced a framework and strategic plan in 2019 that outlines that suggests there will be a
strong need for electricians as demand for EVs continues to rise in the state.
Does your jurisdiction participate in a Comprehensive Economic Development Strategy (CEDS)? No
If so, what economic development initiatives are you undertaking that may be coordinated with the Consolidated Plan? If not, describe other local/regional plans or initiatives that impact economic growth.
The County, at this time, does not have a comprehensive economic development plan. The
County's Workforce Development/Investment Board has a Five-Year Strategic Plan that
addresses economic growth as it relates to the County's overall workforce.

Consolidated Plan CONTRA COSTA COUNTY 88
OMB Control No: 2506-0117 (exp. 06/30/2018)
MA-50 Needs and Market Analysis Discussion
Are there areas where households with multiple housing problems are
concentrated? (include a definition of "concentration")
The 2020-2025 Contra Costa Analysis of Impediments to Fair Housing Choice, which utilized
the data provided by HUD for the Analysis of Fair Housing, presented jurisdiction-specific data
relevant to this section which will be included here. Concentration is defined as areas of
extreme or high poverty defined by US census as areas with 40% of the tract population living
below the federal poverty threshold.
Households with incomes at 30% and 50% AMI experience a greater degree of housing
problems than other income groups. 67% of households with income below 100% AMI
experience a housing problem. In addition, extremely-low income American Indian/Alaska
Native, low-income Black/African American and Pacific Islanders households have
disproportionate housing needs. (See the discussion in Section NA-15.)
The communities of San Pablo, North Richmond, Montalvin Manor, Tara Hills, Bay View, and
Bay Point all have a concentration of minority populations (more than 78.3%) in Low Mod
Census tracts. Much of the housing in these communities are more than 60 years old and
suffer from deferred maintenance.
As previously discussed, there are significant habitability problems in low-income
predominately Hispanic neighborhoods in the Concord Monument Corridor as well as
predominately Black and Hispanic neighborhoods in Richmond and North Richmond. HUD
mapping shows that the most severe housing problems overlap with minority housing
patterns especially in Richmond, the Monument Corridor, and Pittsburg.
Are there any areas in the jurisdiction where racial or ethnic minorities or low-
income families are concentrated? (include a definition of "concentration")
Racially or ethnically concentrated areas of poverty (R/ECAPs) are geographic areas with
significant concentrations of poverty as well as racial or ethnic minorities. HUD has developed
a census-tract based definition of R/ECAPs areas with a non-White population of 50 percent
or more. Census tracts in which 40 percent or more of the individuals are living at or below
the poverty limit or that have a poverty rate three times the average poverty rate for the
metropolitan area, whichever threshold is lower. Under this definition, there is only one
R/ECAP in Contra Costa County, located in the Monument Corridor area of Concord. However,
the criteria used to define a R/ECAP relies on the federal poverty level and so does not fully
capture levels of poverty in areas with a high cost of living such as the San Francisco Bay Area.
A more inclusive definition of concentration includes census tracts that have poverty rates of
25 percent or more. Under this expanded definition, there are R/ECAPs in Antioch, Bay Point,

Consolidated Plan CONTRA COSTA COUNTY 89
OMB Control No: 2506-0117 (exp. 06/30/2018)
Concord, Pittsburg, North Richmond, Richmond, and San Pablo. The largest concentrations of
R/ECAPs are in Concord and Richmond where there are three designated census tracts in
each area.
There are many areas that have census tracts in which 50 percent or more of the population is
a member of a racial or ethnic minority.
• Black/African American residents are generally concentrated in Antioch, Hercules,
Pittsburg, Richmond, and North Richmond. Asians and Pacific Islanders are
concentrated in San Ramon and Hercules as well as in Camino Tassajara, and El Cerrito.
• Hispanic residents are concentrated in Pittsburg, Richmond, San Pablo, Bay Point,
North Richmond, Montalvin Manor, Rollingwood, Martinez and in certain
neighborhoods in the cities of Antioch, Concord, and Oakley.
What are the characteristics of the market in these areas/neighborhoods?
With the exception of San Ramon, all of the above areas have home and apartments that are
priced at or below median home sales and rents.
Are there any community assets in these areas/neighborhoods?
Community assets typically are facilities such as schools, libraries, community centers, parks,
and access/proximity to commercial centers or establishments that include grocery stores,
general merchandise stores, and pharmacy retailers. The communities listed above all have a
combination of community assets that include parks, community centers, and schools
(elementary, middle, and high schools). San Pablo, North Richmond, Montalvin Manor, Bay
Point, Hercules, and San Ramon all have a number of parks, community centers, and schools
(elementary, middle, and high schools). The communities of Antioch, Bay Point, Concord, El
Cerrito, Hercules, Oakley, Pittsburg, San Pablo, Richmond, and San Ramon all have a public
library. Some of these areas have existing large grocery markets, such as Safeway, Raley’s, or
Grocery Outlet; but most are served by small businesses within the areas.
Areas that have low-income concentrations, such as North Richmond, Montalvin Manor, and
Bay Point, tend to have a scarcity of traditional grocery stores, which requires many of the
residents of these areas to travel outside their immediate neighborhood to grocery shop.
Given the scarcity of grocery stores within low-income areas, residents tend to have limited
food options and therefore only have poor food choices, such as fast food.
As part of the “Non-Housing Community Development” priority within the Strategic Plan
section of this Consolidated Plan, there are two strategies that can address this problem
within low-income neighborhood: 1) Improving Infrastructure and Public Facilities; and 2)
expanding economic development opportunities.

Consolidated Plan CONTRA COSTA COUNTY 90
OMB Control No: 2506-0117 (exp. 06/30/2018)
Assisting with infrastructure/public facilities along major transportation corridors or
roadways within low-income neighborhoods can improve accessibility for residents to get to
grocery stores or can open opportunities for new food retailers that provide healthy food
choices to locate in or near these neighborhoods.
In addition, expanding economic opportunities to new or current small food-oriented
businesses through the provision of technical assistance or access to financial assistance can
entice residents of these neighborhoods, who have been operating an informal food business,
to formalize and possibly locate within their neighborhood.
Are there other strategic opportunities in any of these areas?
The communities of San Pablo, Montalvin Manor, Tara Hills, Bay View, and Rodeo are all
located along San Pablo Avenue: a major arterial stretching from downtown Oakland in
Alameda County to Rodeo in Northwestern Contra Costa County. The full length of San Pablo
Avenue in Contra Costa County is identified as a Priority Development Area (PDA) through the
Association of Bay Area Governments. San Pablo Avenue has a mixed-use planning
designation along the entire Contra Costa segment. PDAs are identified in local and regional
planning documents as the priority areas for in-fill development with a focus on jobs, housing,
and access to transit.
The County has also undertaken the Northern Waterfront Economic Development Initiative,
in cooperation with its partners, the cities of Antioch, Brentwood, Concord, Hercules,
Martinez, Oakley, and Pittsburg. It is a regional cluster-based economic development strategy
with a goal of creating 18,000 new jobs by 2035. The Initiative focuses on advanced
manufacturing sub-sectors in five targeted clusters (advanced transportation fuels,
biotech/bio-medical, diverse manufacturing, food processing, and clean tech) and leveraging
existing assets to retain existing firms. In cooperation with public and private stakeholders,
the Initiative will retain existing business, help them expand, and attract new businesses. The
Northern Waterfront area consists of approximately 55 miles of Contra Costa County’s
northern waterfront, from Hercules to Oakley and is an important economic asset to the San
Francisco Bay Area region. This waterfront has several unique features such as a deep ship
channel, marine terminals, and it is served by two Class-1 railroad lines, Union Pacific
Railroad and Burlington Northern Santa Fe Railroad.
Contra Costa County has 38 priority development areas (PDAs) that offer opportunities for
strategic planning. PDAs are identified in local and regional planning documents as priority
areas for in-fill development with a focus on mixed-use development that provides jobs,
housing, and access to transit. The communities of San Pablo and Montalvin Manor are located
along San Pablo Avenue: a major arterial stretching from downtown Oakland in Alameda
County to Rodeo in Northwestern Contra Costa County. The full length of San Pablo Avenue in
Contra Costa County is identified as a PDA, with a goal to develop a vibrant, mixed use
corridor. Another PDA is located in Central Richmond while others are located in El Cerrito,

Consolidated Plan CONTRA COSTA COUNTY 91
OMB Control No: 2506-0117 (exp. 06/30/2018)
Hercules, North Richmond, Concord, Antioch, Oakley, Pittsburg, and in San Ramon. Many of
these PDAs are located around the ten BART stations in Contra Costa. Additionally, there are
projects in Rodeo and at the Pittsburg/Bay Point BART station, which were assumed by the
Contra Costa County Successor Agency who are actively seeking development partners to
complete the planned developments.
Targeting public investments and efforts to increase economic mobility within Contra Costa
County’s R/ECAPs can help increase access to opportunity in these areas. Economic
development efforts in R/ECAPs can complement the Northern Waterfront Economic
Development Initiative while infrastructure and streetscaping improvements can help
facilitate local retail development.
MA-60 Broadband Needs of Housing occupied by Low- and Moderate-
Income Households - 91.210(a)(4), 91.310(a)(2)
Describe the need for broadband wiring and connections for households, including
low- and moderate-income households and neighborhoods.
As is illustrated on the accompanying table, the Consortium is well covered by a variety of
service providers with varying types of accessibility and speed. Broadband internet
availability for the County as a whole at over 95% far exceeds the US average of 79%, and is
better than the California average of 94%. All areas except Bethel Island, which is 70%, are
even higher at 95% - 99%. California is the 12th most connected state in the nation, with 98%
of the population having access to broadband speeds of 25 Mbps or more. A search by zip code
reveals no major differences in coverage and accessibility in lower income neighborhoods.
Xfinity (Comcast) offers its Internet Essentials program to every unconnected HUD-assisted
household and is the primary provider of television and internet throughout the County. All
areas have access to the highest speed access to high speed internet, including Bethel Island.
Xfinity (Comcast) offers this speed service by cable, and AT&T provides it by fiber (with
limited coverage) and by DSL. Satellite services at 25 Mbps are offered by ViaSat and
HughesNet, while DSL is provided by Sonic, also at a speed of 25 Mbps.
The need for broadband wiring and connections is viewed to be more than adequate for all
households and areas in the County with the exception of Bethel Island. This remote area in
far East County has the least amount of Broadband coverage at 70%.
Describe the need for increased competition by having more than one broadband
Internet service provider serve the jurisdiction.
All areas of the County are served by at least six providers with a wide range of products,
speeds and prices. Bethel Island, in far East County, is served by five providers with speeds

Consolidated Plan CONTRA COSTA COUNTY 92
OMB Control No: 2506-0117 (exp. 06/30/2018)
(and prices) ranging from 1000 Mbps to 10 Mbps, therefore competition is deemed
adequate. See Tables 56 & 57.
Table 56–Available Broadband Providers in County With Type & Speed

Consolidated Plan CONTRA COSTA COUNTY 93
OMB Control No: 2506-0117 (exp. 06/30/2018)
Consortium Broadband Availability
Table 57 – Available Broadband Providers in Contra Costa County

Consolidated Plan CONTRA COSTA COUNTY 94
OMB Control No: 2506-0117 (exp. 06/30/2018)
MA-65 Hazard Mitigation - 91.210(a)(5), 91.310(a)(3)
Describe the jurisdiction’s increased natural hazard risks associated with climate
change.
Contra Costa County has assessed hazard risk and the impact of hazards on lower income
communities and individuals for many years with the latest update to the Contra Costa County
Hazard Mitigation Plan (Vol 2) in January 2018.
In addition, cities, counties and agencies have incorporated such planning in the creation and
implementation of Climate Action Plans. These documents have provided suggested actions
jurisdictions can take to limit the Greenhouse Gas Emissions. Some jurisdictions have gone
beyond GHG reduction-focused Climate Action Plans and have incorporated climate resilience
into their climate action programs. These documents outline key adaptation strategies and
structural changes that make communities more climate resilient. Among the cities that have
incorporated resilience into climate planning are San Francisco, Oakland, and Alameda, and
Contra Costa is following in such footsteps.
Below is a basic assessment of hazard risks facing Contra Costa County and consortium cities,
followed by a general outline of how climate change may alter these hazards and their
effects. The Contra Costa County Consolidated Plan will address current and developing
vulnerabilities, and how they will change in the coming years.
Per the Hazard Risk Ranking below from the Contra Costa County Hazard Mitigation Plan, the
following are considered high hazard risks:
• Earthquake
• Landslide
Medium hazard risks include the following:
• Severe Weather
• Wildfire
• Dam and Levee Failure
• Flood
Low hazard risks include the following:
• Sea level rise
• Tsunami
• Drought

Consolidated Plan CONTRA COSTA COUNTY 95
OMB Control No: 2506-0117 (exp. 06/30/2018)
Describe the vulnerability to these risks of housing occupied by low- and moderate-
income households based on an analysis of data, findings, and methods.
Earthquakes - High Risk
By far the greatest natural hazard risk to the entire County is from earthquake. Contra Costa
County is located in a region of high seismicity with numerous local faults. The primary
seismic hazard for the County is potential ground shaking from these faults, especially the
Hayward, Calaveras North, Concord-Green Valley, Mount Diablo, and Greenville faults. Low-
income households and senior households (individuals over the age of 65) are particularly
vulnerable to earthquake hazards. Low income households may lack the financial resources to
improve their homes to prevent or mitigate earthquake damage. They are also less likely to
have insurance to compensate for losses in earthquakes. Senior households are more likely to
need special medical attention, which may not be available due to isolation caused by
earthquakes. Elderly residents also may have more difficulty leaving their homes during
earthquake events and could be stranded in dangerous situations.
Landslide - High Risk
Landslides are commonly categorized by the type of ground failure. The most common type is
the shallow colluvial slide, usually occurring in response to intense, short duration storms.
Landslides are often triggered by other natural hazards such as earthquakes, heavy rain,
floods or wildfires, therefore landslide frequency is often related to the frequency of these
other hazards. In Contra Costa County, landslides typically occur during and after severe rain
storms, so the potential of landslides largely coincides with the potential for sequential severe
storms that saturate steep, vulnerable soils. According to the County Hazard Mitigation Plan it
is difficult to determine demographics of populations vulnerable to landslide damage. In
general, all of the estimated 166,205 persons exposed to higher risk landslide areas are
considered to be vulnerable.
Severe Weather - Medium Risk
Severe Weather, which includes extreme heat events to which East County is more
susceptible, is a medium risk but one more associated with climate change. Severe weather
includes:
• Drastic increase in severe heat days, heat waves, and associated health events and
energy costs
• Increasingly volatile weather, negatively affecting agricultural yields and
recreation/tourism
• Increasingly frequent severe storms, which can increase risk of flood, landslide, power
outages, and disruption of transportation systems

Consolidated Plan CONTRA COSTA COUNTY 96
OMB Control No: 2506-0117 (exp. 06/30/2018)
Vulnerable populations are the elderly, low-income households, people with life threatening
illnesses, and residents living in areas that are isolated from major roads.
Wildfire - Medium Risk
A wildfire is any uncontrolled fire occurring on undeveloped land that requires fire
suppression. Wildfires can be ignited by lightning or by human activity such as smoking,
campfires, equipment use, or arson. The geography, weather patterns, and vegetation in the
East Bay area provide ideal conditions for recurring wildfires. Especially vulnerable are the
East Bay Hills in Lamorinda, which includes Lafayette, Moraga, and Orinda. Parts of Walnut
Creek, including the area surrounding Rossmoor, are vulnerable to wildfires, as are Clayton,
the Danville/San Ramon area, and San Pablo/El Cerrito/El Sobrante area.
Smoke and air pollution from wildfires can be a severe health hazard, especially for sensitive
populations, including children, the elderly, and those with respiratory and cardiovascular
diseases. Homeless individuals are also at particular risk since they wouldn't necessarily have
the ability to find refuge indoors from smoke and air pollution. Furthermore, extreme heat
events which bring an increasing risk to wildfires are now exacerbated by the present PG&E
policy of cutting power in windy conditions.
Figure 2 - Contra Costa County Hazard Mitigation Plan