houston: economy at a glance may 2010
TRANSCRIPT

8/9/2019 Houston: Economy at a Glance May 2010
http://slidepdf.com/reader/full/houston-economy-at-a-glance-may-2010 1/9
May 2010 ©2010, Greater Houston Partnership Page 1
A publication of the Greater Houston Partnership Volume 19, Number 5 x May 2010
Job Market Brightens — The Houston-Sugar Land-Baytown MetropolitanStatistical Area added 14,800 jobs in March, one of the best month-to-month job
performances since November ’08. Furthermore, the March job growth is on par with Houston’s historical performance over the past 10 years, notes Ron Borski,labor market analyst with Workforce Solutions.
Of the 11 supersectors tracked by the Texas Workforce Commission, only two— construction and information—showed job losses in March, albeit small ones (500
and 100 jobs, respectively). The biggest employment gains occurred in leisure andhospitality (5,700 jobs); trade, transportation and utilities (4,300 jobs); government(1,500 jobs); and professional and business services (1,200 jobs).
For the 12 months ending March ’10, the Houston MSA lost 60,200 jobs, aconsiderable improvement over the prior month, when the region’s 12-month jobloss was 77,900. As recently as December, Houston’s 12-month loss exceeded100,000 jobs. GHP’s employment forecast calls for over-the-year losses to con-tinue through late summer, turning positive in the fourth quarter.
Rig Count Continues to Improve, Gas Prices Weaken — The Baker Hughes
count of active domestic rotary rigs averaged 1,479 in April, ending the month at1,483—the highest level in 66 weeks, and 69 percent above the recent low of 876last June.
Much of the recent increase in activity is because of operators drilling wells inorder to hold on to their leases, says Gene Shiels, assistant director of investor re-lations at Baker Hughes. There is concern that the rig count may decline this fall if demand for natural gas remains weak and prices remain at current low levels, headds.
The Friday closing spot market price of Henry Hub natural gas has hovered around$4 per MMBtu since mid-March, up about 50 cents from spring of last year, butstill far below the five-year average of $6.92, according to the latest data from theU.S. Energy Information Administration. EIA expects prices to remain low for thenext several months. In its April Short-Term Energy Outlook , the agency forecaststhe Henry Hub spot price to average $4.44 per MMBtu in ’10 and $5.33 in ’11. In-ventories of gas in storage are 20 percent above the five-year average, continuingto exert downward pressure on prices.

8/9/2019 Houston: Economy at a Glance May 2010
http://slidepdf.com/reader/full/houston-economy-at-a-glance-may-2010 2/9
HOUSTON—THE ECONOMY AT A GLANCE
May 2010 ©2010, Greater Houston Partnership Page 2
Oil Prices Remain Strong — The Friday closing spot market price for WestTexas Intermediate crude oil (WTI) averaged $84.34 a barrel for the first four Fridays of April, up from $51.44 in April ’09, and 15 percent above the five-year average. EIA expects oil prices will continue to firm in response to the global eco-nomic recovery. Robust economic and energy demand growth in Asia and the
Middle East are helping to sustain prices. EIA expects WTI to average above $81 per barrel this summer and $85 per barrel by the fourth quarter of next year.
Houston-Galveston Customs District Trade Increases — The value of tradethrough the customs district in February totaled $14.5 billion, a 33 percent over-the-year increase. Exports rose 27 percent to $6.6 billion; imports increased 39
percent to $7.9 billion. The large growth in trade is due to a recovering economy.
The value of trade through the customs district closely tracks the course of crudeoil prices, which averaged $40.34 in February ’09 and $76.18 in February of thisyear. Since ’05, mineral fuels have accounted for 45 to 50 percent of total trade
value through the customs district.
Excluding mineral fuels, however, trade still shows growth. In February ’10, tradeexcluding mineral fuels totaled $7.4 billion, up 6 percent from February ’09.
Office and Industrial Markets Still Weak — CB Richard Ellis reports that inQ1/10, Houston’s office market saw negative net absorption of 427,621 square feet(sf), mostly Class A space. From Q4/09 to Q1/10, vacancy increased slightly to16.3 percent. The vacancy rate for Class A space was 12.5 percent, while Class Bvacancy was 20.2 percent. Overall rental rates fell slightly, from $24.00 in Q4/09to $23.65 last quarter.
The industrial market remains the best market in Houston, says CBRE researchmanager Lynn Cirillo. Sysco’s purchase of 660,101 sf in Northwest Houston
pushed industrial absorption to 1,039,524 sf in Q1/10, up from 848,018 sf inQ4/09. Vacancy was 7.1 percent, slightly higher than in Q4/09. Overall askingrental rates averaged $0.48 per sf, showing no growth from the two previousquarters. Only 163,500 sf of new industrial space were completed in Q1/10.
PMI Continues to Improve — The Houston Purchasing Managers Index, a short-term leading indicator of regional production, marked a 12th consecutive month of improvement in March, rising to 55.3, reports the National Association for Pur-chasing Management-Houston.
The PMI has a possible range of 0 to 100, with readings above 50 anticipating production growth and below 50 signaling contraction. March is the sixth straightmonth with a reading above 50.

8/9/2019 Houston: Economy at a Glance May 2010
http://slidepdf.com/reader/full/houston-economy-at-a-glance-may-2010 3/9
HOUSTON—THE ECONOMY AT A GLANCE
May 2010 ©2010, Greater Houston Partnership Page 3
Four of the PMI’s eight components showed improvement from February toMarch. The employment index remains slightly negative but has increased for the
past five months, indicating that companies will be looking to hire soon.
____________________________________
The Greater Houston Partnership is the primary advocate of Houston’s business communityand is dedicated to building regional economic prosperity.
Visit the Greater Houston Partnership on the World Wide Web at www.houston.org.Contact us by phone at 713-844-3600.

8/9/2019 Houston: Economy at a Glance May 2010
http://slidepdf.com/reader/full/houston-economy-at-a-glance-may-2010 4/9
HOUSTON—THE ECONOMY AT A GLANCE
May 2010 ©2010, Greater Houston Partnership Page 4
Houston Economic Indicators
A Service of the Greater Houston Partnership
Most Year % Most Year %
Month Recent Earlier Change Recent Earlier Change
ENERGY
U.S. Active Rotary Rigs Apr '10 1,479 995 48.8 1,385 * 1,262 * 9.8
Spot Crude Oil Price ($/bbl, West Texas Intermediate) Mar '10 80.77 48.90 65.2 77.97 * 43.54 * 79.1
Spot Natural Gas ($/MMBtu, Henry Hub) Mar '10 4.21 3.89 8.2 5.08 * 4.51 * 12.4
UTILITIES AND PRODUCTION Houston Purchasing Managers Index Mar '10 55.3 39.0 41.8 53.9 * 39.4 * 36.9
Nonresidential Electric Current Sales (Mwh, CNP Service Area) Mar '10 3,750,034 3,715,536 0.9 11,384,882 11,388,785 0.0
CONSTRUCTION
Total Building Contracts ($, Houston MSA) Mar '10 750,760,000 789,849,000 -4.9 1,997,307,000 1,913,807,000 4.4
Nonresidential Mar '10 164,854,000 356,832,000 -53.8 583,523,000 901,446,000 -35.3
Residential Mar '10 585,906,000 433,017,000 35.3 1,413,784,000 1,012,361,000 39.7
Building Permits ($, City of Houston) Mar '10 275,197,938 455,768,511 -39.6 703,482,708 1,112,670,358 -36.8
Nonresidential Mar '10 173,635,497 350,841,554 -50.5 439,597,363 875,274,095 -49.8
New Nonresidential Mar '10 75,841,546 147,575,431 -48.6 173,413,300 274,712,607 -36.9
Nonresidential Additions/Alterations/Conversions Mar '10 97,793,951 203,266,123 -51.9 266,184,063 600,561,488 -55.7
Residential Mar '10 101,562,441 104,926,957 -3.2 263,885,345 237,396,263 11.2
New Residential Mar '10 83,994,493 83,867,723 0.2 200,829,871 182,787,616 9.9
Residential Additions/Alterations/Conversions Mar '10 17,567,948 21,059,234 -16.6 63,055,474 54,608,647 15.5
Multiple Listing Service (MLS) Activity
Closings Mar '10 5,758 5,029 14.5 12,650 12,351 2.4
Median Sales Price - SF Detached Mar '10 154,250 145,000 6.4 148,583 * 137,370 * 8.2 Active Listings Mar '10 49,030 45,768 7.1 46,966 * 44,898 * 4.6
EMPLOYMENT (Houston-Sugar Land-Baytown MSA)
Nonfarm Payroll Employment Mar '10 2,506,700 2,566,900 -2.3 2,492,700 * 2,568,000 * -2.9
Goods Producing (Natural Resources/Mining/Const/Mfg) Mar '10 473,500 513,900 -7.9 472,600 * 521,400 * -9.4
Service Providing Mar '10 2,033,200 2,053,000 -1.0 2,020,100 * 2,046,600 * -1.3
Unemployment Rate (%) - Not Seasonally Adjusted
Houston-Sugar Land-Baytown MSA Mar '10 8.5 6.8 8.6 * 6.6 *
Texas Mar '10 8.2 7.0 8.4 * 6.9 *
U.S. Mar '10 10.2 9.0 10.4 * 8.8 *
Unemployment Insurance Claims (Gulf Coast WDA)
Initial Claims Mar '10 22,780 28,729 -20.7 22,415 * 26,789 * -16.3
Continuing Claims Mar '10 119,750 134,743 -11.1 117,520 * 115,050 * 2.1
TRANSPORTATION
Port of Houston Authority Shipments (Short Tons) Mar '10 3,421,634 3,128,111 9.4 9,234,787 9,459,854 -2.4
Air Passengers (Houston Airport System) Mar '10 4,195,469 4,174,127 0.5 11,434,022 11,205,376 2.0
Domestic Passengers Mar '10 3,464,515 3,488,467 -0.7 9,404,732 9,322,926 0.9International Passengers Mar '10 730,954 685,660 6.6 2,029,290 1,882,450 7.8
Landings and Takeoffs Mar '10 72,699 76,700 -5.2 209,317 214,630 -2.5
Air Freight (000 lb) Mar '10 76,036 60,891 24.9 207,398 176,624 17.4
Enplaned Mar '10 39,079 32,529 20.1 109,183 95,125 14.8
Deplaned Mar '10 36,957 28,362 30.3 98,215 81,499 20.5
CONSUMERS
New Car and Truck Sales (Units, Houston MSA) Mar '10 19,570 15,566 25.7 59,471 51,537 15.4
Cars Mar '10 9,093 7,075 28.5 27,391 23,016 19.0
Trucks, SUVs and Commercials Mar '10 10,477 8,491 23.4 32,080 28,521 12.5
Total Retail Sales ($000,000, Houston MSA, NAICS Basis) 3Q09 18,738 20,136 -6.9 53,679 59,150 -9.3
Consumer Price Index for All Urban Consumers ('82-'84=100)
Houston-Galveston-Brazoria CMSA Mar '10 192.412 187.972 2.4 191.074 * 189.989 * 0.6
United States Mar '10 217.631 212.709 2.3 217.020 * 212.015 * 2.4
Hotel Performance (Harris County)
Occupancy (%) Dec '09 45.5 57.5 60.2 * 70.1 *
Average Room Rate ($) Dec '09 108.44 118.29 -8.3 116.79 * 126.58 * -7.7Revenue Per Available Room ($) Dec '09 49.38 68.06 -27.4 70.30 * 88.79 * -20.8
POSTINGS AND FORECLOSURES
Postings (Harris County) Apr '10 4,284 3,148 36.1 15,976 10,585 50.9
Foreclosures (Harris County) Apr '10 1,180 772 52.8 4,590 3,044 50.8
YEAR-TO-DATE
TOTAL OR AVERAGE*MONTHLY DATA
8/9/2019 Houston: Economy at a Glance May 2010
http://slidepdf.com/reader/full/houston-economy-at-a-glance-may-2010 5/9
HOUSTON—THE ECONOMY AT A GLANCE
May 2010 ©2010, Greater Houston Partnership Page 5
Sources
Rig Count Baker Hughes IncorporatedSpot WTI, Spot Natural Gas U.S. Energy Information AgencyHouston Purchasing Managers National Association of Index Purchasing Management –
Houston, Inc.Electricity CenterPoint EnergyBuilding Construction Contracts McGraw-Hill ConstructionCity of Houston Building Permits Building Permit Department, City
of HoustonMLS Data Houston Association of Realtors
Employment, Unemployment Texas Workforce Commission
Port Shipments Port of Houston Authority Aviation Aviation Department, City of
HoustonCar and Truck Sales TexAuto Facts Report , InfoNation,
Inc., Sugar Land TXRetail Sales Texas Comptroller’s OfficeConsumer Price Index U.S. Bureau of Labor StatisticsHotels PKF Consulting/Hospitality Asset
Advisors InternationalPostings, Foreclosures Foreclosure Information & Listing
Service
STAY UP TO DATE!
If you would like to receive this electronic publication on the first working day of each month, please e-
mail your request for Economy at a Glance to [email protected] . Include your name, title and phonenumber and your company’s name and address. Archived copies are available to Partnership Membersin the Members Only section at www.houston.org. For information about joining the Greater HoustonPartnership and gaining access to this powerful resource, call Member Services at 713-844-3683.
The foregoing table is updated whenever any data change — typically, 11 or so times per month. Ifyou would like to receive those updates by e-mail, usually accompanied by commentary, please e-mai
your request for Key Economic Indicators to [email protected] with the same identifying information
You may request Glance and Indicators in the same e-mail.
8/9/2019 Houston: Economy at a Glance May 2010
http://slidepdf.com/reader/full/houston-economy-at-a-glance-may-2010 6/9
HOUSTON—THE ECONOMY AT A GLANCE
May 2010 ©2010, Greater Houston Partnership Page 6
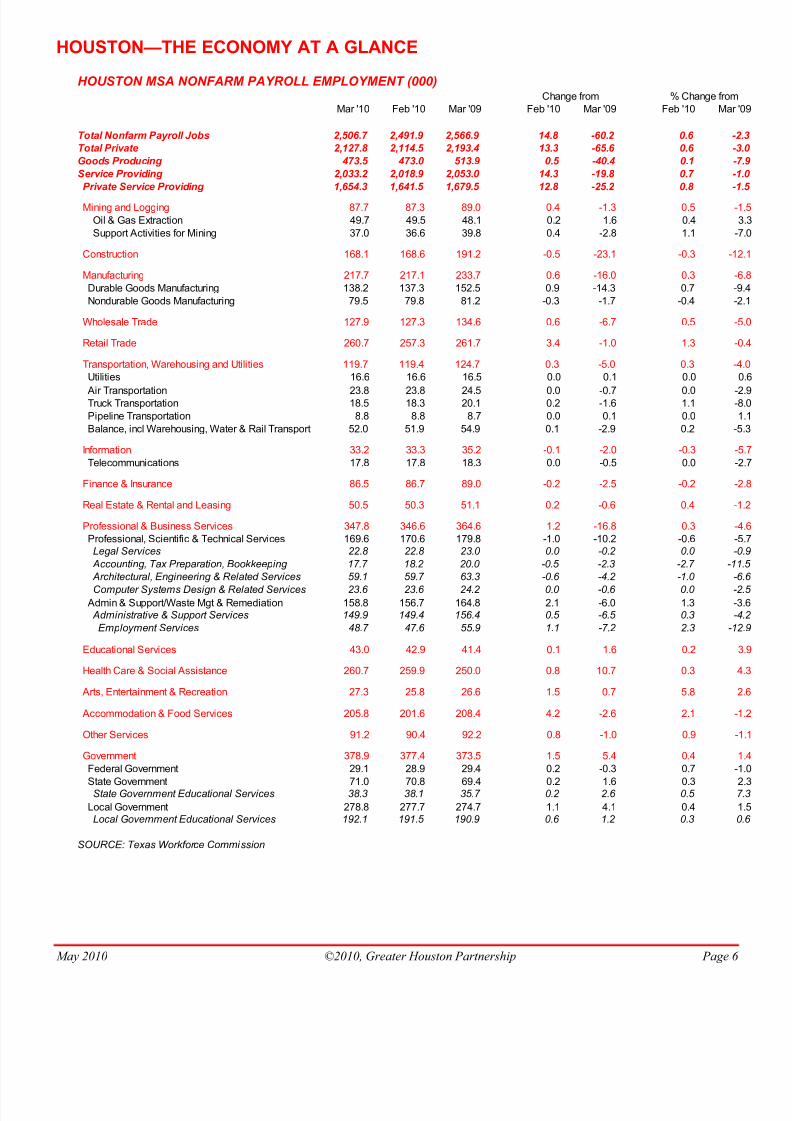
HOUSTON MSA NONFARM PAYROLL EMPLOYMENT (000)Change from % Change from
Mar '10 Feb '10 Mar '09 Feb '10 Mar '09 Feb '10 Ma
Total Nonfarm Payroll Jobs 2,506.7 2,491.9 2,566.9 14.8 -60.2 0.6
Total Private 2,127.8 2,114.5 2,193.4 13.3 -65.6 0.6
Goods Producing 473.5 473.0 513.9 0.5 -40.4 0.1
Service Providing 2,033.2 2,018.9 2,053.0 14.3 -19.8 0.7
Private Service Providing 1,654.3 1,641.5 1,679.5 12.8 -25.2 0.8
Mining and Logging 87.7 87.3 89.0 0.4 -1.3 0.5
Oil & Gas Extraction 49.7 49.5 48.1 0.2 1.6 0.4
Support Activities for Mining 37.0 36.6 39.8 0.4 -2.8 1.1
Construction 168.1 168.6 191.2 -0.5 -23.1 -0.3 -
Manufacturing 217.7 217.1 233.7 0.6 -16.0 0.3
Durable Goods Manufacturing 138.2 137.3 152.5 0.9 -14.3 0.7
Nondurable Goods Manufacturing 79.5 79.8 81.2 -0.3 -1.7 -0.4
Wholesale Trade 127.9 127.3 134.6 0.6 -6.7 0.5
Retail Trade 260.7 257.3 261.7 3.4 -1.0 1.3
Transportation, Warehousing and Utilities 119.7 119.4 124.7 0.3 -5.0 0.3Utilities 16.6 16.6 16.5 0.0 0.1 0.0
Air Transportation 23.8 23.8 24.5 0.0 -0.7 0.0Truck Transportation 18.5 18.3 20.1 0.2 -1.6 1.1
Pipeline Transportation 8.8 8.8 8.7 0.0 0.1 0.0
Balance, incl Warehousing, Water & Rail Transport 52.0 51.9 54.9 0.1 -2.9 0.2
Information 33.2 33.3 35.2 -0.1 -2.0 -0.3
Telecommunications 17.8 17.8 18.3 0.0 -0.5 0.0
Finance & Insurance 86.5 86.7 89.0 -0.2 -2.5 -0.2
Real Estate & Rental and Leasing 50.5 50.3 51.1 0.2 -0.6 0.4
Professional & Business Services 347.8 346.6 364.6 1.2 -16.8 0.3Professional, Scientific & Technical Services 169.6 170.6 179.8 -1.0 -10.2 -0.6Legal Services 22.8 22.8 23.0 0.0 -0.2 0.0
Accounting, Tax Preparation, Bookkeeping 17.7 18.2 20.0 -0.5 -2.3 -2.7 -
Architectural, Engineering & Related Services 59.1 59.7 63.3 -0.6 -4.2 -1.0Computer Systems Design & Related Services 23.6 23.6 24.2 0.0 -0.6 0.0
Admin & Support/Waste Mgt & Remediation 158.8 156.7 164.8 2.1 -6.0 1.3Administrative & Support Services 149.9 149.4 156.4 0.5 -6.5 0.3
Employment Services 48.7 47.6 55.9 1.1 -7.2 2.3 -
Educational Services 43.0 42.9 41.4 0.1 1.6 0.2
Health Care & Social Assistance 260.7 259.9 250.0 0.8 10.7 0.3
Arts, Entertainment & Recreation 27.3 25.8 26.6 1.5 0.7 5.8
Accommodation & Food Services 205.8 201.6 208.4 4.2 -2.6 2.1
Other Services 91.2 90.4 92.2 0.8 -1.0 0.9
Government 378.9 377.4 373.5 1.5 5.4 0.4
Federal Government 29.1 28.9 29.4 0.2 -0.3 0.7State Government 71.0 70.8 69.4 0.2 1.6 0.3State Government Educational Services 38.3 38.1 35.7 0.2 2.6 0.5
Local Government 278.8 277.7 274.7 1.1 4.1 0.4Local Government Educational Services 192.1 191.5 190.9 0.6 1.2 0.3
SOURCE: Texas Workforce Commission

8/9/2019 Houston: Economy at a Glance May 2010
http://slidepdf.com/reader/full/houston-economy-at-a-glance-may-2010 7/9
HOUSTON—THE ECONOMY AT A GLANCE
May 2010 ©2010, Greater Houston Partnership Page 7
75
80
85
90
95
Q1/01 Q1/02 Q1/03 Q1/04 Q1/05 Q1/06 Q1/07 Q1/08 Q1/09 Q1/10 Q1/11
O C C U P A N C Y ( % )
OFFICE OCCUPANCY RATESHOUSTON CBD AND SUBURBS 2001 - 2011
CBD SUBURBS
Source: CB Richard Ellis
-120
-100
-80
-60
-40
-20
0
20
40
60
80
100
120
140
160
1.95
2.00
2.05
2.10
2.15
2.20
2.25
2.30
2.35
2.40
2.45
2.50
2.55
2.60
2.65
Jan-01 Jan-02 Jan-03 Jan-04 Jan-05 Jan-06 Jan-07 Jan-08 Jan-09 Jan-10 Jan-11
1 2 - M O N T H
C H A N G E
( 0 0 0 )
N O N F A R
M
P A Y R O L L
E M P L O Y M E N T
( 0 0 0 , 0 0 0 )
HOUSTON MSA EMPLOYMENT2001-2011
12-MONTH CHANGE JOBS
Source: Texas Workforce Commission
8/9/2019 Houston: Economy at a Glance May 2010
http://slidepdf.com/reader/full/houston-economy-at-a-glance-may-2010 8/9
HOUSTON—THE ECONOMY AT A GLANCE
May 2010 ©2010, Greater Houston Partnership Page 8
1.60
1.65
1.70
1.75
1.80
1.85
1.90
1.95
2.00
2.05
2.10
2.15
2.20
2.25
430
440
450
460
470
480
490
500
510
520
530
540
550
Jan-01 Jan-02 Jan-03 Jan-04 Jan-05 Jan-06 Jan-07 Jan-08 Jan-09 Jan-10 Jan-11
S E R V I C E - P R O V I D I N G
( 0 0 0 , 0 0 0 )
G O O D S - P R O D U C I N G
( 0 0 0 )
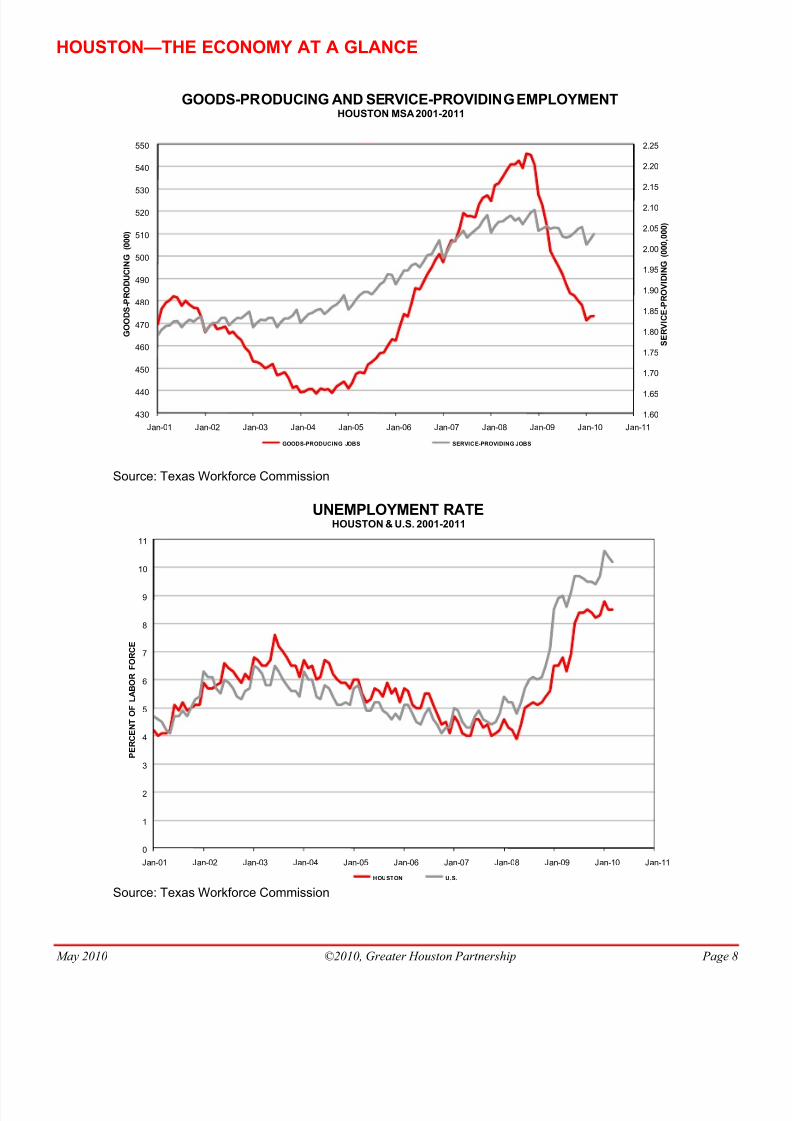
GOODS-PRODUCING AND SERVICE-PROVIDING EMPLOYMENTHOUSTON MSA 2001-2011
GOODS-PRODUCING JOBS SERVICE-PROVIDING JOBS
Source: Texas Workforce Commission
0
1
2
3
4
5
6
7
8
9
10
11
Jan-01 Jan-02 Jan-03 Jan-04 Jan-05 Jan-06 Jan-07 Jan-08 Jan-09 Jan-10 Jan-11
P E R C E N T O F
L A B O R
F O R C E
UNEMPLOYMENT RATEHOUSTON & U.S. 2001-2011
HOUSTON U.S.
Source: Texas Workforce Commission

8/9/2019 Houston: Economy at a Glance May 2010
http://slidepdf.com/reader/full/houston-economy-at-a-glance-may-2010 9/9
HOUSTON—THE ECONOMY AT A GLANCE
May 2010 ©2010, Greater Houston Partnership Page 9
0
4
8
12
16
20
24
28
0
20
40
60
80
100
120
140
Jan-01 Jan-02 Jan-03 Jan-04 Jan-05 Jan-06 Jan-07 Jan-08 Jan-09 Jan-10 Jan-11
H E N R Y H U B N A T U R A L G A S ( $ / M M B T U )
W E S T T E X A S I N T E R M E D I A T E ( $ / B B L )
SPOT MARKET ENERGY PRICES2001 - 2011
WTI MONTHLY WTI 12-MO AVG GAS MONTHLY GAS 12-MO AVG
Source: U.S. Energy Information Administration
-3%
-2%
-1%
0%
1%
2%
3%
4%
5%
6%
Jan-01 Jan-02 Jan-03 Jan-04 Jan-05 Jan-06 Jan-07 Jan-08 Jan-09 Jan-10 Jan-11
INFLATION: 12-MONTH CHANGE2001-2011
HOUSTON CPI-U U.S. CPI-U
Source: U.S. Bureau of Labor Statistics