houston single tenant industrial portfolio
TRANSCRIPT

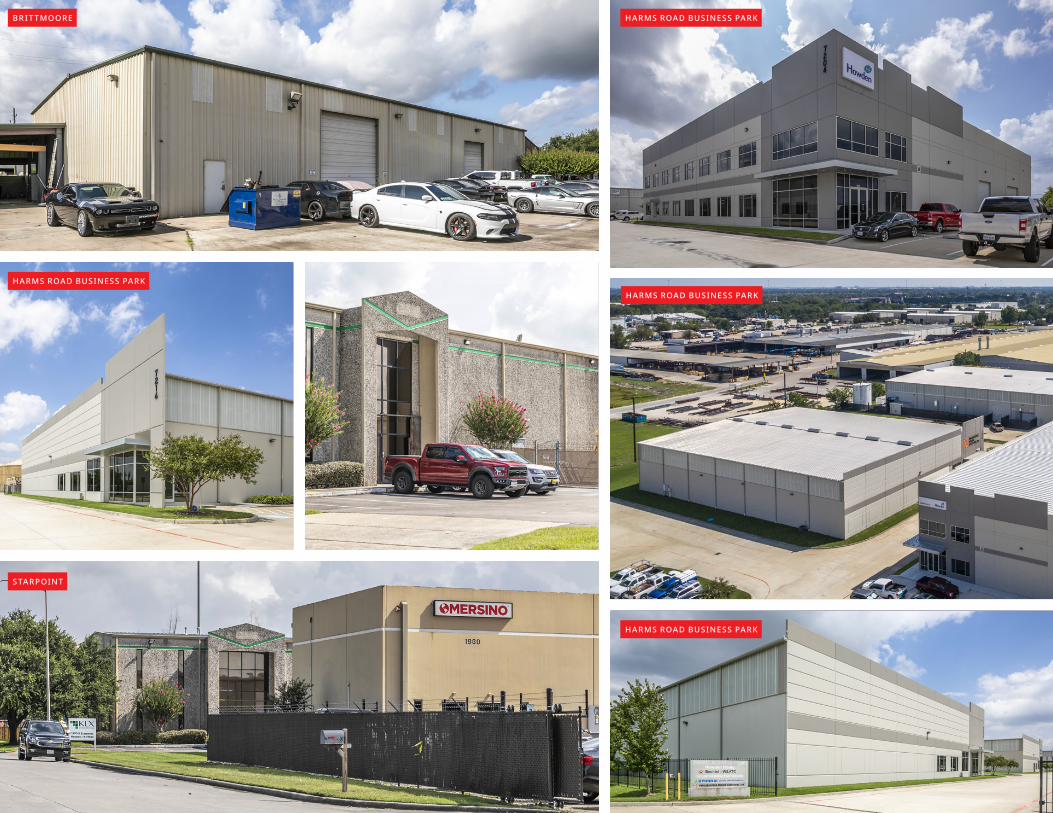
HOUSTON SINGLE TENANTINDUSTRIAL PORTFOLIO100% LEASED, 13-BUILDING, 216,772 SF INDUSTRIAL PORTFOLIO IN HOUSTON, TX

THE OFFERING
JLL Capital Markets, on behalf of the seller, is pleased to offer qualified investors the opportunity to acquire the Houston Single Tenant Industrial Portfolio (the “Property” or “Portfolio”), a best-in-class, 216,772 square foot portfolio consisting of thirteen light industrial properties located in Houston’s northwest, north, and northeast submarkets. Built between 1993-2018 and currently 100% leased, the Portfolio offers investors the opportunity to acquire a multi-building, stabilized, cash-flowing portfolio with rents currently 8.5% below market. All buildings are located within the Grand Parkway among high-growth submarkets that have true barriers to entry and, with an average tenant size of approximately 16,675 square feet, see minimal competition from new supply as construction costs and land prices continue to rise. As a result, rents continue to grow at a significantly higher pace than the overall market.
PORTFOLIO SUMMARY
# OF BUILDINGS: 13
SIZE (SF): 216,772
OCCUPANCY: 100%
YEAR BUILT: 1993-2018
CLEAR HEIGHT: 14'-30'
WALT: 4.1 Years
OFFICE FINISH: 21.7%
AVG. BUILDING SIZE (SF): 16,675
Rare Large-Scale Opportunity
Strategic Locations with Geographic
Diversity
Versatile Light Industrial Product Catering to Various
Tenant Sizes
Diverse Tenancy Favorable Market Fundamentals
HARMS ROAD BUSINESS PARK PARK ROW BR I T TMOORE

PORTFOLIO OVERVIEW
20155 Park Row 6934 Signat Drive 1960 Starpoint 1970 Starpoint 203 Blue Bell Road 7470 Miller Road 2 Total / Averages
TENANT Ooh La La Bakery, LLC The Meter Shop, Inc Global Pump KLX Energy Ace Steel Supply LOI - TBD
TOTAL SIZE 3,165 6,000 7,875 10,000 23,750 20,982 216,772
SUBMARKET Northwest Northwest North North North Northeast NW, N, NE
OCCUPANCY 100% 100% 100% 100% 100% 100% 100%
OFFICE FINISH 28.4% 25.0% 25.4% 40.0% 8.8% 25.0% 21.7%
LAND SIZE (ACRES) 0.38 0.51 1.85 2.00 1.33 4.15 21.34
COVERAGE RATIO 19.0% 26.9% 9.8% 11.5% 40.9% 11.6% 23.3%
CRANE(S) None None None 1, 5-ton crane 2, 2.5-ton cranes 2, 5-ton cranes 9
YEAR BUILT 2008 2007 1998 2001 1993 2002 1993-2018
CAR PARKING SPACES 11 6 20 15 22 32 231
PARKING RATIO 3.5/1,000 1.0/1,000 2.5/1,000 1.5/1,000 0.9/1,000 1.5/1,000 0.5-3.5/1,000
CLEAR HEIGHT 18' 22' 18' 28' 14'-25' 22' 14'-30'
13014 Brittmoore 13018 Brittmoore 7204 Harms Rd 7208 Harms Rd 7206 Harms Rd 7210 Harms Rd 7214 Harms Rd
TENANT DeLong Automotive Group
Kelly Basketaball DBA Shoot 360 Howden Roots Bechtel Oil, Gas, and
Chemicals, INCHyundai Global Service
Americas Co.Philadelphia Mixing
Solutions Pura Vida Bioplastics
TOTAL SIZE 9,750 11,250 39,375 24,000 16,000 21,000 23,625
SUBMARKET Northwest Northwest Northwest Northwest Northwest Northwest Northwest
OCCUPANCY 100% 100% 100% 100% 100% 100% 100%
OFFICE FINISH 19.0% 16.0% 22.9% 32.0% 25.5% 21.4% 10.2%
LAND SIZE (ACRES) 1.73 9.37
COVERAGE RATIO 27.9% 30.4%
CRANE(S) None None 1, 20-ton crane 1, 20-ton crane 2, 5-ton cranes 1, 10-ton crane None
YEAR BUILT 2006 2006 2018 2016 2016 2014 2014
CAR PARKING SPACES 18 12 30 30 11 12 12
PARKING RATIO 1.8/1,000 1.1/1,000 0.8/1,000 1.3/1,000 0.7/1,000 0.6/1,000 0.5/1,000
CLEAR HEIGHT 18' 18' 30' 30' 28' 30' 30'
BR I T TMOORE
HARMS ROAD BUSINESS PARK
STARPOINT
HARMS ROAD BUSINESS PARK
HARMS ROAD BUSINESS PARK
HARMS ROAD BUSINESS PARK

BR I T TMOORE
HARMS ROAD BUSINESS PARK 203 BLUE BELL
HARMS ROAD BUSINESS PARK
STARPOINT
6934 SIGNAT
INVESTMENT HIGHLIGHTS
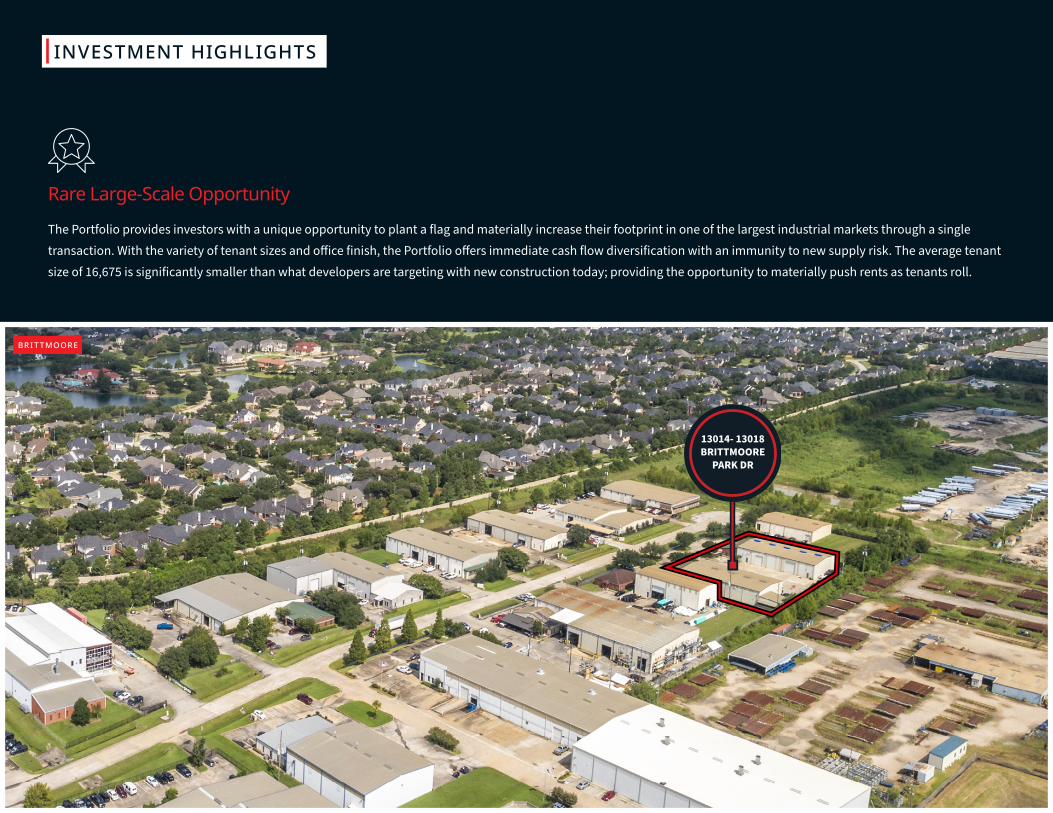
Rare Large-Scale Opportunity
The Portfolio provides investors with a unique opportunity to plant a flag and materially increase their footprint in one of the largest industrial markets through a single transaction. With the variety of tenant sizes and office finish, the Portfolio offers immediate cash flow diversification with an immunity to new supply risk. The average tenant size of 16,675 is significantly smaller than what developers are targeting with new construction today; providing the opportunity to materially push rents as tenants roll.
13014- 13018BRITTMOORE
PARK DR
BR I T TMOORE

HOUSTONHOUSTON
PASADENA
LA PORTE
PEARLAND
DEER PARK
ROSENBERG
ATASCOCITA
MISSION BEND
MISSOURI CITY
KATY
HUMBLE
SEABROOK
BELLAIRE
RICHMOND
PECAN PARK
CLOVERLEAF
PECAN GROVE
CINCO RANCH
MEMORIAL
HEIGHTS
RIVEROAKS
ENERGYCORRIDOR
GALENA PARK
SOUTH HOUSTON
JERSEY VILLAGE
CROSBY
GALVESTON BAY
610
610
10
69
6945
45
1409
8
99
8
8
146
225
8
288
59
90
290
HOBBYINTERNATIONAL
AIRPORT
HOBBYINTERNATIONAL
AIRPORT
GEORGE BUSHINTERNATIONAL AIRPORT
GEORGE BUSHINTERNATIONAL AIRPORT
SUGAR LANDSUGAR LAND
GALLERIAGALLERIA
TEXAS MEDCENTER
TEXAS MEDCENTER
DOWNTOWNDOWNTOWN
Northwest Industrial Submarket20115 Park Row 3,165 SF
6934 Signat Drive 6,000 SF13014-13018 Brittmoore 21,000 SF
7204-7214 Harms Rd 124,000 SF North Industrial Submarket1960-1970 Starpoint 17,875 SF
203 Blue Bell Road 23,750 SF
Northeast Industrial Submarket7470 Miller Road 2 20,982 SF
Strategic Locations with Geographic Diversity Widely spread across Houston’s Northwest, North, and Northeast
submarkets, the Portfolio offers significant geographic diversification. Each property is located within infill, irreplaceable locations with strong barriers to entry. The infill nature of the Portfolio caters to tenants that demand proximity to their customers within major population centers, which will continue to attract tenants in the future.
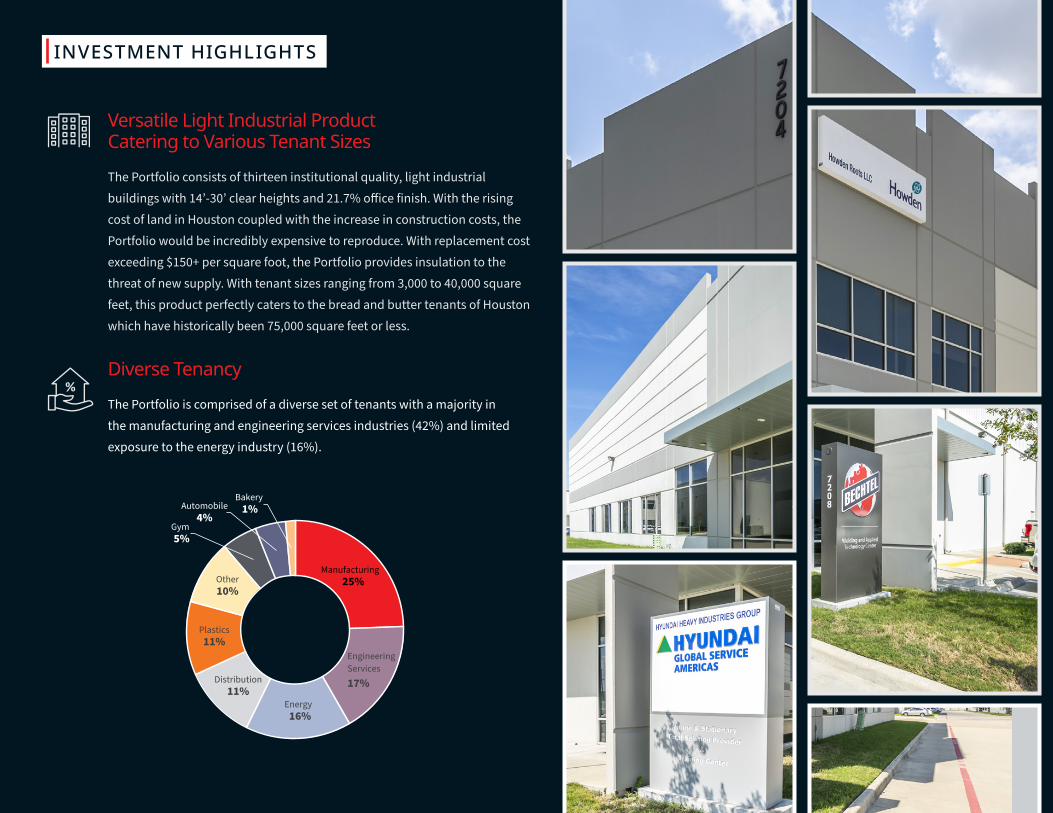
Versatile Light Industrial Product Catering to Various Tenant Sizes
The Portfolio consists of thirteen institutional quality, light industrial buildings with 14’-30’ clear heights and 21.7% office finish. With the rising cost of land in Houston coupled with the increase in construction costs, the Portfolio would be incredibly expensive to reproduce. With replacement cost exceeding $150+ per square foot, the Portfolio provides insulation to the threat of new supply. With tenant sizes ranging from 3,000 to 40,000 square feet, this product perfectly caters to the bread and butter tenants of Houston which have historically been 75,000 square feet or less.
Diverse Tenancy
The Portfolio is comprised of a diverse set of tenants with a majority in the manufacturing and engineering services industries (42%) and limited exposure to the energy industry (16%).
INVESTMENT HIGHLIGHTS
Manufacturing25%
Engineering Services
Energy16%
17%Distribution11%
Plastics11%
Other10%
Gym5%
Automobile4%
Bakery1%
TENANT INDUSTRY

5650 & 5670 GUHN ROAD
Favorable Market Fundamentals
In 2020, Houston led the nation with 48,208 single-unit housing permits, leading Dallas by nearly 5,000 permits and Austin by more than 20,000 permits. Driven by Houston’s nation-leading population growth, the Houston housing market shows no signs of slowing down. The Houston single family home sales market saw its twelfth consecutive positive month of sales in May, jumping 56% year-over-year to 12,100 homes sold. Over the past 10 years, Houston has gained 1,284,268 residents, ranking second in the U.S. over that time. From 2020 to 2029, Houston is expected to tack on another 1.24 million residents, pushing the MSA’s population to over 8 million people.
METROPOLITAN STATISTICAL AREA
SINGLE-FAMILY PERMITS: DEC (UNITS
#YTD, NSA)
Houston-The Woodlands-Sugar Land, TX 48,208
Dallas-Fort Worth-Arlington, TX 43,884
Phoenix-Mesa-Scottsdale, AZ 31,724
Atlanta-Sandy Springs-Roswell, GA 28,057
Austin-Round Rock, TX 21,653
Charlotte-Concord-Gastonia, NC-SC 17,807
Tampa-St. Petersburg-Clearwater, FL 16,028
Orlando-Kissimmee-Sanford, FL 15,523
Nashville-Davidson-Murfreesboro-Franklin, TN 14,125
Washington-Arlington-Alexandria, DC-VA-MD-WV 13,594Sources: National Association of Home Builders
30,000
40,000
50,000
60,000
70,000
80,000
2020 2021 EST 2022 EST 2023 EST 2024 EST 2025 EST
HOUSTON MSA DALLAS MSA NEW YORK MSA PHOENIX MSA
Source: Oxford Economics
Explosive Regional Population Growth Houston led the nation in Housing Starts in 2020 and is expected to be a leading National MSA for
new home starts for the next 5 years.
HOUSING STARTS
(Multi Family & Single Family)
INVESTMENT HIGHLIGHTS
SUPPLY & DEM AND [SF ] TOTAL VAC ANC Y AV ER AGE A SKING RENTS [$/SF ]
0
10
20
30
2017 2018 2019 2020 2021M
ILLI
ON
S
NET ABSORPTIONDELIVERIES
2%
4%
6%
8%
10%
2011 2013 2015 2017 2019 2021 2011 2013 2015 2017 2019 2021$0.20
$0.30
$0.40
$0.50
$0.60DIRECT SUBLEASE
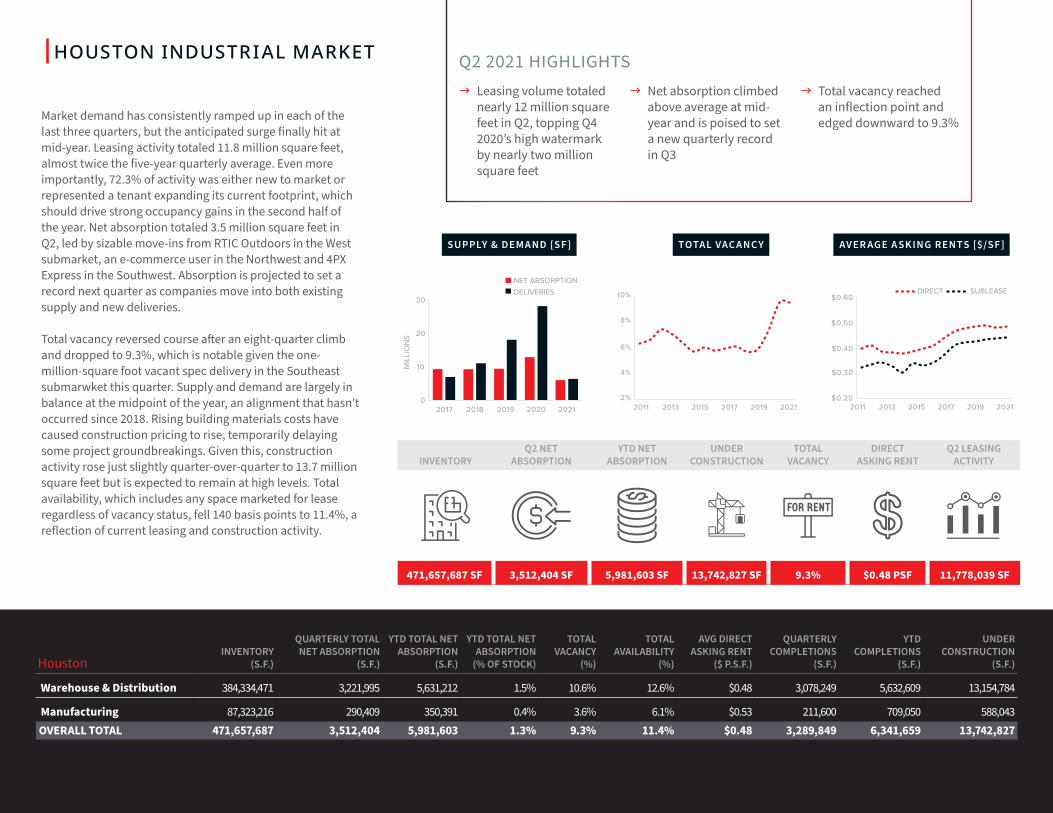
Market demand has consistently ramped up in each of the last three quarters, but the anticipated surge finally hit at mid-year. Leasing activity totaled 11.8 million square feet, almost twice the five-year quarterly average. Even more importantly, 72.3% of activity was either new to market or represented a tenant expanding its current footprint, which should drive strong occupancy gains in the second half of the year. Net absorption totaled 3.5 million square feet in Q2, led by sizable move-ins from RTIC Outdoors in the West submarket, an e-commerce user in the Northwest and 4PX Express in the Southwest. Absorption is projected to set a record next quarter as companies move into both existing supply and new deliveries.
Total vacancy reversed course after an eight-quarter climb and dropped to 9.3%, which is notable given the one-million-square foot vacant spec delivery in the Southeast submarwket this quarter. Supply and demand are largely in balance at the midpoint of the year, an alignment that hasn’t occurred since 2018. Rising building materials costs have caused construction pricing to rise, temporarily delaying some project groundbreakings. Given this, construction activity rose just slightly quarter-over-quarter to 13.7 million square feet but is expected to remain at high levels. Total availability, which includes any space marketed for lease regardless of vacancy status, fell 140 basis points to 11.4%, a reflection of current leasing and construction activity.
INVENTORY Q2 NET
ABSORPTION YTD NET
ABSORPTIONUNDER
CONSTRUCTION TOTAL
VACANCY DIRECT
ASKING RENT Q2 LEASING
ACTIVITY
471,657,687 SF 3,512,404 SF 5,981,603 SF 13,742,827 SF 9.3% $0.48 PSF 11,778,039 SF
HoustonINVENTORY
(S.F.)
QUARTERLY TOTAL NET ABSORPTION
(S.F.)
YTD TOTAL NET ABSORPTION
(S.F.)
YTD TOTAL NET ABSORPTION
(% OF STOCK)
TOTAL VACANCY
(%)
TOTAL AVAILABILITY
(%)
AVG DIRECT ASKING RENT
($ P.S.F.)
QUARTERLY COMPLETIONS
(S.F.)
YTD COMPLETIONS
(S.F.)
UNDER CONSTRUCTION
(S.F.)
Warehouse & Distribution 384,334,471 3,221,995 5,631,212 1.5% 10.6% 12.6% $0.48 3,078,249 5,632,609 13,154,784
Manufacturing 87,323,216 290,409 350,391 0.4% 3.6% 6.1% $0.53 211,600 709,050 588,043OVERALL TOTAL 471,657,687 3,512,404 5,981,603 1.3% 9.3% 11.4% $0.48 3,289,849 6,341,659 13,742,827
Q2 2021 HIGHLIGHTS J Leasing volume totaled
nearly 12 million square feet in Q2, topping Q4 2020’s high watermark by nearly two million square feet
J Net absorption climbed above average at mid-year and is poised to set a new quarterly record in Q3
J Total vacancy reached an inflection point and edged downward to 9.3%
HOUSTON INDUSTRIAL MARKET

Houston at a Glance
3 R D L A R G E S TNUMBER OF FORTUNE 1000companies in the nation
4 T H L A R G E S T NUMBER OF FORTUNE 500companies in the nation
22 FORTUNE 500companies call Houston home
9 COUNTIES in the Houston MSA
64,400NEW JOBS CREATED IN 2019
42,300 NEW JOBS FORECASTED IN 2020
2ND LARGESTNUMBER OF JOBS CREATED IN 2018 OUT
OF ANY MSA IN THE NATION
26th LARGESTeconomy in the world if Houston were an independent nation
73 FOREIGN-OWNED FIRMS
7thLARGESTU.S. metro economy in the nation
$480 BILLION GDP [2018]
5TH MOST POPULOUS MSA IN THE NATION 4TH MOST POPULOUS CITY IN THE NATION
LARGEST GULF COAST CONTAINER PORT
7 MILLIONresidents in the Houston MSA
2.3 MILLIONresidents in the city of Houston
10,000square miles
larger than the state of NJ
1 IN 4 Houstonians are foreign-born
3.2 MILLION JOBS IN THE HOUSTON MSAmore that 35 states and nearly a quarter of Texas’ entire employment base
LARGEST MEDICAL COMPLEX IN THE WORLD
$25 BILLION
IN LOCAL GDP
8th LARGEST
BUSINESS DISTRICT IN THE U.S.
10 MILLION
PATIENT ENCOUNTERS PER YEAR
106,000+ EMPLOYEES AT TMC
4th largestMULTI-AIRPORT SYSTEM
IN THE U.S.
58.3 millionPASSENGERS
GLOBAL HUB FOR
Aerospace Technology
1ST IN IMPORT AND EXPORT
1ST GULF COAST CONTAINER PORT
1stIN FOREIGN
WATERBORNE TONNAGE
POPULATION & DEMOS
GEOGRAPHY
ECONOMY
CORPORATE HEADQUARTERS GLOBAL TRADE CITY
TEXAS MEDICAL CENTER
CLUTCH CITY INTERNATIONAL HUB
EMPLOYMENTHOUSTON AT A GLANCE
Trent Agnew, SIORSenior Managing Director(713) 852‑[email protected]
Charlie StraussDirector +1 713 212 6574 [email protected]
Katherine MillerAnalyst(713) 852‑[email protected]
Jack Moody Analyst +1 713 212 6548 [email protected]
Matt KafkaSenior Managing Director(713) 852‑[email protected]
Michael JohnsonSenior Director +1 713 852 3474 [email protected]
Investment Advisory
For Financing Inquiries
Contactinformation
Copyright © Jones Lang LaSalle IP, Inc. 2021Jones Lang LaSalle Americas, Inc. or its state-licensed affiliate (“JLL”) has been engaged by the owner of the properties to market it them for sale. Information concerning the properties described herein has been obtained from sources other than JLL, and neither Owner nor JLL, nor their respective equity holders, officers, directors, employees and agents makes any representations or warranties, express or implied, as to the accuracy or completeness of such information. Any and all reference to age, square footage, income, expenses and any other property specific information are approximate. Any opinions, assumptions, or estimates contained herein are projections only and used for illustrative purposes and may be based on assumptions or due diligence criteria different from that used by a purchaser. JLL and owner disclaim any liability that may be based upon or related to the information contained herein. Prospective purchasers should conduct their own independent investigation and rely on those results. The information contained herein is subject to change. The Properties may be withdrawn without notice. If the recipient of this information has signed a confidentiality agreement regarding this matter, this information is subject to the terms of that agreement. ©2021. Jones Lang LaSalle IP, Inc. All rights reserved.
9 Greenway Plaza, Suite 700 | Houston, TX 77049 | (713) 852-3500www.us.jll.com/capitalmarkets