how and why to improve cal grants - the institute for
TRANSCRIPT

How and wHy to Improve Cal Grants: Key FaCts and reCommendatIons
Key Facts and Recommendations
sPRinG 2016
How and wHy to Improve Cal Grants
CALIFORNIANS FOR COLLEGE AFFORDABILITY
SPRING 2016 / The INSTITuTe foR ColleGe ACCeSS & SuCCeSS
CalIfornIans for ColleGe affordaBIlIty
The Coalition of Californians for College Affordability works to strengthen need-based financial aid in California so that all students can afford to attend and complete college, allowing the state’s workforce to remain competitive.
An independent, nonprofit organization, the Institute for College Access & Success (TICAS) works to make higher education more available and affordable for people of all backgrounds, nationally and in California. By conducting and supporting nonpartisan research, analysis, and advocacy, TICAS aims to improve the processes and public policies that can pave the way to successful educational outcomes for students and for society. For more about TICAS, see www.ticas.org.
This report may only be reproduced or disseminated, in whole or in part, with proper attribution and within the terms of this Creative Commons license for noncommercial use: creativecommons.org/licenses/by-nc-nd/4.0/.
Images: Freepik, Info.gram

How and wHy to Improve Cal Grants: Key FaCts and reCommendatIons
INTRODUCTIONcalifornia, a state long considered to lead the nation in higher education, is not fulfilling its promise of equitable opportunity for all students. overall, only 31 percent of california college students complete credentials on time.1 Low-income students are much less likely than higher income students to enroll in or complete college, and these income gaps have grown in recent decades.2 Racial disparities also persist within california colleges: african-american and Latino students are much less likely than white students to complete credentials.3
the need to reverse these trends is more urgent than ever before. california is projected to need 2.4 million more people with postsecondary credentials by 2025, an increase from earlier projections.4 We cannot achieve this goal at current college completion rates, and it will become harder to achieve with each passing year.
students’ ability to pay for college is an important factor in whether they go to college and stay once they are there. college costs include not only the tuition and fees required to enroll, but also the many other costs students incur: textbooks, transportation, housing, and food. most students and families cannot afford to pay all of these costs from earnings and savings alone, and too many students ultimately reduce their odds of completion by working long hours, enrolling part time, or stopping out.
By reducing the gap between the cost of college and what families can afford to pay, financial aid can help increase enrollment, persistence, and completion. When that gap is not fully closed, the remainder is called “unmet need.” Research shows that students are less likely to enroll when they have more unmet need, and that enrolled students with any unmet need are less likely to earn degrees than those with none.5 Having sufficient resources to cover college costs – from savings, earnings, grants, and/or manageable loans – helps students complete college by reducing their need to work and supporting their time studying and in class.6
Providing $2 billion in need-based financial aid to california’s college students, the cal Grant program is a substantial state investment in college access and success.7 still, there is room to improve the program. awards for many qualifying students have not kept pace with their college costs, and most low-income college students are left out of the program entirely. as a result, the net cost of college – students’ total costs after taking available grant aid into account – is most burdensome for the lowest income students.8
it is clear we need to enable more students to graduate, overcome widening income gaps in college enrollment and completion, and eliminate racial and ethnic disparities in educational attainment. improving the cal Grant program so that more students are served, and served well, is critical to making progress on these three interrelated fronts. student, civil rights, college access, business, and workforce organizations agree on what the cal Grant program’s two guiding principles should be: helping the neediest students in the state afford college, and using available dollars to encourage colleges to serve students better. increased attention on these issues in recent years has led to important policy improvement. institutional accountability standards tied to the student loan default and graduation rates of cal Grant participating institutions were put in place in 2011 and 2012, and the size and number of cal Grant awards were increased modestly in 2014 and 2015, respectively. However, more needs
1
SPRING 2016 / The INSTITuTe foR ColleGe ACCeSS & SuCCeSS
CAL GRANT BASICS › WHO ARE CAL GRANT RECIPIENTS?
to be done to ensure that cal Grants bring college access and success within reach for low-income students. in this brief, we explore various aspects of the cal Grant program and how to build on its strengths to better serve our state’s neediest students. We offer three specific policy recommen-dations:
1. increase the cal Grant B access award, which helps low-income recipients limit their work hours and focus on their studies.
2. serve more of the state’s cal Grant eligible students.
3. include tuition awards for first-year cal Grant B recipients, better enabling low-income students to choose the college that is right for them.
cal Grant recipients come from low- to moderate-income backgrounds and attend all types of institutions. at california’s public colleges and universities, cal Grant recipients – especially the most disadvantaged – are more likely to be underrepresented minorities.9 available data also show that cal Grant recipients are generally successful, with graduation rates comparable to those of students who do not receive grants and typically have higher incomes. at the commu-nity colleges in particular, persistence and graduation/transfer rates for cal Grant recipients are actually higher than those of non-recipients.10
› KEY ELIGIBILITY CRITERIA FOR ALL GRANT TYPES
Student eligibility: all cal Grant applicants must have not yet earned a Ba; meet financial need, income, and asset criteria; have earned a minimum GPa; apply before application deadlines; and be california residents.11 Financial and GPa criteria vary for each type of cal Grant award.12
College eligibility: cal Grant recipients can use their awards at hundreds of colleges throughout the state. since 2011, colleges also have had to meet basic eligibility criteria. For 2015-16, colleges where more than 40% of students borrow must have a graduation rate above 20% and a federal student loan default rate of less than 15.5% to participate in the cal Grant program. the graduation rate requirement will increase to above 30% beginning in 2017-18.
› ELIGIBILITY POOLS
the majority of cal Grant recipients receive grants as an entitlement, meaning that they applied at a point when they were guaranteed a grant if they met the GPa and income-related criteria. eligible students who apply their senior year of high school or within the next year receive a High school entitlement award, which is the most common type of award. students who transfer from a community college to a four-year school before age 28 may qualify for a transfer entitlement award. in 2015-16, 75 percent of all cal Grant recipients got High school entitlement awards, while eight percent got transfer entitlement awards.13
2

How and wHy to Improve Cal Grants: Key FaCts and reCommendatIons
the majority of cal Grant applicants do not qualify for entitlement awards because they are more than a year out of high school, decide to go to college after the entitlement application deadline, or do not meet age or other requirements when they transfer. these hundreds of thousands of students must instead compete for a set number of awards authorized each year. competitive awards went to just 15 percent of all cal Grant recipients in 2015-16.14
Based on which eligibility criteria they meet, both entitlement and competitive applicants may be offered a cal Grant a or B. cal Grant a awards are available to students with high GPas from generally middle-income families, while cal Grant B awards are available to students with moderate to high GPas from low-income families.
the remaining two percent of cal Grant recipients are cal Grant c recipients. Like competitive awards, a set number of cal Grant c awards are authorized each year. cal Grant c awards are allocated through a separate process that includes an additional application, and are available for up to two years to students who are enrolled in a recognized career or technical program.15
› WHAT CAL GRANTS COVER
the dollar value of a cal Grant depends on the type of award. cal Grant a awards cover tuition costs, and the amount provided varies based on where the student attends college (see below). cal Grant B awards, which go to lower income applicants, include an “access” award to help students cover non-tuition costs, such as books and supplies, room and board, and transportation. most cal Grant B recipients receive only this access award, which is $1,656 for 2015-16.16 However, depending on the type of college they attend and their year in college, cal Grant B recipients may also receive a tuition award.
tuition awards, whether part of cal Grant a or B, cover full systemwide tuition and fees at public universities.17 the maximum tuition coverage for different types of private institutions has been set in the annual budget act. While all cal Grant a recipients receive tuition awards starting their first year of college, those who receive cal Grant B generally do not receive tuition awards until their second year.18
› Cal Grant Award Values Vary by College Type 2015 – 16 Maximum Cal Grant Award Values for Full-Time Students19
Sector Cal Grant ACal Grant B (first year)
Cal Grant B (subsequent year)
california community colleges* n/a $1,656 $1,656
University of california $12,240 $1,656 $13,896
california state University $5,472 $1,656 $7,128
nonprofit colleges $9,084 $1,656 $10,740
For-profit colleges $4,000 $1,656 $5,656
*For 2015-16, full-time cal Grant B recipients at california community colleges also received a $600 grant supplement, funded outside of the cal Grant program.
3

SPRING 2016 / The INSTITuTe foR ColleGe ACCeSS & SuCCeSS
› Tuition and fees are different across college types, as is the value of Cal Grant awards. However, total college costs, which include books, transportation, and living expenses, are not as different.
THE VALUE OF CAL GRANTSas noted above, the tuition awards for students at the University of california (Uc) and the california state University (csU) are tied to actual tuition charged, and the grant level increases when tuition increases. other award amounts are specified each year in the annual budget act, and in some cases set in statute. With some grants increasing automatically and contributing to sharply growing program costs, lawmakers have historically been reluctant to add more to program costs by increasing the other award amounts voluntarily. For many low-income cal Grant recipients, and cal Grant B recipients in particular, this means their awards have stagnated over the decades. the original cal Grant B access award was $900 in 1969-70, equal to about $6,200 in 2015 dollars. instead, even after recent increases, the maximum 2015-16 access award of $1,656 is just a quarter of that amount.21
› Lower income Cal Grant recipients generally receive money for educational costs beyond tuition and fees. This stipend was worth $900 in 1969-70, the year of its inception.
Full-Time 2015-16 Costs and Cal Grants
Berkeley City College
CSU East Bay
UC Berkeley
California College of the Arts
tuition and systemwide Fees $1,104 $5,472 $12,240 $43,248
total college costs $19,005 $22,983 $27,306 $59,818
maximum 1st-year cal Grant $1,656* $5,472 $12,240 $9,084
share of total costs covered by maximum 1st-year cal Grant 9% 24% 45% 15%
*For 2015-16, full-time cal Grant B recipients at california community colleges also received a $600 grant supplement, funded out-side of the cal Grant program. including this supplement in the calculation above would increase the share of total costs at Berkeley city college covered by the maximum 1st-year cal Grant from 9% to 12%.
For 2015-16, the cal Grant B access award is worth $1,656 – ONE QUARTER of what the original award would be worth had it kept pace with inflation.
it is important to note that the differing value of cal Grant awards is related to differences in tuition, not other college costs. across the example colleges below, maximum first-year cal Grants cover between nine and 45 percent of total college costs.20
4

How and wHy to Improve Cal Grants: Key FaCts and reCommendatIons
the impact of these trends is evident in the chart below, which shows program spending by college segment.22 cal Grant expenditures at Uc and csU have increased substantially, particularly during years in which tuition increased sharply. cal Grant expenditures at community colleges and private colleges – where grant amounts have not changed significantly – have not grown at nearly the same pace. the introduction of cal Grant institutional eligibility standards, discussed on page 2, is the primary cause of the decrease in cal Grant spending at for-profit colleges.
› Cal Grants automatically cover tuition and fees for recipients attending UC and CSU. This is where the majority of growth in the Cal Grant program has occurred in the last decade (2015 dollars).
5
Uc - University of california
csU - california state University
ccc - california community colleges
nonprofits
For-Profits
overall
2001-2002 2015-20162008-2009
522%
402%
115%
195%
-1%
-66%
SPRING 2016 / The INSTITuTe foR ColleGe ACCeSS & SuCCeSS6
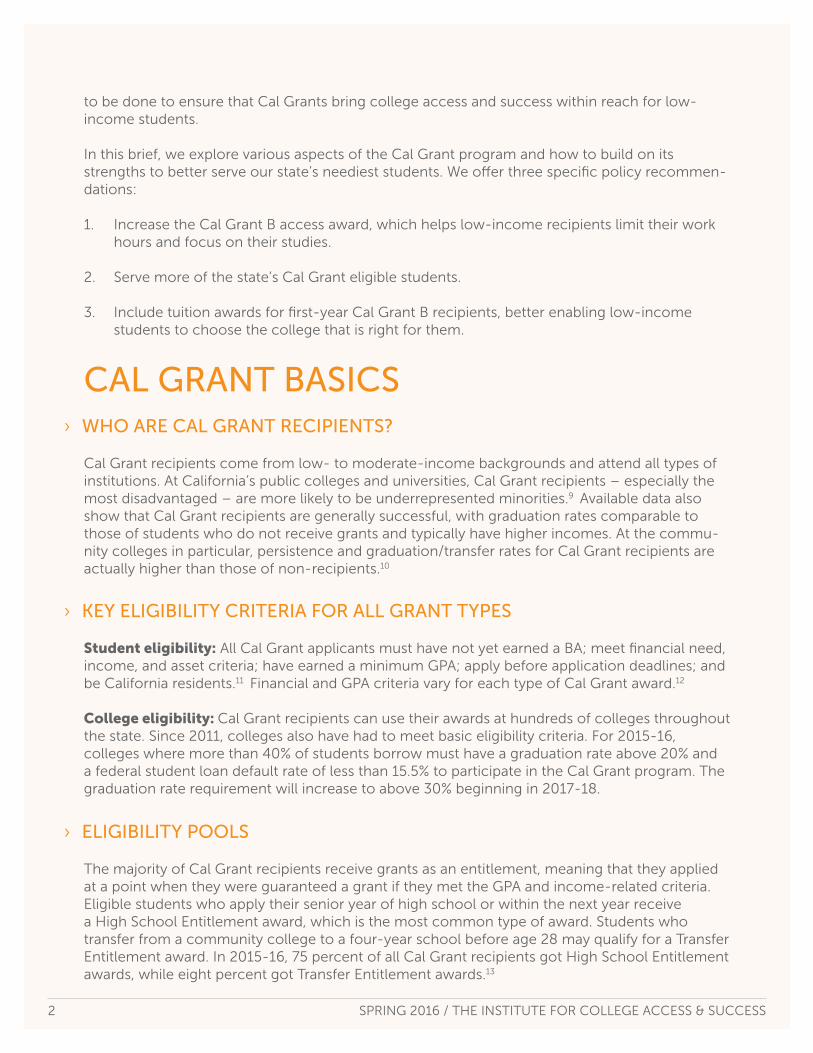
these trends have exacerbated disparities in the distribution of college students, cal Grants, and cal Grant dollars. to some extent, these disparities were predictable, as cal Grant award amounts have always been based primarily on tuition amounts, and therefore provided more assistance to colleges with higher tuition charges. However, they have widened in ways that leg-islators may not have envisioned. For instance, in 2001-02, Uc accounted for five percent of un-dergraduate enrollment and received 27 percent of cal Grant funding.23 in more recent years, Uc enrolled a similarly low share (six percent in 2013-14) of undergraduate enrollment and received 44 percent of cal Grant funding (2014-15), whereas the cccs enrolled 65 percent of students (2013-14) accounting for just seven percent of cal Grant funding (2014-15).24
› California college students, Cal Grant awards, and Cal Grant dollars are not distributed evenly across colleges.
STUDENTS CAL GRANTS DOLLARS
csU - california state University
Uc - University of california
ccc - california community colleges
nonprofits
For-Profits
65%13%
6%
9%
6%
31%
21%
36%
9%2%
44%34%
13%2% 7%

How and wHy to Improve Cal Grants: Key FaCts and reCommendatIons 7
many students – including recent high school graduates and students who transfer from community colleges before age 28 – are “entitled” to cal Grant awards so long as they apply before the deadline and meet eligibility criteria. For types of cal Grants that are not entitlements, eligible students compete for a defined number of awards. applicants’ odds of receiving a grant offer through these competitive processes vary, from 100 percent in the cal Grant c program where the number of applicants and available awards are similar, to less than 10 percent in the competitive cal Grant program where the number of applicants vastly exceeds the number of available awards.
each figure below represents 10,000 eligible cal Grant applicants in 2014-15, with orange figures representing applicants offered awards and gray figures representing those not offered awards. among High school entitlement, transfer entitlement, and cal Grant c applicants, all eligible applicants were offered awards. among applicants for competitive cal Grants, fewer than 10 percent of eligible applicants were offered awards. the number of eligible competitive cal Grant applicants who do not receive award offers – about 280,000 – exceeds the total number of applicants offered cal Grants of any kind.
among the eligible applicants not offered competitive cal Grants:26
• more than 160,000 had an eFc of zero, meaning that the federal government estimated they could not afford to put any financial resources towards paying for college.
• more than 140,000 had family incomes below the federal poverty line for their household size.
• more than 28,000 were single parents.
the number of competitive awards was increased for 2015-16 from 22,500 to 25,750, the first augmentation since the competitive program’s inception in 2001-02. even after this increase, there will still be more than ten eligible applicants for each available award.
WHO DOESN’T RECEIVE A CAL GRANT?
› Eligible New Cal Grant Applicants and Offers by Grant Type, 2014-1525
Cal Grant C:
Transfer Entitlement:
High School Entitlement:
Competitive Grants:
= 10,000 eligible applicants offered awards = 10,000 eligible applicants not offered awards

SPRING 2016 / The INSTITuTe foR ColleGe ACCeSS & SuCCeSS8
Providing $2 billion in need-based grant aid to more than 340,000 students throughout the state, the cal Grant program is an incredibly important part of california’s higher education system.27 However, our findings disprove two common myths about the cal Grant program: that it serves all the neediest students in the state, and that it sufficiently addresses their college costs.
to reach the state’s needs for college enrollment and completion, we must continue to strengthen the cal Grant program. informed by the data and analysis included in this brief, we recommend three ways to make cal Grants more equitable and effective:
1. increase the cal Grant B access award, which helps low-income recipients limit their work hours and focus on their studies.
2. serve more of the state’s cal Grant eligible students.
3. include tuition awards for first-year cal Grant B recipients, better enabling low-income students to choose the college that is right for them.
california cannot get ahead by leaving its neediest students behind. incremental changes to the cal Grant program have been made in recent years, to increase non-tuition grants and serve more students, but this brief documents how far the state still has to go to support equitable student access and success. improving the cal Grant program alone will not solve california’s college completion and workforce challenges, but it will better position california to once again fulfill its longstanding promise of educational opportunity for all.
CONCLUSION

How and wHy to Improve Cal Grants: Key FaCts and reCommendatIons 9
1 calculations by ticas using data from the U.s. department of education, national center for education statistics, integrated Postsecondary education data system (iPeds) 2014-15 Graduation Rate survey and iPeds 2013-14 institutional characteristics survey. this figure is the weighted average of graduation rates for first-time, full-time degree/certificate-seeking undergraduate students starting in 2011-12 at two-year and less-than-two-year schools, and first-time, full-time bachelor’s degree-seeking students starting in 2008-09 at four-year colleges. Graduating on time means completing a certificate or degree within 100 percent of normal time at the same institution where the student started as a first-time student.
2 the Pell institute for the study of opportunity in Higher education and the University of Pennsylvania alliance for Higher education and democracy (PennaHead). 2015. Indicators of Higher Education Equity in the United States: 45 Year Trend Report, 2015 Revised Edition. http://www.pellinstitute.org/downloads/publications-indicators_of_Higher_education_equity_in_the_Us_45_year_trend_Report.pdf. Bailey, martha J. and susan m. dynarski. 2011. Gains and Gaps: Changing Inequality in U.S. College Entry and Completion. national Bureau of economic Research. Working Paper 17633. http://www.nber.org/papers/w17633.pdf.
3 the campaign for college opportunity. 2015. The State of Higher Education in California—Black Report. http://collegecampaign.org/wp-content/uploads/2015/05/2015-state-of-Higher-education_Blacks.pdf. the campaign for college opportunity. 2015. The State of Higher Education in California—The Latino Report. http://collegecampaign.org/wp-content/uploads/2015/04/2015-state-of-Higher-education_Latinos.pdf. moore, colleen and nancy shulock. 2010. Divided We Fail: Improving Completion and Closing Racial Gaps in California’s Community Colleges. institute for Higher education Leadership & Policy. http://lead.csusb.edu/documents/dividedWeFailFinal.pdf.
4 california competes. 2015. Mind the Gap: Delivering on California’s Promise for Higher Education. http://californiacompetes.org/wp-content/uploads/2015/12/mind-the-Gap.pdf.
5 For more on the relationship between financial aid, unmet need, and academic success, see: Goldrick-Rab, sara, douglas n. Harris, Robert Kelchen, and James Benson. 2012. Need-Based Financial Aid and College Persistence: Experimental Evidence from Wisconsin. http://bit.ly/12iy97R. Bettinger, eric. 2010. Need-Based Aid and Student Outcomes: The Effect of the Ohio College Opportunity Grant. http://www.sesp.northwestern.edu/docs/need-based-aid-why.pdf. chen, Rong and stephen L. desJardins. 2008. Exploring the Effects of Financial Aid on the Gap in Student Dropout Risks by Income Level. Research in Higher education. Vol. 49, no. 1. http://eric.ed.gov/?id=eJ785256. noel-Levitz. 2007. Access Alert: How the Neediest Students Can Gain Access and Succeed Through Strategic Financial Aid Awarding. http://bit.ly/Xa0gtq. titus, marvin a. 2006. No College Student Left Behind: The Influence of Financial Aspects of a State’s Higher Education Policy on College Completion. the Review of Higher education, Vol. 29, no. 3. http://eric.ed.gov/?id=eJ744090. Bettinger, eric. 2004. How Financial Aid Affects Persistence from College Choices: The Economics of Where to Go, When to Go, and How to Pay for It. national Bureau of economic Research. Working Paper 10242. http://www.nber.org/papers/w10242. Heller, donald. 2003. Informing Public Policy: Financial Aid and Student Persistence. WicHe. http://www.wiche.edu/info/publications/informingPublicPolicy.pdf.
6 For more on how working long hours can impede academic success, see: Zomer, saffron. 2009. Working Too Hard to Make the Grade: How Fewer Work Hours and More Financial Aid Can Help California Community College Students Succeed. caLPiRG. http://www.
uspirg.org/sites/pirg/files/reports/workingtoohard.pdf. King, Jacqueline e. 2002. Crucial Choices: How Students’ Financial Decisions Affect Their Academic Success. american council on education. http://eric.ed.gov/?id=ed469585. orszag, Jonathan m., Peter R. orszag, and diane m. Whitmore, commissioned by UPromise, inc. 2001. Learning and Earning: Working in College. http://www.brockport.edu/career01/upromise.htm.
7 total cal Grant program costs of $2 billion can be found in the Governor’s 2016-17 Proposed Budget summary, available at: http://www.ebudget.ca.gov/2016-17/pdf/Budgetsummary/Highereducation.pdf.
8 cochrane, debbie. 2015. Testimony of Debbie Cochrane, Research Director: The Institute for College Access & Success, as Prepared for Delivery. ticas. http://ticas.org/sites/default/files/pub_files/cochrane_assembly_budget_sub2_testimony.pdf.
9 calculations by ticas of underrepresented minorities (african american, Latino, Pacific islander, native american) based on 2010-11 data provided by the california community colleges, the california state University, and the University of california; and on 2010-11 data from the california community colleges chancellor’s office’s data mart.
10 calculations by ticas of success rates based on data provided by the california community colleges, the california state University, the University of california, and the california student aid commission (csac). For more on student success rates see cochrane, debbie. 2012. Testimony of Debbie Cochrane, Program Director: The Institute for College Access & Success, as Prepared for Delivery. ticas. http://ticas.org/sites/default/files/pub_files/FinaL_dFc_testimony_for_asm_Budget_sub2_hearing_3-7-12.pdf.
11 Per the california dream act of 2011, aB 540-eligible students are now included.
12 Key eligibility criteria found in california education code, sections 69430-69433.9. http://www.leginfo.ca.gov.
13 calculations by ticas based on data from the california department of Finance: California Student Aid Commission, The Cal Grant Chart: Baseline Budget Forecast thru end of Sep 2015 – updated November 20, 2015.
14 ibid.
15 Given the size and highly targeted focus of cal Grant c awards, this program is not a focus of our report.
16 calculation by ticas based on data from the california department of Finance: California Student Aid Commission, The Cal Grant Chart: Baseline Budget Forecast thru end of Sep 2015 – updated November 20, 2015. Unlike tuition coverage, cal Grant B recipients receive the access award beginning their first year of college.
17 For the remainder of this brief we refer to “systemwide tuition and fees” as “tuition”.
18 Up to two percent of new High school entitlement cal Grant B recipients may receive tuition awards in their first year.
19 maximum cal Grant amounts available at http://www.csac.ca.gov/doc.asp?id=905 and http://leginfo.legislature.ca.gov/faces/billnavclient.xhtml?bill_id=201520160sB97. since 2013-14, the maximum cal Grant for recipients at Wasc-accredited for-profits has been the same as the maximum award at nonprofit colleges.
20 tuition/systemwide fees and total cost of attendance
for full-time students, living off-campus without parents, who attend csU east Bay, Uc Berkeley, and california college of the arts are those published on the colleges’ websites. as Berkeley city college did not publish a total student budget for 2015-16, ticas calculated systemwide fees and total cost of attendance for the college using published system fees ($46/unit at 24 units) and other educational costs estimated by csac: 2015-16 Student Expense Budgets. ticas assumes cal Grant a awards for all students except ccc students who receive cal Grant B.
21 calculation by ticas of cal Grant B access award value based on data from the california Postsecondary education commission. 2010. Fiscal Profiles 2010. display 45. http://www.cpec.ca.gov/completereports/2010reports/10-22/42-46.pdf. 1969-70 figure adjusted for inflation using the california consumer Price index. http://www.dir.ca.gov/oPRL/cPi/entireccPi.PdF. the 2015-16 maximum access award includes $8 from the college access tax credit Fund, in addition to the budgeted amount.
22 calculations by ticas of inflation-adjusted growth in cal Grant dollars based on data provided by csac in 2012 and 2015; data provided by the california department of Finance (doF) in January 2016; and the california consumer Price index, available at: http://www.dir.ca.gov/oPRL/cPi/entireccPi.PdF. 2014-15 and 2015-16 doF data include the institutional category “Public-other,” which we’ve grouped with community colleges. this segment accounts for less than 1% of total cal Grant funding in either year. 2015-16 doF data does not include moneys from the college access tax credit Fund.
23 ticas calculated share of 2001-02 enrollment based on iPeds data. ticas calculated share of 2001-02 cal Grant funding based on data provided by csac in september 2012.
24 calculations by ticas of shares of 2014-15 cal Grant awards and dollars, by sector, based on data from the california department of Finance: California Student Aid Commission, The Cal Grant Chart: Baseline Budget Forecast thru end of Sep 2014 – updated July 24, 2015 (Budget Act of 2015). ticas calculations of shares of undergraduates enrolled in 2013-14 based on the latest data available from iPeds. Because enrollment in less-than-2-year public colleges comprises such a small share of total undergraduate enrollment (less than 1%), those figures were grouped with public 2-year college enrollment. due to rounding, totals may not equal 100%.
25 calculations by ticas based on data provided by the california Legislative analyst’s office in February 2016, along with the following sources: csac. 2015. Exhibit 9: Update on Community College Transfer Cal Grant Entitlement Program. http://www.csac.ca.gov/comm/sppc/20150416/exh9.pdf; csac. 2015. Exhibit 16: Presentation on High School Graduation Certification. http://www.csac.ca.gov/comm/sic/20150416/exh16.pdf; cochrane, debbie. 2015. testimony of Debbie Cochrane, Research Director. The Institute for College Access & Success, As Prepared for Delivery. http://ticas.org/sites/default/files/pub_files/cochrane_assembly_budget_sub2_testimony.pdf; La Rocque, matthew and debbie cochrane. 2015. Modeling Changes to the Competitive Cal Grant Scoring Matrix. ticas. http://ticas.org/sites/default/files/pub_files/ticas_competitive_cal_grant_modeling_memo_0.pdf.
26 cochrane, debbie. 2015. Testimony of Debbie Cochrane, Research Director. The Institute for College Access & Success, As Prepared for Delivery. http://ticas.org/sites/default/files/pub_files/cochrane_assembly_budget_sub2_testimony.pdf.
27 california department of Finance: California Student Aid Commission, The Cal Grant Chart: Baseline Budget Forecast thru end of Sep 2015 – updated November 20, 2015.
CITATIONS

SPRING 2016 / The INSTITuTe foR ColleGe ACCeSS & SuCCeSS
405 14th Street, Suite 1100 Oakland, CA 94612
510.318.7900
110 Maryland Avenue, N.E., Suite 112Washington, DC 20002
202.223.6060
[email protected] www.ticas.org
Bay Area CouncilCalifornia Community College Association of Student TrusteesCalifornia CompetesCalifornia EDGE CoalitionCalifornia Homeless Youth ProjectCalifornia State Conference of the NAACPCALPIRGCalifornia State Student AssociationThe Campaign for College OpportunityEARNThe Education Trust–West The Institute for College Access & SuccessLos Angeles Area Chamber of CommerceMALDEFNAACP Los AngelesPublic Advocates Inc.Southern California College Access NetworkStudent Senate for California Community CollegesuAspireUniversity of California Student AssociationYoung Invincibles
Cosponsors of this report include the following members of CALIFORNIANS FOR COLLEGE AFFORDABILITY: