how are we going to intervene in elevated lp(a)? from ... · how are we going to intervene in...
TRANSCRIPT
How are we going to intervene in
elevated Lp(a)?
From PCSK9 to mRNA inhibition
Sotirios (Sam) Tsimikas, MD
Director of Vascular Medicine
Professor of Medicine
University of California San Diego
Cardiovascular Franchise Leader
Isis Pharmaceuticals, Inc.
ISA 2015
May 25 2015

Lp(a) a risk factor in patients on
long term statin therapy in the current era
LIPID
JUPITER
AIM HIGH


AIM-HIGH
Lp(a) remains a predictor of CVD events in patients with
normal Lp(a) levels (13 mg/dl) and LDL-C of 54 mg/dl
Albers et al
JACC 2013

Apheresis for elevated Lp(a)
CVD with recurrent events
Refractory angina
Calcific aortic valve stenosis
FH with elevated Lp(a)
End stage renal disease
Post ACS
Pediatric stroke
Secondary prevention
Primary prevention
Potential Clinical Indications for Lp(a)
Lowering

○ Statins
○ Low fat diets
○ Garlic supplements
○ Growth hormone
Clinically available○ LDL apheresis○ Niacin○ Fish oil○ Mipomersen○ IL-6 antagonists○ ? Aspirin○ ? Lomitapide
Investigational○ PCSK9 Inhibitors○ CETP Inhibitors○ ASO to apo(a)
Other○ Thyroid analogues○ Oral estrogen/tamoxifen○ Anabolic steroids○ Neomycin○ N-acetylcysteine○ L-carnitine
Increase Decrease
Therapeutic Agents Affecting Lp(a) Levels

160626.038/020131YlsjoLS
1
-22% -21%
29%30%
10%
-44%-39%
-5%
-26%
-3%
-30%
-50
-40
-30
-20
-10
0
10
20
30HDL-C
LDL-C
Lp(a)
TG
500 mg 1000 1500 2000 2500 3000
Ch
an
ge
fro
m B
as
elin
e
-8%-13%
-16%
24%21%
16%
-21%
-32%
-14%
-12%
-25%
-17%
Extended-Release Nicotinic Acid:
Data from Pivotal Placebo-Controlled
Studies

Effect of diet, drug therapy and apheresis on
LDL-C
Time
LDL-C
Time Average (35%)
Diet Therapy
Apheresis Treatment
Pre
Post
Diet & Drug Therapy

The effect of Lp(a) lowering by lipid apheresis in
very high-risk patients with recurrent events

Jaeger BR et al. Nat Clin Pract Cardiovasc Med. 2009 Mar;6(3):229-39.
MACE during lipid-lowering medication alone and duringcombined lipid-lowering medication and lipid apheresis
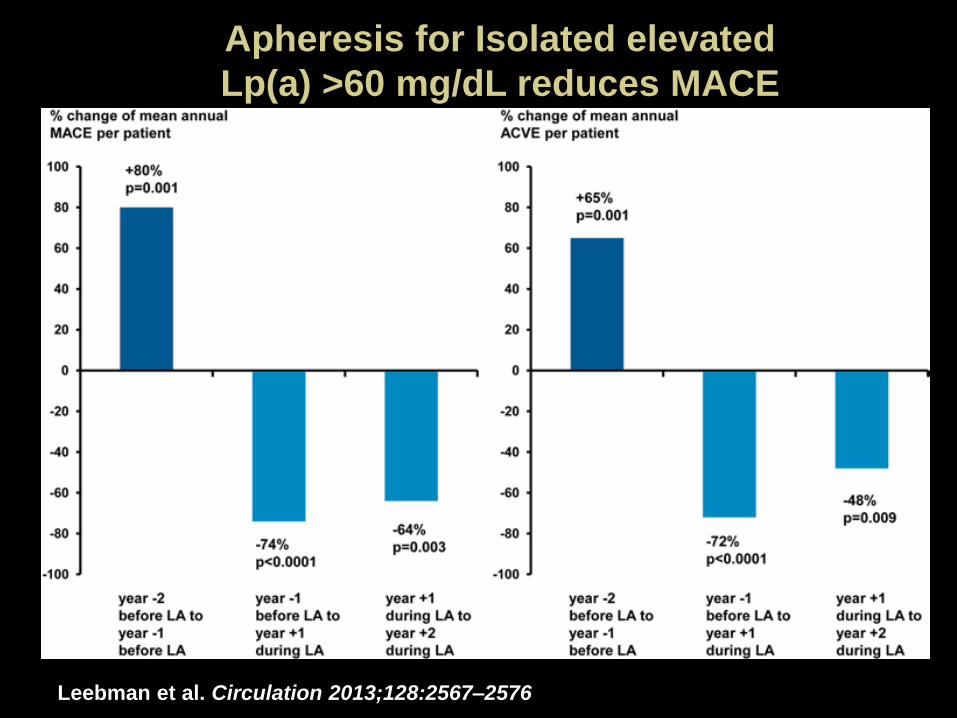
Apheresis for Isolated elevated
Lp(a) >60 mg/dL reduces MACE
Leebman et al. Circulation 2013;128:2567–2576

A
Me
dia
n p
erc
en
tage
Lp
(a)
chan
ge f
rom
bas
elin
e
(LO
CF)
Pooled placeboPooled alirocumab 150 mg Q2W
-40
-35
-30
-25
-20
-15
-10
-5
0
All patients
≤30 mg/dl
>30 mg/dl
≤50 mg/dl
>50 mg/dl
Baseline Lp(a)
n=74 n=102 n=43 n=51 n=31 n=51 n=49 n=68 n=25 n=34
*
**
*
*
B
Me
dia
n L
p(a
) ch
ange
fro
m b
ase
line
(m
g/d
L; L
OC
F)
-30
-25
-20
-15
-10
-5
0
All patients
≤30 mg/dl
>30 mg/dl
≤50 mg/dl
>50 mg/dl
Baseline Lp(a)
n=74 n=102 n=43 n=51 n=31 n=51 n=49 n=68 n=25 n=34
*
*
*
*
*P<0.0001 vs. placebo†P<0.001 vs. placebo
†
Effect of alirocumab on Lp(a)

R-square: 0.0463Spearman’s correlation coefficient: 0.2236p=0.0298
50
0
-100
Lp(a
) %
ch
ange
fro
m b
ase
line
-40
LDL-C % change from baseline
-50
-80 -60
FitIndividual measurements 95% prediction limits95% confidence limits
Lp(a) change from baseline (%) vs. LDL-C change
from baseline in alirocumab treatment group

Reduction in Lipoprotein(a) With PCSK9
Monoclonal Antibody Evolocumab

Weak correlation between change in Lp(a) and
change LDL-C and apoB With Evolocumab

What is the mechanism of Lp(a)
reduction by PCSK9 antibodies?
Unknown
Unlikely to be decreased apo(a) synthesis
PCSK9 may regulate an Lp(a) receptor or directly prevent clearance of apo(a) and PCSK9 antibodies interfere with this process
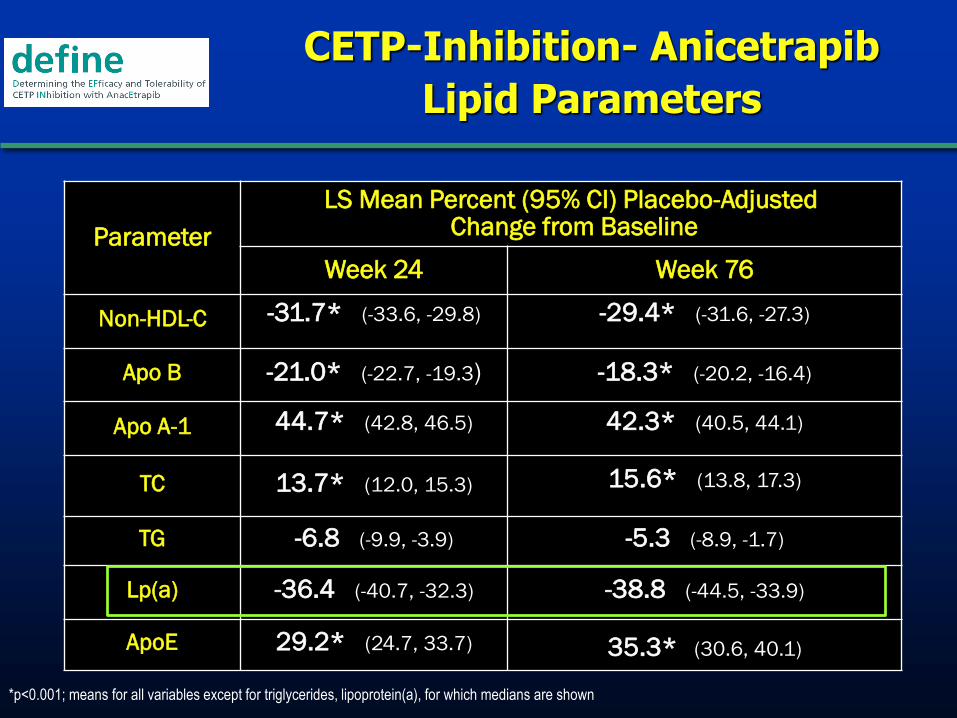
CETP-Inhibition- Anicetrapib
Lipid Parameters
Parameter
LS Mean Percent (95% CI) Placebo-AdjustedChange from Baseline
Week 24 Week 76
Non-HDL-C -31.7* (-33.6, -29.8) -29.4* (-31.6, -27.3)
Apo B -21.0* (-22.7, -19.3) -18.3* (-20.2, -16.4)
Apo A-1 44.7* (42.8, 46.5) 42.3* (40.5, 44.1)
TC 13.7* (12.0, 15.3) 15.6* (13.8, 17.3)
TG -6.8 (-9.9, -3.9) -5.3 (-8.9, -1.7)
Lp(a) -36.4 (-40.7, -32.3) -38.8 (-44.5, -33.9)
ApoE 29.2* (24.7, 33.7) 35.3* (30.6, 40.1)
*p<0.001; means for all variables except for triglycerides, lipoprotein(a), for which medians are shown
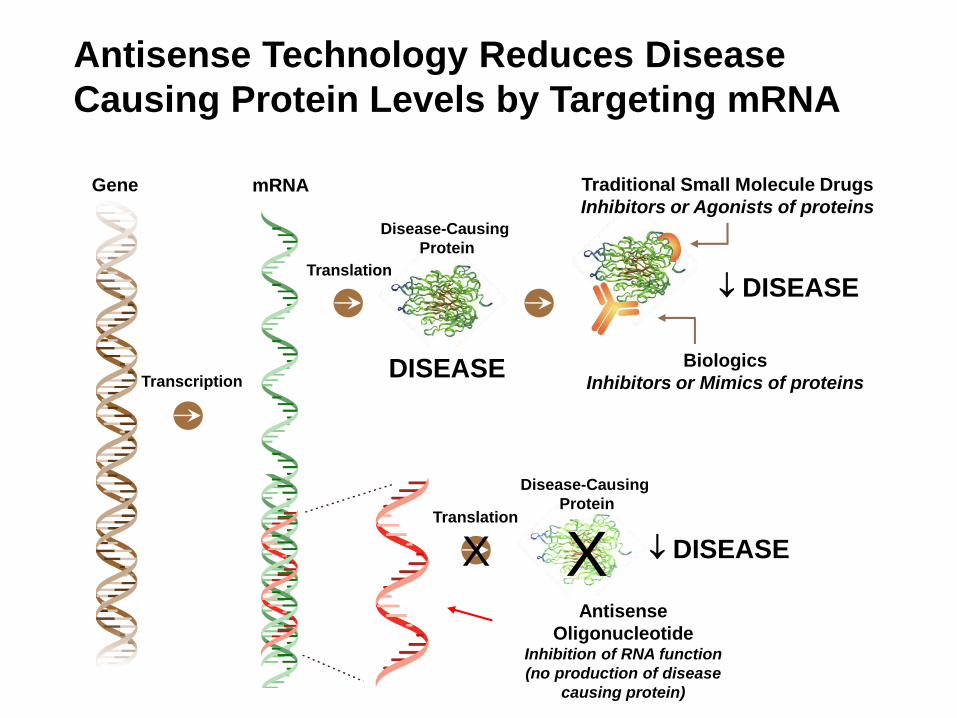
Antisense Technology Reduces Disease
Causing Protein Levels by Targeting mRNA
Gene mRNA
Transcription
Translation
DISEASE
Traditional Small Molecule Drugs
Inhibitors or Agonists of proteins
Biologics
Inhibitors or Mimics of proteins
DISEASE
Disease-Causing
Protein
DISEASEX XTranslation
Disease-Causing
Protein
Antisense
OligonucleotideInhibition of RNA function
(no production of disease
causing protein)

Antisense Mechanism of Action
RNase H1 Terminating Mechanism
Specific sequence not repeated throughout genome,
reducing potential for off-target binding

Second Generation 2'-MOE Gapmer ChemistryIncreased Affinity, Stability, Tolerability and Simple Formulation
Clinical Experience
Kynamro approved by the FDA
>6000 subjects dosed(IV/SC)
>100 clinical studies
Multiple therapeutic indications
>140 patients dosed for >1 year
Some patients dosed for 4 years
Doses as high as 1200 mg tolerated
MOE DNA
Chimeric RNaseH ASO Design
↑ affinity
↑ stability
↑ tolerability
↑ affinity
↑ stability
↑ tolerabilityRNase H Substrate
2’-O-methoxyethyl (MOE)
OB
O
O
B
O
O
B
O
O
O
B
O
O
OP
O
O
OP
O
B
O
OP
O
OP
O
OP
OMe
OO
Me
OO
Me
OO
Me
OO
MeX = S, O
-X
-X
-X
-X
-X
MOE

Evolution of Antisense Chemistries
1st GenerationPhosphorothioate (PS)
2nd GenerationMOE Gapmer
Chemistry
Attributes
Adds stability
Improves distribution
to tissues
Increases potency
Increases stability
Reduces non-specific
toxicities
Potency 1200 to 3500 mg/week ~100 to 400 mg/week
Dose Frequency Daily to 3x/week Weekly to monthly
Cost of Therapy Between branded small
molecules & antibodies
Competitive with upper
end of small molecules
Routes of
Administration
I.V., enema, intravitreal Sub Q, I.V., inhalation,
topical, intrathecal

Asialoglycoprotein Receptor (ASGPR) –Identification and Characterization
ASGPR is abundantly expressed by mammalian hepatocytes
500,000 – 1 million copies per cell
Requires calcium for ligand binding
Functional receptor is comprised of two subunits, HL-1 and HL-2
Maintains serum glycoprotein levels by endocytosing desialylated glycoproteins with
terminal galactose or GalNAc residues
Specificity for galactose and N-acetylgalactosamine(GalNAc, GN) terminated
oligosaccharides
Highest affinity for tri- and tetra-antennary ligands
Affinity for GalNAc ligands with low nM affinity
GalNAc conjugated ASOs improve potency for
liver targets by 7-10x in mice
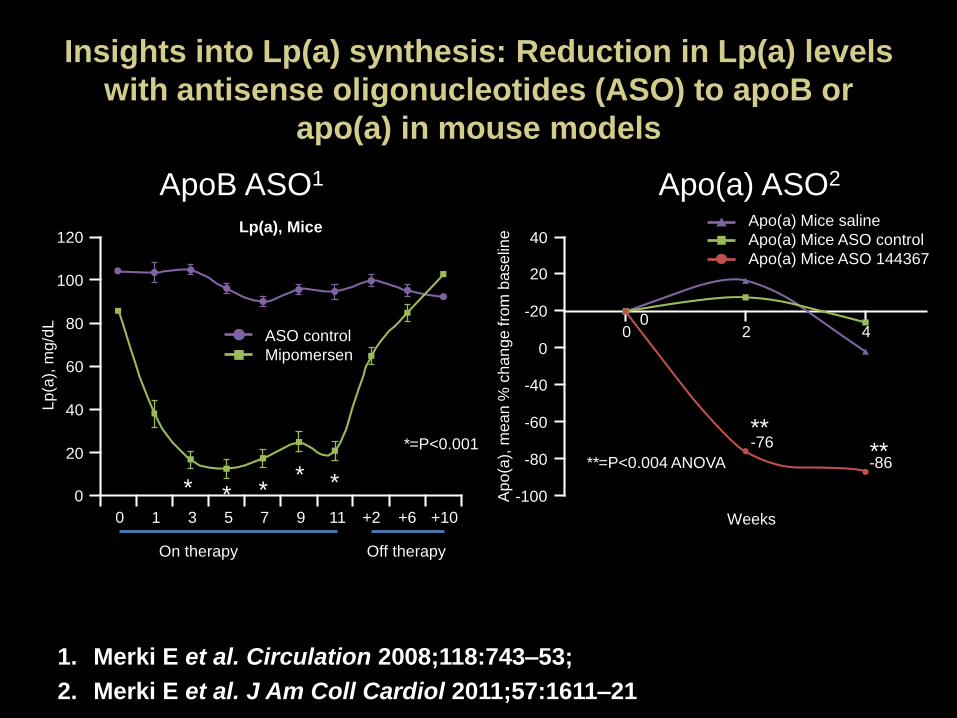
ApoB ASO1 Apo(a) ASO2
Insights into Lp(a) synthesis: Reduction in Lp(a) levels
with antisense oligonucleotides (ASO) to apoB or
apo(a) in mouse models
1. Merki E et al. Circulation 2008;118:743–53;
2. Merki E et al. J Am Coll Cardiol 2011;57:1611–21
Apo(a) Mice saline
Apo(a) Mice ASO control
Apo(a) Mice ASO 144367
40
20
0
-20
-40
-60
-80
-100Ap
o(a
), m
ea
n %
ch
an
ge
fro
m b
ase
line
Weeks
**=P<0.004 ANOVA
00
2 4
-76
-86
Lp
(a),
mg/d
L
120
100
80
60
40
20
0
0 5 7 111 3 +2 +6 +109
*=P<0.001
ASO control
Mipomersen
Lp(a), Mice
On therapy Off therapy
****
* * ** *

Santos ATVB 2015
Mipomersen, an Antisense Oligonucleotide to Apolipoprotein B-
100, Reduces Lipoprotein(a) in Various Populations with
Hypercholesterolemia: Results of 4 Phase III Trials

Mipomersen reduces Lp(a) levels-
Individual Phase 3 Trials
Tsimikas et al ACC 2013

Santos EHJ 2015
Long-term efficacy and safety of mipomersen in
patients with familial hypercholesterolemia: 2-year
interim results of an open-label extension

Sustained Reductions in LDL-C, Apo B, and
Lp(a) During Long-Term Mipomersen TreatmentM
ean
% C
han
ge (
+/-
95
% C
I)
Week
LDL-C apoB Lp(a)
-45
-40
-35
-30
-25
-20
-15
-10
-5
0
26 52 104 156 208 234
130 111 57 30 27 17N=141

Mipomersen reduces Lp(a) levels-
4 Phase 3 Trials: Modest correlation between
change in LDL-C vs. change in Lp(a)
Tsimikas et al ACC 2013

Before
Mipomersen
During
Mipomersen
Patient-years 207 211
Observation Time, years * 1.99 (0.01) 2.03 (0.73)
Total Events 146 12
MI 39 2
PCI/CABG 99 6
Unstable Angina 5 4
Stroke 3 0
Incidence, n (%) 64 (61.5%) 9 (8.7%)
MACE Rate † 25.7 3.6
* Values presented are the mean (SD).† The number of patients with at least one event divided by the total follow-up time in months (X 1000).
MACE Rate was Significantly Reduced (~7 fold) in FH
Patients Treated with Mipomersen for ≥1 Year

30
Significant Reduction in MACE Incidence in FH
Patients Treated with Mipomersen for ≥1 Year
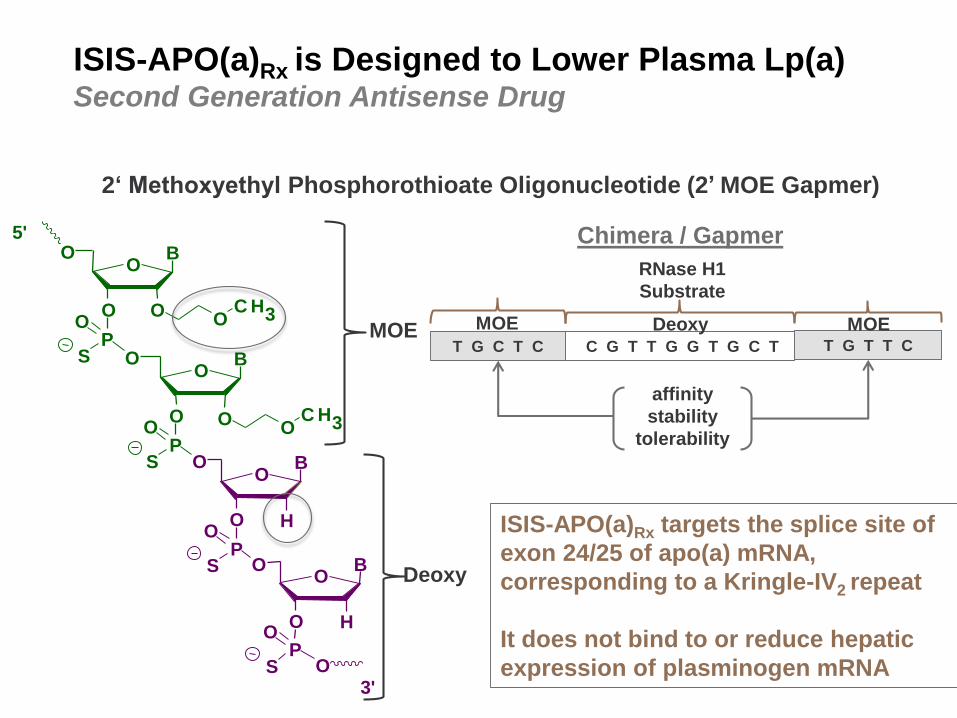
ISIS-APO(a)Rx is Designed to Lower Plasma Lp(a)Second Generation Antisense Drug
2‘ Methoxyethyl Phosphorothioate Oligonucleotide (2’ MOE Gapmer)
S
S
OO
C H3
OO
C H3
OB
O
O
B
O
O
B
O
O
B
O
O
OP
O
O
OP
S
O
OP
S
O
OP
5'
3'
H
H
Chimera / Gapmer
affinity
stability
tolerability
RNase H1
Substrate
ISIS-APO(a)Rx targets the splice site of
exon 24/25 of apo(a) mRNA,
corresponding to a Kringle-IV2 repeat
It does not bind to or reduce hepatic
expression of plasminogen mRNA
T G C T C C G T T G G T G C T T G T T C
MOE MOEDeoxyMOE
Deoxy

ISIS-APO(a)Rx
Mechanism of Action in Reducing Plasma Lp(a)
Tsimikas et al, Lancet 2015 In Press

Objectives
Evaluate the safety & tolerability of ISIS-APO(a)Rx in healthy volunteers
Evaluate effect on Lp(a) levels 2 weeks after the last dose
Exploratory Objectives
Change in lipid profile and apolipoprotein B-100 2 weeks after the last dose
Change in OxPL/apoB levels 2 weeks after the last dose
Impact of apo(a) isoforms on treatment response
Single and Multiple Ascending Dose Study Design
ISIS-APO(a)Rx Phase I in Healthy Volunteers
Randomized, Blinded, Placebo Controlled, Dose Escalation

Baseline Characteristics of Multiple Ascending
Dose Groups
Placebo
(n=6)
100 mg
(n=8)
200 mg
(n=9)
300 mg
(n=8)
Gender (M:F) 6:0 8:0 9:0 8:0
Age (yrs) 31 41 40 42
BMI (kg/m2) 24.2 27.0 24.1 26.8
Lipids & Lipoproteins
Lp(a) (nmol/L)*† 152±83 92±74 82±67 107±76
Total Cholesterol (mg/dL) 194±23.5 199±29.4 196±32.1 200±31.1
HDL-C (mg/dL) 46±6.6 49±7.5 52±14.7 51±13.6
ApoB (mg/dL) 89±15 95±19 86±23 89±17
LDL-C (mg/dL) 121±22.3 131±27.2 116±35.5 131±22.7
Triglycerides (mg/dL) 137±52.9 96±29.4 151±161.4 94±39.2
OxPL-apoB-100 (nmol/L)† 11.0±6.1 6.7±4.5 8.8±5.6 9.1±4.9
Major apo(a) isoform (#KIV repeats) 21.5±4.5 20.1±3.1 23.0±5.0 20.6±4.0
ITT population, values presented are the mean.
* Entry Criterion of Lp(a) ≥ 25 nmol/L (~10 mg/dL) for MAD cohorts
†Excludes 2 subjects who received < 3 doses of Study Drug

ISIS-APO(a)Rx Phase I Trial
Mean percent change in Lp(a) over time by treatment
group in the multiple-dose cohort
Tsimikas et al, Lancet 2015 In Press
**p<0.01
***p<0.001

ISIS-APO(a)Rx Phase I Trial Relationship of plasma ISIS-APO(a)Rx trough concentrations and mean
percent change in Lp(a), OxPL-apoB and OxPL-apo(a)
Tsimikas et al, Lancet 2015 In Press
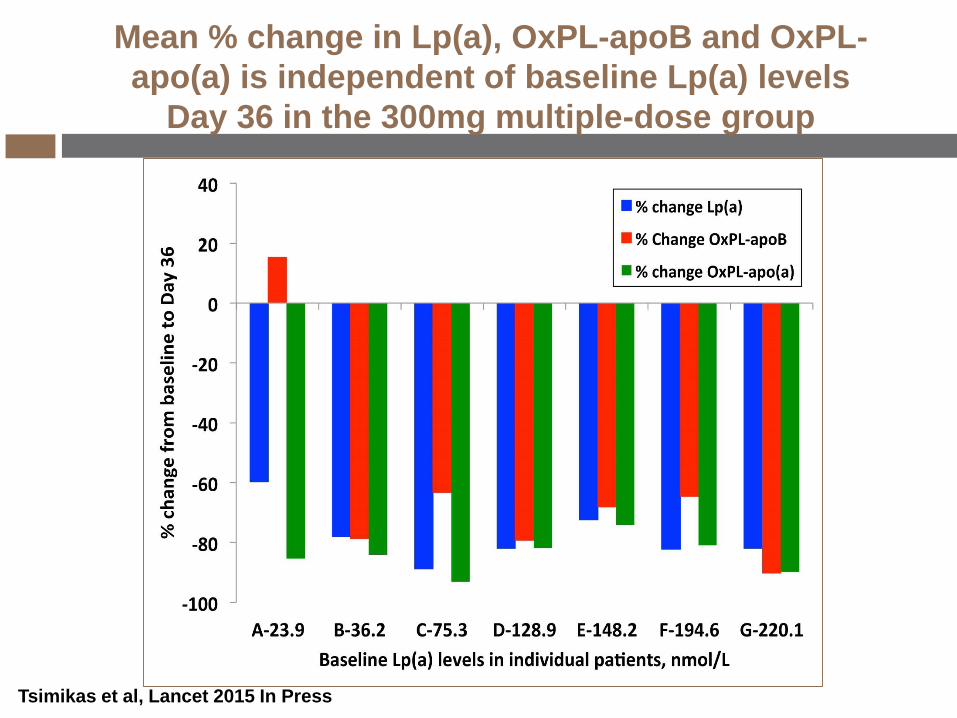
Mean % change in Lp(a), OxPL-apoB and OxPL-
apo(a) is independent of baseline Lp(a) levels
Day 36 in the 300mg multiple-dose group
Tsimikas et al, Lancet 2015 In Press
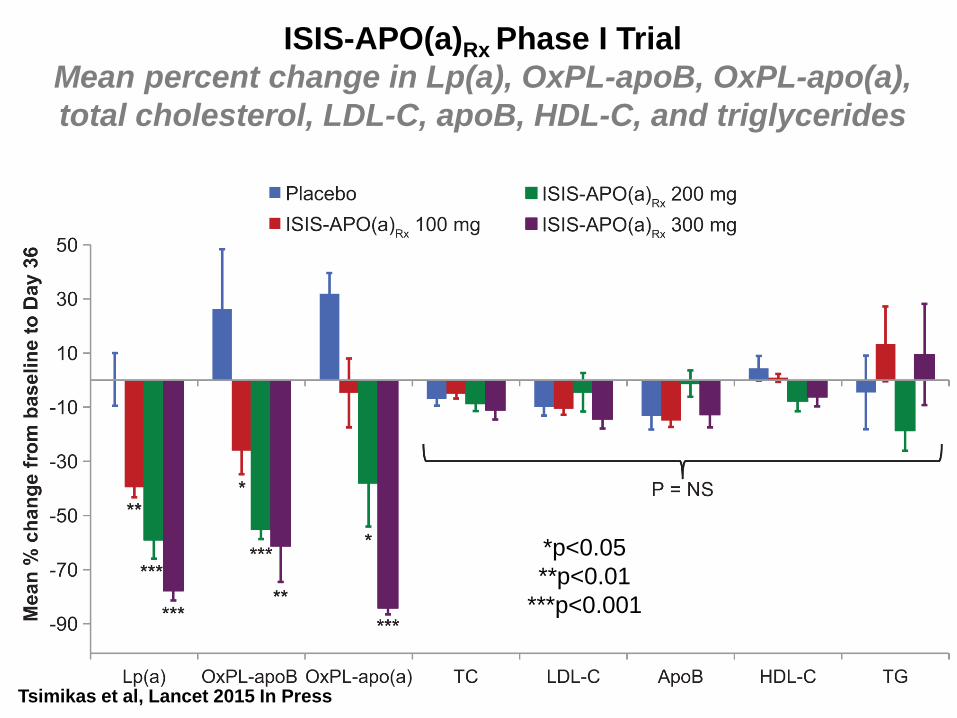
ISIS-APO(a)Rx Phase I Trial
Mean percent change in Lp(a), OxPL-apoB, OxPL-apo(a),
total cholesterol, LDL-C, apoB, HDL-C, and triglycerides38
Tsimikas et al, Lancet 2015 In Press
*p<0.05
**p<0.01
***p<0.001

Phase 2: ISIS 494372-CS3
ClinicalTrials.gov Identifier:
NCT02160899
“Safety, Tolerability, Pharmacokinetics, and
Pharmacodynamics of ISIS-APO(a)Rx in Patients
With High Lipoprotein(a)”
Isis Pharmaceuticals, Inc. – CONFIDENTIAL

Randomized, double-blind, placebo-controlled, intra-patient, dose-titration study
2 Cohorts
Cohort A: High Lp(a) (>50 mg/dl); 1:1 (active : placebo)
Cohort B: Very high Lp(a) (>175 mg/dl); 4:1 (active : placebo)
Intra-patient dose titration
Objectives
Evaluate activity of ISIS-APO(a)Rx in lowering Lp(a)
Evaluate the safety & tolerability of ISIS-APO(a)Rx
Phase 2 initiation 1H 2014
ISIS-APO(a)Rx (CS3)
Phase 2 Study in Patients with Lp(a) >50 mg/dL
Screening
Post-Treatment
f/u Period
16 weeks
R
Treatment Period
12 Weeks
28 days
100 mg200 mg
300 mg
12 weekly s.c. injections
Cohorts n
A 50
B 10

Phase 1: ISIS-APO(a)-LRx
ClinicalTrials.gov Identifier:
NCT02414594
“Safety, Tolerability, Pharmacokinetics, and
Pharmacodynamics of ISIS APO(a)-LRx in
Healthy Volunteers With Elevated
Lipoprotein(a)”
Isis Pharmaceuticals, Inc. – CONFIDENTIAL

Objectives
Evaluate the safety & tolerability of ISIS 681257 in healthy
volunteers
Evaluate effect on Lp(a) levels 2 weeks after the last dose
Evaluate PK effects of single and multiple doses of ISIS 681257
Exploratory Objectives
Change in lipid profile and apolipoprotein B-100 2 weeks after the
last dose
Change in OxPL/apoB levels 2 weeks after the last dose
Impact of apo(a) isoforms on treatment response
ISIS-APO(a)-LRx CS1 Phase I in Healthy Volunteers
(Lp(a) ≥ 75 nmol/L or ~30 mg/dL)
Randomized, Blinded, Placebo Controlled, Dose Escalation