how can education systems become equitable by...
TRANSCRIPT

1
How can education
systems become
equitable by 2030? DFID think pieces – Learning and equity
August 2015
Pauline Rose and Benjamin Alcott
2
Contents
Page 3 1. Executive summary
Page 5 2. Learning inequalities widen as children get older
Page 15 3. Tracking progress to achieve learning for all by 2030
Page 19 4. Strategies to overcome barriers in learning
Page 27 5. Improving data systems for monitoring progress in learning
Page 30 6. Conclusion
Page 31 Appendix: details of model used for Figures 4 and 5
Page 33 Bibliography
Series description
This think piece is part of a series commissioned by the UK’s Department for International
Development (DFID). The purpose of the think piece series is to stimulate international debate
on the future direction of education development in low income countries; provide direction for
future DFID research priorities; and provide evidence products that can inform policy and
programming decisions.
The other documents in the series are available to download at the following web address:
www.heart-resources.org
About the authors
Pauline Rose is Professor of International Education at the University of Cambridge’s
Faculty of Education, and Director of the Research for Equitable Access and Learning
(REAL) Centre, University of Cambridge. Pauline also holds a position as Senior Research
Fellow in DFID.
Benjamin Alcott is a Research Fellow at the University of Cambridge’s Faculty of Education.

3
1. Executive summary
The Sustainable Development Goals (SDGs) emphasise the importance of all children and
young people learning the basics by 2030, along with a commitment to ensuring noone is left
behind. This dual emphasis is needed. Enrolment has increased considerably in many low- and
lower middle-income countries over the past 15 years, in line with global commitments made as
part of the Millennium Development Goals (MDGs). However, this growth has been
accompanied by an uncomfortable realisation: being in school does not necessarily equate to
learning. Of the estimated 250 million children not learning the basics, around half have spent at
least four years in school (UNESCO, 2014a). In order to change this situation, we need to know
which children are not learning, at what stage learning gaps emerge, and whether the school
system itself is responsible for holding back their learning – or, rather, can help to narrow
learning gaps.
This paper identifies that learning inequalities start early in the primary school cycle, or even
before children start school. It further shows that achieving a target central to the SDGs, namely
ensuring all children, regardless of circumstance, are learning the basics by 2030, will require a
step-change in progress over the next 15 years that will not be achieved by ‘business as usual’.
Recognising the commitment that no target will be met unless met for all (UNESCO, 2015;
World Education Forum, 2015), particular focus is needed on those who face disadvantages
due to poverty, gender, where they live, and whether they have a disability.
To move from the current situation to achieving desired post-2015 goals by 2030, such that all
children are learning the basics in mathematics and reading, this ‘think piece’ paper proposes
five strategies that focus on supporting the learning of children from disadvantaged
backgrounds.
Key messages
Learning inequalities begin from a young age, primarily driven by disparities in wealth.
Wealth disparities interact with other forms of disadvantage, such as gender, where a
child lives and whether they have a disability.
To ensure no one is left behind by 2030, the learning of children within a selected age
group should be tracked to include those both in and out of school. A necessary target
should be that all children are able to achieve the basics in both mathematics and
reading as a route to preparing them for further learning.
Using this measure for tracking progress, stepping-stone targets should be adopted for
sub-groups of the population within countries, in order to provide an early warning to
show if disadvantaged groups are making sufficient progress in advance of the distant
2030 deadline.
Five sets of interventions are needed to raise learning outcomes and eliminate the
learning inequality gap:
o Address disadvantage from early childhood. o Ensure teaching is at the right pace for the weakest learners. o Provide disadvantaged children with the support of the best teachers. o Provide learning resources that support children learning at an appropriate pace.
4
o Empower parents and communities to hold schools and policymakers to account for poor quality education.
To keep track of learning inequalities, longitudinal household surveys are needed that
include information on children’s learning (whether in or out of school) together with
information on their characteristics. In order to identify how to tackle inequalities, such
household surveys should be established in a way that allows them to be combined with
administrative data on school conditions.
5
2. Learning inequalities widen as children get older
Evidence from rich countries shows that
learning inequalities are visible before children
start school, and that these inequalities do not
reduce during the school years (Cunha et al.,
2010). In the UK, 5-year-olds from richer
households are already on average 15 months
ahead of those from poorer households in
vocabulary development (Blanden and Machin,
2010). Cohort studies from the UK have
detected socio-economic gaps in cognitive
development by age 22 months, which then
widen throughout the primary school years (Feinstein, 2003). Evidence from a more recent
cohort study shows that 3-year-olds from high socio-economic status backgrounds are three
times more likely than those from low socio-economic backgrounds to display ‘very advanced’
development (Jerrim and Vignoles, 2013). While research across the UK and US varies
between identifying that learning disparities widen throughout schooling (Feinstein, 2003;
Goodman et al., 2009) or are simply maintained (Duncan and Magnuson, 2011; Reardon,
2011), there is no contradicory evidence that these gaps narrow.
Evidence from rich countries relates to learning trajectories for children with disabilities. Data
from the US show that the gap in mathematics achievement between the general population
and students from all disability groups widens from ages 7 to 13 (Wei et al., 2012).
We know far less about the trajectory of learning inequalities in low-and lower middle-income
countries. These countries have far fewer sources of longitudinal data, which would allow an
analysis of changes in learning over a school cycle, or of children’s experiences before they
start school. There is however, growing interest in identifying rigorous approaches to tracking
progress in learning in these contexts (Das, 2013; Muralidharan and Zieleniak, 2013; Singh,
2014).
As with rich countries, the available data in poorer countries makes clear that learning
inequalities are evident even when children start primary school, and these inequalities widen
throughout the school years. The pattern is apparent across a range of sources of inequality,
including poverty, gender, geographic location, disability, and ethnic and linguistic minority
status, with these often interacting with one other to reinforce disadvantage. This highlights the
importance of reforms to focus on tackling the difficulties that children from disadvantaged
backgrounds face that hold back their learning.
2.1 Few children are learning at the level appropriate for their grade.
Available evidence shows that children are often far below the level expected for their grade,
and once they fall behind, they often find it difficult to catch up. Data from a range of learning
assessments in India indicate that only between 9 and 13% of those who lack a basic literacy
or numeracy skill are able to gain this skill after an additional year of schooling (Bhattacharjea
et al., 2011; Educational Initiatives, 2010; Pritchett and Beatty, 2015).
Key messages
Learning inequalities begin from a young
age, primarily driven by disparities in
wealth.
Wealth dispartiies interact with other
forms of disadvantage such as gender,
where a child lives and whether they
have a disability.

6
A longitudinal study in Andhra Pradesh, India, tracking a cohort of students over a school cycle
finds that only 2.4% of Grade 1 students achieve the Grade 1 standard. Even by Grade 5, only
60% of these students have achieved the Grade 1 level, and only 8% achieve the Grade 5 level.
The study further finds that the gap between the top-performing and bottom-performing students
widens in later grades and that most learning happens in Grades 1 and 2. It is suggested that
this could be attributed to instruction being better aligned in early grades and that, by Grade 3,
children are expected to ‘read to learn’, meaning that those who are not yet able to read get left
further behind. As such, the system caters mainly to the top 10% of students who are the only
ones able to keep pace with the curriculum, while the bottom 10% could be spending several
years in school with little benefit in terms of their learning (Muralidharan and Zieleniak, 2013).
2.2 Household wealth is a key determinant of widening learning
inequalities.
Longitudinal data from Young Lives1 highlights the importance of household wealth in the early
years for subsequent learning. In Peru, for example, a child’s family wealth at age 1 explains
32% of the variability in children’s performance in mathematics in Grade 4 (Cueto et al., 2014).
Furthermore, in all four of the Young Lives countries (Ethiopia, Peru, Vietnam, and Andhra
Pradesh, India), the richest quartile makes more progress than the poorest quartile in
mathematics between ages 5 and 8. By age 8, there is a gap of 27 percentage points in the
proportion of children able to read a sentence between richer (86%) and poorer (59%) children
in Peru, and similar-sized gaps were apparent in Ethiopia, Vietnam, and Andhra Pradesh, India
(Rolleston et al., 2014).2
Similarly, cross-sectional data in East Africa shows the learning of children from less-
advantaged households is at least one year behind that of children of the same age from more-
advantaged households (Jones and Schipper, 2012). In South Africa, by Grade 3 the poorest
60% are three grade levels behind the wealthiest quintile, and this increases to four grade levels
by Grade 9. In this context, only 8% of Grade 3 students from the bottom four wealth quintiles
were performing at the appropriate level, and only 35% of the richest quintile were reaching this
level. While there is some improvement as students progress to higher grades, sizeable
numbers are still unable to perform Grade 3 tasks in Grade 5. So, for example, 84% of the
poorest quintile are not able to divide 24 by 3 in Grade 3, and 59% of this group are still not
able to do so by Grade 9 (Spaull and Kotze, 2015).
2.3 In many contexts, being poor and female is a double
disadvantage.
More limited evidence is available that tracks progress in learning inequalities over a school
cycle by gender, or that identifies how wealth and gender interact. From the information
available, there is variation across subjects in terms of whether girls or boys perform better.
Evidence from international and regional learning assessments at primary and secondary
1 Young Lives is one of the few surveys that provides longitudinal data in development contexts. Young Lives covers four countries: Ethiopia, India (Andhra Pradesh), Peru, and Vietnam. It is based on a household sample, and administers tests to children in a particular age group, regardless of whether they are in school. 2 Related analysis finds that the gap in achievement between these four countries remains stable as children get older, with children in Vietnam performing best, followed by Peru, India and then Ethiopia. The gap remains wide, even once socio-economic status and other factors are taken into account (Singh, 2014).

7
school finds that girls perform better than boys in reading in all but one country (Tanzania). In
mathematics, boys perform better in 38 countries, while girls perform better in 8 countries, and
there is no significant difference in 28 countries (UNESCO, 2012).
When gender and wealth interact, it is most often poor girls who are least likely to be learning
the basics. In Benin, just 20% of poor boys complete primary school with basic numeracy skills,
but this drops to just 6% of poor girls (UNESCO, 2014a).
Available evidence that tracks changes in learning inequalities by gender and wealth indicates
different patterns depending on context. In Peru, gender gaps amongst poor children are
particularly stark: there is a larger gap between poor girls and poor boys than between poor
boys and rich children in terms of progress made in vocabulary between ages 4 to 8. However,
in Ethiopia, wealth effects are far more dominant than gender differences (Rolleston et al.,
2014).
Similarly, while there are numerous instances of gender disparities globally, the mechanisms
underlying these disparities vary greatly across contexts. For example, in Pakistan, learning
disparities are primarily attributable to disparities in access to education: poor girls are three
times as likely as poor boys to have never attended school, and low numeracy and literacy
levels among these girls is the main reason for the gender learning disparity. By contrast, in
India, enrolment rates among poor boys and poor girls are similar, and so other factors are likely
to be more important in driving learning inequalities, such as household expenditure on tuition
and other school costs or time spent on household chores (Alcott and Rose, 2015; Rose and
Alcott, 2015). Policymakers must, therefore, be aware of the varied and interrelated nature of
the ways in which gender and other forms of disadvantage interact across different contexts,
and develop appropriate strategies to address them.
2.4 Where a child lives matters for their learning opportunities.
In many poor countries, where a child lives matters for their learning opportunities, although
limited information is available on how this affects learning trajectories over a school cycle. In
Kenya, Tanzania and Uganda, learning inequalities between villages are particularly strong
(Jones, 2014a). In South Africa, children from the wealthiest provinces are six times more likely
to have basic mathematics skills than are children from its poorest provinces (Moloi and Chetty,
2010).
Another clear divide is between urban and rural environments. In Ethiopia, urban 8-year-olds
are over five times more likely than rural 8-year-olds to be able to read sentences (Rolleston,
2014). Urban/rural inequalities are also apparent in El Salvador, Guatemala, India, Pakistan,
Panama, Peru, Tanzania, Vietnam and Zambia (Altinok, 2013; Burger, 2011; UNESCO, 2014a;
Rolleston et al., 2014; Tayabba, 2012).
There is evidence to suggest that rural/urban gaps widen through primary school: rural children
make slower progress in reading between ages 4 and 8 than urban children in Ethiopia,
Vietnam and Peru (Rolleston et al., 2014). Between third and sixth grades in Ghana, the
urban/rural disparity in the proportion of children with basic reading skills increases from a factor
of two to a factor of three (UNESCO, 2014a).
Countries marred by conflict are perhaps the most extreme example of how location matters.
Besides the many other challenges that children in such regions face, their access to and

8
quality of schooling tend to be especially poor, with specific challenges faced by refugees and
internally displaced people (UNESCO, 2011). Collecting data on conditions in such regions is
especially problematic, as proven for example by the Beekungo household survey in Mali
(Education Policy and Data Center, 2015). The absence of data on children from conflict regions
increases the risk of overlooking the conditions that these children face and of underestimating
the extent to which education systems must change in order to improve opportunities for all
children.
2.5 Discrimination against ethnic and linguistic minorities is
reflected in learning inequalities.
Across countries, discrimination against ethnic and linguistic minorities is reflected in learning
inequalities, although again, information on how these inequalities change over a school cycle is
not readily available. The legacy of racial segregation in South Africa has led to the existence of
two largely separate education systems, one for the richest quartile, another for the remaining
75% of children. This has serious implications for learning disparities between children from the
two groups: innumeracy rates for sixth graders are 57%, 49%, and 45% across the three poorer
quartiles, but just 8% for the richest quartile (Spaull, 2013).
Children whose household language is different to their language of instruction learn less in a
range of countries, including Benin, Cameroon, Guatemala, Iran, and Turkey (Altinok, 2009;
Fehrler and Michaelowa, 2009). In Peru, the average primary-school child whose mother tongue
is Spanish outperforms 84% of children speaking an indigenous language in mathematics
(Cueto et al., 2014). Pre-school test scores from Peru show that around 58% of ethnic-minority
children were behind the average non-minority children in mathematics and reading, but over
the primary school years this inequality grows by at least a further 2 percentage points (Glewwe
et al., 2014).
2.6 More information is needed on learning of children with
disabilities.
Children with disabilities face far greater barriers than other children in terms of access to
education. However, our knowledge of the extent of learning for those who make it to school,
and how their learning changes over a school cycle, is far more limited.3 In Uganda, literacy
rates stand at 60% for children with no identified impairment, 47% for those with physical or
hearing impairments, and 38% for those with mental impairments (UNESCO, 2014a). Among
those aged 15 and above in Tanzania, literacy rates are 52% for those with disabilities and 75%
for those without (Tanzania National Bureau of Statistics, 2010).
2.7 Tracking progress by age and grade: evidence from ASER and
Uwezo surveys.
Given the evidence on widening inequality over the school cycle, it is important to track progress
throughout the system. Two key questions arise for the tracking of progress in learning. First,
should assessments be curriculum-based in order to see whether children are achieving
expected levels according to their grade? While this is an appropriate approach for assessing
3 ASER Pakistan has piloted collecting information on children with disabilities, which offers the potential for great advancements in our knowledge of the relationship between disability and learning inequalities.

9
progress within a country, given the reality that so few are able to perform at the appropriate
level for their grade, it is necessary to start by identifying the extent to which children are
acquiring foundation skills in literacy and numeracy, that are needed as a springboard to further
learning.
Second, how can we ensure that children’s learning is captured, regardless of whether they are
in school or not? Most existing learning assessments only test children attending school. This
fails to capture the most marginalised, who are least likely to be in school. Some attempts have
been made to combine data from learning assessments with enrolment data from administrative
sources or household surveys to gain a fuller picture of the extent of learning inequalities
(UNESCO, 2014a; Spaull and Taylor, 2015).
Assessments carried out within households are better able to identify which children are
learning. ASER tools in rural India and rural Pakistan, and Uwezo ones in Kenya, Tanzania and
Uganda, provide a good example of such an approach.4 We draw on these data to provide new
evidence to show the different patterns according to whether progress is measured by age or
grade, once all children are accounted for (regardless of whether they are in school or not).
Our analysis of these surveys starts by showing that children from wealthy households are more
likely to complete primary school by the expected age: while at least 70% of Grade 5-aged
children from rich households have reached this grade in Kenya, rural Pakistan and Tanzania,
fewer than 50% of the poorest have done so. Enrolment is higher for children from both rich and
poor households in India, but considerably lower in Uganda, where only around 20% of poor
children reach Grade 5 (Figure 1).
Figure 1: Poor children are less likely to reach Grade 5 at the expected age
Source: Authors’ calculations based on ASER India 2012, ASER Pakistan 2012, and Uwezo 2012
4 Each of these surveys uses two-stage stratified sampling, and this can be accounted for with sampling weights in order to draw estimates that are representative of the given country. In India though, this is only true for rural regions. In section 4 we provide a fuller discussion of the strengths and limitations of these data.
0 20 40 60 80 100
Uganda
Tanzania
Kenya
Rural Pakistan
Rural India
Poorest quintile Richest quintile

10
In order to identify the stage at which children are learning the basics, we use a combined
indicator of the highest competencies in literacy and numeracy available in the ASER and
Uwezo data: performing division and reading a story. In principle, children should have acquired
these skills in Grade 2 of primary school, but many fail to do so. Our analysis tracks changes in
learning for children of different ages (including children both in and out of school), as well as in
different grades (providing information on learning for those within the school system). While
policymakers require an assessment of performance in different subjects separately in order to
identify shortcomings and where policy attention needs to be directed, the combined indicator is
adopted as a stringent summary measure for assessing progress towards a post-2015 goal of
learning basic skills for primary-school-aged children.5
For the purposes of comparability, we focus on a single dimension of inequality that is the most
apparent and consistent source of inequality in all five countries: household wealth (measured
by household possessions). Since ASER and Uwezo data are not longitudinal, we compare
children of different ages and school grades within a particular survey year.6 This has limitations
as it does not allow tracking of the evolution of learning of the same group of children over time
but still presents a useful snapshot of the extent to which children in different age groups and
school grades are learning.
A first point to note is that the chances of learning the basics is low in most countries regardless
of age (solid lines) or grade (dotted lines) and that, in all countries, it is higher for those from rich
backgrounds (Figure 2). Children from rich households in Kenya are the most likely to achieve
the basics. Their learning advantage appears to start early, as 22% of those aged 7 are already
able to perform division and read a story and, by Grade 5, 79% are able to do so. One potential
reason for this is pre-school education. In Kenya, for example, around 30% of children enrol in
pre-primary schools (Jones and Schipper, 2012), and pre-school enrolment is higher among
richer children. At the other extreme, in rural Pakistan, even though rich children in Grade 5
have a higher chance of achieving the basics than poor children (26%), only 33% do so.
A second point is that, amongst poor children, a greater proportion are learning the basics by
Grade 5, compared with the age group who should have reached this grade in each of the five
countries. The gap between grade and age widens over the cycle. In the early grades, a similar
(low) proportion of poor children are learning regardless of age or grade. In all countries except
rural India, the proportion of poor children learning begins to increase from Grade 4 for those
who are in school, while the proportion of those learning in the corresponding age group (i.e.
including all those who should be in Grade 4, regardless of whether they are still in school or not
and, for those who are in school, including those who have not yet reached Grade 4) does not
increase as much. This is particularly marked in Uganda where only 11% of all 11-year-olds
(whether or not they have reached Grade 4) are achieving the basics, hardly any change from
10-year-olds. By contrast, an improvement is noticeable for those who are in school: while only
11% of Grade 4 students are achieving the basics in Uganda, this increases to 35% by Grade 5.
5 There is a strong relationship in children’s ability to achieve the basics in both competencies: in these countries, around 80% of 12-year-olds who can divide are also able to read a story. 6 The latest data available for the East African countries is 2012 so, for the sake of comparability, the same year has been used for all surveys. Only rural areas of India and Pakistan are included, as urban areas are not covered as systematically in the surveys in those countries.

11
The reason for the growing divergence between the age of children and their grade is likely to
be due to a combination of two reasons: first, the age group includes children who are not in
school; and, second, it also includes children who are in school but have not yet reached
Grade 5 (whether because they started late or have repeated years of school). This also helps
to explain why the disparity between learning outcomes by age group and learning outcomes by
class grade amongst the poor is smallest in the two countries with the highest enrolment rates
(India and Tanzania). For similar reasons, a gap between age and grade is not very noticeable
amongst the rich, other than in Uganda where even the better off are not reaching Grade 5 at
the appropriate age (see Figure 1). These patterns illustrate the importance to focus on age to
assess the dynamic nature of learning inequalities and to show where the greatest challenges
remain.
Figure 2: Learning disparities are enforced during the primary school years
Note: The vertical axis shows the percentage of children who can both divide and read a story.
Source: Authors’ calculations based on data from ASER India 2012, ASER Pakistan 2012, and Uwezo
2012
Poverty is just one dimension of disadvantage. Combining wealth and gender presents a variety
of patterns (Figure 3). Focusing on 12-year-olds – the age by which children in all five countries
should have reached the end of primary school – we find that, amongst the rich, girls are more
likely to achieve the basics in mathematics and reading. In rural India, rural Pakistan and
Uganda, this pattern is reversed amongst poor, with just 15% of poor girls in Uganda achieving
the basics, compared with 19% of poor boys. These are also the three countries where learning
levels are particularly low amongst poor children. By contrast, in Tanzania, not only is there a
sizeable gap in favour of girls amongst the rich, but also poor girls are more likely to be learning
the basics compared with poor boys.

12
Figure 3: In some countries, poor girls are least likely to be learning by aged 12
Source: Authors’ calculations based on data from ASER India 2012, ASER Pakistan 2012, and Uwezo
2012
To provide a more detailed picture of the dynamic nature of sources of inequality over time and
how they interact with each other, we present findings from an inferential model on household
data from ASER India’s 2008-2013 surveys.7 Given the ASER India survey has been carried out
over a number of years, we are able to construct a quasi-longitudinal dataset. Our analysis
combines comparable data from ASER India over six years, enabling us to construct a cohort of
6-year-olds in 2008, 7-year-olds in 2009, and so forth. In addition, we construct multiple cohorts
within the time span and use controls to account for the different conditions that the different
cohorts may have faced, such as, for example, the fact that some began school before the
automatic promotion policy was enforced nationally in 2009, while others began afterwards.
Since these data provide us with cohort groups over time rather than cross-sectionally, we are
able to make more robust claims about the role that different background characteristics are
likely to have played in children’s development in learning over time. We focus the analysis on
the ability to subtract, which all children should have achieved by the age of 7.
The predictive strength of socio-economic status, gender and parental education all increase
with age over the primary school cycle (Figure 4). Comparing the poorest and wealthiest
groups, socio-economic status is already the strongest predictor of learning inequality at age 7,
taking other factors into account. Its strength increases substantially as children get older, such
that, by age 11, taking other factors into account, there is a 19 percentage point gap between
children from the poorest and wealthiest households.8 To check whether the importance of
socio-economic status holds in less extreme conditions, we also compare the wealthier half to
the poorer half of the sample. The gap in learning for 11-year-olds remains wider than other
7 See Appendix for an explanation of the model. 8 This comparison is between those who own all assets included in the index (namely electricity, a mobile phone, a television, and whose houses are made from mud and cement) and those who own none (and whose houses are made from mud). The result is very similar to a comparison between the upper and lower quintiles of the wealth index, for which there is an 18 percentage point gap.

13
forms of disadvantage for which data are available, with a 9 percentage point gap between the
two groups.
By age 11, although less powerful, the other characteristics are also significant predictors of
inequality: even when accounting for the other predictors, the gap is eight percentage points for
those whose mother did not attend school, six percentage points for those whose father did not
attend school, and four percentage points for girls.
Figure 4: In India, wealth is the most powerful predictor of learning inequalities across
primary-school ages
Note: SES refers to socio-economic status; each of the lines controls for other factors (see Appendix)
Source: Authors’ calculations based on data from ASER India surveys 2008-2013
Recognising that factors such as socio-economic status, gender and being a first-generation
learner are likely to interact with each other to reinforce disadvantage, Figure 5 identifies their
combined impact. It finds that, in India, by age 7, there is already a gap between poorer children
whose parents did not go to school and richer children whose parents did attend school. At this
stage, the gap between boys and girls amongst the rich or poor is slight. However, by age 8,
gender begins to interact with socio-economic status with a widening gap between poor girls
whose parents have not been to school and their male counterparts. By age 11, poor boys
whose parents have not been to school are almost twice as likely to be learning the basics as
poor girls in this situation (although still only 13% are able to do so, compared with 7% of girls).
The most advantaged girls and boys both show progress over the primary-school ages, with
little gap between them, such that, by age 11, approximately 40% are learning the basics.
0
5
10
15
20
7 8 9 10 11
Perc
enta
ge
-poin
t gap in
abili
ty to s
ubtr
act
Age
SES most vs least
disdvantaged
SES upper vs lowerhalf
Mother's schooling
Father's schooling
Gender

14
Figure 5: In India, the importance of wealth grows across the grades
Source: Authors’ calculations based on data from ASER India surveys 2008–2013

15
3. Tracking progress to achieve learning for all by 2030
Given the extremely low proportions learning
the basics by the age at which they should have
completed primary school, learning needs to
improve dramatically over the next 15 years if
post-2015 goals are to be achieved. This is
particularly true for the most disadvantaged.
However, the reality in some of the poorest
countries indicates that there has been little if
any progress in recent years.
Projections of progress in learning, using
international and regional learning assessments
(SACMEQ, TIMSS and PISA), find that, in some
countries, learning has in fact deteriorated over
time. This implies that it would take forever to
achieve learning goals on current rates of
progress. Moreover, the analysis identifies that it
will take some eastern and southern African
countries 150 years to reach OECD reading
levels on current trends. Even in OECD
countries, the pace of improvement is found to
be slow. The authors suggest using country-specific targets, taking each country’s current
circumstances, and targeting improvements in test scores by a few percentage points each year
(Beatty and Pritchett, 2012).9
Our projections build on this analysis in three ways:
1. We use a measure of whether children are learning the basics in mathematics and
reading by age 12, that is an age by which children would be expected to have
completed at least five grades of primary schooling in most countries. We take the
basics to be the ability to perform division and to read a short story. Our approach has
the advantage for tracking progress towards international targets of being
straightforward to communicate, and also is a comparable measure for ensuring that
children are achieving the foundations for further learning. This is a target that ought
to be achievable for all children, regardless of where they live.
2. We use ASER and Uwezo household survey data, which allow the inclusion of all
children, regardless of whether they are in school.
3. Our primary focus is on acknowledging that no target will be met unless met for all, and
so we track the trajectory of gaps in learning within countries. For illustrative purposes,
we focus on wealth groups within countries, which we have identified as a key driver of
learning inequalities, and for which comparable measures are available across the
countries. We thus provide separate projections for the poorest and wealthiest quintiles.
9 Drawing on SACMEQ learning assessment data combined with demographic and health survey data for children not in school, on current trends, only half of poor rural girls are estimated to reach minimum learning levels by 2030 in selected countries eastern and southern Africa. In Malawi, only around one in five of these girls is expected to do so (Rose, 2015).
Key messages
To ensure no one is left behind by 2030,
the learning of children within a selected
age group should be tracked to include
those both in and out of school.
A necessary target should be that all
children are able to achieve the basics in
both mathematics and reading as a route
to preparing them for further learning.
Adopting this measure for tracking
progress, stepping-stone targets should
be adopted for sub-groups of the
population within countries, in order to
provide an early warning to show if
disadvantaged groups are making
sufficient progress in advance of the
distant 2030 deadline.
16
In order to identify the progress needed by 2030, we adopt Watkins’ (2015) proposal of
‘stepping stone’ targets, which set interim targets adjusted to specific countries, and take
account of the different speed of progress needed for sub-groups of the population within
countries. In our projections, we provide stepping stone targets at five-year intervals. This
shorter-term focus is more informative for the reality of national planning imperatives, which
tend to relate to political electoral cycles, and also enable identifation of whether sufficient
progress is being made for the most disadvantaged groups well before the more distant
deadline year (Rose, 2015).
A key aspect of the setting of interim targets is whether the rate of change is expected to differ
across sub-periods of time, i.e. between one stepping stone and another. For example, one
possibility is that acceleration in progress might be anticipated or, alternatively, greater
improvement in earlier years could be expected that then tapers off.10 In their work on setting
targets for the Millennium Development Goals, Klasen and Lange (2012) estimate S-shaped
rates of progress, in which progress is slowest at the outset and close to completion of the
target, whereas the greatest gains are made in the intermediate period. In their stepping-stone
goals for child mortality, Save the Children (2014) recognises that such non-linear trends are
likely, but uses linear projections for clarity.
For combatting learning inequalities, we can see logical reasons for including a range of non-
linear projections. For example, one could envisage early acceleration as policymakers target
the ‘low-hanging fruit’ of relatively easy-to-reach children, followed by deceleration in progress
when attention then turns to the most marginalised and difficult to reach children. Conversely,
progress might be slow initially as policymakers take time to implement system-wide changes,
followed by acceleration, as these changes bring about improvement.
Recognising arguments for different approaches, we adopt a linear function in our projections
of how inequalities must improve. While it is unlikely that any country would progress in such a
neat fashion, this provides clarity, and strikes a balance across alternative projections.
To chart current rates of progress, we focus on rural India, where we have data over a number
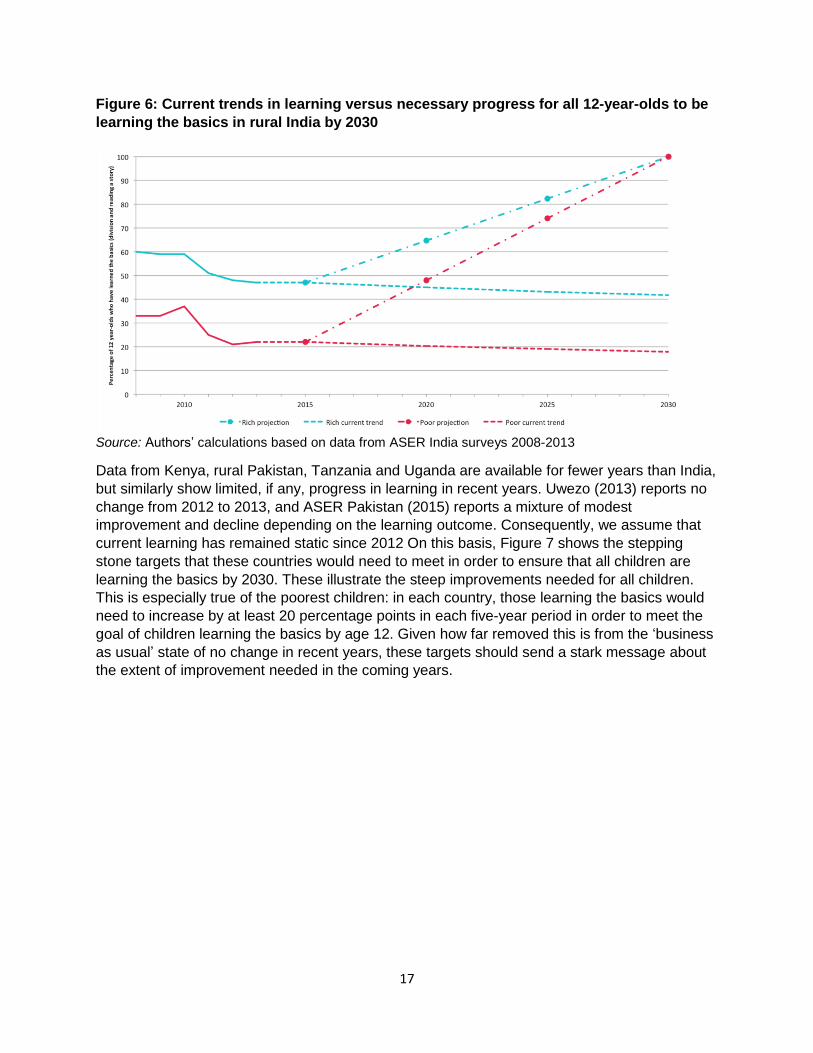
of years. In Figure 6, the solid lines show that the proportion of 12-year-olds learning the basics
in reading and mathematics has declined overall between 2008 and 2013 for both the poorest
and the richest quintiles. If recent trends were to continue,11 by 2030, only around 20% of the
poorest would be learning the basics and this would still reach just 40% of the richest. Clearly,
this is a far cry from the progress necessary to ensure that all children are learning the basics.
Using a stepping stone target every five years to chart progress to that target, the proportion of
rich children who have learned the basics would need to increase by 18 percentage points
between each five-year period. The challenge is even greater for poor children: we would need
to see an increase of 26 percentage points between each stepping stone – a massive increase
given the limited progress that has been made in recent years.
10 This could be estimated by a positive or negative quadratic function, respectively. 11 Based on a line of best fit across the prior years.
17
Figure 6: Current trends in learning versus necessary progress for all 12-year-olds to be
learning the basics in rural India by 2030
Source: Authors’ calculations based on data from ASER India surveys 2008-2013
Data from Kenya, rural Pakistan, Tanzania and Uganda are available for fewer years than India,
but similarly show limited, if any, progress in learning in recent years. Uwezo (2013) reports no
change from 2012 to 2013, and ASER Pakistan (2015) reports a mixture of modest
improvement and decline depending on the learning outcome. Consequently, we assume that
current learning has remained static since 2012 On this basis, Figure 7 shows the stepping
stone targets that these countries would need to meet in order to ensure that all children are
learning the basics by 2030. These illustrate the steep improvements needed for all children.
This is especially true of the poorest children: in each country, those learning the basics would
need to increase by at least 20 percentage points in each five-year period in order to meet the
goal of children learning the basics by age 12. Given how far removed this is from the ‘business
as usual’ state of no change in recent years, these targets should send a stark message about
the extent of improvement needed in the coming years.

18
Figure 7: Stepping stone targets to ensuring all 12-year-olds are learning the basics in
reading and mathematics by 2030
Source: Authors’ calculations based on data from ASER India 2012, ASER Pakistan 2012, and Uwezo
2012
19
4. Strategies to overcome barriers in learning
The vast progress that is needed in raising
learning outcomes, particularly for the
disadvantaged, should be a wake-up call for
policymakers. While much needs to be done,
the extent of the challenge should not be seen
as an excuse for complacency, but rather should
inspire urgency.
Past research suggests that schooling may have
a greater impact on learning inequalities than
family background in poor countries compared
with rich countries (Heyneman and Loxley,
1983). Moreover, schools are an environment in
which policymakers can intervene. It is important
to unpack the school-based factors that have a
greater impact on learning, in particular for the
most disadvantaged.
Some researchers have tested interventions
associated with a range of policy measures
aimed at improving learning outcomes. A number of recent systematic reviews have analysed
these to identify policies that are anticipated to improve learning levels (Conn, 2014; Glewwe et
al., 2014; Kremer et al., 2013; Krishnaratne et al., 2013; McEwan, 2014; Murnane and
Ganimian, 2014).12 However, these reviews have tended not to separate out effects according
to differing levels of disadvantage among children.13 In order to move from the status quo to
ensuring all children, regardless of circumstance, are learning by 2030, it is essential that policy
measures be identified that have the greatest impact on the most disadvantaged children.
Drawing on the available evidence, this section identifies five areas that need to be the basis of
policy reform if learning levels are to improve along with a narrowing of learning inequalities:
1. addressing disadvantage from early childhood;
2. ensuring teaching is at the right pace for the weakest learners;
3. providing disadvantaged children with the support of the best teachers;
4. providing learning resources that support children learning at an appropriate pace; and
5. empowering parents and communities to hold schools and policymakers to account.
4.1 Address disadvantage from early childhood.
Learning inequalities are apparent even before children start primary schooling, and children
who encounter difficulties with learning early on face an uphill struggle to catch up with higher
achieving children who tend to be from more advantaged backgrounds. It is, therefore, vital that
12 Evans (2015) provides a comparative analysis of these reviews, emphasising the ways in which they differ from one another. These reviews had different objectives and areas of focus from one another which is one of the reasons for the identified differences. 13 Although not explicitly part of the design, Murnane and Ganimian (2014) draw out implications of the impacts for low-income families where possible, although the information on this is limited.
Key messages
Five sets of interventions are needed to
raise learning outcomes and eliminate
the learning inequality gap:
1. Address disadvantage from early
childhood.
2. Ensure teaching is at the right pace
for the weakest learners.
3. Provide disadvantaged children with
the support of the best teachers.
4. Provide learning resources that
support children learning at an
appropriate pace.
5. Empower parents and communities
to hold schools and policymakers to
account for poor quality education.

20
reforms start by targeting disadvantaged children before they even start school, and ensure that
they are able to start school on time.
Early childhood interventions narrow learning inequalities in primary school
Early childhood education is an important place to focus policy efforts. There is evidence that
both parental interventions and centre-based programmes improve children’s cognitive
development, and that improvements are greatest for children from more disadvantaged
populations.
Cross-country comparisons using PISA data identify that 15-year-old students who attended
at least one year of pre-school performed better than those who had not, even once socio-
economic status is taken into account: the average benefit for learning outcomes of attending
pre-school is equivalent to at least one year of schooling in Argentina, Australia, Brazil and
Germany (OECD, 2010).
Although most findings on the impact of early childhood education come from high-income
countries (for a review, see Burger, 2010), there is a growing body of research from low- and
lower-middle income countries. Early childhood education interventions aimed at poorer children
in Bangladesh, Bolivia and Colombia demonstrate improvements in cognitive development as a
result of childcare programmes (Aboud and Hossain, 2011; Aguilar and Tansini, 2012; Behrman
et al., 2009). In Argentina, a one year increase in pre-primary school increases the average
child’s test scores to exceed the scores of 59% of other children. Effects were twice as large for
students from poor backgrounds compared with those from non-poor backgrounds (Berlinski et
al., 2009). A longitudinal study in Jamaica on weekly play sessions showed improvements in
educational attainment through to adulthood (Walker et al., 2011). In 2008, the Indonesian
Government launched an early childhood education programme specifically aimed at poorer
villages, which included playgroups, kindergartens and day-care centres. Among a range of
positive outcomes, the programme reduced the gap between rich and poor in language and
cognitive development by 8%, and in communication and general knowledge by 12% (Jung and
Hasan, 2014). While there are clear benefits to early childhood interventions, quality of
implementation can vary in large-scale programmes, which can affect poorer communities in
particular. Preliminary research from South Africa presents a concern of whether its national
pre-school programme has led to learning improvements in primary school only for children from
more advantaged households and regions (van der Berg et al., 2013). The authors of this
research suggest that the disparity may be attributable to capacity constraints, such as teacher
training and support in facilities in poorer neighbourhoods.
This evidence highlights the importance of targeting support and oversight of large scale
programmes to the most disadvantaged areas if pre-schools are to have equalising effects.
In their meta-analysis of research on early childhood, Engle et al. (2011) note the importance
of the quality of implementation: the impact of programmes on learning outcomes increases
directly with more systematic curricula, greater training opportunities for staff, and more active
strategies to support parents with their own caregiving behaviour.
Begin school on time
Another aspect of tackling inequalities in learning early is making sure that children enter school
on time. Since poorer children enter school overage at disproportionately high rates, any
detrimental effects are likely to exacerbate inequality (Lewin and Sabates, 2012). In countries

21
including Congo, Democratic Republic of Congo, Ghana, Madagascar, Namibia, Nigeria and
Zambia, at least twice as many children from poor families start primary school overage, as do
children from rich families (UNESCO, 2012). In ASER and Uwezo countries, children from poor
households are more likely to be at least two years older than the official starting age. The gap
in overage enrolment between the rich and poor ranges from four percentage points in rural
India to 11 percentage points in Kenya and Uganda (authors’ calculations based on ASER and
Uwezo surveys).
If children start school late, this leads to them being overage throughout the school cycle. In
francophone Africa, this concern is exacerbated by the common practice of grade repetition
(20% of primary school children repeat grades on average), which is found to be detrimental to
learning outcomes and occurs primarily among poorer children, thus deepening socio-economic
inequalities in learning (Glick and Sahn, 2010). Some other countries, such as India and
countries in east and southern Africa, have adopted policies for automatic promotion, although
these are not always fully implemented (Bhattacharjea et al., 2013; Hungi et al., 2014).
Research on being in the right grade for age is found to be particularly important in sub-Saharan
African countries where the extent of overage enrolment is found to be widespread. In eastern
and southern African countries, learning is lower among children in classes with more overage
children, although this does not disproportionately hinder the poorest (Hungi and Thuku, 2010;
Jones, 2014b). Overage children perform worse in the later primary school grades in Kenya,
even after controlling for pupil background factors, and school characteristics, and grade
repetition (Hungi et al., 2014).
There is contrasting evidence on the impact of overage enrolment on learning outcomes in India
to the available findings from sub-Saharan Africa. In India, overage children outperform their
peers from the early grades. The gap is especially wide for wealthier children, for whom being
overage is linked to a 10 percentage-point increase in the likelihood of being able to subtract
(Rose and Alcott, 2015).
The stark difference in the effects of overage enrolment on learning between India and east and
southern African countries could be related to variations in the magnitude of overage enrolment,
as well as differences in the factors that determine why some children are overage for their
grade in the respective countries – for example, in some contexts, it could be because children
are attending pre-school before entering school. This highlights the importance of understanding
the impact that overage enrolment has on learning, and tackling the problems associated with it.
4.2 Ensure teaching is at the right pace for the weakest learners.
One reason why children are spending time in school without progressing in their learning is
associated with overly ambitious and inflexible curricular. In addition, the focus of such curricula
on the most able learners makes their pace especially detrimental to disadvantaged children,
who already have to catch up even in the first years of primary schooling. Curricular reform is
therefore needed to make teaching more inclusive and responsive to students’ current abilities,
offering a key means to closing the learning gap.
The lack of accounting for weaker learners has been attributed to elite groups developing
education systems, instructional materials and language of instruction targeted toward their
children. For example, Kenya’s curriculum continues to use English, most students’ third
language, as its language of instruction (Glewwe et al., 2009). A key consequence of elite
22
dominance is suggested to be a disinterest amongst curriculum developers in teaching basic
skills beyond the first years of schooling (Chavan, 2015). This elite focus further exacerbates
inequalities as children progress to more advanced grades and curricular levels without any
additional support, making classes increasingly irrelevant to a growing number of students who
have yet to master the basics and so do not have the foundations for further learning (Mukerji
and Walton, 2012; Pritchett and Beatty, 2015).
Education interventions aimed at basic literacy and numeracy skills for children who have fallen
behind curricular expectations show that it is possible for them to improve rapidly with the right
support. A programme that trained village volunteers in rural India to give supplementary tuition
to the weakest learners made participants 23% more likely to be able to read a word or
paragraph (Banerjee et al., 2010). In another programme, teachers worked in a summer camp
for four hours a day with low-performing children. After a month, on average half of the children
gained a reading level (Banerjee et al., 2011).14 In a separate intervention, community teachers
spent half of each school day working on basic skills with the lowest achieving children in
Grades 3 and 4. A year later, the average child in the intervention group still had better learning
than 54% of children in the comparison group (Banerjeee et al., 2007). Clearly, the problem is
not that students are unable to learn. Rather, these successes demonstrate that teaching
pitched at the right level can be effective. A key policy focus should now be to incorporate these
approaches into the school system.
School systems that take account of children’s different paces of learning are more effective for
narrowing inequalities. Vietnam’s superior performance compared with Ethiopia, India and Peru
is found to be as much to do with children’s learning after they start school as much as inherited
disadvantage and early childhood support (Singh, 2014). While learning in Indian schools
appears to stagnate over the school grades, in Vietnam, children’s learning improves.
Comparing the two countries drawing on data from the Young Lives study, Rolleston et al.
(2014) find that mathematics learning in Vietnam ‘keeps pace’ with the curriculum, whereas this
is not the case in Andhra Pradesh, India. In Vietnam, teachers were also able to assess
students’ levels accurately. This, combined with the fact that 10-year-olds in Vietnam who did
not correctly answer the target questions made progress through the school year, suggests that
teachers were both aware of and responsive to their students’ learning levels, providing
evidence for the importance of appropriately-paced curriculum, combined with support to
teachers to use it effectively.
While teaching at the right level is likely to be crucial to reducing learning inequalities, there is
mixed evidence in relation to one possible policy response: ability streaming. A programme in
Kenya compared learning when students were assigned to their Grade 1 class on either the
basis of initial preparedness or random assignment. Tracking by initial level of achievement
increased test scores for those both in higher and lower tracks (Kremer et al., 2013). In a similar
study, lower-performing pupils acquired more basic skills when grouped by ability (Duflo et al.,
2011). However, the authors of this study also note that streaming practices raise concerns
about equity depending on the quality of their implementation: for example, higher ability
streams may receive more able teachers or other resources. This concern is justified, given that
education systems with ability streams are associated with larger gender gaps in mathematics
and science at both primary and secondary level (Bedard and Cho, 2010). In OECD countries,
14 The reading levels were: (1) a letter, (2) a word, (3) a short paragraph, and (4) a story.

23
where streaming is more prevalent, the practice is often found to exacerbate inequalities
(OECD, 2007; Schütz et al., 2008).
4.3 Provide disadvantaged children with the support of the best
teachers.
Quality teaching is vital to improving learning for the most disadvantaged. Currently, many
education systems struggle to provide teachers in sufficient numbers with appropriate
preparation to deal with the range of challenges they face, which may be exacerbated by the
large numbers of first-generation learners entering the classroom from a wider diversity of
backgrounds.
To reverse gaps in learning for children from disadvantaged backgrounds, governments need
to alter their approaches to teacher recruitment, training and deployment. These reforms need
to be accompanied by ones that strengthen incentives and promote accountability, such that
measures ensure not only that the quality of teaching rises but that it is targeted at the children
with greatest need.
Recruiting enough teachers of sufficient capability is crucial. Estimates suggest that a further
27.3 million teachers will be needed by 2030 to ensure universal primary enrolment (UNESCO,
2014b). The pace of growth in recruitment for the highest-need countries is considerable: both
Rwanda and Uganda would need to double current recruitment rates, and this challenge is
made all the greater, given the low proportion of adults in such countries with a secondary-
school-level education (UNESCO, 2014a). As a result, in some contexts, teachers are unable to
perform the type of numeracy and literacy tasks for which they are meant to be preparing their
students. For example, in Kenya, Grade 6 teachers scored only 61% on tests of Grade 6
mathematics material (Ngware et al., 2010).
But teacher recruitment is just one aspect of teacher reforms needed. Teaching needs to be
recognised as a profession that attracts qualified, motivated applicants. Once they have been
recruited, teachers need to be given appropriate training incorporating practical classroom
experience, which includes support for children to learn the basics and to progress at the right
pace. However, teachers in sub-Saharan African countries are rarely provided with the skills for
teaching children in the early grades. In Mali, where nearly half of pupils are unable to read a
word in their own language by the end of Grade 2, teachers were not adequately prepared to
teach their pupils how to read (Varly, 2010). In Senegal, where attempts are being made to
introduce local languages in schools, training is only given in French and only 8% of teachers
expressed any confidence about teaching reading in local languages (Akyeampong et al.,
2013).
The lack of appropriate training is a lost opportunity: a meta-analysis of randomised
experiments estimates that teacher training is one of the interventions with the greatest impact
on learning (McEwan, 2014). In Mali and Niger, introducing pedagogical training for teachers led
to major improvements in early-grade reading: while no students could read at least 21 letters,
49% could after four months of instruction, compared to just 2% in comparison schools (Mitton,
2008). In one Kenyan district, teachers received some training on a set of carefully designed
lessons to teach effective reading skills to Grade 2 students; as a result, reading speeds
improved by 80% on average (Crouch et al., 2009). In Liberia, an intervention that included
providing in-service training to teachers in using formative and diagnostic assessment to identify
24
and support weak learners resulted in 130% increase in children’s reading comprehension
scores, with a higher impact on girls, such that it brought them up to boys’ higher level
(Davidson and Hobbs, 2013).
Once qualified, the most experienced teachers need to be deployed to the most disadvantaged
areas. One example of a country that has been successful in an equitable deployment of
teachers is Vietnam. Teachers of more disadvantaged children were absent less often, provided
feedback more regularly, and were slightly more likely to have received ‘excellent teacher’
status (Rolleston and Krutikova, 2014). Financial or in-kind incentives (such as teacher housing)
can help to keep teachers working in rural areas, such as adopted in Cambodia, Gambia and
Malawi (UNESCO, 2014a). An alternative approach that has been found to be successful in
some contexts is to recruit teachers from within their own communities, which can both reduce
teacher attrition and also mean that they are sensitive to the cultural setting within which they
are working. This is an approach being adopted in Afghanistan, where female teachers are
particularly needed, and in Lesotho. However, this can come with challenges: in Lesotho only
half of teachers in mountainous areas are trained compared with three quarters in other parts of
the country (UNESCO, 2014a).
One potential knock-on effect of increasing the number of teachers is the opportunity to reduce
class sizes. While teacher quality is more important than class size in OECD countries (OECD,
2009), the fact that classes can be far larger in low- and middle-income countries suggests that
this may contribute to learning inequalities. The limited evidence available on the impact of
reducing class sizes indicates that it has little effect on average: experimental trials in India
(Banerjee et al., 2007) and Kenya (Duflo et al., 2015) found little to no benefit to student
learning on average. Yet, there is some evidence that suggests larger class sizes are especially
detrimental to poorer children in Kenya and Uganda – in Kenya the impact is four times greater
for ultra-poor than for non-poor children (Jones, 2014b). Class size also matters more for
disadvantaged children in South Africa, where it has little impact on learning among white
children but does among black children (Case and Deaton, 1999). One associated reform is the
need to support teachers in managing large classes, for example through group work
(Michaelowa, 2001; O’Sullivan, 2006).
Teachers need to be given incentives that encourage them to support disadvantaged learners.
There is experimental evidence that monetary incentives for teachers can improve student
performance, although there are concerns that they can distort teaching practices. For example,
an incentive programme in Kenya improved test performance among students, but also created
the unintended consequence of teachers spending more class time on exam preparation.
Improvements did not extend to subjects that were not being covered by the incentive
programme and dissipated in the longer run (Glewwe et al., 2010). Evidence from Andhra
Pradesh, India, found teacher incentives to improve student learning both in targeted and non-
targeted subjects, and sustained into the study’s second year. However, teacher incentives
seem to have a greater effect on wealthier children (although did not make a difference
according to caste, gender or parental education), suggesting they could, if anything, widen
inequalities (Muralidharan and Sundararaman, 2011).
Although some quantitative studies on teacher reforms investigate whether a given intervention
has a discernible impact on learning outcomes, there is a relative lack of research that aims to
identify the implications for different groups of children according to the disadvantages they

25
face. In addition, few consider more sustained impacts of such reforms, for example on teacher
retention.
4.4 Provide learning resources that support children learning at an
appropriate pace.
The efficacy of learning materials depends largely on the ability level to which they are pitched
and whether teachers are trained to utilise them. Inferential research identifies positive impacts
of the provision of materials on learning outcomes across a range of countries. Textbooks are
linked to improved outcomes in Ghana (White, 2004) and francophone Africa (Michaelowa,
2001). Resources are linked to better learning outcomes in Botswana, Malawi, Namibia and
Uganda, even after controlling for schools’ prior academic and social composition (Lee and
Zuze, 2011).
These impacts are also found in some studies to have particular benefits for disadvantaged
learners. In India, additional teaching resources (including flash-cards and games) helped the
average child exceed 62% of children in the comparison group in English, with impacts
proportionally larger for low-performing children (He et al., 2007). In Mexico, the use of
textbooks in indigenous languages has been associated with narrowed learning inequalities in
primary school (Vegas and Petrow, 2008).
However, experimental and quasi-experimental approaches do not find that textbooks reduce
inequalities. One study of sub-Saharan African primary schools found little impact of textbooks
on learning, and that any benefits were restricted to children from more advantaged
backgrounds (Kuecken and Valfort, 2013). This is corroborated by research from Kenya on
textbooks (Glewwe et al., 2009) and flipcharts (Glewwe et al., 2004). This lack of impact is likely
to be interrelated with the challenge of teaching at the right level. As with curricular design more
generally, materials may only support learning of the most advanced students. Glewwe et al.’s
(2009) study on textbooks in Kenya found that textbooks did improve learning among students
in the upper quintile of prior achievement.
Further evidence for the importance of ensuring learning resources are at the right level can
also be seen in a programme in India using computer-based learning tools. The programme
tailored learning materials according to children’s current learning levels, and experimental
evidence suggests that this approach increased test scores in mathematics for the average
child, to exceed 69% of children in the comparison group (Banerjee et al., 2007). By contrast,
computer-based programmes in Peru and Colombia that were not responsive to children’s prior
learning levels did not have the same success (Kremer et al., 2013).
These findings suggest that learning resources are most likely to be effective for addressing
learning inequalities if they are designed at the right level for students from diverse backgrounds
and are accompanied by teachers who are trained in their use with weaker learners.
4.5 Empower parents and communities to hold schools and
policymakers to account.
To implement measures aimed at raising learning outcomes and overcoming inequalities,
households and communities need to be empowered to hold policymakers and school leaders
to account. While potentially powerful, it is important to remain aware that, given the link

26
between disadvantage and power within one’s community, empowering families may be more
beneficial to relatively wealthy children than to those from disadvantaged backgrounds unless
special measures are taken. Research on such an intervention in Mali, for example, found that
increasing the power of local governance empowered some groups, but further isolated
nomadic groups (Laugharn, 2007). Comparable patterns are found for lower-status groups in
India (Ramachandran, 2004).
One accountability approach is to provide parents and communities with information on their
children’s progress in school. In Uganda, a community monitoring scheme improved student
learning outcomes, as long as communities could independently choose how to judge school
performance (Zeitlin et al., 2011). Similarly, a project in Andhra Pradesh, India, supported
women to demand improvements in local primary school quality, which led in turn to improved
learning outcomes (Galab et al., 2013). However, it is worth noting that some research on
community information campaigns have not found them to have signifiant impacts (Glewwe
et al., 2013; Pandey et al., 2008). An intervention in Madagascar, focused more generally on
informing children and parents about the potential benefits of education, found that the test
score of the average child in this group exceeded those of 58% of children in the comparison
group, benefiting both poorer and richer families (Nguyen, 2008).
There is some evidence that greater community oversight in school management improves
learning outcomes. In India, the Accountability Inititative has worked with ASER India to draw
attention among communities on the extent to which government allocations are actually
reaching their local schools (PAISA, 2014). Where communities have access to information on
low levels of learning, as provided by ASER and Uwezo surveys for example, this provides the
opportunity for enhancing accountability of schools to their citizens. However, more attention is
needed to identify how this can translate into improved learning outcomes for the most
disadvantaged (Bangay, 2015; Lieberman et al., 2012).
Compared to information campaigns, interventions that devolve political power offer more
promising results (Fox, 2014). In Indonesia, interventions aimed at increasing school
committees’ authority and introducing elections of committee members lifted the average child’s
learning in Indonesian language (Pradhan et al., 2014). Another programme found that
improving the power of parent-teacher associations helped reduce nepotism in the appointment
of teachers (Duflo et al., 2015). However, while methodologically robust, it is worth noting
though that neither of these studies disaggregates effects according to students’ backgrounds,
leaving unclear the extent to which such practices can reduce socio-economic inequalities. With
regard to gender inequalities, one study in rural India found that increasing the numer of women
in leadership positions led to an improvement in girls’ reading ability (Beaman et al., 2012).

27
5. Improving data systems for monitoring progress in
learning
Available evidence suggests that learning
inequalities in low- and lower middle-income
countries are apparent from the first year of
schooling, and even before children start school
and learning gaps then widen through the
primary school years. Those least likely to be
learning live in households affected by poverty,
with disadvantage reinforced by where a child
lives, their gender and whether they have a
disability. These factors should not determine a
child’s learning potential. Given uneven
progress through primary schooling, and that
this progress often depends on sources of
inequality associated with inherited
disadvantage, there is a need to track progress
in learning of children from before they start
school to identify where interventions can have the greatest impact.
Based on the analysis in this ‘think piece’ paper, we recommend that a post-2015 learning
target assesses whether children have achieved a combined measure of ‘readiness to learn’ in
mathematics and literacy by the age at which they would have spent at least five years in school
in most systems (for example, age 12).15 Tracking by age rather than grade has the benefits of
including all children, regardless of whether they are in school.16 The measure also ensures
children have acquired the skills needed to support their further learning – otherwise there is a
high risk that those who have not achieved these foundations will continue to be left behind.
Such tracking of progress could be achieved by adopting a sample-based household survey of
the kind adopted by ASER and Uwezo surveys, which also has the benefits of enabling the
collection of data related to the background characteristics of the children and their households.
These surveys randomly select villages and households within districts, and provide survey
weights to account for the different sizes of different districts. The robust nature of this sampling
approach provides nationally representative data without a need to visit all households, as in a
census. In addition, a sample-based approach that assesses children in households has the
dual benefit of providing information on out-of-school children, and avoiding unintended
consequences of school-based assessments, such as schools putting forward their most able
children and ‘teaching to the test’.
ASER and Uwezo tools analysed in this paper further show how data using a test that is simple
to adopt, straightforward to analyse, and whose results are easy to communicate, can allow
national citizens and the global community to hold policymakers to account. ASER and Uwezo
surveys have been grounded in local realities, with a key benefit of enabling them to work with
15 Evidence suggests that if children spend no more than four years in school, they are unlikely to sustain these basic skills, even if they had acquired them while in school (UNESCO, 2014a). 16 As ASER and Uwezo surveys capture children of different ages within households, this allows analysis of children’s learning before they start school and over the school cycle.
Key messages
To keep track of learning inequalities,
longitudinal household surveys are
needed that include information on
children’s learning (whether in or out of
school) together with information on their
characteristics.
In order to identify how to tackle
inequalities, such household surveys
should be established in a way that
allows them to be combined with
administrative data on school conditions.

28
local communities to identify solutions. Their simplicity also has benefits in terms of the data
potentially being collected at relatively low cost.
It is, of course, also important that the data are reliable and valid. Recent work comparing ASER
India data with the country’s national achievement survey data shows that they do indeed meet
the necessary standards, including strong test-retest reliabiliy, satisfactory inter-rater reliability,
and high comparability to USAID’s Fluency Battery, which is a test of reading aptitude (ASER,
2013). Similarly, Uwezo’s literacy and numeracy tests are found to be reliable across the three
countries to an extent that is comparable with the PISA and EGRA assessments, and its
findings are also consistent with those of the SACMEQ assessments in the same countries
(Jones et al., 2014).
Given that ASER and Uwezo data are publicly available, they open themselves to scrutiny. It is
also notable that such scrutiny has resulted in a publicly-available external evaluation (Results
for Development Institute, 2015). It has been identified that improvements can be made to these
learning tools as currently implemented. Specifically, the comparability of reading tests across
languages has yet to be established, and the current administration and scoring methods do not
allow for analysis using item response theory. A central focus of item response theory is the
extent to which questions pitched at a certain skill level are actually of identical difficulty. Since
the ASER and Uwezo surveys do not record which exact number-identification question, for
example, each child attempts, it is not possible to check whether some children are receiving
easier questions testing this skill than others. It is important though, that identifying potential
shortcomings is used to strengthen data for open use, rather than endangering making data
publicly available which is vital for ensuring that they are used to hold policymakers and schools
to account.
Identifying who is and is not learning is just the first step. In principle, schools should be
institutions that help to rectify inequalities. Too often though, they have the opposite effect,
resulting in a widening of gaps over a school cycle. We therefore need to understand better
what schools need to do to address learning inequalities. One problem with adopting a
household survey approach could be that it does not link with information within schools, which
is needed for such an analysis. Surveys such as ASER and Uwezo are in principle able to
overcome this by collecting information on a sub-sample of schools that can, in turn, be linked
with children who have been surveyed in households. Another approach is to code schools that
allow data collected from households to be linked with administrative data collected on schools,
such as on class size, facilities, teacher preparation, and teaching practices.
The ASER and Uwezo approaches also have the potential to provide panel data, allowing an
assessment of the trajectories of learning for different groups of children over time (although
they are not currently available as a panel dataset). In low- and lower-middle income countries,
Young Lives is currently the main publicly available source of data of this kind (although with a
longer time lag than ASER and Uwezo). These data, as well as those of APRESt17
(Muralidharan and Zieleniak, 2013), have the potential benefit of offering information on a wider
range of competencies than ASER and Uwezo.
17 The Andhra Pradesh Randomized Evaluation Studies (APRESt) hold data from a range of policy evaluations that have used random allocation.These data are not currently publicly available.

29
While Young Lives data are richer than ASER and Uwezo in terms of the broader information
collected (for example on health, employment, etc.) and these and APRESt are more
comprehensive in terms of the competencies tested, their depth means that they have been
collected on a narrower geographical scale and, as such, are not representative of the countries
as a whole. This potential trade-off between depth and scale is an issue that deserves further
consideration, depending on the purpose of the data being collected.
Lessons can be also learned from England’s experience with the use of data for policy-related
research. English administrative and survey data could be considered a gold standard in terms
of information available for assessing learning trajectories. An important feature of the data
available is that administrative and survey data from different sources are combined to allow
analysis across census data, birth cohort studies and international and national learning
assessments. These comprehensive data enable researchers and policymakers alike to track
the academic progress of the entire population of school children throughout their schooling.
The data also permit analysis of the progress of children from different socio-economic
backgrounds, and particularly enable researchers to measure the correlation between children’s
socio-economic background, health status and academic achievement – information that can
inform policymaking, and, ultimately, teaching practices in the classroom. Replicating such an
approach in low- and lower-middle income countries is likely to be difficult both in terms of cost
as well as the stringent need for data protection policies to be enforced to ensure anonymity of
individuals and schools. However, lessons can be learned for these countries in terms of the
type of data collected and cost-effective approaches to combining available data from different
sources (Vignoles, 2014).
A further lesson that can be learned from the UK experience is the importance of being mindful
of unintended consequences where learning assessments are used for the purposes of
accountability, such as the danger of incentivising teaching to the test . To avoid unduly
influencing teacher and school behaviour in this way it is important that accountability systems
use multiple measures to assess pupils. Indeed one approach, for example, has been to
triangulate data from international surveys with national assessments (Vignoles, 2014).
Overall, a focus on tracking progress in learning inequalities does not imply the need for a
global system of international large-scale assessment using the same approach across all
countries. Rather, national systems should be adopted and adjusted to be appropriate to each
country’s realities and needs.18
18 The ongoing work by Australian Council for Educational Research (ACER) and the UNESCO Institute for Statistics is already providing invaluable insights to showing how such information from different sources can be aligned for global comparisons (ACER et al., 2014).

30
6. Conclusion
The Sustainable Development Goals are providing a much-needed focus on the importance of
raising learning outcomes, ensuring that noone is left behind. This paper has shown that, to be
successful, it will be vital for interventions to focus on children before they even enter school
and in the early years, as this is where inequalities begin. Inequalities then widen over the
school cycle, making it even more difficult to tackle as children get older.
Interventions are needed to ensure teaching is at the right pace for those who face the greatest
difficulties with their learning, and that these children are provided with the best teachers.
Learning materials are also important, but only likely to be effective if teachers are appropriately
trained in their use and are pitched at the right level. For reforms to be implemented, parents
and communities need to be empowered to advocate for reforms needed to support their
children’s learning, with special measures needed to promote the participation of marginalised
groups in society.
Finally, this ‘think piece’ paper calls for better data to track progress to assess whether all
children are learning, regardless of their circumstances. Given the large numbers of children not
learning the basics in reading and mathematics, this needs to be a starting point for tracking
progress, recognising that strong foundations in the basics are needed for children’s further
learning. Putting in place ‘stepping-stone’ targets for sub-groups of the population within
countries, and so tracking progress of the most marginalised groups, will act as an early
warning signal on whether progress is rapid enough to ensure all children are learning by 2030.
Acknowledgments
We are grateful to the following for comments on earlier versions of this paper: Stuart Cameron,
Sonia Ilie and John Mugo, and anonymous reviewers and seminar participants at DFID.

31
Appendix: details of model used for Figures 4 and 5
We use ordinary least-squares (OLS) regression to estimate the inferential model on which
Figure 4 and Figure 5 are based. OLS regression analyses the impact of an independent
variable on the probability of a categorical outcome whilst holding constant the impact of the
other independent variables included in the model. The data for the model come from ASER
India’s household surveys from 2008 to 2013. Our outcome of interest is whether a child has
learned the basics in numeracy and literacy, which we define as the ability both to divide and to
read a story. The background characteristics that we use to predict this outcome are gender,
socio-economic status, and parental education.
It is important to note though that this model identifies associations rather than causal
relationships. We try to control for a range of characteristics, but omitted variable bias is likely
to exist in this model. For example, we control for children’s current type of school, but have no
additional information on the quality of schooling, or on previous education, including pre-
school.
Data
The ASER survey is conducted in every rural district in India. For its household surveys, ASER
uses a stratified random-sampling survey design: every district in the country is surveyed, and
then, within each district, 20 villages from the previous two years are re-surveyed and 10 more
are selected at random. Within each of these 30 villages, the ASER team members selected
and surveyed 20 households. We account for this survey design in our inferential model by
using the appropriate population weights and clustering standard errors with Stata’s ‘svyset’
command.
Model predictors and controls
Our model predictors are gender, socio-economic status, and parental education. To assess
socio-economic status, for each household we calculate a wealth index. Following the example
of Saeed and Zia (2014) in relation to ASER Pakistan, we generate this index through a factor
analysis of the following characteristics of the child’s household: type of house (mud, brick and
mud, or mud and cement), whether the house has electricity, a mobile phone, and a television.19
We assess parental education according to two dichotomous variables: whether the child’s
mother attended school and whether the child’s father attended school, each of which is based
on the given parent’s self-report.
In addition, we control for whether each child attends a government or private school, whether
they receive private tutoring, the year in which they took part in the survey, and the state and
district in which they live.
Model specification
Our dependent variable, whether a child has learned the basics, is dichotomous, and, in recent
years, the convention in many social science fields has been to estimate logistic regression
models for outcomes of this nature (Hellevik, 2009; Mood, 2010). However, we prefer to use
19 The sole difference between our index and that of Saeed and Zia is that we do not also consider home ownership, since this information was not collected in the 2009–2013 ASER India surveys.

32
OLS regression for this model, as countervailing evidence suggests that OLS is comparable to
logistic regression in terms of the accuracy of model predictions and preferable in terms of the
intuitiveness with which one can interpret each model’s estimated coefficients (Angrist and
Pischke, 2008; Hellevik, 2009).
In addition, we use interaction terms between our predictor variables and child age. We do this
to assess whether the power of our predictors varies by children’s age. Whereas the
interpretation of interaction effects in OLS is relatively straightforward, in logistic regression
models it is more precarious (Ai and Norton, 2003; Norton et al., 2004). Given that interaction
terms are an essential component of our strategy, this provides further grounds for us to prefer
OLS in this study.
Letting Yi denote whether child i has learned the basics, we estimate the following model:
Where X1 refers to the age of child i, and X2 to Xk refer to the other predictor and control
variables above. We interact the predictor variables with child age, but we do not interact the
control variables with child age. Each β parameter represents the average change in Y
associated with a one-unit increase in the given explanatory variable, and the error term εi is
normally distributed with a mean of zero.
On the basis of this model, for Figure 4 we chart the estimated coefficient for each predictor
(including the interaction term) to show these coefficients change over child ages. For Figure 5,
we use Stata’s ‘margins’ command to plot model estimates of the predicted outcome for a child
with the given characteristics when holding constant all other variables in the model.
....)()( 315342132211 ikikiiiiiiii XXXXXXXXY

33
Bibliography
Aboud, F. E., and Hossain, K. (2011). The impact of preprimary school on primary school
achievement in Bangladesh. Early Childhood Research Quarterly, 26(2), 237–246.
ACER, UIS, and DFAT (2014). Learning Metrics Partnership. A capacity support and policy
strengthening initiative to develop and use common learning metrics for reading and
mathematics. Available at www.acer.edu.au/files/learning-metrics-partnership.pdf
Aguilar, R., and Tansini, R. (2012). Joint analysis of preschool attendance and school
performance in the short and long-run. International Journal of Educational Development,
32(2), 224–231.
Ai, C., and Norton, E. C. (2003). Interaction terms in logit and probit models. Economics
Letters, 80(1), 123–129.
Akyeampong, K., Lussier, K., Pryor, J., and Westbrook, J. (2013). Improving teaching and
learning of basic maths and reading in Africa: Does teacher preparation count?. International
Journal of Educational Development, 33(3), 272–282.
Alcott, B., and Rose, P. (2015). Schools and learning in rural India and Pakistan: who goes
where, and how much are they learning. Prospects (in press).
Altinok, N. (2009). An empirical approach to marginalization in education based on the TIMSS
2007 study. Background paper for EFA Global Monitoring Report 2010.
Altinok, N. (2013). Performance differences between subpopulations in TIMSS, PIRLS,
SACMEQ and PASEC. Background paper for EFA Global Monitoring Report 2013/4.
Angrist, J. D., and Pischke, J. S. (2008). Mostly harmless econometrics: An empiricist's
companion. Princeton, NJ: Princeton University Press.
ASER (2013). Comparison of ASER and NCERT’s National Achievement Survey (NAS)–
Class V. Available at
http://img.asercentre.org/docs/Bottom%20Panel/Key%20Docs/nas_stdvvs_aser.pdf
ASER Pakistan (2015). Annual Status of Education Report: ASER-Pakistan 2014. Available at
www.aserpakistan.org/document/aser/2014/reports/national/ASER_National_Report_2014.pdf
Banerjee, A. V., Banerji, R., Duflo, E., Glennerster, R., and Khemani, S. (2010). Pitfalls of
participatory programs: Evidence from a randomized evaluation in education in India. American
Economic Journal: Economic Policy, 2(1), 1–30.
Banerjee, A. V., Cole, S., Duflo, E., and Linden, L. (2007). Remedying education: Evidence from
two randomized experiments in India. The Quarterly Journal of Economics, 122(3), 1235–1264.
Banerjee, A. V., Duflo, E., and Walton, M. (2011). Preliminary report on the impact evaluation of
Read India.
Bangay, C. (2015). Why are citizen led learning assessments not having an impact on home soil
– and how can we change that? EFA Report. Available at
https://efareport.wordpress.com/2015/06/02/why-are-citizen-led-learning-assessments-not-
having-an-impact-on-home-soil-and-how-can-we-change-that/

34
Beaman, L., Duflo, E., Pande, R., and Topalova, P. (2012). Female leadership raises
aspirations and educational attainment for girls: A policy experiment in India. Science,
335(6068), 582–586.
Beatty, A., and Pritchett, L. (2012). From schooling goals to learning goals: How fast can
student learning improve? CGD Policy Paper 012. Washington: Center for Global Development.
Bedard, K., and Cho, I. (2010). Early gender test score gaps across OECD countries.
Economics of Education Review, 29(3), 348–363.
Behrman, J. R., Parker, S. W., and Todd, P. E. (2009). Medium-term impacts of the
Oportunidades conditional cash transfer program on rural youth in Mexico. Poverty, Inequality
and Policy in Latin America, 219–270.
Berlinski, S., Galiani, S., and Gertler, P. (2009). The effect of pre-primary education on primary
school performance.Journal of Public Economics, 93(1), 219–234.
Bhattacharjea, S., Wadhwa, W., and Banerji, R. (2011). Inside primary schools: A study of
teaching and learning in rural India. Mumbai: ASER and Pratham Education Initiative.
Bhattacharjea, S., Wadhwa, W. and Ramanujan, P. (2013.) Progress through primary school in
rural India: Evidence from a longitudinal study. Available at
http://img.asercentre.org/docs/Publications/External%20publications/ukfiet_bhattacharjeawadhw
aramanujan_final.pdf
Blanden, J., and Machin, S. (2010). Intergenerational inequality in early years assessments.
Based on Children of the 21st century (Volume 2): The first five years. Millennium Cohort Study
Briefing 13. Available at www.cls.ioe.ac.uk/library-media/documents/briefing13_web(2).pdf
Burger, K. (2010). How does early childhood care and education affect cognitive development?
An international review of the effects of early interventions for children from different social
backgrounds. Early Childhood Research Quarterly, 25(2), 140–165.
Burger, R. (2011). School effectiveness in Zambia: The origins of differences between rural and
urban outcomes.Development Southern Africa, 28(2), 157–176.
Case, A., and Deaton, A. (1999). School inputs and educational outcomes in South Africa.
Quarterly Journal of Economics, 114(3), 1047–1084.
Chavan, M. (2015). Looking back and looking ahead. In Annual Status of Education Report
(Rural) 2014 (pp.1–4). ASER: New Delhi.
Conn, K (2014). Identifying effective education interventions in sub-Saharan Africa: A meta-
analysis of rigorous impact evaluations. Columbia University. Available at
http://dx.doi.org/10.7916/D898854G
Crouch, L., Korda, M., and Mumo, D. (2009). Improvements in reading skills in Kenya: An
experiment in the Malindi district. Prepared for the United States Agency for International
Development (USAID). Available at
www.eddataglobal.org/documents/index.cfm?fuseaction=pubDetail&ID=154

35
Cueto, S., Guerrero, G., Leon, J., Zapata, M., and Freire, S. (2014). The relationship between
socioeconomic status at age one, opportunities to learn and achievement in mathematics in
fourth grade in Peru. Oxford Review of Education, 40(1), 50–72.
Cunha, F., Heckman, J. J., and Schennach, S. M. (2010). Estimating the technology of cognitive
and noncognitive skill formation. Econometrica, 78(3), 883–931.
Das, J. (2013). Researching learning in low-income countries. Available at
www.worldbank.org/content/dam/Worldbank/Event/education/Das_WorldBank_2013.pdf
Davidson, M., and Hobbs, J. (2013). Delivering reading intervention to the poorest children:
The case of Liberia and EGRA-Plus, a primary grade reading assessment and intervention.
International Journal of Educational Development, 33(3), 283–293.
Duflo, E., Dupas, P., and Kremer, M. (2011). Peer effects, teacher incentives, and the impact of
tracking. American Economic Review, 101(5), 1739–1774.
Duflo, E., Dupas, P., and Kremer, M. (2015). School governance, teacher incentives, and
pupil–teacher ratios: Experimental evidence from Kenyan primary schools. Journal of Public
Economics, 123(2015), 92–110.
Duncan, G., and Magnuson, K. (2011). The nature and impact of early achievement skills,
attention skills and behavior problems. In G. Duncan and R. Murnane (Eds), Whither
opportunity? Rising inequality, schools, and children's life chances (pp. 47–69). New York:
Russell Sage Foundation.
Educational Initiatives (2010). Student learning study: Status of student learning across 18
states of India in urban and rural schools. Ahmedabad Educational Initiatives.
Education Policy and Data Center (2015). ASER, UWEZO and Beekungo. Available at
www.epdc.org/data-about-epdc-data-epdc-learning-outcomes-data/aser-uwezo-and-beekungo
Engle, P. L., Fernald, L. C., Alderman, H., Behrman, J., O'Gara, C., and Yousafzai, A., (2011).
Strategies for reducing inequalities and improving developmental outcomes for young children
in low-income and middle-income countries. The Lancet, 378(9799), 1339–1353.
Evans, D. (2015). How systematic is that systematic review? The case of improving learning
outcomes. Available at http://blogs.worldbank.org/impactevaluations/how-systematic-
systematic-review-case-improving-learning-outcomes
Fehrler, S., and Michaelowa, K. (2009). Education marginalization in sub-Saharan Africa.
Background paper for EFA Global Monitoring Report 2010.
Feinstein, L. (2003). Inequality in the early cognitive development of British children in the 1970
cohort. Economica, 70(277), 73–97.
Fox, J. (2014). Social accountability: what does the evidence really say? Global Partnership for
Social Accountability, The World Bank Group.
Galab, S., Jones, C., Latham, M., and Churches, R. (2013). Community-based accountability for
school improvement: A case study from rural India. CfBT Education Trust. Available at
http://cdn.cfbt.com/~/media/cfbtcorporate/files/research/2013/r-community-based-accountability-
in-india-2013.pdf

36
Glewwe, P. W., Hanushek, E. A., Humpage, S. D., and Ravina, R. (2013). School resources
and educational outcomes in developing countries: A review of the literature from 1990 to 2010.
In Glewwe, P. W. (Ed.), Education policy in developing countries (pp.13–64). Chicago, IL:
University of Chicago Press.
Glewwe, P., Ilias, N., and Kremer, M. (2010). Teacher incentives. American Economic Journal:
Applied Economics, 2(3): 205–227.
Glewwe, P., Kremer, M., and Moulin, S. (2009). Many children left behind? Textbooks and test
scores in Kenya. American Economic Journal: Applied Economics, 1(1), 112–135.
Glewwe, P., Kremer, M., Moulin, S., and Zitzewitz, E. (2004). Retrospective vs. prospective
analyses of school inputs: the case of flip charts in Kenya. Journal of development
Economics, 74(1), 251–268.
Glewwe, P., Krutikova, S., and Rolleston, C. (2014). Do schools reinforce or reduce learning
gaps between advantaged and disadvantaged students? Evidence from Vietnam and Peru.
Available at www.younglives.org.uk/files/working-papers/wp133_learning-gaps
Glick, P., and Sahn, D. E. (2010). Early academic performance, grade repetition, and school
attainment in Senegal: A panel data analysis. The World Bank Economic Review, 24(1),
93–120.
Goodman, A., Sibieta, L., and Washbook, E. (2009). Inequalities in educational outcomes
among children aged 3 to 16. London: National Equality Panel, Institute for Fiscal Studies.
He, F., Linden, L., and MacLeod, M. (2007). Helping teach what teachers don’t know: an
assessment of the Pratham English language program. Cambridge, MA: Abdul Latif Jameel
Poverty Action Lab (JPAL).
Hellevik, O. (2009). Linear versus logistic regression when the dependent variable is a
dichotomy. Quality & Quantity, 43(1), 59–74.
Heyneman, S. P., and Loxley, W. A. (1983). The effect of primary-school quality on academic
achievement across twenty-nine high-and low-income countries. American Journal of Sociology,
88(6), 1162–1194.
Hungi, N., Ngware, M., and Abuya, B. (2014). Examining the impact of age on literacy
achievement among Grade 6 primary school pupils in Kenya. International Journal of
Educational Development, 39(2014), 237–249.
Hungi, N., and Thuku, F. W. (2010). Variations in reading achievement across 14 Southern
African school systems: Which factors matter? International Review of Education, 56(1),
63–101.
Jerrim, J., and Vignoles, A. (2013). Social mobility, regression to the mean and the cognitive
development of high ability children from disadvantaged homes. Journal of the Royal Statistical
Society: Series A (Statistics in Society), 176(4), 887–906.
Jones, S. (2014a). The components and consequences of learning inequalities in East Africa.
Draft working paper.

37
Jones, S. (2014b). Raising education quality in East Africa: where should we focus? University
of Cophenhagen. Available at
www.jones-sam.com/uploads/2/5/5/2/25529737/2014-10-09.classsize.pdf
Jones, S., and Schipper, Y. (2012). Does family background matter for learning in East Africa?
Africa Education Review, 12(1), 7–27.
Jones, S., Schipper, Y., Ruto, S., and Rajani, R. (2014). Can your child read and count?
Measuring learning outcomes in East Africa. Journal of African Economies, 23(5), 643–672.
Jung, H., and Hasan, A. (2014). The impact of early childhood education on early achievement
gaps: evidence from the Indonesia early childhood education and development (ECED) project,
Volume 1. Policy Research Working Paper 6794. Washington: World Bank.
Klasen, S., and Lange, S. (2012). Getting progress right: Measuring progress towards the
MDGs against historical trends. Discussion Paper No. 87. Göttingen: Courant Research Centre.
Available at www2.vwl.wiso.uni-goettingen.de/courant-papers/CRC-PEG_DP_87.pdf
Kremer, M., Brannen, C., and Glennerster, R. (2013). The challenge of education and learning
in the developing world. Science, 340(6130), 297–300.
Krishnaratne, S., White, H., and Carpenter, E. (2013). Quality education for all children? What
works in education in developing countries. Working Paper 20. New Delhi: International Initiative
for Impact Evaluation (3ie).
Kuecken, M., and Valfort, M. A. (2013). When do textbooks matter for achievement? Evidence
from African primary schools. Economics Letters,119(3), 311–315.
Laugharn, P. (2007). Negotiating education for many: enrolment, dropout and persistence in the
community schools of Kolondièba, Mali. CREATE Research Monograph No. 14. Brighton:
University of Sussex.
Lee, V. E., and Zuze, T. L. (2011). School resources and academic performance in Sub-
Saharan Africa. Comparative Education Review, 55(3), 369–397.
Lewin, K. M., and Sabates, R. (2012). Who gets what? Is improved access to basic education
pro-poor in Sub-Saharan Africa? International Journal of Educational Development, 32(4),
517–528.
Lieberman, E., Posner, D., and Tsai, L. (2012). Does information lead to more active
citizenship? An evaluation of the impact of the Uwezo initiative in Kenya. Dar es Salaam:
Twaweza.
McEwan, P. J. (2014). Improving learning in primary schools of developing countries: A meta-
analysis of randomized experiments. Review of Educational Research, 0034654314553127
Michaelowa, K., (2001). Primary education quality in Francophone sub-Saharan Africa:
Determinants of learning achievement and efficiency considerations. World Development,
29(19): 1699–1716.
Mitton, G. (2008). Success in early reading pilot project in Mali and Niger: Implementation
report. Available at www.eddataglobal.org/documents/index.cfm?fuseaction=pubDetail&ID=173
38
Moloi, M. Q., and Chetty, M. (2010). The SACMEQ III project in South Africa: A study of the
conditions of schooling and the quality of education. Pretoria: South Africa Ministry of Basic
Education.
Mood, C. (2010). Logistic regression: Why we cannot do what we think we can do, and what we
can do about it. European Sociological Review, 26(1), 67–82.
Mukerji, S., and Walton, M. (2012). Learning the right lessons: Measurement, experimentation
and the need to turn India’s Right to Education Act upside down. India Infrastructure Report
2012, IDFC. New Delhi: Routledge.
Muralidharan, K., and Sundararaman, V. (2011). Teacher performance pay: Experimental
evidence from India. The Journal of Political Economy, 119(1), 39–77.
Muralidharan, K., and Zieleniak, Y. (2013). Meauring learning trajectories in developing
countries with longitudinal data and item response theory. Presentation for Young Lives
Conference, Oxford. Available at www.fsmevents.com/younglives/session04/slides.pdf
Murnane, R. J., and Ganimian, A. J. (2014). Improving educational outcomes in developing
countries: Lessons from rigorous evaluations. NBER Working Paper No. 20284). National
Bureau of Economic Research.
Nguyen, T. (2008). Information, role models and perceived returns to education: experimental
evidence from Madagascar. Job Market Paper. Available at
www.povertyactionlab.org/doc/information-role-models-and-perceived-returns-education
Ngware, M., Oketch, M., Mutisya, M., and Abuya, B. (2010). Classroom observation study: A
report on the quality and learning in primary schools in Kenya. Nairobi: African Population and
Health Research Center. Available at
http://aphrc.org/catalog/microdata/index.php/catalog/64/download/512
Norton, E. C., Wang, H., and Ai, C. (2004). Computing interaction effects and standard errors in
logit and probit models. Stata Journal, 4(2) 154–167.
OECD (2007). PISA 2006: Science competencies for tomorrow's world. Paris: Organisation for
Economic Co-operation and Development, Programme for International Student Assessment.
OECD. (2009). Education at a glance: OECD indicators 2009. Paris: Organisation for Economic
Co-operation and Development.
OECD (2010). PISA 2009 results: What makes a school successful? Resources, policies and
practices (Volume IV). Paris: Organisation for Economic Co-operation and Development.
O’Sullivan, M. C. (2006). Teaching large classes: The international evidence and a discussion of
some good practice in Ugandan primary schools. International Journal of Educational
Development, 26(1), 24–37.
PAISA (2014). Do schools get their money? (PAISA national report 2014). Centre for Policy
Research – Accountability Initiative. Available at
www.accountabilityindia.in/sites/default/files/paisa_2014.pdf

39
Pandey, P., Goya, S., and Sundararaman, V. (2008). Community participation in public schools:
Impact of information campaigns in three Indian states. Available at
http://ideas.repec.org/p/wbk/wbrwps/4776.html
Pradhan, M., Suryadarma, D., Beatty, A., Wong, M., Gaduh, A., Alisjahbana, A., and Artha, R.
P. (2014). Improving educational quality through enhancing community participation: Results
from a randomized field experiment in Indonesia. American Economic Journal: Applied
Economics, 6(2), 105–26.
Pritchett, L., and Beatty, A. (2015). Slow down, you’re going too fast: Matching curricula to
student skill levels. International Journal of Educational Development, 40(2015), 276–288.
Ramachandran V. (2004). Gender and social equity in primary education: hierarchies of access.
Thousand Oaks, CA: Sage.
Reardon, S. (2011). The widening academic achievement gap between the rich and the poor:
new evidence and possible explanations. In G. Duncan and R. Murnane (Eds), Whither
opportunity? Rising inequality, schools, and children's life chances (pp. 91–116). New York:
Russell Sage Foundation.
Results for Development (2015). Bringing learning to light: The role of citizen-led assessments
in shifting the education agenda. Washington DC: Results for Development Institute. Available
at
http://r4d.org/sites/resultsfordevelopment.org/files/resources/Bringing%20Learning%20to%20Li
ght_English.pdf
Rolleston, C. (2014). Learning profiles and the ‘skills gap’in four developing countries: A
comparative analysis of schooling and skills development. Oxford Review of Education, 40(1),
132–150.
Rolleston, C., James, Z., and Aurino, E. (2014). Exploring the effect of educational opportunity
and inequality on learning outcomes in Ethiopia, Peru, India, and Vietnam. Background Paper
for the UNESCO Education for All Global Monitoring Report 2013/4.
Rolleston, C., and Krutikova, S. (2014). Equalising opportunity? School quality and home
disadvantage in Vietnam. Oxford Review of Education, 40(1), 112–131.
Rose, P. (2015). Three lessons for educational quality in post-2015 goals and targets: Clarity,
measurability and equity. International Journal of Educational Development, 40, 289–296.
Rose, P., and Alcott, B. (2015). Learning in India’s primary schools: how do inequalities change
across the school grades? Working paper.
Saeed, S., and Zia, H. (2014). Measuring gender and educational inequality: Addressing the
marginalized. In Annual Status of Education Report: ASER-Pakistan 2013. National (pp. 18–20).
Lahore: SAFED.
Save the Children (2014). Leaving no one behind: Embedding equity in the post-2015
framework through stepping stone targets. London: Save the Children. Available at
www.savethechildren.org.uk/sites/default/files/images/Leaving_No_One_Behind.pdf

40
Schütz, G., Ursprung, H. W., and Wößmann, L. (2008). Education policy and equality of
opportunity. Kyklos, 61(2), 279–308.
Singh, A. (2014). Emergence and evolution of learning gaps across countries: Panel evidence
from Ethiopia, India, Peru and Vietnam. University of Oxford. Available at
www.dropbox.com/s/3hkclocwbjbfolc/Learning%20divergence%20and%20comparative%20sch
ooling%20quality.pdf
Spaull, N. (2013). Poverty & privilege: Primary school inequality in South Africa. International
Journal of Educational Development, 33(5), 436–447.
Spaull, N., and Kotze, J. (2015). Starting behind and staying behind in South Africa: The case of
insurmountable learning deficits in mathematics. International Journal of Educational
Development, 41(2015), 13–24.
Spaull, N., and Taylor, S. (2015). Access to what? Creating a composite measure of educational
quantity and educational quality for 11 African countries. Comparative Education Review, 59(1),
133–165.
Tanzania National Bureau of Statistics (2010). Tanzania Disability Survey Report 2008. Dar es
Salaam, U.R.: Tanzania National Bureau of Statistics.
Tayyaba, S. (2012). Rural-urban gaps in academic achievement, schooling conditions, student,
and teachers' characteristics in Pakistan. International Journal of Educational Management,
26(1), 6–26.
UNESCO (2011). Global Monitoring Report 2011: The hidden crisis: Armed conflict and
education. Paris: UNESCO.
UNESCO (2012). Global Monitoring Report 2012: Youth and skills: Putting education to work.
Paris: UNESCO.
UNESCO (2014a). Global Monitoring Report 2013/4: Teaching and learning: Achieving quality
for all. Paris: UNESCO.
UNESCO (2014b). Wanted: Trained teachers to ensure every child’s right to primary education.
Policy Paper 15. Paris: UNESCO.
UNESCO (2015). Global Monitoring Report 2015. Education for all 2000-2015: achievements
and challenges. Paris: UNESCO.
Uwezo (2013). Are our children learning? Literacy and numeracy across East Africa. Available
at www.uwezo.net/wp-content/uploads/2012/08/2013-Annual-Report-Final-Web-version.pdf
van der Berg, S., Girdwood, E., Shepherd, D., van Wyk, D., Kruger, J. Viljoen, J., Ezeobi, O.,
and Ntaka, P. (2013). The impact of the introduction of Ggrade R on learning outcomes.
Available at http://resep.sun.ac.za/wp-content/uploads/2014/06/Grade-R-Evaluation-1-3-25-
Final-Unpublished-Report-13-06-17.pdf
Varly, P. (2010). The monitoring of learning outcomes in Mali: Language of instruction and
teachers’ methods in Mali Grade 2 curriculum classrooms. Research Triangle Park, NC:
RTI International.

41
Vegas, E., and Petrow, J. (2008). Raising student learning in Latin America. The challenge for
the 21st Century. Washington, DC: World Bank.
Vignoles, A. (2014). What can rich countries tell us about measuring learning inequalities?
Presented at UKFIET roundtable, 17 November 2014, London. Achieving equitable quality
education post-2015: Indicators to measure progress towards learning and equity. Available at
www.ukfiet.org/wp-content/uploads/2014/11/Indicators-Roundtable-Materials.zip
Walker, S. P., Chang, S. M., Vera-Hernández, M., and Grantham-McGregor, S. (2011). Early
childhood stimulation benefits adult competence and reduces violent behavior.
Pediatrics, 127(5), 849–857.
Watkins, K. (2015). Leaving no one behind: an agenda for equity. The Lancet, 384(9961),
2248–2255.
Wei, X., Lenz, K. B., and Blackorby, J. (2012). Math growth trajectories of students with
disabilities: Disability category, gender, racial, and socioeconomic status differences from ages
7 to 17. Remedial and Special Education, 0741932512448253.
White, H. (2004). Books, buildings, and learning outcomes: An impact evaluation of World Bank
support to basic education in Ghana. Washington, DC: World Bank.
World Education Forum (2015). Incheon Declaration: Education 2030: Towards inclusive and
equitable quality education and lifelong learning for all. Available at
www.uis.unesco.org/Education/Documents/education_2030_incheon_declaration_en.pdf
Zeitlin, A., Bategeka, L., Guloba, M., Kasirye, I., and Mugisha, F. (2011). Management and
motivation in Ugandan primary schools: Impact evaluation final report. Centre for the Study of
African Economies, University of Oxford and Economic Policy Research Centre.
42
Disclaimer ‐ The Health & Education Advice & Resource Team (HEART) provides technical assistance and knowledge services to the British Government’s Department for International Development (DFID) and its
partners in support of pro‐poor programmes in education, health and nutrition. The HEART services are provided by a consortium of leading organisations in international development, health and education: Oxford Policy Management, CfBT, FHI360, HERA, the Institute of Development Studies, IMMPACT, the Liverpool School of Tropical Medicine and the Nuffield Centre for International Health and Development at the University of Leeds. HEART cannot be held responsible for errors or any consequences arising from the use of information contained in this report. Any views and opinions expressed do not necessarily reflect those of DFID or HEART or any other contributing organisation.
About
This paper is part of a series of think pieces produced by the Health & Education Advice & Resource Team (HEART), and commissioned by the UK’s Department for International Development (DFID) in 2015. The purpose of the series is to stimulate debate on the future direction of education development in low income countries; provide direction for future DFID research priorities; and provide evidence products that can inform policy and programming decisions. For any further enquiry, please contact info@heart‐resources.org Further HEART think pieces and reports are published online at www.heart‐resources.org