how disruptive is additive manufacturing_ubs_sept 2013
TRANSCRIPT

www.ubs.com/investmentresearch
This report has been prepared by UBS Limited. ANALYST CERTIFICATION AND REQUIRED DISCLOSURES BEGIN ON PAGE 37. UBS does and seeks to do business with companies covered in its research reports. As a result, investors should be aware that the firm may have a conflict of interest that could affect the objectivity of this report. Investors should consider this report as only a single factor in making their investment decision.
Global Research 26 September 2013
Q-Series®
Global industrials How disruptive is additive manufacturing?
What is additive manufacturing (AM)? AM (3D printing) is a potentially disruptive concept of manufacturing. It builds up objects layer by layer, rather than machining raw items. AM enables a new level of design freedom and could lower manufacturing costs significantly. So far, most AM applications can be found in rapid prototyping (cars, consumer products). However, the share of final product manufacturing is rising (aerospace, medical).
Why could AM be a disruptive technology and why not? In addition to extensive market research, we have conducted proprietary interviews with market participants. The stand-out advantages of AM are the potential for mass customisation, design freedom, and major cost reductions. AM’s current shortfalls are a lack of scale economies, low speed, limited materials, high costs and product finishing. AM’s economical score will be determined by printer and hence batch sizes, and packing efficiencies in addition to lower printer and material prices.
What could be the impact of 3D printing? The AM market (US$2.2 billion) amounts to just 0.02% of global manufacturing; hence, if AM were to impact only 1%, it would mean a 50-fold market increase. But AM’s weaknesses first need to be overcome, which could have a major impact on costs and product diversity. In our view, AM would then likely have a negative impact on globalisation and the concept of low-cost-labour manufacturing. Shipping, materials, machine tools and moulding machinery could be sectors seeing their markets shrink.
Investment conclusions: Still limited but potentially powerful longer term The attention around AM got a further boost by President Obama's speech in February. However, the near-term share price impact on the AM users like GE or Boeing seems small, given AM’s current shortfalls. Hence, also the negative impact on the potential AM losers such as Maersk will likely only be seen longer term. There are only a handful of listed pure AM firms, such as 3D Systems, Arcam, ExOne, Organovo and Stratasys which held a 28% market share in 2012, but are not covered by UBS.
Figure 1: End markets impacted by AM
Source: Industry data, UBS estimates
End market Market size(US$bn)
Reason for impact Listed stocks (examples)
Container shipping and shipyards 288 90% of world trade transported via ships Maersk, Cosco, Nippon Yusen, Hyundai, SHI
Jet engines and gas turbines 116 Weight and manufacturing cost savings, part complexity GE, United Tech, RR, MTU, Siemens, MHI
Machine tools and tooling 85 Potential market share loss from machine tools to AM Gildemeister, Mori Seiki, Sandvik, Kennametal
Injection moulding machines 20 Low-cost plastic parts production; moulds made with AM Fanuc, Nissei, Sumitomo Heavy
Titanium (sponge) 5 Titanium waste reduction in the aerospace industry Osaka Titanium, VSMPO, Eramet, ATI Metals
AM industry 2 Listed pure-play AM firms hold 28% market share Stratasys, 3D Systems, ExOne, Arcam
Equities
Global
Industrial
Sven Weier Analyst
[email protected] +49-69-1369 8278
Fredric Stahl, CFA Analyst
[email protected] +46-8-453 7309
Sebastian Ubert Analyst
[email protected] +49-69-1369 8243
Guillermo Peigneux Lojo Analyst
[email protected] +46-8-453 7308
Erik Eikeland Associate Analyst
[email protected] +46-8-453 7306
Q-Series®: Global industrials 26 September 2013 2
Contents
Executive summary .......................................................................... 3
What is additive manufacturing? ................................................................. 4
Industrial uses of AM ................................................................................... 4
AM’s requirements and timing ..................................................................... 5
AM system makers ...................................................................................... 5
Listed AM stocks .......................................................................................... 6
The impact of AM ........................................................................................ 7
Additive manufacturing .................................................................. 8
What is additive manufacturing? ................................................................. 8
Additive versus subtractive ......................................................................... 11
Pros and cons of AM ................................................................................. 11
Industrial uses of AM ................................................................................. 12
AM system makers .................................................................................... 14
The potential impact on cost of production ............................................... 16
AM’s requirements and timing ..................................................... 19
The surveys ................................................................................................ 19
IP and warranty .............................................................................. 22
Listed AM stocks ............................................................................ 23
The impact of AM ........................................................................... 24
Our scenarios ............................................................................................. 25
Economic impact ....................................................................................... 26
Share prices and valuations as at 25 September 2013 unless otherwise stated.
We would like to thank Ankit Goenka, an employee of Cognizant Group, for his assistance in preparing this research report. Cognizant staff provide research support services to UBS.
UBS’s Q-Series® products reflect our effort to aggressively anticipate and answer key investment questions, to help drive better investment recommendations. Q-Series® is a trademark of UBS AG.
Sven Weier Analyst
[email protected] +49-69-1369 8278
Fredric Stahl, CFA Analyst
[email protected] +46-8-453 7309
Sebastian Ubert Analyst
[email protected] +49-69-1369 8243
Guillermo Peigneux Lojo Analyst
[email protected] +46-8-453 7308
Erik Eikeland Associate Analyst
[email protected] +46-8-453 7306

Q-Series®: Global industrials 26 September 2013 3
Executive summary
The impact of additive manufacturing
This Q-Series® report is aimed at answering the following questions:
(1) What is additive manufacturing, and is it a disruptive technology?
(2) What could be the impact of 3D printing?
(3) Why should financial markets bother about it in 2013 already?
Re (1): Additive manufacturing (AM) builds objects layer by layer, as opposed to the subtractive process of machining that is common today. It enables a new level of design freedom and could potentially lower manufacturing costs significantly. So far, most AM applications can be found in rapid prototyping, but the share of final product manufacturing is rising (mainly in aerospace and the medical industries). If AM overcomes its main shortfalls, such as low speed, limited materials, high printer and materials costs, as well as the product finishing, it could indeed become a disruptive technology – because of the substantial savings and the major side effect of changing the way global manufacturing is organised today. We regard a scenario as most likely in which AM is mostly used in hybrid manufacturing, which combines the strengths of traditional machining with those of AM.
Re (2): The AM market is worth US$2.2 billion and thus amounts to just 0.02% of global manufacturing (US$10.5 trillion). Although we think AM could be disruptive, we would not expect too much too soon. Today’s main industrial user of final AM products is aerospace, which is likely to expand its use only gradually. However, we would not underestimate the potential for a technological quantum leap either. If only 1% of manufacturing were to be affected, the global AM market would be almost 50x larger than today. If AM succeeds meaningfully, this would likely have a negative impact on low-cost-labour manufacturing. The emergence of advanced robotics and materials could stimulate that development further. Global shipping, raw materials, machine tools and moulding machinery could be sectors seeing their markets shrink as a result.
Re (3): The media attention around AM, which got boosted by President Obama’s State of the Union speech earlier this year, implies that the market seems to care about AM already today. While we think that AM could ultimately reach a 1% or even considerably higher penetration of global manufacturing, we think it will take much longer than the next five years for AM to reach this level, given the time it will likely take to meet the various technical and other requirements. The current 2021 market forecast of US$10.8 billion by Wohlers Associates would put AM at only 0.1% of global manufacturing. We believe the near-term share price impact of AM on both the potential AM users and losers, and on the shares that UBS covers, will be rather limited.

Q-Series®: Global industrials 26 September 2013 4
What is additive manufacturing?
Additive manufacturing (AM), which is also known as 3D printing (for private use systems), is a manufacturing process which creates 3D objects layer by layer from a 3D design file (typically in STL format) with a 3D printer. In traditional manufacturing, the production is subtractive in nature, ie, material is removed and scrapped to form the final output, whereas in additive manufacturing the raw materials are fused or bonded together to form the final output. Various AM technologies differ in the way the layers are formed (laser sintering, material extrusion, etc). 3D printing has taken a major leap from when it was initially developed for rapid prototyping applications. Today, it can support the building of complex objects, which can be printed from a variety of materials, including plastics, metals, ceramics, paper, resins and glass. Colours have also been added and further advancement is focused on making 3D printers that can print objects in more than one material, in bigger sizes and at higher speed.
Figure 2: Selective laser sintering process Figure 3: Pros and cons of AM
Source: www.arptech.com.au, UBS Source: Wohlers Report 2013, GE, UBS
Industrial uses of AM
The auto sector was one of the first to embrace AM for rapid prototyping, and it is still one of the most prominent users today. AM printing is also heavily used for prototyping in sporting goods and the consumer electronics sector, where product lifecycles are becoming ever shorter, and therefore the time to market and the reflection of latest consumer preferences are key. The sectors in which AM printing has already reached the level of final production are aerospace and the medical implant markets (dental; artificial hips) due to their low-batch production of highly specified parts, which are produced with expensive raw materials. AM could also impact the way companies generally produce spare parts, and this could result in less spare part stock-keeping and lower transport costs. The overall share of final products printed by AM has outperformed overall industry growth and today stands at c28%, versus only 4% some 10 years ago. This is because the technology and industry know-how has improved significantly, as have materials and printer availability. We expect the share of final products in total AM to rise further to 50% by 2020.
LASER SCANNER
ROLLERPOWDER
PART
Each layer Piston goes
up
Each layer Piston moves
down
Pros ConsMass customisation Lack of economies of scale
Lower wastage Raw material cost and availability
Design freedom Equipment cost and availability
Time to market (prototyping) Low speed (production)
Part consolidation IP and warranty issues
Tooling reduction Availability of 3D software
Inventory and logistics Product finishing
Packing efficiencies Design rules, certification process
Weight savings Process reliability and integration
Building three-dimensional objects layer by layer
AM has been around as a prototyping tool for the past 25 years
Q-Series®: Global industrials 26 September 2013 5
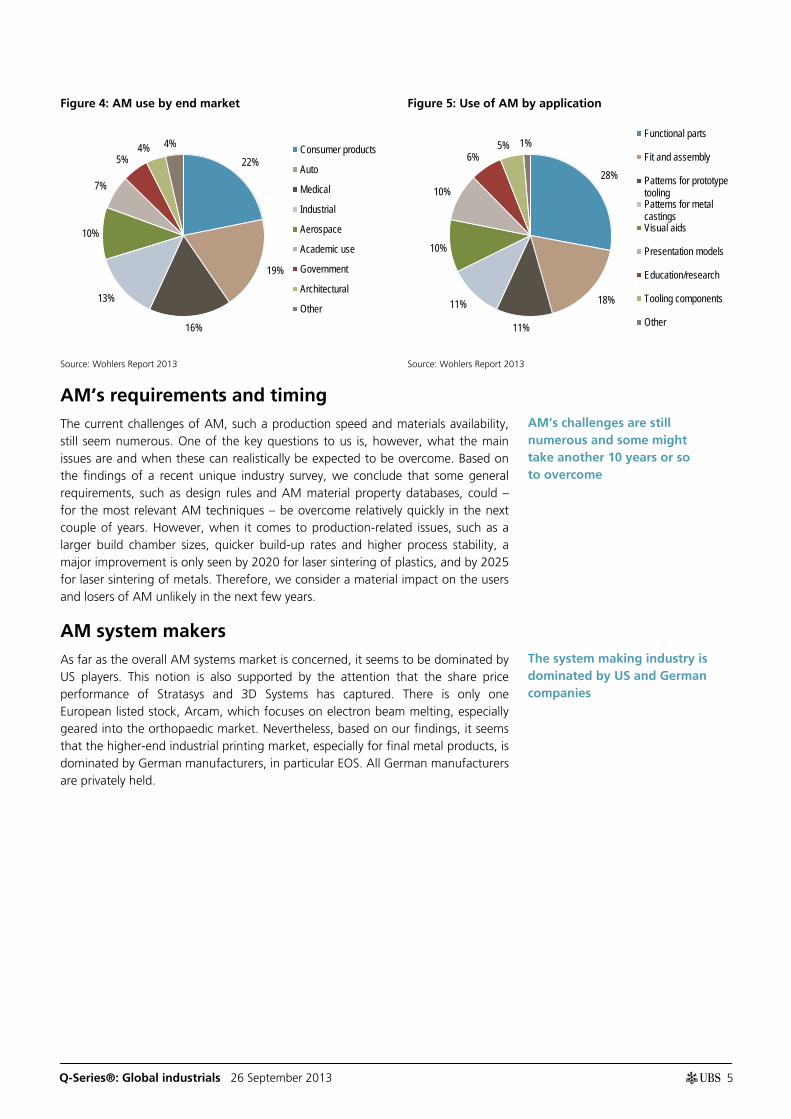
Figure 4: AM use by end market Figure 5: Use of AM by application
Source: Wohlers Report 2013 Source: Wohlers Report 2013
AM’s requirements and timing
The current challenges of AM, such a production speed and materials availability, still seem numerous. One of the key questions to us is, however, what the main issues are and when these can realistically be expected to be overcome. Based on the findings of a recent unique industry survey, we conclude that some general requirements, such as design rules and AM material property databases, could – for the most relevant AM techniques – be overcome relatively quickly in the next couple of years. However, when it comes to production-related issues, such as a larger build chamber sizes, quicker build-up rates and higher process stability, a major improvement is only seen by 2020 for laser sintering of plastics, and by 2025 for laser sintering of metals. Therefore, we consider a material impact on the users and losers of AM unlikely in the next few years.
AM system makers As far as the overall AM systems market is concerned, it seems to be dominated by US players. This notion is also supported by the attention that the share price performance of Stratasys and 3D Systems has captured. There is only one European listed stock, Arcam, which focuses on electron beam melting, especially geared into the orthopaedic market. Nevertheless, based on our findings, it seems that the higher-end industrial printing market, especially for final metal products, is dominated by German manufacturers, in particular EOS. All German manufacturers are privately held.
22%
19%
16%
13%
10%
7%
5% 4% 4% Consumer products
Auto
Medical
Industrial
Aerospace
Academic use
Government
Architectural
Other
28%
18%
11%
11%
10%
10%
6% 5% 1%
Functional parts
Fit and assembly
Patterns for prototypetoolingPatterns for metalcastingsVisual aids
Presentation models
Education/research
Tooling components
Other
AM’s challenges are still numerous and some might take another 10 years or so to overcome
The system making industry is dominated by US and German companies

Q-Series®: Global industrials 26 September 2013 6
Figure 6: AM metal systems market shares
Source: Tran Pham (www.tranpham.com)
Listed AM stocks
President Obama’s State of the Union speech in February caused a high level of media and market attention for AM (‘revolutionize the way we make almost everything’). Given the relatively low share of sales of AM users at present, and given our view on the speed of AM's penetration of the manufacturing sector, we think the financial impact of AM will likely be felt most seriously at those companies that are directly involved in AM hardware, software and services. The number of pure AM printing-exposed stocks is, however, still very limited and UBS does not cover these stocks. None of the German names that play a leading role for industrial AM are even listed.
Figure 7: Sales estimates for AM-related listed companies* (lc m)
Source: Factset * Pure-play stocks in bold.
46%
17%
10%
9%
6%
5% 3% 2% 2%
EOS
Concept Laser
Arcam
Phenix/AMT
Renishaw/MTT/SLM
Optomec (indirect)
Voxeljet (indirect)
ExOne
Other
2012 2013F 2014F 2015FSales CAGR 2012-2015F
Printer suppliers3D Systems 354 505 628 760 29.1%Arcam 139 185 240 312 30.9%ExOne 29 48 74 106 54.6%Renishaw 347 362 383 410 5.8%Stratasys 215 465 616 758 52.1%
3D softwareANSYS 808 871 957 1,030 8.4%Autodesk 2,312 2,279 2,361 2,588 3.8%Cimatron 42 43 46 NA NADassault Systems 2,039 2,143 2,334 2,557 7.8%Exa 49 54 62 65 10.1%PTC 1,258 1,286 1,339 1,422 4.2%Nemetschek 175 187 202 216 7.2%
President Obama ignited serious AM attention in February
Q-Series®: Global industrials 26 September 2013 7
The impact of AM
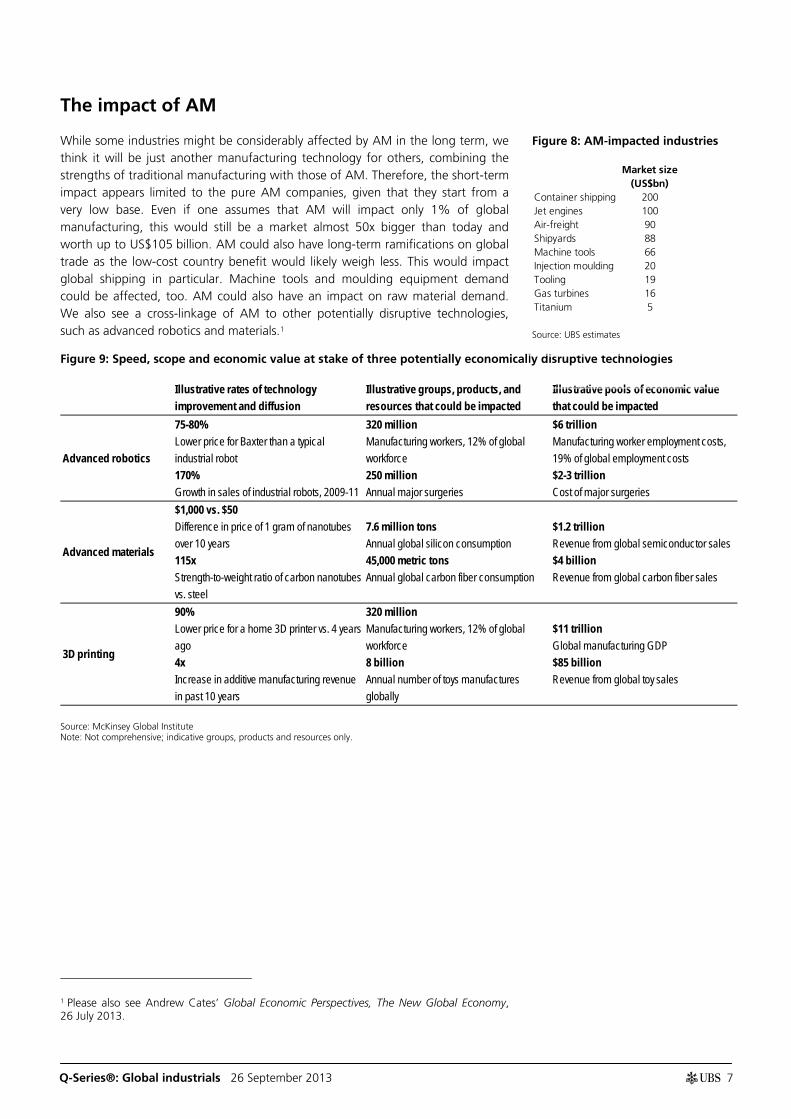
While some industries might be considerably affected by AM in the long term, we think it will be just another manufacturing technology for others, combining the strengths of traditional manufacturing with those of AM. Therefore, the short-term impact appears limited to the pure AM companies, given that they start from a very low base. Even if one assumes that AM will impact only 1% of global manufacturing, this would still be a market almost 50x bigger than today and worth up to US$105 billion. AM could also have long-term ramifications on global trade as the low-cost country benefit would likely weigh less. This would impact global shipping in particular. Machine tools and moulding equipment demand could be affected, too. AM could also have an impact on raw material demand. We also see a cross-linkage of AM to other potentially disruptive technologies, such as advanced robotics and materials.1
Figure 9: Speed, scope and economic value at stake of three potentially economically disruptive technologies
Source: McKinsey Global Institute Note: Not comprehensive; indicative groups, products and resources only.
1 Please also see Andrew Cates’ Global Economic Perspectives, The New Global Economy, 26 July 2013.
Illustrative rates of technology improvement and diffusion
Illustrative groups, products, and resources that could be impacted
Illustrative pools of economic value that could be impacted
Advanced robotics
75-80%Lower price for Baxter than a typical industrial robot170%Growth in sales of industrial robots, 2009-11
320 millionManufacturing workers, 12% of global workforce250 millionAnnual major surgeries
$6 trillionManufacturing worker employment costs, 19% of global employment costs$2-3 trillionCost of major surgeries
Advanced materials
$1,000 vs. $50Difference in price of 1 gram of nanotubes over 10 years115x Strength-to-weight ratio of carbon nanotubes vs. steel
7.6 million tonsAnnual global silicon consumption45,000 metric tonsAnnual global carbon fiber consumption
$1.2 trillionRevenue from global semiconductor sales$4 billionRevenue from global carbon fiber sales
3D printing
90%Lower price for a home 3D printer vs. 4 years ago4xIncrease in additive manufacturing revenue in past 10 years
320 millionManufacturing workers, 12% of global workforce8 billionAnnual number of toys manufactures globally
$11 trillionGlobal manufacturing GDP$85 billionRevenue from global toy sales
Figure 8: AM-impacted industries
Source: UBS estimates
Market size(US$bn)
Container shipping 200Jet engines 100Air-freight 90Shipyards 88Machine tools 66Injection moulding 20Tooling 19Gas turbines 16Titanium 5
Q-Series®: Global industrials 26 September 2013 8
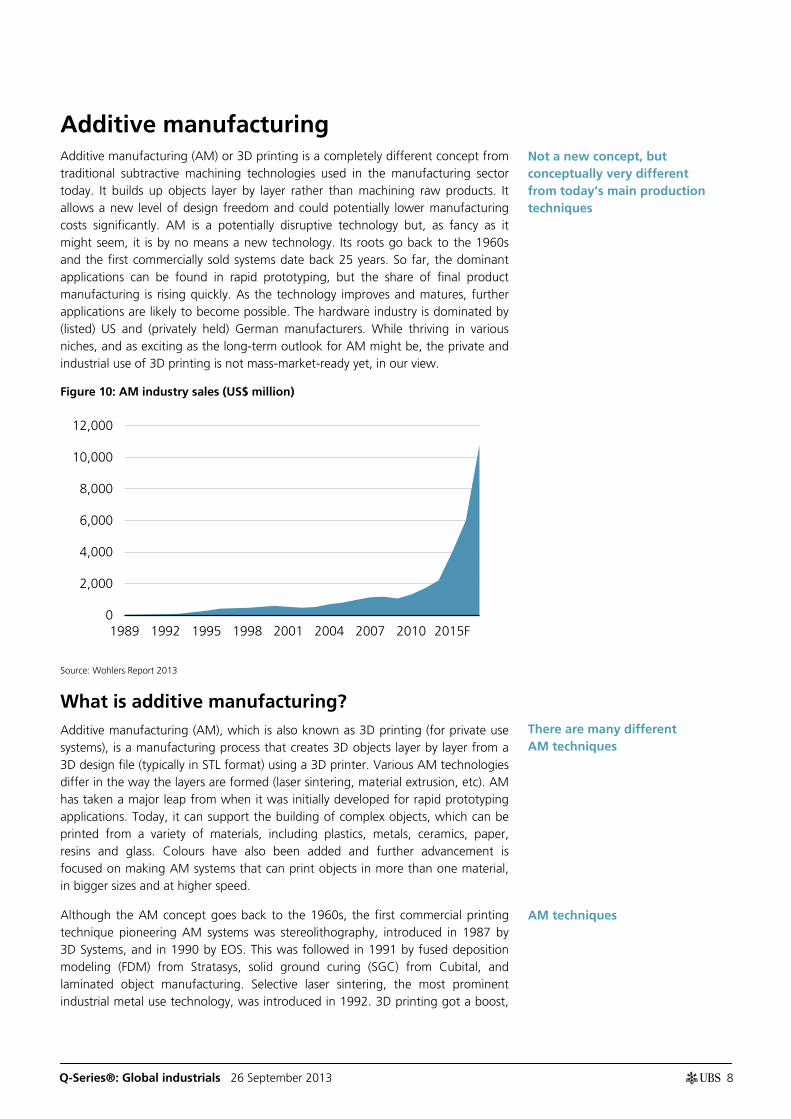
Additive manufacturing Additive manufacturing (AM) or 3D printing is a completely different concept from traditional subtractive machining technologies used in the manufacturing sector today. It builds up objects layer by layer rather than machining raw products. It allows a new level of design freedom and could potentially lower manufacturing costs significantly. AM is a potentially disruptive technology but, as fancy as it might seem, it is by no means a new technology. Its roots go back to the 1960s and the first commercially sold systems date back 25 years. So far, the dominant applications can be found in rapid prototyping, but the share of final product manufacturing is rising quickly. As the technology improves and matures, further applications are likely to become possible. The hardware industry is dominated by (listed) US and (privately held) German manufacturers. While thriving in various niches, and as exciting as the long-term outlook for AM might be, the private and industrial use of 3D printing is not mass-market-ready yet, in our view.
Figure 10: AM industry sales (US$ million)
Source: Wohlers Report 2013
What is additive manufacturing? Additive manufacturing (AM), which is also known as 3D printing (for private use systems), is a manufacturing process that creates 3D objects layer by layer from a 3D design file (typically in STL format) using a 3D printer. Various AM technologies differ in the way the layers are formed (laser sintering, material extrusion, etc). AM has taken a major leap from when it was initially developed for rapid prototyping applications. Today, it can support the building of complex objects, which can be printed from a variety of materials, including plastics, metals, ceramics, paper, resins and glass. Colours have also been added and further advancement is focused on making AM systems that can print objects in more than one material, in bigger sizes and at higher speed.
Although the AM concept goes back to the 1960s, the first commercial printing technique pioneering AM systems was stereolithography, introduced in 1987 by 3D Systems, and in 1990 by EOS. This was followed in 1991 by fused deposition modeling (FDM) from Stratasys, solid ground curing (SGC) from Cubital, and laminated object manufacturing. Selective laser sintering, the most prominent industrial metal use technology, was introduced in 1992. 3D printing got a boost,
0
2,000
4,000
6,000
8,000
10,000
12,000
1989 1992 1995 1998 2001 2004 2007 2010 2015F
Not a new concept, but conceptually very different from today’s main production techniques
There are many different AM techniques
AM techniques
Q-Series®: Global industrials 26 September 2013 9
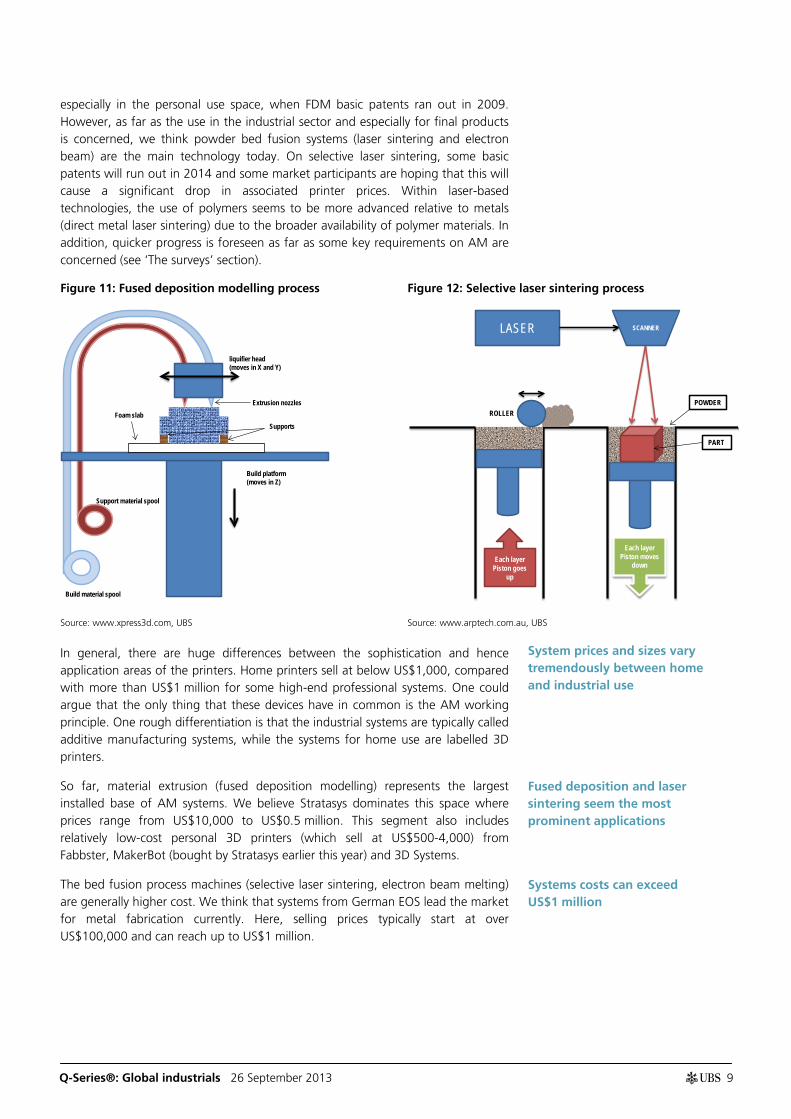
especially in the personal use space, when FDM basic patents ran out in 2009. However, as far as the use in the industrial sector and especially for final products is concerned, we think powder bed fusion systems (laser sintering and electron beam) are the main technology today. On selective laser sintering, some basic patents will run out in 2014 and some market participants are hoping that this will cause a significant drop in associated printer prices. Within laser-based technologies, the use of polymers seems to be more advanced relative to metals (direct metal laser sintering) due to the broader availability of polymer materials. In addition, quicker progress is foreseen as far as some key requirements on AM are concerned (see ‘The surveys’ section).
Figure 11: Fused deposition modelling process Figure 12: Selective laser sintering process
Source: www.xpress3d.com, UBS Source: www.arptech.com.au, UBS
In general, there are huge differences between the sophistication and hence application areas of the printers. Home printers sell at below US$1,000, compared with more than US$1 million for some high-end professional systems. One could argue that the only thing that these devices have in common is the AM working principle. One rough differentiation is that the industrial systems are typically called additive manufacturing systems, while the systems for home use are labelled 3D printers.
So far, material extrusion (fused deposition modelling) represents the largest installed base of AM systems. We believe Stratasys dominates this space where prices range from US$10,000 to US$0.5 million. This segment also includes relatively low-cost personal 3D printers (which sell at US$500-4,000) from Fabbster, MakerBot (bought by Stratasys earlier this year) and 3D Systems.
The bed fusion process machines (selective laser sintering, electron beam melting) are generally higher cost. We think that systems from German EOS lead the market for metal fabrication currently. Here, selling prices typically start at over US$100,000 and can reach up to US$1 million.
Build material spool
Support material spool
Build platform(moves in Z)
Foam slabSupports
Extrusion nozzles
liquifier head(moves in X and Y)
LASER SCANNER
ROLLERPOWDER
PART
Each layer Piston goes
up
Each layer Piston moves
down
System prices and sizes vary tremendously between home and industrial use
Fused deposition and laser sintering seem the most prominent applications
Systems costs can exceed US$1 million
Q-Series®: Global industrials 26 September 2013 10
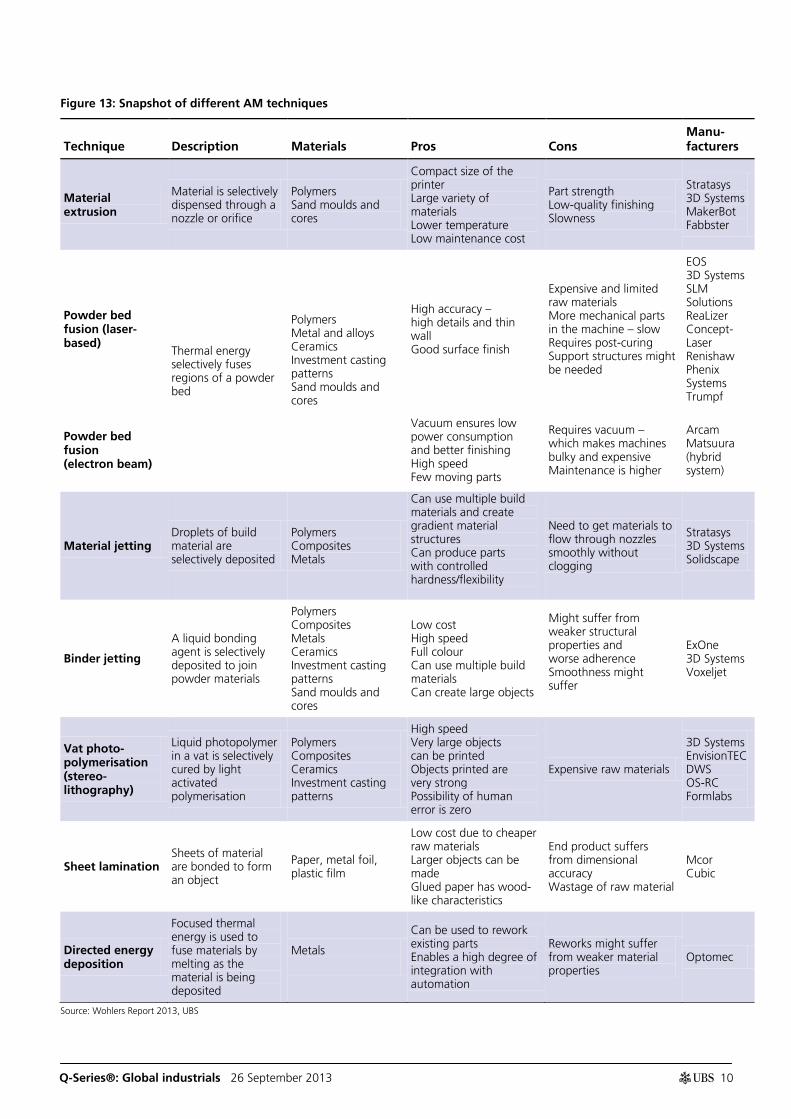
Figure 13: Snapshot of different AM techniques
Technique Description Materials Pros Cons Manu-facturers
Material extrusion
Material is selectively dispensed through a nozzle or orifice
Polymers Sand moulds and cores
Compact size of the printer Large variety of materials Lower temperature Low maintenance cost
Part strength Low-quality finishing Slowness
Stratasys 3D Systems MakerBot Fabbster
Powder bed fusion (laser-based)
Thermal energy selectively fuses regions of a powder bed
Polymers Metal and alloys Ceramics Investment casting patterns Sand moulds and cores
High accuracy – high details and thin wall Good surface finish
Expensive and limited raw materials More mechanical parts in the machine – slow Requires post-curing Support structures might be needed
EOS 3D Systems SLM Solutions ReaLizer Concept-Laser Renishaw Phenix Systems Trumpf
Powder bed fusion (electron beam)
Vacuum ensures low power consumption and better finishing High speed Few moving parts
Requires vacuum – which makes machines bulky and expensive Maintenance is higher
Arcam Matsuura (hybrid system)
Material jetting Droplets of build material are selectively deposited
Polymers Composites Metals
Can use multiple build materials and create gradient material structures Can produce parts with controlled hardness/flexibility
Need to get materials to flow through nozzles smoothly without clogging
Stratasys 3D Systems Solidscape
Binder jetting
A liquid bonding agent is selectively deposited to join powder materials
Polymers Composites Metals Ceramics Investment casting patterns Sand moulds and cores
Low cost High speed Full colour Can use multiple build materials Can create large objects
Might suffer from weaker structural properties and worse adherence Smoothness might suffer
ExOne 3D Systems Voxeljet
Vat photo-polymerisation (stereo-lithography)
Liquid photopolymer in a vat is selectively cured by light activated polymerisation
Polymers Composites Ceramics Investment casting patterns
High speed Very large objects can be printed Objects printed are very strong Possibility of human error is zero
Expensive raw materials
3D Systems EnvisionTEC DWS OS-RC Formlabs
Sheet lamination Sheets of material are bonded to form an object
Paper, metal foil, plastic film
Low cost due to cheaper raw materials Larger objects can be made Glued paper has wood-like characteristics
End product suffers from dimensional accuracy Wastage of raw material
Mcor Cubic
Directed energy deposition
Focused thermal energy is used to fuse materials by melting as the material is being deposited
Metals
Can be used to rework existing parts Enables a high degree of integration with automation
Reworks might suffer from weaker material properties
Optomec
Source: Wohlers Report 2013, UBS

Q-Series®: Global industrials 26 September 2013 11
Additive versus subtractive In traditional manufacturing, the production is a subtractive process, ie, material is removed and scrapped to form the final output, whereas in additive manufacturing the raw materials are fused or bonded together to form the final output. The material removal process includes boiling, drilling and milling. An iron frame cast out of an iron sheet is one example of subtractive techniques. Due to its characteristics, AM is typically seen as being advantageous for highly complex, low-batch product runs with expensive raw materials.
Additive manufacturing enables custom-designed parts to be ‘printed’ in 3D, by building them layer by layer. This method has a major design advantage as it allows manufacturers to make very complex objects from a range of materials without the need for new tools, and with very little waste. The design-to-manufacture limits known from traditional machining processes are mostly no bottleneck in 3D printing, which offers a high degree of geometric freedom. In traditional product making, several items are often joined to form one functioning product, which renders the manufacturing process complex, and causes waste and inventory in addition to the design limitations. With AM, a product is printed in one process.
Figure 14: Additive versus subtractive manufacturing – an overview
Additive Subtractive
Process Built up Reduced
Tools 3D printer Machining tools
Product size Limited to the size of the printer Small to large
Economies of scale None (except for packing efficiencies) Yes
Major usage Rapid prototyping, low-batch production runs Mass production
Raw materials So far limited and expensive; lack of multiple material printing
Very large range of (multi) raw materials
Speed So far still relatively slow Quick once the tooling process is done
Performance High-performance single piece Conjoined parts
Weight Single piece, lower weight Higher weight
Source: UBS
Pros and cons of AM Below we evaluate some of the pros and cons of additive manufacturing. The stand-out advantages of AM are its potential for mass customisation, no design limitation by machining constraints (form follows function), lower manufacturing costs (materials and machining), less waste material and reduced logistics costs. Its current main shortfalls are the low speed, limited materials, high printer costs, and the product finishing. The relative lack of traditional economies of scale is a drawback versus traditional manufacturing, but AM’s overall economical score will be determined by future printer and hence batch sizes, and further packing efficiencies in addition to the fall in printer and material prices. The packing efficiencies derive from the fact that AM systems can print out various product shapes in one production batch and hence optimise the space usage of the batch. The product finishing will have to improve further as this is a costly process.
Engineers will have to think very differently when making the switch to AM
Comparison of additive and subtractive manufacturing
The opportunities are currently still outweighed by the disadvantages

Q-Series®: Global industrials 26 September 2013 12
Figure 15: AM advantages and disadvantages
Advantages Comment
Mass customisation No re-tooling required to make different products;
Lower wastage Additive manufacturing uses less raw material than the subtractive method, which wastes up to 95%
Design freedom Hardly any limitations in the design process and hence no need for design for production
Time to market No need for complex tooling to produce prototypes, more design freedom and flexibility
Part consolidation No need for complex joining and soldering of individual products
Tooling reduction Reduction or potential elimination of tooling
Inventory and logistics Just-in-time production and less product complexity reduce inventory keeping and complex logistics
Packing efficiencies Different products can be printed in same batch
Weight savings AM allows for different geometries
Disadvantages
Economies of scale The cost of printing the first article remains more or less similar to the printing of the n-th item
Raw material Individual raw materials still limited and expensive; lack of combinability of different raw materials with different melting points
Equipment High equipment prices, limited size of 3D products (up to 30cm edge length), printing equipment production capacity and service
Speed Ultra-thin layers (0.001” to 0.010”) and up to 1,000 layers needed for a single inch; a single inch might take up to 3 hours to print
IP and warranty issues Plagiarism potentially easier, with files sent around for printing; product warranty issues severed by interim design changes
Availability of 3D software Lack of software to translate developer ideas into 3D printer parameters; easier-to-use software and web-based software needed
Product finishing The product finishing of a 3D printed product is often not ready to market and needs to be fine-tuned using other techniques
Design rules and certification process
Common industry standards are still scarce and processes need to be certified
Process reliability and integration
Today’s CNC machines tend to be fully integrated into production processes while AM is still mostly stand-alone machines
Source: Wohlers Report 2013, GE, UBS
Industrial uses of AM That AM is mainly used in the manufacturing sectors does not surprise, given its roots in rapid prototyping and its strength in low-batch but highly sophisticated product making. The auto sector was one of the first to embrace AM for rapid prototyping and is still one of the most prominent users today. However, it is unlikely to embrace it anytime soon for final part production due to AM’s low score on economies of scale and the auto sector’s large-batch production. Nevertheless, similar to the development in jet engines and gas turbines, AM might play a more prominent role in engine technology at some point. AM is also heavily used for prototyping in sporting goods and the electronics sector, where product lifecycles are becoming ever shorter and therefore the time to market and reflection of the latest consumer preferences are key. While AM might not seem a
The auto and consumer sectors dominate prototyping…
Q-Series®: Global industrials 26 September 2013 13
suitable technology for mass production of goods like sports shoes, the mould production for sports shoes is costly, given that every size needs a different mould. Nike has started to use AM for customised shoes (NIKEiD).
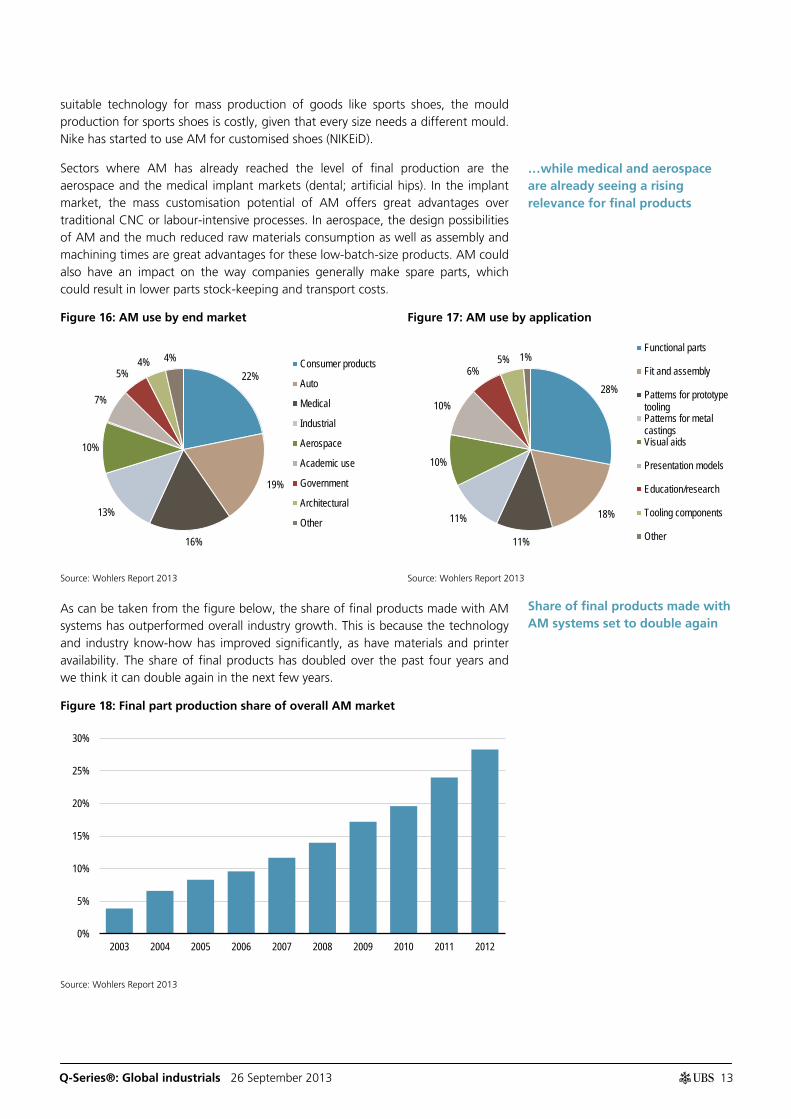
Sectors where AM has already reached the level of final production are the aerospace and the medical implant markets (dental; artificial hips). In the implant market, the mass customisation potential of AM offers great advantages over traditional CNC or labour-intensive processes. In aerospace, the design possibilities of AM and the much reduced raw materials consumption as well as assembly and machining times are great advantages for these low-batch-size products. AM could also have an impact on the way companies generally make spare parts, which could result in lower parts stock-keeping and transport costs.
Figure 16: AM use by end market Figure 17: AM use by application
Source: Wohlers Report 2013 Source: Wohlers Report 2013
As can be taken from the figure below, the share of final products made with AM systems has outperformed overall industry growth. This is because the technology and industry know-how has improved significantly, as have materials and printer availability. The share of final products has doubled over the past four years and we think it can double again in the next few years.
Figure 18: Final part production share of overall AM market
Source: Wohlers Report 2013
22%
19%
16%
13%
10%
7%
5% 4% 4% Consumer products
Auto
Medical
Industrial
Aerospace
Academic use
Government
Architectural
Other
28%
18%
11%
11%
10%
10%
6% 5% 1%
Functional parts
Fit and assembly
Patterns for prototypetoolingPatterns for metalcastingsVisual aids
Presentation models
Education/research
Tooling components
Other
0%
5%
10%
15%
20%
25%
30%
2003 2004 2005 2006 2007 2008 2009 2010 2011 2012
…while medical and aerospace are already seeing a rising relevance for final products
Share of final products made with AM systems set to double again
Q-Series®: Global industrials 26 September 2013 14
AM system makers
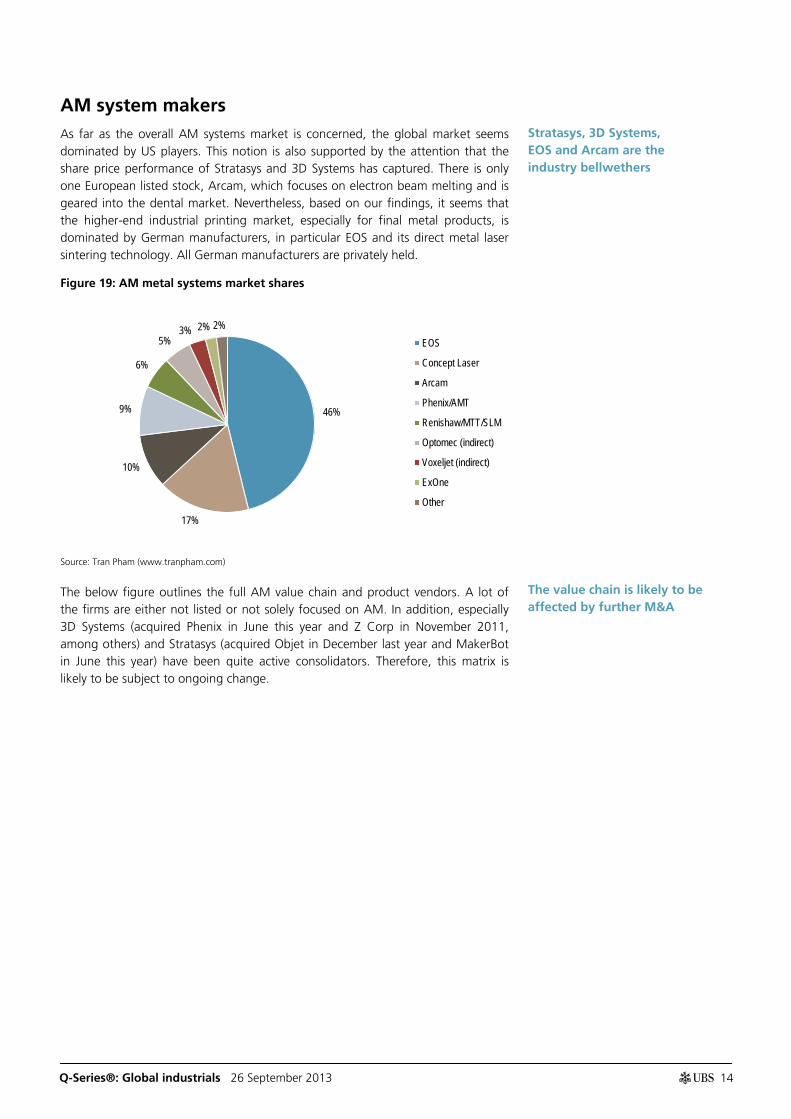
As far as the overall AM systems market is concerned, the global market seems dominated by US players. This notion is also supported by the attention that the share price performance of Stratasys and 3D Systems has captured. There is only one European listed stock, Arcam, which focuses on electron beam melting and is geared into the dental market. Nevertheless, based on our findings, it seems that the higher-end industrial printing market, especially for final metal products, is dominated by German manufacturers, in particular EOS and its direct metal laser sintering technology. All German manufacturers are privately held.
Figure 19: AM metal systems market shares
Source: Tran Pham (www.tranpham.com)
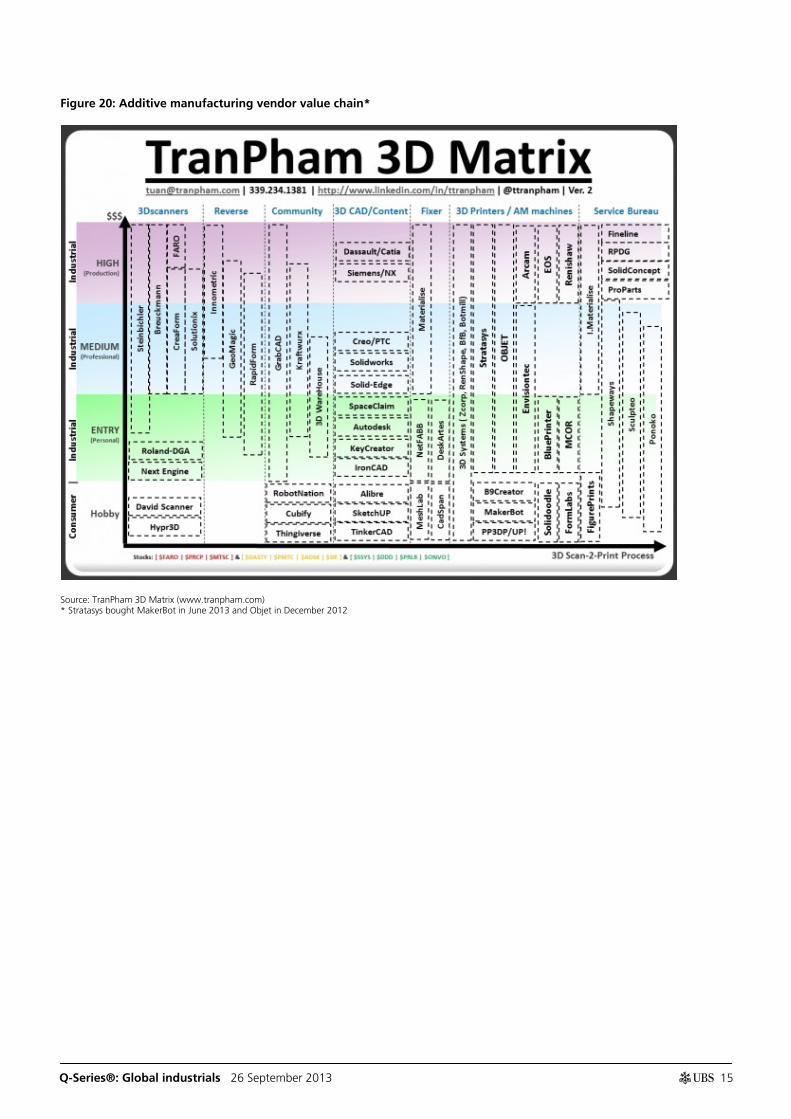
The below figure outlines the full AM value chain and product vendors. A lot of the firms are either not listed or not solely focused on AM. In addition, especially 3D Systems (acquired Phenix in June this year and Z Corp in November 2011, among others) and Stratasys (acquired Objet in December last year and MakerBot in June this year) have been quite active consolidators. Therefore, this matrix is likely to be subject to ongoing change.
46%
17%
10%
9%
6%
5% 3% 2% 2%
EOS
Concept Laser
Arcam
Phenix/AMT
Renishaw/MTT/SLM
Optomec (indirect)
Voxeljet (indirect)
ExOne
Other
Stratasys, 3D Systems, EOS and Arcam are the industry bellwethers
The value chain is likely to be affected by further M&A
Q-Series®: Global industrials 26 September 2013 15
Figure 20: Additive manufacturing vendor value chain*
Source: TranPham 3D Matrix (www.tranpham.com) * Stratasys bought MakerBot in June 2013 and Objet in December 2012

Q-Series®: Global industrials 26 September 2013 16
The potential impact on cost of production While it is clear to us that AM is too expensive today to become much more than a production process for high-end niche components, we still believe it is useful and interesting to see how AM compares with the traditional process of metal machining today. The charts below show a typical cost breakdown for a traditionally manufactured and an AM-made product. Although not fully comparable (eg, due to different overhead costs), it is striking how dominant the machine cost portion for AM is, while the make-ready time should be much less. However, product finishing still captures a relevant portion of the AM product costs.
Figure 21: Manufacturing cost breakdown (traditional) Figure 22: Manufacturing cost breakdown (AM)
Source: Sandvik Source: Direct Manufacturing Research Center (DMRC)
Analyzing Product Lifecycle Costs for a Better Understanding of Cost Drivers in Additive Manufacturing, 2012
The advent of AM could have a meaningful impact on most of the traditional costs. First of all, AM requires no cutting tools or holders as the production is additive not subtractive. Second, AM has the scope to significantly reduce the material costs as material waste is reduced significantly, given that the subtractive method wastes up to 95% of raw materials. Finally, in traditional metal machining processes, only one-third of the production time is actually spent on machining. The rest of the time goes to re-tooling, measurement, service, change of work piece and similar work. In AM, there is no re-tooling at all. The amount of time spent on re-tooling varies depending on, eg, the type of material machined. The re-tooling process can amount to 10-30% of the production time.
Tools 4% Workpiece
material 15%
Machinery & equipment 29% Operators
30%
Overhead 22%
Costs for preparation 4%
Building process (fix) 3% Oven
1% Materials cost 11%
Post processing 7%
Machine costs 74%
Comparing the cost breakdown between traditional and additive manufacturing
AM does not require the typical traditional work-steps
Q-Series®: Global industrials 26 September 2013 17
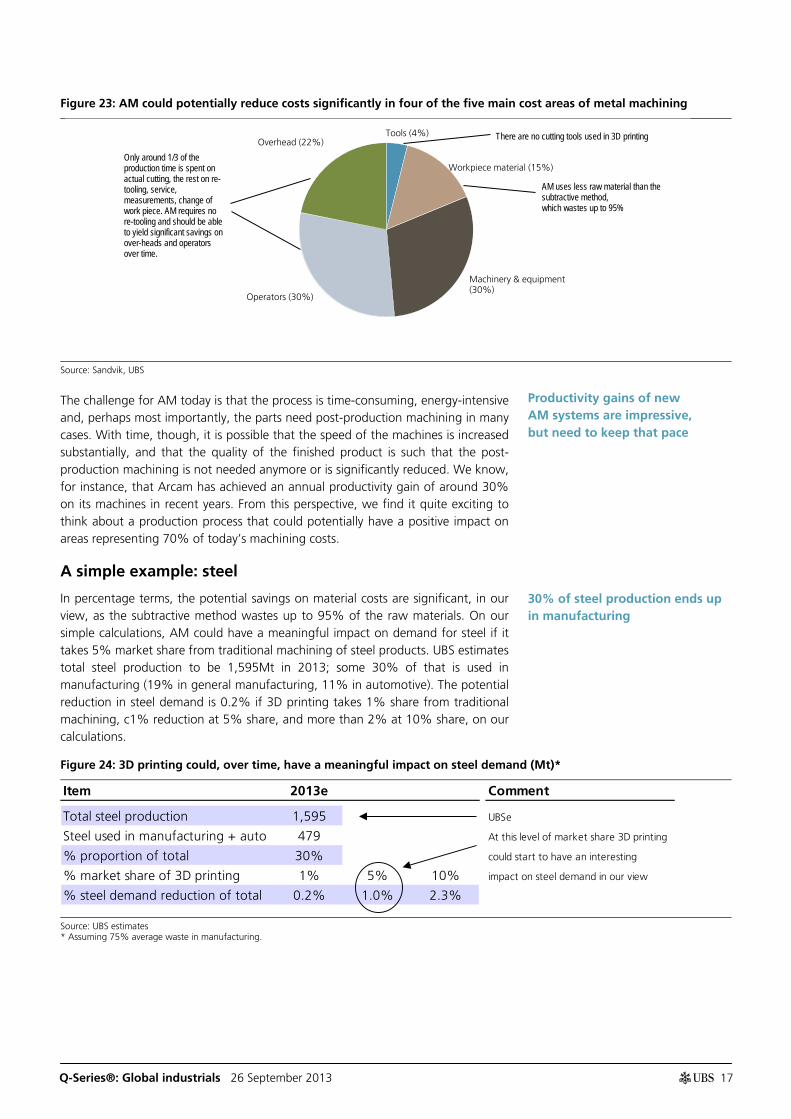
Figure 23: AM could potentially reduce costs significantly in four of the five main cost areas of metal machining
Source: Sandvik, UBS
The challenge for AM today is that the process is time-consuming, energy-intensive and, perhaps most importantly, the parts need post-production machining in many cases. With time, though, it is possible that the speed of the machines is increased substantially, and that the quality of the finished product is such that the post-production machining is not needed anymore or is significantly reduced. We know, for instance, that Arcam has achieved an annual productivity gain of around 30% on its machines in recent years. From this perspective, we find it quite exciting to think about a production process that could potentially have a positive impact on areas representing 70% of today’s machining costs.
A simple example: steel
In percentage terms, the potential savings on material costs are significant, in our view, as the subtractive method wastes up to 95% of the raw materials. On our simple calculations, AM could have a meaningful impact on demand for steel if it takes 5% market share from traditional machining of steel products. UBS estimates total steel production to be 1,595Mt in 2013; some 30% of that is used in manufacturing (19% in general manufacturing, 11% in automotive). The potential reduction in steel demand is 0.2% if 3D printing takes 1% share from traditional machining, c1% reduction at 5% share, and more than 2% at 10% share, on our calculations.
Figure 24: 3D printing could, over time, have a meaningful impact on steel demand (Mt)*
Source: UBS estimates * Assuming 75% average waste in manufacturing.
Tools (4%)
Workpiece material (15%)
Machinery & equipment (30%)
Operators (30%)
Overhead (22%)
AM uses less raw material than the subtractive method, which wastes up to 95%
Only around 1/3 of the production time is spent on actual cutting, the rest on re-tooling, service, measurements, change of work piece. AM requires no re-tooling and should be able to yield significant savings on over-heads and operators over time.
There are no cutting tools used in 3D printing
Item 2013e Comment
Total steel production 1,595 UBSe
Steel used in manufacturing + auto 479 At this level of market share 3D printing
% proportion of total 30% could start to have an interesting
% market share of 3D printing 1% 5% 10% impact on steel demand in our view
% steel demand reduction of total 0.2% 1.0% 2.3%
Productivity gains of new AM systems are impressive, but need to keep that pace
30% of steel production ends up in manufacturing

Q-Series®: Global industrials 26 September 2013 18
According to our European steel analyst, Carsten Riek, a 1% reduction in steel demand is equal to 5-6 state-of-the-art standard steel plants (blast furnace operations), or the steel production of France. He estimates that a 1% reduction in trend demand would push down steel prices in the range of US$5-7/t, around 1% of the average global HRC price of US$640/t. The impact on steel prices would be comparatively small, as the global steel industry is already operating below 80% utilisation rates and margins are still depressed. We even see a 1% AM penetration of global manufacturing as being rather unrealistic in the next few years, and even more so for a 5% penetration due to the technological challenges of AM. Therefore, AM is not a worry for global steel demand today and tomorrow, but our example is rather to show what could happen one day. Of course, were AM to make the necessary technological leaps to approach a much higher share of manufacturing, the impact on steel demand and prices could be more dramatic. As we argue later in this note, the impact from AM could be greater and come sooner for less commonly used materials – with a greater proportion used in manufacturing than steel – such as titanium.
A 1% steel demand reduction would equal 5-6 steel plants, but we see that as a long-term threat only

Q-Series®: Global industrials 26 September 2013 19
AM’s requirements and timing We have outlined the numerous challenges of AM, such as production speed and material availability, earlier in this report. One of the key questions to us is, however, what the main issues are and when these can be realistically expected to be overcome. Based on the findings of a recent unique industry survey, we conclude that some general requirements, such as design rules and AM material property databases, could – for the most relevant AM techniques – be overcome relatively quickly in the next couple of years. However, when it comes to production-related issues, such as a larger build chamber size, quicker build-up rates and higher process stability, a major improvement is only expected by 2020 for laser sintering of plastics, and by 2025 for laser sintering of metals. Therefore, we consider a material impact on the users and losers of AM unlikely in the next few years.
The surveys We have formed an opinion about the key AM requirements to be addressed, and by when this could be achieved, by looking at two surveys, which one of our interview contacts conducted recently. The Direct Manufacturing Research Center (DMRC) of the University of Paderborn is one of the world’s leading AM researchers. It co-operates in its research with leading AM users, such as Boeing, Siemens and Lego, leading system makers, such as EOS, SLM Solutions and Stratasys, leading materials makers, such as Evonik, and service companies. Hence, we would find it difficult to come up with more sophisticated results if we were to conduct our own survey.
Figure 25: AM survey participant split (%)* Figure 26: AM survey participant split (%)*
Source: DMRC, Heinz Nixdorf Institute Thinking ahead the Future of Additive Manufacturing – Innovation Roadmapping of Required Advancements, 2013 * Multiple choices were possible.
Source: DMRC, Heinz Nixdorf Institute Thinking ahead the Future of Additive Manufacturing – Innovation Roadmapping of Required Advancements, 2013 * Multiple choices were possible.
Between October and December 2011, the DMRC and the Heinz Nixdorf Institute conducted a survey among the AM industry about the future requirements on technological advancements, such as larger build chamber volumes, quicker build-up rates, and certification. The survey was sent to 325 experts and 56 contacts responded. While AM scores relatively well on current requirements, these are expected to rise significantly in the next few years, and hence a lot of work needs to be done to achieve these.
05
101520253035404550
Machinemakers
Materialssuppliers
User University Consulting Other
Survey 1 Survey 2
01020304050607080
R&D
Mana
geme
nt
Proto
typing
Prod
uctio
n
Sales
Quali
ty as
sura
nce
Maint
enan
ce
Purch
ase
Marke
ting
Survey 1 Survey 2
Some AM requirements might be sorted in the short term, some others only in the longer term
Work done by leading AM researchers gives some sense of the most important AM requirements and timing
To us the surveys appear quite representative
Q-Series®: Global industrials 26 September 2013 20
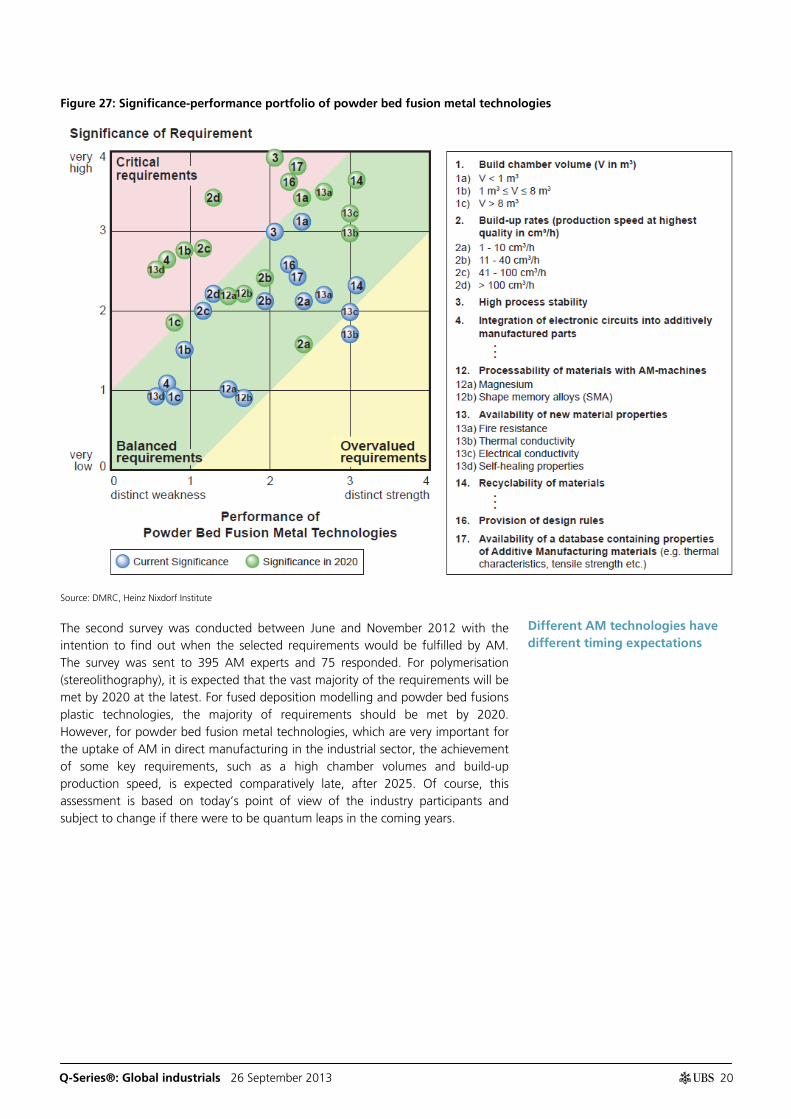
Figure 27: Significance-performance portfolio of powder bed fusion metal technologies
Source: DMRC, Heinz Nixdorf Institute
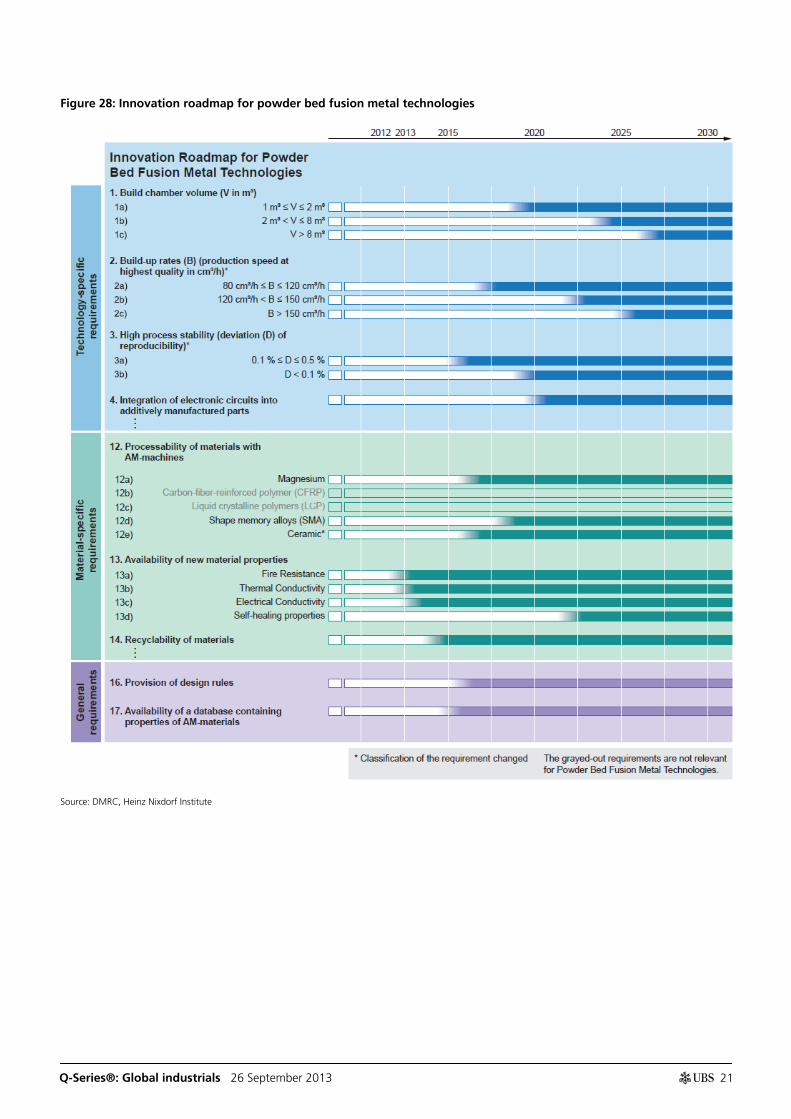
The second survey was conducted between June and November 2012 with the intention to find out when the selected requirements would be fulfilled by AM. The survey was sent to 395 AM experts and 75 responded. For polymerisation (stereolithography), it is expected that the vast majority of the requirements will be met by 2020 at the latest. For fused deposition modelling and powder bed fusions plastic technologies, the majority of requirements should be met by 2020. However, for powder bed fusion metal technologies, which are very important for the uptake of AM in direct manufacturing in the industrial sector, the achievement of some key requirements, such as a high chamber volumes and build-up production speed, is expected comparatively late, after 2025. Of course, this assessment is based on today’s point of view of the industry participants and subject to change if there were to be quantum leaps in the coming years.
Different AM technologies have different timing expectations
Q-Series®: Global industrials 26 September 2013 21
Figure 28: Innovation roadmap for powder bed fusion metal technologies
Source: DMRC, Heinz Nixdorf Institute

Q-Series®: Global industrials 26 September 2013 22
IP and warranty Some general concerns regarding 3D printing becoming a mass personal fabrication phenomenon are IP (intellectual property) and warranty issues. On the one hand, the 3D maker community seems concerned about a new wave of IP protection initiated by the IP holders while, on the other hand, the IP holders could feel uncertain as to whether 3D printing will totally change the rules of the game. The copying of products could be eased by file sharing and 3D scanning. Michael Weinberg from Public Knowledge has written a great summary (It Will Be Awesome If They Don’t Screw It Up) on what the complexity of IP issues means for the further progress of 3D printing, but we think it is mainly applicable to the B-to-C space.
We are more interested in B-to-B. Of course, the same IP rules and concerns hold true here. However, we think it is clearly on a higher-end level as far as the complexity of the IP and the products are concerned. We think that file sharing and the design availability of, eg, a jet engine are much more complex than the ‘simplicity’ of making a toaster or a spare part for a vacuum cleaner. It is simply another level of user knowledge and experience, capital investment and criminal energy that is needed to copy a jet engine or specific parts. In the world of general manufacturing of new original equipment, we would worry more about the new design opportunities that 3D printing offers, which could allow completely new manufacturers of better products to emerge.
But what about the after-market? One might argue that IP protection is less good in this segment, as it is typically permissible to reproduce unpatented parts of a patented product. Customers could scan a component and have it reproduced at a 3D printing company or on their own printer, potentially at a much lower cost than sourced from the OEM. Setting up an independent spare parts maker might be easier than in today’s subtractive manufacturing world. It will therefore be key for the OEMs to use the advantage of 3D printing right from the beginning. They could have dedicated 3D printers close to their customers and save on large logistics centres. If these cost savings were passed on to the customers, the price differential between an OEM spare part and a third-party spare part might actually not rise compared with today. In addition, customer loyalty would need to be fostered in the early days of 3D to create the perception that the particular OEM is the most sophisticated maker of reliable spare parts. However, the need to control the service network and to forge multi-year service agreements with customers would likely rise in a 3D world.
Warranty
Product warranty could be seen as another stumbling block in a world where the commercial or consumer customer prints out a product or spare part rather than the OEM. Further difficulties arise with mass customisation and interim design changes. There will have to be some standardisation of printing technology, processes and raw materials to achieve a minimum of product warranty rights, but some issues may have to be sorted in courtrooms. We think this will be very product-specific and a general statement as to whether this is going to work or not is simply not possible at this point. However, warranty concerns might help the OEMs to keep ownership of the manufacturing process, and thus be beneficial for industrial companies.
IP and warranty issues still to be sorted
Drawing general conclusions is complex
The after-market might be the first area to worry about
Who is to blame if a product does not work or if it breaks?
Q-Series®: Global industrials 26 September 2013 23
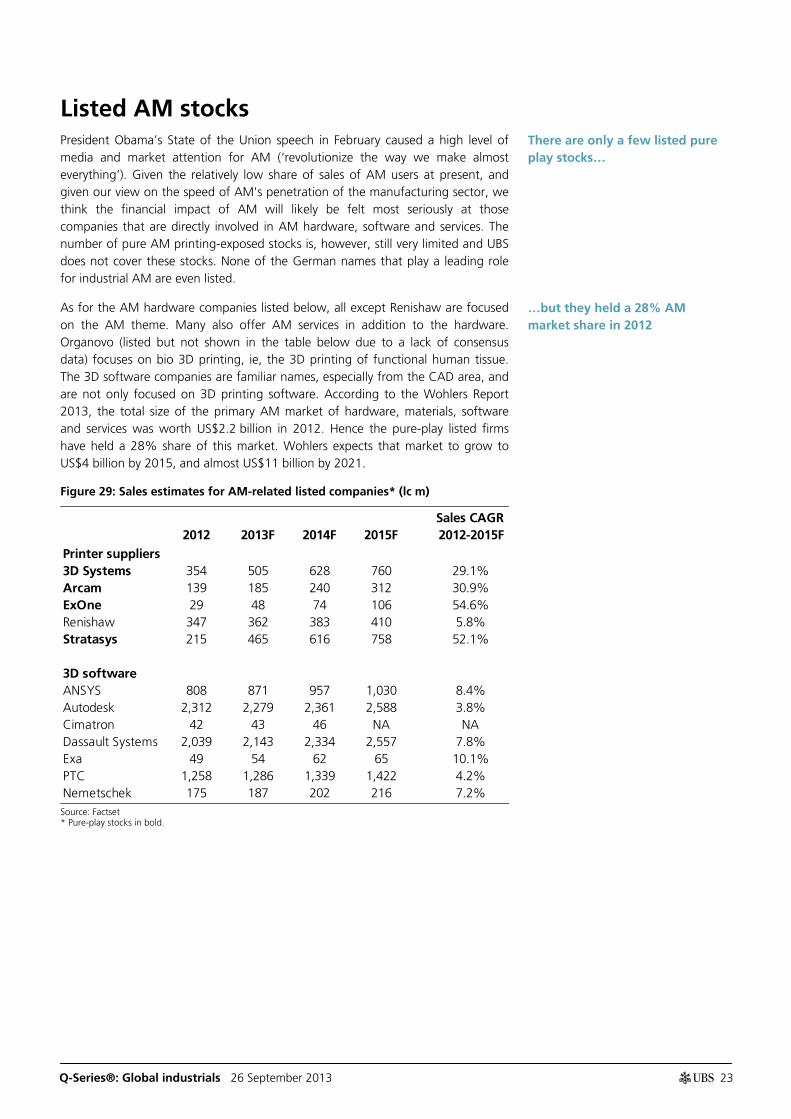
Listed AM stocks President Obama’s State of the Union speech in February caused a high level of media and market attention for AM (‘revolutionize the way we make almost everything’). Given the relatively low share of sales of AM users at present, and given our view on the speed of AM's penetration of the manufacturing sector, we think the financial impact of AM will likely be felt most seriously at those companies that are directly involved in AM hardware, software and services. The number of pure AM printing-exposed stocks is, however, still very limited and UBS does not cover these stocks. None of the German names that play a leading role for industrial AM are even listed.
As for the AM hardware companies listed below, all except Renishaw are focused on the AM theme. Many also offer AM services in addition to the hardware. Organovo (listed but not shown in the table below due to a lack of consensus data) focuses on bio 3D printing, ie, the 3D printing of functional human tissue. The 3D software companies are familiar names, especially from the CAD area, and are not only focused on 3D printing software. According to the Wohlers Report 2013, the total size of the primary AM market of hardware, materials, software and services was worth US$2.2 billion in 2012. Hence the pure-play listed firms have held a 28% share of this market. Wohlers expects that market to grow to US$4 billion by 2015, and almost US$11 billion by 2021.
Figure 29: Sales estimates for AM-related listed companies* (lc m)
Source: Factset * Pure-play stocks in bold.
2012 2013F 2014F 2015FSales CAGR 2012-2015F
Printer suppliers3D Systems 354 505 628 760 29.1%Arcam 139 185 240 312 30.9%ExOne 29 48 74 106 54.6%Renishaw 347 362 383 410 5.8%Stratasys 215 465 616 758 52.1%
3D softwareANSYS 808 871 957 1,030 8.4%Autodesk 2,312 2,279 2,361 2,588 3.8%Cimatron 42 43 46 NA NADassault Systems 2,039 2,143 2,334 2,557 7.8%Exa 49 54 62 65 10.1%PTC 1,258 1,286 1,339 1,422 4.2%Nemetschek 175 187 202 216 7.2%
There are only a few listed pure play stocks…
…but they held a 28% AM market share in 2012
Q-Series®: Global industrials 26 September 2013 24
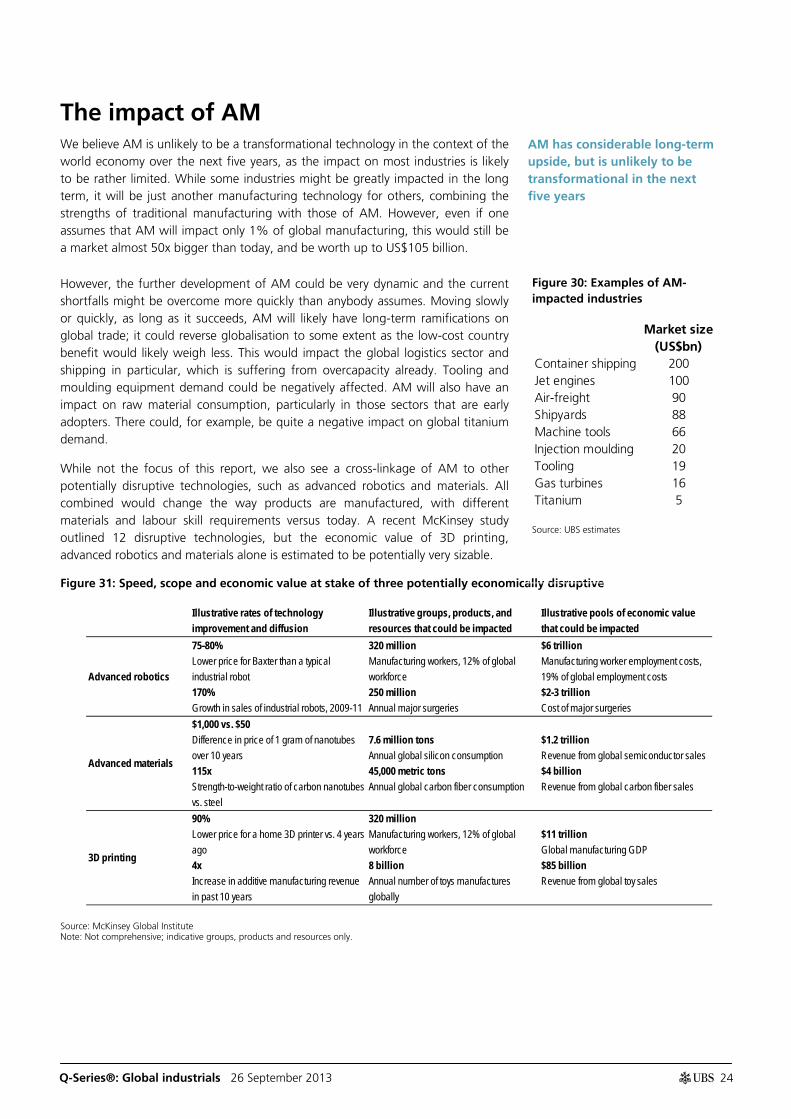
The impact of AM We believe AM is unlikely to be a transformational technology in the context of the world economy over the next five years, as the impact on most industries is likely to be rather limited. While some industries might be greatly impacted in the long term, it will be just another manufacturing technology for others, combining the strengths of traditional manufacturing with those of AM. However, even if one assumes that AM will impact only 1% of global manufacturing, this would still be a market almost 50x bigger than today, and be worth up to US$105 billion.
However, the further development of AM could be very dynamic and the current shortfalls might be overcome more quickly than anybody assumes. Moving slowly or quickly, as long as it succeeds, AM will likely have long-term ramifications on global trade; it could reverse globalisation to some extent as the low-cost country benefit would likely weigh less. This would impact the global logistics sector and shipping in particular, which is suffering from overcapacity already. Tooling and moulding equipment demand could be negatively affected. AM will also have an impact on raw material consumption, particularly in those sectors that are early adopters. There could, for example, be quite a negative impact on global titanium demand.
While not the focus of this report, we also see a cross-linkage of AM to other potentially disruptive technologies, such as advanced robotics and materials. All combined would change the way products are manufactured, with different materials and labour skill requirements versus today. A recent McKinsey study outlined 12 disruptive technologies, but the economic value of 3D printing, advanced robotics and materials alone is estimated to be potentially very sizable.
Figure 31: Speed, scope and economic value at stake of three potentially economically disruptive
Source: McKinsey Global Institute Note: Not comprehensive; indicative groups, products and resources only.
Illustrative rates of technology improvement and diffusion
Illustrative groups, products, and resources that could be impacted
Illustrative pools of economic value that could be impacted
Advanced robotics
75-80%Lower price for Baxter than a typical industrial robot170%Growth in sales of industrial robots, 2009-11
320 millionManufacturing workers, 12% of global workforce250 millionAnnual major surgeries
$6 trillionManufacturing worker employment costs, 19% of global employment costs$2-3 trillionCost of major surgeries
Advanced materials
$1,000 vs. $50Difference in price of 1 gram of nanotubes over 10 years115x Strength-to-weight ratio of carbon nanotubes vs. steel
7.6 million tonsAnnual global silicon consumption45,000 metric tonsAnnual global carbon fiber consumption
$1.2 trillionRevenue from global semiconductor sales$4 billionRevenue from global carbon fiber sales
3D printing
90%Lower price for a home 3D printer vs. 4 years ago4xIncrease in additive manufacturing revenue in past 10 years
320 millionManufacturing workers, 12% of global workforce8 billionAnnual number of toys manufactures globally
$11 trillionGlobal manufacturing GDP$85 billionRevenue from global toy sales
AM has considerable long-term upside, but is unlikely to be transformational in the next five years
Figure 30: Examples of AM-impacted industries
Source: UBS estimates
Market size(US$bn)
Container shipping 200Jet engines 100Air-freight 90Shipyards 88Machine tools 66Injection moulding 20Tooling 19Gas turbines 16Titanium 5

Q-Series®: Global industrials 26 September 2013 25
Our scenarios
Gardner has recently updated its Hype Cycle, and thinks that we could be at the peak of inflated expectations as far as consumer 3D printing is concerned. Given the recent media coverage of the theme, such a positioning on the chart seems plausible. This is especially because 3D printing for consumer use still seems quite immature to us, and major obstacles – in terms of ease of use, price, material availability, safe handling, IP, warranty and awareness – need to be solved for mass-market adoption. However, it is also noteworthy to see where Gardner has put 3D printing for enterprise use, which seems much more advanced.
Three scenarios on the further evolution of AM are thinkable, in our view. In a downside case, AM would remain limited to a niche, and in an upside case, AM would take off broadly both in industrial and private use. However, based on our research, we think that a less extreme scenario is likely, where AM could play a major role in some segments, and a more hybrid and rather add-on role in others.
A potential base case, from today’s perspective, would be a scenario in which AM expands into further applications as printer prices come down, higher usage of AM lowers the price of the materials, AM techniques improve, and all that drives higher public awareness, which in itself stimulates demand. The share of rapid prototyping would fall and the share of final AM would rise. Certain categories of consumer products would be available for convenient, cheap and high-quality printing. AM would capture a relatively high share of manufacturing in those industries that seem predestined, driven by the advantages of AM (weight reduction, raw material savings, new design possibilities), and would suffer less from the disadvantages (economies of scale, availability of materials). We think AM would enter other segments too, potentially by combining the strengths of AM with those of subtractive machining (hybrid printing).
In a downside case, the sceptics of AM would prevail. Due to the current various disadvantages of AM, it would remain dominated by prototyping, and lift off for final products in niche areas within the aircraft or medical industries only. In this case, we would see the overall industrial sector as the greatest beneficiary because it would enjoy the benefits of AM, but hardly feel the disadvantages. Time to market would further improve and some products could be made more efficiently. However, personal fabrication would not take place beyond some DIY nerds and inventors. Therefore, industrial companies, ie, big factories and global logistics chains, would be able to largely conduct business the way they do it today.
Optimists could argue that some of the important shortfalls of AM, such as the pricing of printers and materials as well as speed, will be overcome. Patent expiry within selective laser sintering in June 2014 is mentioned as potentially having a similar impact as the expiry of fused deposition modelling patents in 2009. Studies from leading research institutions, such as German Fraunhofer Institute for Laser Technology, suggest that printing speeds for metal objects could increase fourfold. In addition, while AM materials are 50-100 times more expensive than the materials used for injection moulding, the price deflation could accelerate. If all these developments go seamlessly and quickly, and other shortfalls of AM are overcome too, a PC analogy would not be such a far cry.
Gardner's Hype Cycle
We favour a hybrid scenario for AM
Our base case
The downside case
The upside case

Q-Series®: Global industrials 26 September 2013 26
Economic impact
Macro impact
We think the impact of AM on the world economy and various subsectors could be quite large. McKinsey forecasts an annual direct economic impact from 3D printing of US$230-550 billion by 2025. Some US$100-300 would come from consumer use of 3D printers. As for industrial use, McKinsey assumes US$100-200 billion from direct product manufacturing, and US$30-50 billion from tool and mould manufacturing. It sees the market for complex, low-volume, highly customisable parts (eg, medical implants, engine components) at US$770 billion annually by 2025, and believes such products could cost 40-55% less through a reduction of tooling costs and waste materials as well as handling costs. McKinsey thinks that 30-50% of tools and moulds could be produced via 3D printing, saving 30% of the costs.
Figure 32: Direct economic impact of 3D printing
Source: McKinsey Global Institute Note: This analysis focuses on the use of 3D printing to directly manufacture low-volume, high-value parts in the medical and transport manufacturing industries. Other potentially impactful applications might include manufacturing of low-volume, high-value replacement parts for other industries. Estimates of the potential economic impact are for some applications only and are not comprehensive estimates of the total potential impact. Estimates include consumer surplus and cannot be related to potential company revenue, market size, or GDP impact. Possible surplus shifts among companies and industries, or between companies and consumers, are not sized. These estimates are not risk- or probability-adjusted. Numbers may not sum due to rounding.
We think the McKinsey estimates square up with Terry Wohlers. Terry Wohlers said the market opportunity is US$105 billion if AM grows to capture just 1% of global manufacturing, assuming that the world economy is worth US$70 trillion and the manufacturing segment US$10.5 trillion. McKinsey sees current global manufacturing costs of US$6 trillion annually.
Impact on world trade
Longer term, AM could have the power to influence world trade. In a bull case, this would likely be transformational as the share of personal fabrication would be very high. Many products would be made at the point of consumption and long logistical value chains would be redundant. Globalisation could be reversed to some extent. Global trade amounts to cUS$18 trillion versus global GDP at
Sized application
Potential economic impact of sized application in 2025 ($billion, annually)
Estimated scope in 2025Estimated potential reach in 2025
Potential productivity or value gains in 2025
Consumer use of 3D printing
100-300$4 trillion in sales of consumer products that might be printed
5-10% of relevant products (e.g., toys) could be 3D printable, assuming easy consumer access
60-80% value increase per 3D-printed product - 35-60% cost savings to consumers - 10% added value from customization
Direct product manufacturing
100-200
$300 billion spending on complex, low-volume items such as implants and tools
$470 billion spending on complex, low-volume parts in transportation
30-50% of products in relevant categories replaceable with 3D printing
40-55% cost saving to buyers of 3D printing products
Tools and mould manufacturing
30-50$360 billion global market for injection-moulded plastics
30-50% of injection moulded plastics produced with 3D-printed moulds
30% production cost reduction using superior 3D-printed moulds
Sum of sized potential economic impacts
230-550
McKinsey’s 2025 timeframe coincides with the expected achievement of some key AM requirements as seen in the DMRC survey
If AM reaches 1% penetration of global manufacturing, it would be worth US$105 billion
The AM bull case would have far-reaching consequences for world trade
Q-Series®: Global industrials 26 September 2013 27
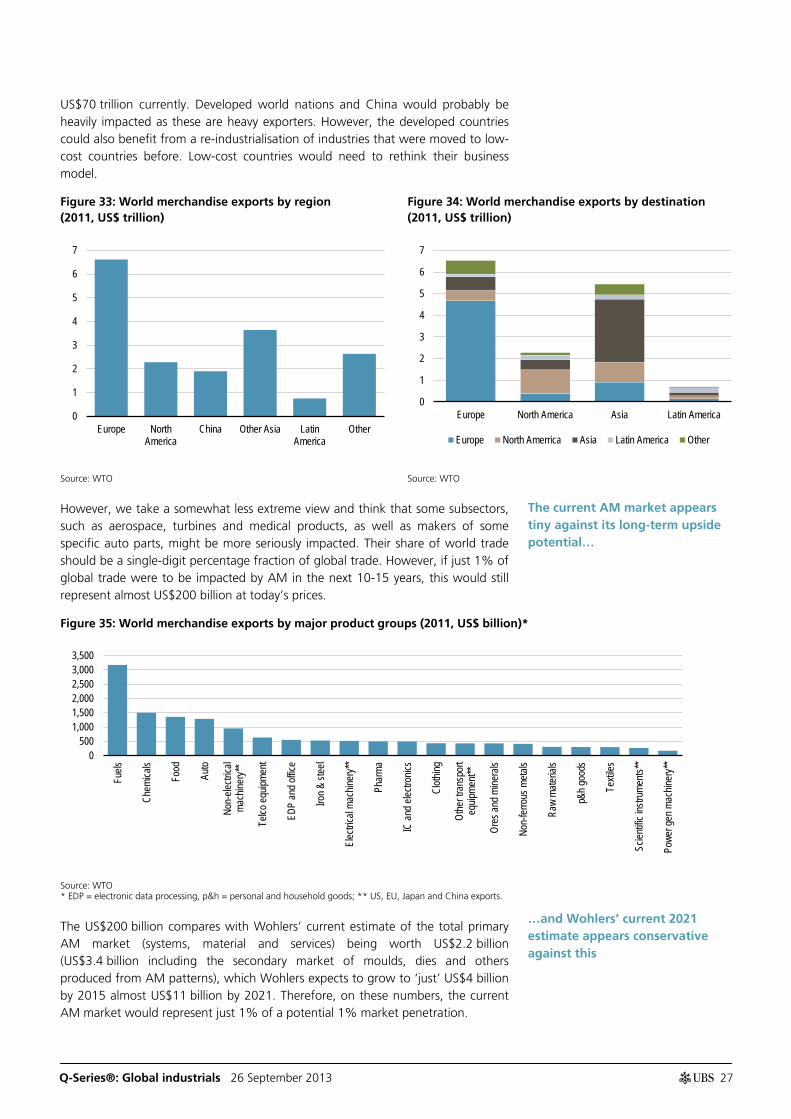
US$70 trillion currently. Developed world nations and China would probably be heavily impacted as these are heavy exporters. However, the developed countries could also benefit from a re-industrialisation of industries that were moved to low-cost countries before. Low-cost countries would need to rethink their business model.
Figure 33: World merchandise exports by region (2011, US$ trillion)
Figure 34: World merchandise exports by destination (2011, US$ trillion)
Source: WTO Source: WTO
However, we take a somewhat less extreme view and think that some subsectors, such as aerospace, turbines and medical products, as well as makers of some specific auto parts, might be more seriously impacted. Their share of world trade should be a single-digit percentage fraction of global trade. However, if just 1% of global trade were to be impacted by AM in the next 10-15 years, this would still represent almost US$200 billion at today’s prices.
Figure 35: World merchandise exports by major product groups (2011, US$ billion)*
Source: WTO * EDP = electronic data processing, p&h = personal and household goods; ** US, EU, Japan and China exports.
The US$200 billion compares with Wohlers’ current estimate of the total primary AM market (systems, material and services) being worth US$2.2 billion (US$3.4 billion including the secondary market of moulds, dies and others produced from AM patterns), which Wohlers expects to grow to ‘just’ US$4 billion by 2015 almost US$11 billion by 2021. Therefore, on these numbers, the current AM market would represent just 1% of a potential 1% market penetration.
0
1
2
3
4
5
6
7
Europe NorthAmerica
China Other Asia LatinAmerica
Other
0
1
2
3
4
5
6
7
Europe North America Asia Latin America
Europe North Amerrica Asia Latin America Other
0500
1,0001,5002,0002,5003,0003,500
Fuels
Chem
icals
Food
Auto
Non-
electr
ical
mach
inery*
*
Telco
equip
ment
EDP
and o
ffice
Iron &
stee
l
Elec
trical
mach
inery*
*
Phar
ma
IC an
d elec
tronic
s
Cloth
ing
Othe
r tra
nspo
rteq
uipme
nt**
Ores
and m
inera
ls
Non-
ferro
us m
etals
Raw
mater
ials
p&h g
oods
Texti
les
Scien
tific i
nstru
ments
**
Powe
r gen
mac
hiner
y**
The current AM market appears tiny against its long-term upside potential…
…and Wohlers’ current 2021 estimate appears conservative against this

Q-Series®: Global industrials 26 September 2013 28
Figure 36: European industrial production weights Figure 37: AM market (US$ million)*
Source: Eurostat Source: Wohlers Report 2013 * Primary 3D printing market only.
Industry impact examples
Aerospace
The aerospace industry is one of the key end markets where AM is seen as potentially having a major impact. So far, AM products cover only 0.03% of the global aerospace and defence market. However, as a user of very expensive raw materials, relatively low production batches, and applying highly sophisticated technology as well as manufacturing, it ticks the right boxes of the AM advantages. Statements like ‘One day we will print an engine’ from GE have made headlines even if the company added that it will only be in four decades from now. In addition, GE’s head of manufacturing and materials technology unit stated that up to 50% of its energy turbine and aircraft engine parts might potentially be 3D-printed in 10 years. However, GE Aviation’s CEO has cooled this excitement when he recently stated at the Paris Air Show that GE will only go after the most complicated parts in finished machining, but not the structural castings or investment casting. He went on to say: ‘For us, it’s going to be meaningful in terms of cost and in terms of capability of the engines, but for the industry, it’s going to be a blip’.
According to GE, the additive parts installed on the new LEAP engines could not be made with conventional manufacturing methods (fuel injectors and leading edges for fan blades). The 3D-printed fuel nozzle is 25% lighter and five times more durable than the current nozzle made from 18-25 different parts. In total, GE sees a production of a 100,000 3D-printed units for the LEAP engine by 2020. Boeing prints 300 distinct parts for 10 different military and commercial aircraft, and has printed 22,000 parts already. NASA recently tested an AM-made rocket engine injector. Made with traditional methods, this would have taken more than a year, but with AM, it could be produced in less than four months, with a 70% cost reduction.
Another example also shows that the potential savings from AM in aerospace could be quite high. According to the Wohlers Report 2013, the US Department of Energy and Oak Ridge National Laboratory have compared the life-cycle energy consumption associated with a titanium aerospace bracket produced by both conventional manufacturing and AM. AM reduces the buy-to-fly ratio and reduces the part weight significantly (the ratio of material weight procured versus the
Food 10%
Wood, pulp, paper and printing 5%
Chemicals (incl petrochems) 10%
Metals & mining 17%
Electronics 9%
Machinery 10%
Auto 10%
Power gen 12%
Other 17%
0
2,000
4,000
6,000
8,000
10,000
12,000
1989 1992 1995 1998 2001 2004 2007 2010 2015F
Common wisdom thinks the aerospace industry could be the most impacted end market
GE might make more than 100,000 AM parts by 2020 for the LEAP engine alone
AM could reduce buy-to-fly ratios and weight significantly
Q-Series®: Global industrials 26 September 2013 29
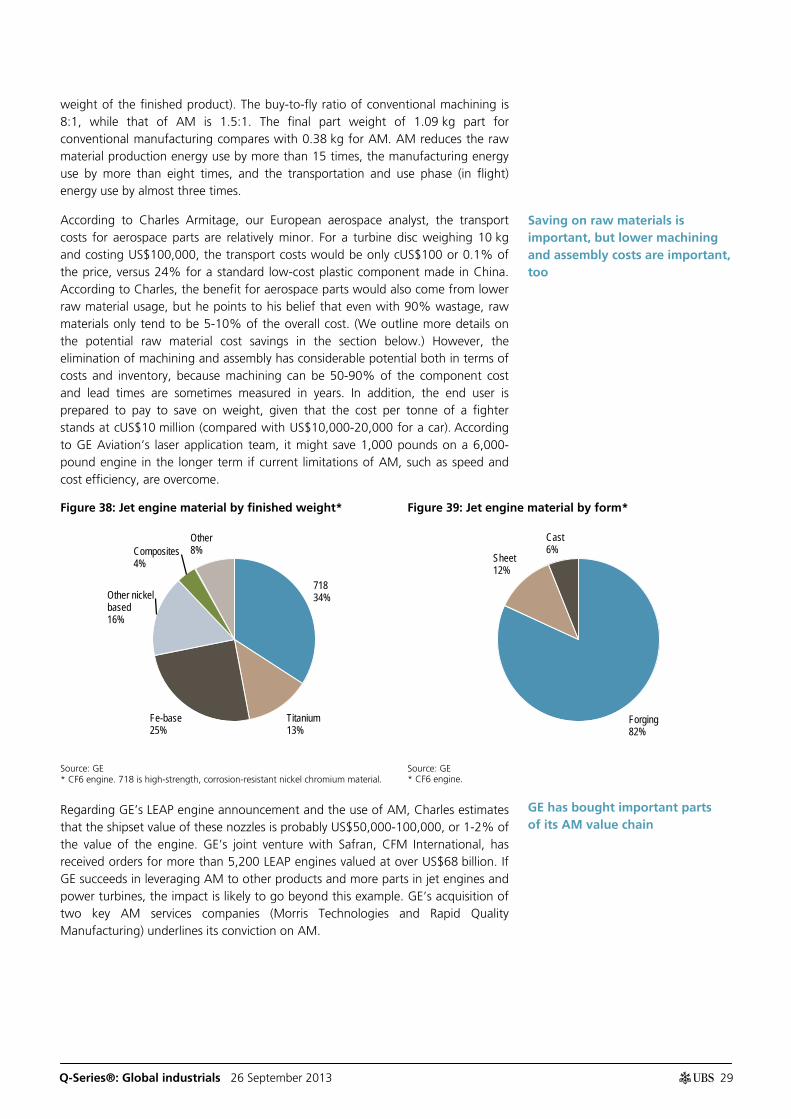
weight of the finished product). The buy-to-fly ratio of conventional machining is 8:1, while that of AM is 1.5:1. The final part weight of 1.09 kg part for conventional manufacturing compares with 0.38 kg for AM. AM reduces the raw material production energy use by more than 15 times, the manufacturing energy use by more than eight times, and the transportation and use phase (in flight) energy use by almost three times.
According to Charles Armitage, our European aerospace analyst, the transport costs for aerospace parts are relatively minor. For a turbine disc weighing 10 kg and costing US$100,000, the transport costs would be only cUS$100 or 0.1% of the price, versus 24% for a standard low-cost plastic component made in China. According to Charles, the benefit for aerospace parts would also come from lower raw material usage, but he points to his belief that even with 90% wastage, raw materials only tend to be 5-10% of the overall cost. (We outline more details on the potential raw material cost savings in the section below.) However, the elimination of machining and assembly has considerable potential both in terms of costs and inventory, because machining can be 50-90% of the component cost and lead times are sometimes measured in years. In addition, the end user is prepared to pay to save on weight, given that the cost per tonne of a fighter stands at cUS$10 million (compared with US$10,000-20,000 for a car). According to GE Aviation’s laser application team, it might save 1,000 pounds on a 6,000-pound engine in the longer term if current limitations of AM, such as speed and cost efficiency, are overcome.
Figure 38: Jet engine material by finished weight* Figure 39: Jet engine material by form*
Source: GE * CF6 engine. 718 is high-strength, corrosion-resistant nickel chromium material.
Source: GE * CF6 engine.
Regarding GE’s LEAP engine announcement and the use of AM, Charles estimates that the shipset value of these nozzles is probably US$50,000-100,000, or 1-2% of the value of the engine. GE’s joint venture with Safran, CFM International, has received orders for more than 5,200 LEAP engines valued at over US$68 billion. If GE succeeds in leveraging AM to other products and more parts in jet engines and power turbines, the impact is likely to go beyond this example. GE’s acquisition of two key AM services companies (Morris Technologies and Rapid Quality Manufacturing) underlines its conviction on AM.
718 34%
Titanium 13%
Fe-base 25%
Other nickel based 16%
Composites 4%
Other 8%
Forging 82%
Sheet 12%
Cast 6%
Saving on raw materials is important, but lower machining and assembly costs are important, too
GE has bought important parts of its AM value chain

Q-Series®: Global industrials 26 September 2013 30
Our GE analyst, Jason Feldman, thinks it would also (or even more so) make sense for GE to apply AM to gas turbines, given the smaller batches in the hundreds, versus thousands for jet engines. Of course, the question would remain whether GE would be able to keep this benefit, given that the market does not have a high number of players and everybody seems to do work on AM. Nevertheless, with the acquisition of Morris Technologies and Rapid Quality Manufacturing, GE has acquired a sizeable share of independent US industrial AM capacity for the aerospace sector, which could give it a bit of a short-to-medium-term edge, as the US’s AM capacity is seen as not being sufficient to even cater solely to GE’s demand for the LEAP engine.
Figure 40: Listed jet and gas engine suppliers
Source: Factset
Digression: New aerospace (and other) AM applications
The Direct Manufacturing Research Center (DMRC) of the University of Paderborn has conducted an analysis together with its research partners on what products in the aerospace, auto and electronic sectors could be potential new AM applications with a high-chances and low-risks profile. It looked at nine aerospace innovation fields (and eight in both the auto and the electronics industries). It concluded that there are two application areas in each of these end markets where AM would have a high-chances and low-risks profile.
In aerospace, it thinks that multifunctional and morphing structures are most promising. Multifunctional structures are functionally upgraded parts, eg, integrating acoustic and thermal insulation into parts or embedding entire sensor/actuator systems, including wiring, into a part. In morphing structures, a part is capable by itself of adapting its shape in response to the operational environment, without any actuators. An example would be morphing wings.
In autos, DMRC thinks the handling of fluids and optimised tooling look most promising. The handling of fluids involves parts, such as valves, pipes, restrictors and their geometric adaptation. An example would be the optimisation of air-conditioning units of cars by using sandwich walls to reduce the weight and decrease the heat exchange in areas where it is not needed. The functional integration of pumps and valves reduces the number of individual components and hence assembly time and space requirements. Optimised tooling refers to optimised cooling channels of the tools, which allows for conformal cooling, which is more efficient and reduces solidification and cycle times.
Finally, in electronics, DMRC sees functionally integrated parts and testing systems as the most promising areas. Functionally integrated parts embed circuits into various geometries and functionally integrate different electronic devices into a single part, based on the Moulded Interconnect Device technology (MID). This could help to achieve more efficient boxing, leading to better conductance and
Company Country Market cap (€bn)GE US 182.7Siemens Germany 76.0United Technologies US 74.2Rolls Royce UK 25.1Safran France 18.6Mitsubishi Heavy Industries Japan 14.7MTU Germany 3.6
Long-term savings could be quite powerful, but will they be passed on to customers?
Work done by DMRC gives an impression of some potential new AM applications
Multifunctional and morphing structures in aerospace
Fluid handling and tooling for autos
Functionally integrated parts and testing systems for electronics

Q-Series®: Global industrials 26 September 2013 31
less loss of energy as well as smaller products, which lowers packaging costs. The individualisation of the devices would not require any changes of the production process. AM-made testing systems could allow for tests of electronic control cabinets to be carried out in one step.
Raw materials sector
Raw materials play a great role in global trade and account for 3% of globally traded manufactures today. Depending on the success of AM, there could be a major impact on their consumption in the longer term. However, in trying to assess a more tangible and concrete potential financial impact, we focus on our scenario in which we would see the most significant impact on demand from the aerospace industry, which is a heavy consumer of titanium and nickel.
Figure 41: Global trade of manufactures (US$ billion) Figure 42: Raw material use by end market
Source: WTO Source: Brook Hunt
Titanium and nickel in the aerospace industry
The titanium sponge market is a small niche market in the context of the global metals market. According to the U.S. Geological Survey (USGS) in 2012, an estimated 72% of the titanium sponge metal produced in the US (8% of world capacity) was used in aerospace applications. The US sponge market value of US$388 million implies a global market of cUS$5 billion, and US$3.5 billion geared into aerospace as an end user. Given further processing of the titanium sponge to titanium alloys, the titanium cost at the point of the aerospace end customer should be much higher. The global nickel market should have a value of US$25 billion (1.66m tonnes of nickel production in 2011 times current nickel price). Some 66% of nickel ends up in stainless steel making and 24% in other alloys (including nickel super alloys for jet engines).
0
100
200
300
400
500
600
Iron & steel Ores and minerals Non-ferrousmetals
Raw materials 0%10%20%30%40%50%60%70%80%90%
100%
Nickel Copper Aluminium Zinc
Other
Railway
Marine
Aerospace
Transport (incl autos)
Construction
Other process eq
Chemical industry
Electronics
Consumer
The aerospace sector dominates global titanium demand
Size-wise and in the context of global raw material demand, the titanium market is just a niche market
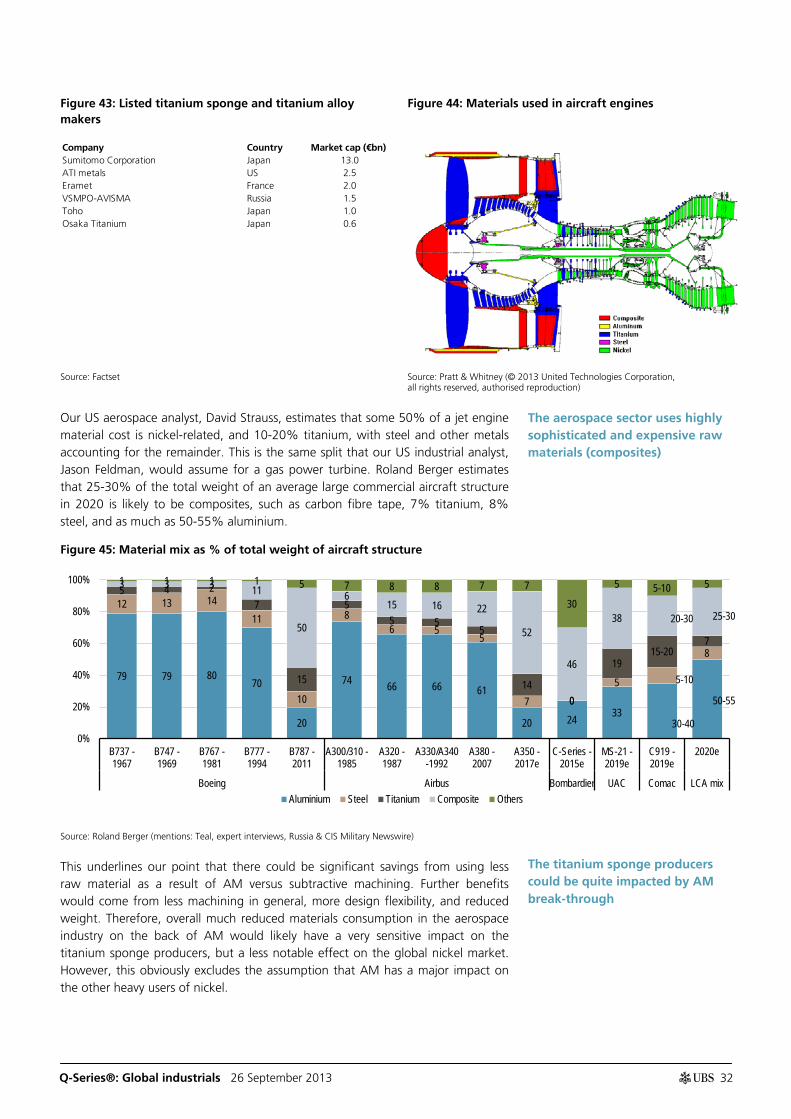
Q-Series®: Global industrials 26 September 2013 32
Figure 43: Listed titanium sponge and titanium alloy makers
Figure 44: Materials used in aircraft engines
Source: Factset Source: Pratt & Whitney (© 2013 United Technologies Corporation, all rights reserved, authorised reproduction)
Our US aerospace analyst, David Strauss, estimates that some 50% of a jet engine material cost is nickel-related, and 10-20% titanium, with steel and other metals accounting for the remainder. This is the same split that our US industrial analyst, Jason Feldman, would assume for a gas power turbine. Roland Berger estimates that 25-30% of the total weight of an average large commercial aircraft structure in 2020 is likely to be composites, such as carbon fibre tape, 7% titanium, 8% steel, and as much as 50-55% aluminium.
Figure 45: Material mix as % of total weight of aircraft structure
Source: Roland Berger (mentions: Teal, expert interviews, Russia & CIS Military Newswire)
This underlines our point that there could be significant savings from using less raw material as a result of AM versus subtractive machining. Further benefits would come from less machining in general, more design flexibility, and reduced weight. Therefore, overall much reduced materials consumption in the aerospace industry on the back of AM would likely have a very sensitive impact on the titanium sponge producers, but a less notable effect on the global nickel market. However, this obviously excludes the assumption that AM has a major impact on the other heavy users of nickel.
Company Country Market cap (€bn)Sumitomo Corporation Japan 13.0ATI metals US 2.5Eramet France 2.0VSMPO-AVISMA Russia 1.5Toho Japan 1.0Osaka Titanium Japan 0.6
79 79 8070
20
74 66 66 61
20 24 3330-40
50-55
12 13 1411
10
86 5
5
7 05 5-10
8
5 4 27
15
55 5
5
140
1915-20
7
3 3 3 11
50
615 16 22
52
46
38 20-30 25-30
1 1 1 1 5 7 8 8 7 730
5 5-10 5
0%
20%
40%
60%
80%
100%
B737 -1967
B747 -1969
B767 -1981
B777 -1994
B787 -2011
A300/310 -1985
A320 -1987
A330/A340-1992
A380 -2007
A350 -2017e
C-Series -2015e
MS-21 -2019e
C919 -2019e
2020e
Boeing Airbus Bombardier UAC Comac LCA mixAluminium Steel Titanium Composite Others
The aerospace sector uses highly sophisticated and expensive raw materials (composites)
The titanium sponge producers could be quite impacted by AM break-through
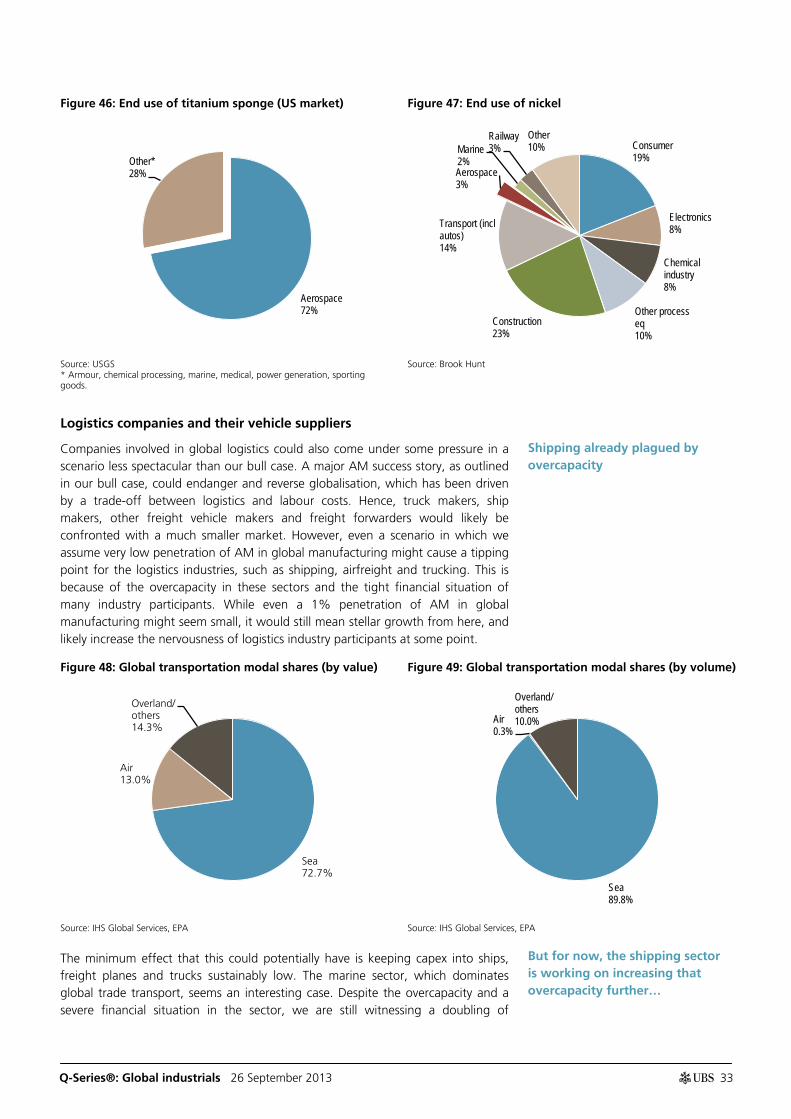
Q-Series®: Global industrials 26 September 2013 33
Figure 46: End use of titanium sponge (US market) Figure 47: End use of nickel
Source: USGS * Armour, chemical processing, marine, medical, power generation, sporting goods.
Source: Brook Hunt
Logistics companies and their vehicle suppliers
Companies involved in global logistics could also come under some pressure in a scenario less spectacular than our bull case. A major AM success story, as outlined in our bull case, could endanger and reverse globalisation, which has been driven by a trade-off between logistics and labour costs. Hence, truck makers, ship makers, other freight vehicle makers and freight forwarders would likely be confronted with a much smaller market. However, even a scenario in which we assume very low penetration of AM in global manufacturing might cause a tipping point for the logistics industries, such as shipping, airfreight and trucking. This is because of the overcapacity in these sectors and the tight financial situation of many industry participants. While even a 1% penetration of AM in global manufacturing might seem small, it would still mean stellar growth from here, and likely increase the nervousness of logistics industry participants at some point.
Figure 48: Global transportation modal shares (by value) Figure 49: Global transportation modal shares (by volume)
Source: IHS Global Services, EPA Source: IHS Global Services, EPA
The minimum effect that this could potentially have is keeping capex into ships, freight planes and trucks sustainably low. The marine sector, which dominates global trade transport, seems an interesting case. Despite the overcapacity and a severe financial situation in the sector, we are still witnessing a doubling of
Aerospace 72%
Other* 28%
Consumer 19%
Electronics 8%
Chemical industry 8%
Other process eq 10%
Construction 23%
Transport (incl autos) 14%
Aerospace 3%
Marine 2%
Railway 3%
Other 10%
Sea 72.7%
Air 13.0%
Overland/ others 14.3%
Sea 89.8%
Air 0.3%
Overland/ others 10.0%
Shipping already plagued by overcapacity
But for now, the shipping sector is working on increasing that overcapacity further…
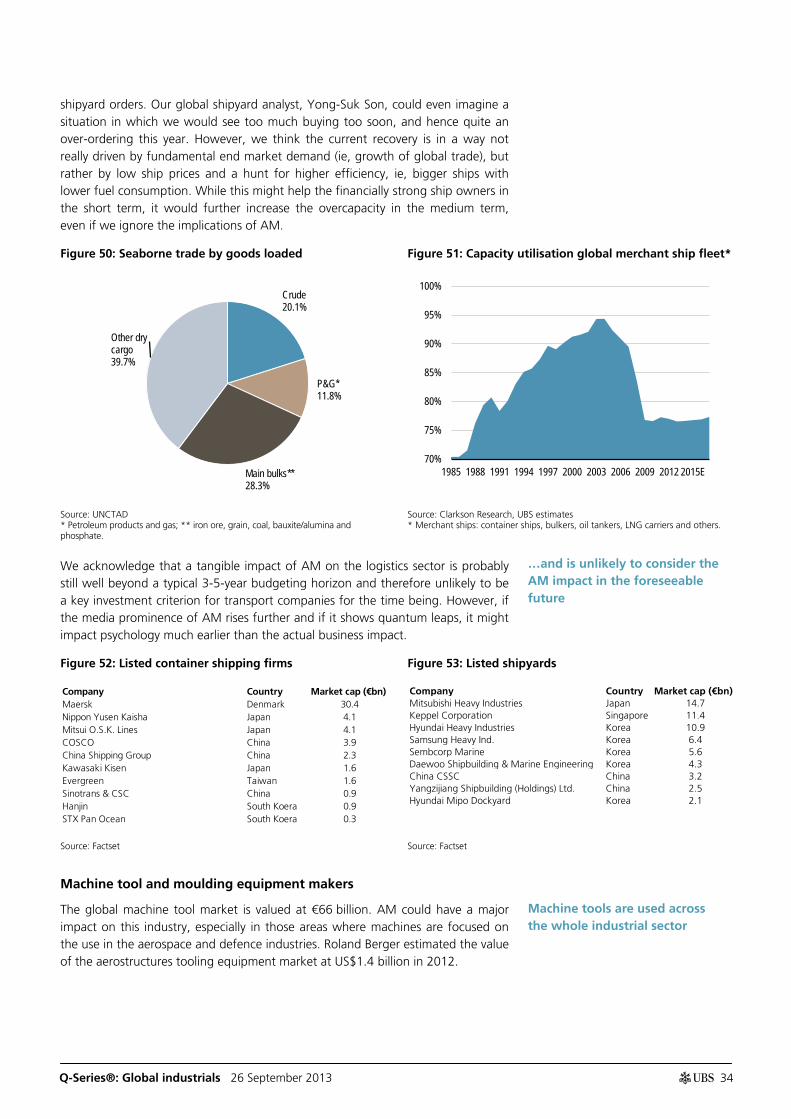
Q-Series®: Global industrials 26 September 2013 34
shipyard orders. Our global shipyard analyst, Yong-Suk Son, could even imagine a situation in which we would see too much buying too soon, and hence quite an over-ordering this year. However, we think the current recovery is in a way not really driven by fundamental end market demand (ie, growth of global trade), but rather by low ship prices and a hunt for higher efficiency, ie, bigger ships with lower fuel consumption. While this might help the financially strong ship owners in the short term, it would further increase the overcapacity in the medium term, even if we ignore the implications of AM.
Figure 50: Seaborne trade by goods loaded Figure 51: Capacity utilisation global merchant ship fleet*
Source: UNCTAD * Petroleum products and gas; ** iron ore, grain, coal, bauxite/alumina and phosphate.
Source: Clarkson Research, UBS estimates * Merchant ships: container ships, bulkers, oil tankers, LNG carriers and others.
We acknowledge that a tangible impact of AM on the logistics sector is probably still well beyond a typical 3-5-year budgeting horizon and therefore unlikely to be a key investment criterion for transport companies for the time being. However, if the media prominence of AM rises further and if it shows quantum leaps, it might impact psychology much earlier than the actual business impact.
Figure 52: Listed container shipping firms Figure 53: Listed shipyards
Source: Factset Source: Factset
Machine tool and moulding equipment makers
The global machine tool market is valued at €66 billion. AM could have a major impact on this industry, especially in those areas where machines are focused on the use in the aerospace and defence industries. Roland Berger estimated the value of the aerostructures tooling equipment market at US$1.4 billion in 2012.
Crude 20.1%
P&G* 11.8%
Main bulks** 28.3%
Other dry cargo 39.7%
70%
75%
80%
85%
90%
95%
100%
1985 1988 1991 1994 1997 2000 2003 2006 2009 2012 2015E
Company Country Market cap (€bn)Maersk Denmark 30.4Nippon Yusen Kaisha Japan 4.1Mitsui O.S.K. Lines Japan 4.1COSCO China 3.9China Shipping Group China 2.3Kawasaki Kisen Japan 1.6Evergreen Taiwan 1.6Sinotrans & CSC China 0.9Hanjin South Koera 0.9STX Pan Ocean South Koera 0.3
Company Country Market cap (€bn)Mitsubishi Heavy Industries Japan 14.7Keppel Corporation Singapore 11.4Hyundai Heavy Industries Korea 10.9Samsung Heavy Ind. Korea 6.4Sembcorp Marine Korea 5.6Daewoo Shipbuilding & Marine Engineering Korea 4.3China CSSC China 3.2Yangzijiang Shipbuilding (Holdings) Ltd. China 2.5Hyundai Mipo Dockyard Korea 2.1
…and is unlikely to consider the AM impact in the foreseeable future
Machine tools are used across the whole industrial sector
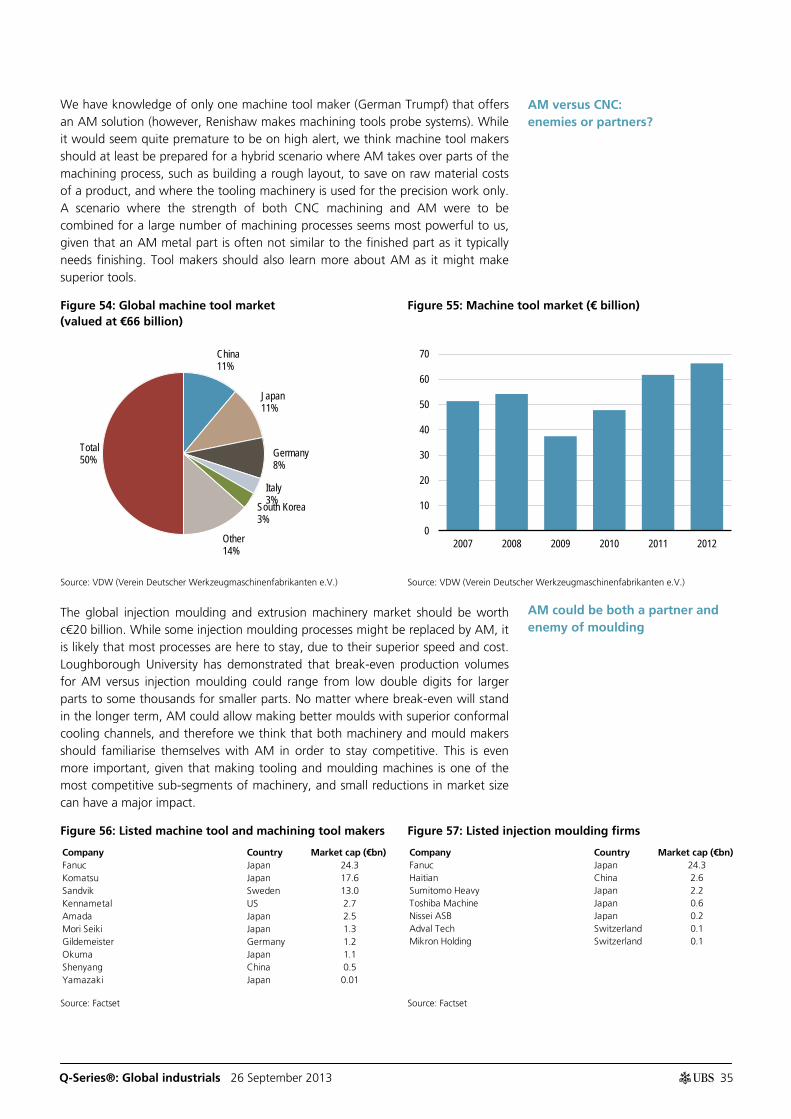
Q-Series®: Global industrials 26 September 2013 35
We have knowledge of only one machine tool maker (German Trumpf) that offers an AM solution (however, Renishaw makes machining tools probe systems). While it would seem quite premature to be on high alert, we think machine tool makers should at least be prepared for a hybrid scenario where AM takes over parts of the machining process, such as building a rough layout, to save on raw material costs of a product, and where the tooling machinery is used for the precision work only. A scenario where the strength of both CNC machining and AM were to be combined for a large number of machining processes seems most powerful to us, given that an AM metal part is often not similar to the finished part as it typically needs finishing. Tool makers should also learn more about AM as it might make superior tools.
Figure 54: Global machine tool market (valued at €66 billion)
Figure 55: Machine tool market (€ billion)
Source: VDW (Verein Deutscher Werkzeugmaschinenfabrikanten e.V.) Source: VDW (Verein Deutscher Werkzeugmaschinenfabrikanten e.V.)
The global injection moulding and extrusion machinery market should be worth c€20 billion. While some injection moulding processes might be replaced by AM, it is likely that most processes are here to stay, due to their superior speed and cost. Loughborough University has demonstrated that break-even production volumes for AM versus injection moulding could range from low double digits for larger parts to some thousands for smaller parts. No matter where break-even will stand in the longer term, AM could allow making better moulds with superior conformal cooling channels, and therefore we think that both machinery and mould makers should familiarise themselves with AM in order to stay competitive. This is even more important, given that making tooling and moulding machines is one of the most competitive sub-segments of machinery, and small reductions in market size can have a major impact.
Figure 56: Listed machine tool and machining tool makers Figure 57: Listed injection moulding firms
Source: Factset Source: Factset
China 11%
Japan 11%
Germany 8%
Italy 3% South Korea
3%
Other 14%
Total 50%
0
10
20
30
40
50
60
70
2007 2008 2009 2010 2011 2012
Company Country Market cap (€bn)Fanuc Japan 24.3Komatsu Japan 17.6Sandvik Sweden 13.0Kennametal US 2.7Amada Japan 2.5Mori Seiki Japan 1.3Gildemeister Germany 1.2Okuma Japan 1.1Shenyang China 0.5Yamazaki Japan 0.01
Company Country Market cap (€bn)Fanuc Japan 24.3Haitian China 2.6Sumitomo Heavy Japan 2.2Toshiba Machine Japan 0.6Nissei ASB Japan 0.2Adval Tech Switzerland 0.1Mikron Holding Switzerland 0.1
AM versus CNC: enemies or partners?
AM could be both a partner and enemy of moulding
Q-Series®: Global industrials 26 September 2013 36
Medical
Arcam, a leading AM systems maker in the orthopaedic space, reported that the unit cost of acetabular cups using its AM ranges from €45 to €107, depending on the size of the cup. This would represent a unit saving of c€23 over machined products. According to Terry Wohlers, it costs about US$5 to make a customised hearing aid shell (housing) locally, versus a finished product price of US$800 for a hearing aid product that is sold to an audiologist. Hence, there seems to be no point in making that part in a low-cost country. GE has been using AM to make parts of a medical device, the ultrasound probe. According to GE, AM could help cut the cost of manufacturing certain parts of the ultrasound probe by 30%.
Car industry
We think the most prominent use of AM in the short and medium term in the car industry will remain focused on prototyping, where the industry has been an early adopter. Ford uses AM to prototype automobile parts, such as cylinder heads, brake rotors and rear axles for test vehicles, according to Terry Wohlers. Ford is able to cut the production time for creating a casting for a prototype cylinder head used in its EcoBoost engines to three months, with time savings of 25-40%. In the longer run, however, especially if the scalability issues of AM can be overcome, AM could play a greater role in making more efficient engine parts, for example. Such mass-produced AM auto parts could aim for lower fuel consumption due to the new design opportunities offered by AM. Such enhanced parts would lead to even more efficient fuel burning, lower weight and fewer parts (similar to the GE fuel nozzle example).
Consumer goods
A recent Panasonic example underlines a scenario in which AM is a supporter of traditional manufacturing. Panasonic uses AM to make some of its moulds and expects a 30% cost reduction as it reduces manufacturing lead times as well as stock-keeping. AM could help to make more efficient cooling channels within the tools that are not possible with common techniques.
Statement of Risk
Additive manufacturing (AM) is not a new but still an emerging technology in the industrial sector. The technology has not matured yet and the further progress on various parameters, such as manufacturing speed, machine and material prices and availability, will likely influence the fortunes of AM decisively. Therefore, the impact of AM on the world economy and the various global industries is inherently difficult to predict. Our analysis should therefore be seen in the context of these uncertainty factors.
Application in hips, hearing aids and ultrasound
Short-term use in the car industry still dominated by prototyping, but lots of longer-term hopes
Moulding is heavily used in consumer goods

Q-Series®: Global industrials 26 September 2013 37
Required Disclosures
This report has been prepared by UBS Limited, an affiliate of UBS AG. UBS AG, its subsidiaries, branches and affiliates are referred to herein as UBS.
For information on the ways in which UBS manages conflicts and maintains independence of its research product; historical performance information; and certain additional disclosures concerning UBS research recommendations, please visit www.ubs.com/disclosures. The figures contained in performance charts refer to the past; past performance is not a reliable indicator of future results. Additional information will be made available upon request. UBS Securities Co. Limited is licensed to conduct securities investment consultancy businesses by the China Securities Regulatory Commission.
Analyst Certification: Each research analyst primarily responsible for the content of this research report, in whole or in part, certifies that with respect to each security or issuer that the analyst covered in this report: (1) all of the views expressed accurately reflect his or her personal views about those securities or issuers and were prepared in an independent manner, including with respect to UBS, and (2) no part of his or her compensation was, is, or will be, directly or indirectly, related to the specific recommendations or views expressed by that research analyst in the research report.
UBS Investment Research: Global Equity Rating Definitions
UBS 12-Month Rating
Definition Coverage1 IB Services2
Buy FSR is > 6% above the MRA. 45% 35% Neutral FSR is between -6% and 6% of the MRA. 44% 37% Sell FSR is > 6% below the MRA. 10% 22% UBS Short-Term Rating
Definition Coverage3 IB Services4
Buy Stock price expected to rise within three months from the time the rating was assigned because of a specific catalyst or event.
less than 1%
33%
Sell Stock price expected to fall within three months from the time the rating was assigned because of a specific catalyst or event.
less than 1% 20%
Source: UBS. Rating allocations are as of 30 June 2013. 1:Percentage of companies under coverage globally within the 12-month rating category. 2:Percentage of companies within the 12-month rating category for which investment banking (IB) services were provided within the past 12 months. 3:Percentage of companies under coverage globally within the Short-Term rating category. 4:Percentage of companies within the Short-Term rating category for which investment banking (IB) services were provided within the past 12 months.
KEY DEFINITIONS: Forecast Stock Return (FSR) is defined as expected percentage price appreciation plus gross dividend yield over the next 12 months. Market Return Assumption (MRA) is defined as the one-year local market interest rate plus 5% (a proxy for, and not a forecast of, the equity risk premium). Under Review (UR) Stocks may be flagged as UR by the analyst, indicating that the stock's price target and/or rating are subject to possible change in the near term, usually in response to an event that may affect the investment case or valuation. Short-Term Ratings reflect the expected near-term (up to three months) performance of the stock and do not reflect any change in the fundamental view or investment case. Equity Price Targets have an investment horizon of 12 months.
EXCEPTIONS AND SPECIAL CASES: UK and European Investment Fund ratings and definitions are: Buy: Positive on factors such as structure, management, performance record, discount; Neutral: Neutral on factors such as structure, management, performance record, discount; Sell: Negative on factors such as structure, management, performance record, discount. Core Banding Exceptions (CBE): Exceptions to the standard +/-6% bands may be granted by the Investment Review Committee (IRC). Factors considered by the IRC include the stock's volatility and the credit spread of the respective company's debt. As a result, stocks deemed to be very high or low risk may be subject to higher or lower bands as they relate to the rating. When such exceptions apply, they will be identified in the Company Disclosures table in the relevant research piece.
Research analysts contributing to this report who are employed by any non-US affiliate of UBS Securities LLC are not registered/qualified as research analysts with the NASD and NYSE and therefore are not subject to the restrictions contained in the NASD and NYSE rules on communications with a subject company, public appearances, and trading securities held by a research analyst account. The name of each affiliate and analyst employed by that affiliate contributing to this report, if any, follows.
UBS Deutschland AG: Sven Weier; Sebastian Ubert. UBS Limited: Fredric Stahl, CFA; Guillermo Peigneux Lojo. UBS Ltd Stockholm branch: Erik Eikeland.

Q-Series®: Global industrials 26 September 2013 38
Company Disclosures
Company Name Reuters 12-month rating Short-term rating Price Price date
A.P.Moller - Maersk A/S MAERSKb.CO Neutral N/A DKr50,550.00 30 Sep 2013
Boeing Co.2, 4, 6a, 6c, 7, 8, 16, 22 BA.N Neutral N/A US$117.50 30 Sep 2013
China COSCO Holdings - A16 601919.SS Sell N/A Rmb3.46 30 Sep 2013
DMG Mori Seiki 6141.T Not Rated N/A ¥1,523 30 Sep 2013
Eramet ERMT.PA Not Rated N/A €74.60 30 Sep 2013
Fanuc16 6954.T Sell N/A ¥16,210 30 Sep 2013
General Electric Co.2, 4, 6a, 6b, 6c, 7, 16, 22 GE.N Buy N/A US$23.89 30 Sep 2013
Hyundai Heavy Industries3b, 4 009540.KS Restricted N/A Won264,000 30 Sep 2013
Mitsubishi Heavy Industries12 7011.T Buy N/A ¥563 30 Sep 2013
MTU Aero Engines AG16, 18 MTXGn.F Neutral N/A €68.74 30 Sep 2013
Nippon Yusen16 9101.T Neutral N/A ¥310 30 Sep 2013
Nissei 6271.T Not Rated N/A ¥905 30 Sep 2013
Osaka Titanium Technologies 5726.T Not Rated N/A ¥2,105 30 Sep 2013
Rolls-Royce8, 16 RR.L Sell N/A 1,112p 30 Sep 2013
Siemens2, 3a, 4, 5, 6a, 14, 16 SIEGn.DE Buy N/A €89.06 30 Sep 2013
Sumitomo Heavy Industries 6302.T Not Rated N/A ¥446 30 Sep 2013
VSMPO-Avisma VSMO.RTS Not Rated N/A US$175.07 30 Sep 2013
Source: UBS. All prices as of local market close. Ratings in this table are the most current published ratings prior to this report. They may be more recent than the stock pricing date
2. UBS AG, its affiliates or subsidiaries has acted as manager/co-manager in the underwriting or placement of securities of this company/entity or one of its affiliates within the past 12 months.
3a. UBS Deutschland AG is currently acting as advisor to Siemens AG 3b. UBS Securities Pte Ltd, Seoul Branch is acting as financial advisor to Hyundai Heavy Industries for its potential
acquisition of Korea Aerospace Industries from Korea Finance Corp, Samsung Techwin, Hyundai Motor, DIP Holdings and Odin Holdings.
4. Within the past 12 months, UBS AG, its affiliates or subsidiaries has received compensation for investment banking services from this company/entity.
5. UBS AG, its affiliates or subsidiaries expect to receive or intend to seek compensation for investment banking services from this company/entity within the next three months.
6a. This company/entity is, or within the past 12 months has been, a client of UBS Securities LLC, and investment banking services are being, or have been, provided.
6b. This company/entity is, or within the past 12 months has been, a client of UBS Securities LLC, and non-investment banking securities-related services are being, or have been, provided.
6c. This company/entity is, or within the past 12 months has been, a client of UBS Securities LLC, and non-securities services are being, or have been, provided.
7. Within the past 12 months, UBS Securities LLC has received compensation for products and services other than investment banking services from this company/entity.
8. The equity analyst covering this company, a member of his or her team, or one of their household members has a long common stock position in this company.
12. An employee of UBS AG is an officer, director, or advisory board member of this company. 14. UBS Limited acts as broker to this company. 16. UBS Securities LLC makes a market in the securities and/or ADRs of this company. 18. In Germany, UBS Limited has entered into a contractual arrangement to act as the manager of orders (Designated
Sponsor) in the financial instruments of this company. 22. UBS AG, its affiliates or subsidiaries held other significant financial interests in this company/entity as of last
month`s end (or the prior month`s end if this report is dated less than 10 working days after the most recent month`s end).

Q-Series®: Global industrials 26 September 2013 39
For a complete set of disclosure statements associated with the companies discussed in this report, including information on valuation and risk, please contact UBS Securities LLC, 1285 Avenue of Americas, New York, NY 10019, USA, Attention: Publishing Administration.
This report was sent to the issuer prior to publication solely for the purpose of checking for factual accuracy, and no material changes were made to the content based on the issuer's feedback.
Unless otherwise indicated, please refer to the Valuation and Risk sections within the body of this report.
Q-Series®: Global industrials 26 September 2013 40
Global Disclaimer This document has been prepared by UBS Limited, an affiliate of UBS AG. UBS AG, its subsidiaries, branches and affiliates are referred to herein as UBS.
This document is for distribution only as may be permitted by law. It is not directed to, or intended for distribution to or use by, any person or entity who is a citizen or resident of or located in any locality, state, country or other jurisdiction where such distribution, publication, availability or use would be contrary to law or regulation or would subject UBS to any registration or licensing requirement within such jurisdiction. It is published solely for information purposes; it is not an advertisement nor is it a solicitation or an offer to buy or sell any financial instruments or to participate in any particular trading strategy. No representation or warranty, either express or implied, is provided in relation to the accuracy, completeness or reliability of the information contained in this document (‘the Information’), except with respect to Information concerning UBS. The Information is not intended to be a complete statement or summary of the securities, markets or developments referred to in the document. UBS does not undertake to update or keep current the Information. Any opinions expressed in this document may change without notice and may differ or be contrary to opinions expressed by other business areas or groups of UBS. Any statements contained in this report attributed to a third party represent UBS's interpretation of the data, information and/or opinions provided by that third party either publicly or through a subscription service, and such use and interpretation have not been reviewed by the third party.
Nothing in this document constitutes a representation that any investment strategy or recommendation is suitable or appropriate to an investor’s individual circumstances or otherwise constitutes a personal recommendation. Investments involve risks, and investors should exercise prudence and their own judgement in making their investment decisions. The financial instruments described in the document may not be eligible for sale in all jurisdictions or to certain categories of investors. Options, derivative products and futures are not suitable for all investors, and trading in these instruments is considered risky. Mortgage and asset-backed securities may involve a high degree of risk and may be highly volatile in response to fluctuations in interest rates or other market conditions. Foreign currency rates of exchange may adversely affect the value, price or income of any security or related instrument referred to in the document. For investment advice, trade execution or other enquiries, clients should contact their local sales representative.
The value of any investment or income may go down as well as up, and investors may not get back the full amount invested. Past performance is not necessarily a guide to future performance. Neither UBS nor any of its directors, employees or agents accepts any liability for any loss (including investment loss) or damage arising out of the use of all or any of the Information.
Any prices stated in this document are for information purposes only and do not represent valuations for individual securities or other financial instruments. There is no representation that any transaction can or could have been effected at those prices, and any prices do not necessarily reflect UBS's internal books and records or theoretical model-based valuations and may be based on certain assumptions. Different assumptions by UBS or any other source may yield substantially different results.
Research will initiate, update and cease coverage solely at the discretion of UBS Investment Bank Research Management. The analysis contained in this document is based on numerous assumptions. Different assumptions could result in materially different results. The analyst(s) responsible for the preparation of this document may interact with trading desk personnel, sales personnel and other parties for the purpose of gathering, applying and interpreting market information. UBS relies on information barriers to control the flow of information contained in one or more areas within UBS into other areas, units, groups or affiliates of UBS. The compensation of the analyst who prepared this document is determined exclusively by research management and senior management (not including investment banking). Analyst compensation is not based on investment banking revenues; however, compensation may relate to the revenues of UBS Investment Bank as a whole, of which investment banking, sales and trading are a part.
For financial instruments admitted to trading on an EU regulated market: UBS AG, its affiliates or subsidiaries (excluding UBS Securities LLC) acts as a market maker or liquidity provider (in accordance with the interpretation of these terms in the UK) in the financial instruments of the issuer save that where the activity of liquidity provider is carried out in accordance with the definition given to it by the laws and regulations of any other EU jurisdictions, such information is separately disclosed in this document. For financial instruments admitted to trading on a non-EU regulated market: UBS may act as a market maker save that where this activity is carried out in the US in accordance with the definition given to it by the relevant laws and regulations, such activity will be specifically disclosed in this document. UBS may have issued a warrant the value of which is based on one or more of the financial instruments referred to in the document. UBS and its affiliates and employees may have long or short positions, trade as principal and buy and sell in instruments or derivatives identified herein; such transactions or positions may be inconsistent with the opinions expressed in this document.
Q-Series®: Global industrials 26 September 2013 41
United Kingdom and the rest of Europe: Except as otherwise specified herein, this material is distributed by UBS Limited to persons who are eligible counterparties or professional clients. UBS Limited is authorised by the Prudential Regulation Authority and regulated by the Financial Conduct Authority and the Prudential Regulation Authority. France: Prepared by UBS Limited and distributed by UBS Limited and UBS Securities France S.A. UBS Securities France S.A. is regulated by the ACP (Autorité de Contrôle Prudentiel) and the Autorité des Marchés Financiers (AMF). Where an analyst of UBS Securities France S.A. has contributed to this document, the document is also deemed to have been prepared by UBS Securities France S.A. Germany: Prepared by UBS Limited and distributed by UBS Limited and UBS Deutschland AG. UBS Deutschland AG is regulated by the Bundesanstalt fur Finanzdienstleistungsaufsicht (BaFin). Spain: Prepared by UBS Limited and distributed by UBS Limited and UBS Securities España SV, SA. UBS Securities España SV, SA is regulated by the Comisión Nacional del Mercado de Valores (CNMV). Turkey: Distributed by UBS Limited. No information in this document is provided for the purpose of offering, marketing and sale by any means of any capital market instruments and services in the Republic of Turkey. Therefore, this document may not be considered as an offer made or to be made to residents of the Republic of Turkey. UBS AG is not licensed by the Turkish Capital Market Board under the provisions of the Capital Market Law (Law No. 6362). Accordingly, neither this document nor any other offering material related to the instruments/services may be utilized in connection with providing any capital market services to persons within the Republic of Turkey without the prior approval of the Capital Market Board. However, according to article 15 (d) (ii) of the Decree No. 32, there is no restriction on the purchase or sale of the securities abroad by residents of the Republic of Turkey. Poland: Distributed by UBS Limited (spolka z ograniczona odpowiedzialnoscia) Oddzial w Polsce. Russia: Prepared and distributed by UBS Securities CJSC. Switzerland: Distributed by UBS AG to persons who are institutional investors only. Italy: Prepared by UBS Limited and distributed by UBS Limited and UBS Italia Sim S.p.A. UBS Italia Sim S.p.A. is regulated by the Bank of Italy and by the Commissione Nazionale per le Società e la Borsa (CONSOB). Where an analyst of UBS Italia Sim S.p.A. has contributed to this document, the document is also deemed to have been prepared by UBS Italia Sim S.p.A. South Africa: Distributed by UBS South Africa (Pty) Limited, an authorised user of the JSE and an authorised Financial Services Provider. Israel: UBS Securities Israel Ltd is a licensed Investment Marketer that is supervised by the Israel Securities Authority (ISA). UBS Limited and its affiliates incorporated outside Israel are not licensed under the Israeli Advisory Law. This Material is being issued only to and/or is directed only at persons who are Qualified Investors within the meaning of the Israeli Advisory Law, and this material must not be relied on or acted upon by any other persons. Saudi Arabia: This document has been issued by UBS AG (and/or any of its subsidiaries, branches or affiliates), a public company limited by shares, incorporated in Switzerland with its registered offices at Aeschenvorstadt 1, CH-4051 Basel and Bahnhofstrasse 45, CH-8001 Zurich. This publication has been approved by UBS Saudi Arabia (a subsidiary of UBS AG), a Saudi closed joint stock company incorporated in the Kingdom of Saudi Arabia under commercial register number 1010257812 having its registered office at Tatweer Towers, P.O. Box 75724, Riyadh 11588, Kingdom of Saudi Arabia. UBS Saudi Arabia is authorized and regulated by the Capital Market Authority to conduct securities business under license number 08113-37. United States: Distributed to US persons by either UBS Securities LLC or by UBS Financial Services Inc., subsidiaries of UBS AG; or by a group, subsidiary or affiliate of UBS AG that is not registered as a US broker-dealer (a ‘non-US affiliate’ ) to major US institutional investors only. UBS Securities LLC or UBS Financial Services Inc. accepts responsibility for the content of a document prepared by another non-US affiliate when distributed to US persons by UBS Securities LLC or UBS Financial Services Inc. All transactions by a US person in the securities mentioned in this document must be effected through UBS Securities LLC or UBS Financial Services Inc., and not through a non-US affiliate. Canada: Distributed by UBS Securities Canada Inc., a registered investment dealer in Canada and a Member-Canadian Investor Protection Fund, or by another affiliate of UBS AG that is registered to conduct business in Canada or is otherwise exempt from registration. Hong Kong: Distributed by UBS Securities Asia Limited. Singapore: Distributed by UBS Securities Pte. Ltd. [mica (p) 033/11/2012 and Co. Reg. No.: 198500648C] or UBS AG, Singapore Branch. Please contact UBS Securities Pte. Ltd., an exempt financial adviser under the Singapore Financial Advisers Act (Cap. 110); or UBS AG, Singapore Branch, an exempt financial adviser under the Singapore Financial Advisers Act (Cap. 110) and a wholesale bank licensed under the Singapore Banking Act (Cap. 19) regulated by the Monetary Authority of Singapore, in respect of any matters arising from, or in connection with, the analysis or document. The recipients of this document represent and warrant that they are accredited and institutional investors as defined in the Securities and Futures Act (Cap. 289). Japan: Distributed by UBS Securities Japan Co., Ltd. to institutional investors only. Where this document has been prepared by UBS Securities Japan Co., Ltd., UBS Securities Japan Co., Ltd. is the author, publisher and distributor of the document. Australia: Distributed by UBS AG (Holder of Australian Financial Services License No. 231087) and/or UBS Securities Australia Ltd (Holder of Australian Financial Services License No. 231098). The Information in this document has been prepared without taking into account any investor’s objectives, financial situation or needs, and investors should, before acting on the Information, consider the appropriateness of the Information, having regard to their objectives, financial situation and needs. If the Information contained in this document relates to the acquisition, or potential acquisition of a particular financial product by a ‘Retail’ client as defined by section 761G of the Corporations Act 2001 where a Product Disclosure Statement would be required, the retail client should obtain and consider the Product Disclosure Statement relating to the product before making any decision about whether to acquire the product. New Zealand: Distributed by UBS New Zealand Ltd. The information and recommendations in this publication are provided for general information purposes only. To the extent that any such information or recommendations constitute financial advice, they do not take into account any person’s particular financial situation or goals. We recommend that recipients seek advice specific to their circumstances from their financial advisor. Dubai: The research distributed by UBS AG Dubai Branch is intended for Professional Clients only and is not for further distribution within the United Arab Emirates. Korea: Distributed in Korea by UBS Securities Pte. Ltd., Seoul Branch. This document may have been edited or contributed to from time to time by affiliates of UBS Securities Pte. Ltd., Seoul Branch. Malaysia: This material is authorized to be distributed in Malaysia by UBS Securities Malaysia Sdn. Bhd (253825-x). India: Prepared by UBS Securities India Private Ltd. 2/F, 2 North Avenue, Maker Maxity, Bandra Kurla Complex, Bandra (East), Mumbai (India) 400051. Phone: +912261556000 SEBI Registration Numbers: NSE (Capital Market Segment): INB230951431, NSE (F&O Segment) INF230951431, BSE (Capital Market Segment) INB010951437.
The disclosures contained in research documents produced by UBS Limited shall be governed by and construed in accordance with English law.
UBS specifically prohibits the redistribution of this document in whole or in part without the written permission of UBS and UBS accepts no liability whatsoever for the actions of third parties in this respect. Images may depict objects or elements that are protected by third party copyright, trademarks and other intellectual property rights. © UBS 2013. The key symbol and UBS are among the registered and unregistered trademarks of UBS. All rights reserved.