how do diabetes models measure up? a review of diabetes ...eprints.gla.ac.uk/116148/7/116148.pdf ·...
TRANSCRIPT

Copyright © 2013-2015 A2 Publications
Journal of Health Economics and Outcomes Research
How Do Diabetes Models Measure Up? A Review of Diabetes Economic Models and ADA Guidelines
Lindsay Govan1*, Olivia Wu1, Robert Lindsay1, Andrew Briggs1
Abstract
Introduction: Economic models and computer simulation models have been used for assessing short-term cost-effectiveness of interventions and modelling long-term outcomes and costs. Several guidelines and checklists have been published to improve the methods and reporting. This article presents an overview of published diabetes models with a focus on how well the models are described in relation to the considerations described by the American Diabetes Association (ADA) guidelines.
Methods: Relevant electronic databases and National Institute for Health and Care Excellence (NICE) guidelines were searched in December 2012. Studies were included in the review if they estimated lifetime outcomes for patients with type 1 or type 2 diabetes. Only unique models, and only the original papers were included in the review. If additional information was reported in subsequent or paired articles, then additional citations were included. References and forward citations of relevant articles, including the previous systematic reviews were searched using a similar method to pearl growing. Four principal areas were included in the ADA guidance reporting for models: transparency, validation, uncertainty, and diabetes specific criteria.
Results: A total of 19 models were included. Twelve models investigated type 2 diabetes, two developed type 1 models, two created separate models for type 1 and type 2, and three developed joint type 1 and type 2 models. Most models were developed in the United States, United Kingdom, Europe or Canada. Later models use data or methods from earlier models for development or validation. There are four main types of models: Markov-based cohort, Markov-based microsimulations, discrete-time microsimulations, and continuous time differential equations. All models were long-term diabetes models incorporating a wide range of compilations from various organ systems. In early diabetes modelling, before the ADA guidelines were published, most models did not include descriptions of all the diabetes specific components of the ADA guidelines but this improved significantly by 2004.
Conclusion: A clear, descriptive short summary of the model was often lacking. Descriptions of model validation and uncertainty were the most poorly reported of the four main areas, but there exist conferences focussing specifically on the issue of validation. Interdependence between the complications was the least well incorporated or reported of the diabetes-specific criterion.
1University of Glasgow, Glasgow, UK
*Corresponding author [email protected]
Keywords: Diabetes; predictive model; lifetime outcomes; computer simulation; economic evaluation; reporting guidelines
JHEOR 2015;3(2):132-52 www.jheor.org132

Journal of Health Economics and Outcomes Research
Copyright © 2013-2015 A2 Publicationswww.jheor.org JHEOR 2015;3(2):132-52
Govan L, et al.
Introduction
Rationale
Economic models have been used for assessing short-term cost-effectiveness of interventions as well as modelling long-term outcomes and lifetime costs in almost all disease areas. Decision makers often turn to computer simulation models to predict the effect of treatments in the longer term. These models can be used to address a variety of clinical outcomes and questions, and also assess new treatment strategies. Although clinical trials are excellent sources of information on effectiveness of treatments, they are only applicable to the population recruited, do not account for all characteristics of a population, and they tend to be short timescales.1 This means that economics models are useful sources of information by providing estimates of the long-term effects and costs of new interventions.
Several guidelines and checklists have been published to improve the methods and reporting of economic models.2-5 Philips et al3 performed a systematic review to identify and summarise all guidelines that were available for assessing quality of decision-analytic models. They created a checklist for critically appraising decision-analytic models for Health Technology Assessment (HTA), based on the format by Sculpher et al.4 The checklist suggests that models should clearly describe three major areas: structure such as clear statement of problems/objective, rationale for the structure, assumptions, comparisons, model types, time horizon, disease states and cycle lengths; the data used to develop and populate the model including how data was identified, modelled, and incorporated into the model, and assessing uncertainty; and consistency, meaning whether the model is performing the way it was intended to perform, both internally (by testing the mathematical logic of the model during development to fix errors) and externally (whether the results of the model are consistent with information contained in relevant primary research studies).
Other guidelines suggest that additional characteristics should be considered when assessing the quality of a model.6,7 These include: clinical relevance, encompassing all important facets of the disease of interest; transparency, details of model structure and assumptions are provided with clear data sources; reproducibility, results of the model can be reproduced by an independent researcher; interpretability, results are clear and can be easily interpreted; and exploration of analytical ability and uncertainty such as methodological, structural, and data uncertainty, including heterogeneity and parameter uncertainty.
Recently a series of seven papers were published which updated the recommendations for best practices. The series provides a series of recommendations for each stage of model development, providing helpful suggestions on assessing the model for developers, reviewers, and those who report the results of models or use models to make decisions. The series provides best practice advice and recommendations on five main areas: model conceptualisation; implementation of specific types of model, including state-transition models (cohort or individual), discrete-event simulation, and dynamic transmission models; dealing with uncertainty and parameter estimation; validity and reporting models transparently.8-14
However, in addition to generic advice for developing, assessing and reporting of economic models, there are often disease specific considerations that should be included in the model development. One area where economic models have been used widely is diabetes. Diabetes is a chronic and complex disease with increased risks of cardiovascular complications in addition to diabetes specific complications. The prevalence and financial cost of diabetes is rising worldwide15,16, meaning that understanding and accurately assessing the costs and effectiveness of healthcare delivery in diabetes is of clear importance to health services.
133

Copyright © 2013-2015 A2 Publications
Journal of Health Economics and Outcomes Research
www.jheor.org134 JHEOR 2015;3(2):132-52
Govan L, et al.
In 2004, the American Diabetes Association (ADA) convened a work group of diabetes modellers to create standardised guidelines that future modellers can use to ensure their models are accurate, useful and reliable.17 Along with the main considerations for models, they work group all determined a list of diabetes-specific requirements for the models.
There are several diabetes models in existence that have been included in previous reviews. One review18
focussed on assessing models used in drug treatment cost-effectiveness analysis and the treatment effects that are incorporated into the model. The authors focussed on the model’s ability to incorporate the costs and benefits associated with different drug treatment alternatives. This authors found that most models share common data sources and modelling approaches, and differed in terms of interventions and complications evaluated. They conclude that models should be reported in more detail in order to make them more transparent by including assumptions, data and statistical methods used, and should aim to include a wider range of treatment outcomes relating to both the effects of diabetes and its complications, and also side effects of treatments investigated.
Tarride et al19 provide an overview of models focussing on the details of the model itself such as type, structure, data sources, assumptions, validations, presentation or results, and treatment of uncertainty. Similar to Yi et al, the authors of this review found that most models used similar model types and data sources, but differed in the complications that were include in the model. The authors conclude that models could be enhanced if they were able to cope with both first- and second-order uncertainty.
Neither of the previous reviews assessed the quality of the reporting of the model in regards to the guidelines set out by ADA. This review identifies and critically appraises diabetes simulation prediction models used to calculate health economic outcomes. Specifically, this article presents an overview of published diabetes models with a focus on how well the models are described in relation to the considerations described by the ADA guidelines.
Methods
ADA Guidance
The American Diabetes Association are aware that decision makers are turning more to computer modelling in order to make decision on health care for those with diabetes. Models can be very powerful decision making tools if they are properly constructed, validated and applied. Therefore, a work group of diabetes modellers was convened to create standardised guidelines that future modellers can use to ensure their models are accurate, useful, reliable and reproducible, and to reassure model users of its quality.17
The workgroup determined there were three main considerations. First, models should be transparent by providing complete descriptions of the model’s structure including inputs, equations, algorithms, assumptions and data sources. If the model is based on previously published model, changes and additions should be described in adequate detail. Second, authors should report the level to which a model was validated to allow readers to assess whether predictions made by the model are accurate, this can include internal validation (reproduces results of the studies that are used to develop the model) and external validation (reproduces results of studies that were not used to develop the model). Finally, methods of assessing uncertainty should be described. Five types are listed, including ignorance, known variability, statistical variability, Monte Carlo variability and uncertainty from the model design. Uncertainty should be address through sensitivity analysis, averaging over multiple simulations or seek results from multiple models to ensure accuracy of results.
Copyright © 2013-2015 A2 Publications
Journal of Health Economics and Outcomes Research
www.jheor.org 135JHEOR 2015;3(2):132-52
Govan L, et al.
In addition to these, the ADA workgroup also list seven diabetes-specific requirements for models: long-term time horizons to allow complications to occur at a sensible time but also include mortality as a competing risk; include complications for multiple organ systems and interdependence between complications; include treatment effects since they can affect a diverse range of outcomes; should include both life-expectancy and quality of life measures; select the perspective of the model carefully and explicitly state it in the analysis; be aware that there is a delay between onset and diagnosis; developers should be specific about the criteria used to diagnose and classify diabetes since the diagnostic criteria have changed over time. The final two requirements were not investigated in this review since we were interested in models predicting lifetime outcomes post-diagnosis.
Literature Review
The National Health Service Economic Evaluation database (NHS EED), Ovid, MEDLINE, and EMBASE were searched in December 2012 to identify possibly relevant articles. A combination of medical subject headings (MESH) and relevant keywords were used. Search terms were combined with Boolean operators OR and AND. These included terms for the disease area (diabet$, diabetes, diabetes mellitus), study type (analys$, evaluat$, model$), type of model (predict$, simulate$, lifetime, computer simulation), and incorporating health economic components (cost-effectiv$, cost-utility, life-years gained, quality-adjusted life-year, QALY, economic$, economic evaluation, cost$).
Studies were included in the review if they estimated lifetime outcomes for patients with type 1 or type 2 diabetes. All types of models were included. Studies were excluded if they were clinical studies, cost or cost-effectiveness studies only (i.e. not simulation studies), non-diabetes related, or if title identified the article as a screening or preventative model. Studies were further excluded if they only modelled one type of diabetes complication (e.g. retinopathy), or only a subgroup of patients (e.g. overweight people with diabetes). The search was not restricted by date or language.
Titles and abstracts were screened to identify relevant publications. Only unique models were included in the review. If multiple papers reported using a particular model, the original paper was included in the review. However, for models where additional information was reported in subsequent or paired articles, then the additional citations were also included. Further to the electronic database searching, NICE guidelines were also searched. References and forward citations of relevant articles, including the previous systematic reviews were also searched using a method similar to the pearl growing method.20
A data extraction form was created in Excel. In order to assess each models’ reporting of the ADA guidelines the following details were collected: model aims/objectives; type of diabetes; model structure and simulation technique; data sources for patient data, costs, utilities, and methodologies; modelled complications/events; and outcomes and outputs from the model, such as life expectancy, QALY. These details were collected to assess model transparency, and to assess how the model incorporated the additional diabetes-specific considerations as suggested by the ADA guidelines.
Results
Search results
Figure 1 provides an overview of the number of studies identified, included, excluded and reasons for exclusion. In total 2389 citations were identified from electronic citation searching, of which 2341 were excluded based on title and abstract. Reference searching proved to be more efficient at identifying relevant

Copyright © 2013-2015 A2 Publications
Journal of Health Economics and Outcomes Research
www.jheor.org136 JHEOR 2015;3(2):132-52
Govan L, et al.
articles due to that vast number of economic evaluations performed in diabetes research. A total of 97 citations were extracted for full text review from electronic citation searching, and an additional 52 articles identified from forward citation searching and reference searching. Models that included a screening component were excluded from this review. However, models that used or extended the post-diagnosis component of a screening model in order to create a new model21, 22 were included.
After excluding articles based on the criteria described, a total of 28 articles were considered relevant to the review. This number does not represent the number of identified models but the number of articles that describe the models, including companion and paired articles which describe validation, methodology etc. After reviewing and grouping the articles, a total of 19 models were identified.
Figure 1. Flow Chart of Publications Selection and Exclusion from the Review
Study Characteristics, Summary of Studies
Table 1 provides a description of the models included in the review. As per the inclusion criteria, the models main aims were to evaluate therapies and interventions by predicting future medical events over a patient’s lifetime. Twelve models investigated type 2 diabetes23-34, two developed type 1 models35, 36, two created separate models for type 1 and type 237, 38, and three developed joint type 1 and type 2 diabetes models.39-41 The majority of models were developed either in the United States (9 models) or the United Kingdom (5 models), with the others developed elsewhere in Europe or Canada. The majority of later models use either data or methods from earlier models for development or validation.

Copyright © 2013-2015 A2 Publications
Journal of Health Economics and Outcomes Research
www.jheor.org 137JHEOR 2015;3(2):132-52
Govan L, et al.
Tabl
e 1.
Sum
mar
y of
Cha
ract
eris
tics
of I
nclu
ded
Mod
els
Whe
re?
Mod
el A
ims
Typ
e of
D
iabe
tes
Mod
el T
ype
Mon
te
Car
loE
vent
s/C
ompl
icat
ions
Dat
a So
urce
s
DC
CT
19
9635
US
Est
imat
e an
d co
mpa
re
bene
fits o
f in
tens
ive
ther
apy
of b
lood
gl
ucos
e co
mpa
red
to
conv
entio
nal t
hera
py
T1
Mar
kov-
base
d M
onte
C
arlo
mic
rosim
ulat
ion
mod
el si
mila
r to
that
de
velo
ped
by Ja
vitt8
9 (O
phth
alm
olog
y)
Yes
retin
opat
hy (5
stat
es),
neph
ropa
thy
(4 st
ates
), ne
urop
athy
(3 st
ates
), an
d m
orta
lity
DC
CT
Larg
e cl
inic
al tr
ials
and
epid
emio
logi
cal s
tudi
es
Eas
tman
19
9729
, 46
US
Pred
icts
rate
s of
mic
rova
scul
ar
com
plic
atio
ns, C
VD
an
d m
orta
lity
to
eval
uate
pre
vent
ativ
e in
terv
entio
ns
T2
Mar
kov-
bas
ed M
onte
C
arlo
mic
rosim
ulat
ion
mod
el si
mila
r to
DC
CT
1996
and
Javi
tt89
(Oph
thal
mol
ogy)
Yes,
rand
om
num
bers
ge
nera
ted
to
dete
rmin
e ev
ents
retin
opat
hy (5
stat
es),
neph
ropa
thy
(4 st
ates
), ne
urop
athy
(3 st
ates
), C
VD
mor
bidi
ty (2
st
ates
), an
d m
orta
lity
Larg
e cl
inic
al tr
ials
and
epid
emio
logi
cal s
tudi
es.
Fram
ingh
am u
sed
for C
VD
ris
k
Vija
n 19
9733
US
Cal
cula
tes r
isks f
or
deve
lopi
ng b
lindn
ess
and
rena
l dise
ase
for
patie
nts a
t diff
eren
t ag
es o
f di
abet
es
onse
t and
leve
ls of
gl
ycae
mic
con
trol
T2M
arko
v-ba
sed
coho
rt
mod
elN
o
retin
opat
hy (5
stat
es),
neph
ropa
thy
(5 st
ates
), in
clud
es n
o co
mps
and
de
ath
DC
CT
data
, and
coh
ort
data
incl
udin
g Ro
ches
ter
and
WE
SDR.
UK
PDS
used
for e
xter
nal v
alid
atio
n
Bro
wn
2000
(G
DM
)24U
S, U
K,
Pred
icts
med
ical
fu
ture
s of
both
in
divi
dual
s and
po
pula
tions
with
di
abet
es
T2
Disc
rete
-tim
e m
icro
simul
atio
n us
ing
cont
inuo
us p
redi
ctio
n eq
uatio
ns
Yes,
rand
om
num
bers
ge
nera
ted
to
dete
rmin
e ev
ents
retin
opat
hy (5
stat
es),
neph
ropa
thy
(4 st
ates
), ne
urop
athy
(3 st
ates
), 12
maj
or-d
iabe
tes
rela
ted
CV
D e
vent
s an
d se
cond
ary
even
ts,
all c
ause
mor
talit
y, an
d E
SRD
mor
talit
y
Use
s var
ious
dat
a so
urce
s an
d lit
erat
ure
to g
ener
ate
data
and
est
imat
e ev
ents
ra
tes/
prob
abili
ties:
Fram
ingh
am, K
aise
r Pe
rmen
te N
orth
wes
t, U
KPD
S, N
HA
NE
S II
I, U
S Re
nal d
ata
Syst
em

Copyright © 2013-2015 A2 Publications
Journal of Health Economics and Outcomes Research
www.jheor.org138 JHEOR 2015;3(2):132-52
Govan L, et al.
Tabl
e 1.
Sum
mar
y of
cha
ract
eris
tics
of in
clud
ed m
odel
s (c
ontin
ued)
Whe
re?
Mod
el A
ims
Typ
e of
D
iabe
tes
Mod
el T
ype
Mon
te
Car
loE
vent
s/C
ompl
icat
ions
Dat
a So
urce
s
Palm
er
2000
(A
ccui
sm)
38, 4
5
Swiss
Est
imat
es m
edic
al
and
cost
out
com
es
for p
rogr
essio
n of
di
abet
es a
nd re
late
d co
mpl
icat
ions
for
diff
eren
t int
erve
ntio
n st
rate
gies
T1, T
2
Mar
kov-
base
d co
hort
sim
ulat
ion
mod
el
No
retin
opat
hy (4
stat
es),
neph
ropa
thy
(9 st
ates
), ac
ute
MI (
7 st
ates
), st
roke
(4
stat
es),
ampu
tatio
n (4
stat
es),
hypo
glyc
aem
ia (3
stat
es),
keto
acid
osis
(3 st
ates
), la
ctic
aci
dosis
(T2
only
), an
d co
mpl
icat
ion
spec
ific
and
non-
spec
ific
mor
talit
y
DC
CT,
U
KPD
S,
Fram
ingh
am
Car
o 20
0025
US
To a
sses
s the
be
nefit
s and
cos
ts
of tr
oglit
azon
e to
im
prov
e gl
ycae
mic
co
ntro
l in
term
s of
long
-term
out
com
es
asso
ciat
ed w
ith
diab
etes
T2
Mar
kov-
base
d M
onte
Car
lo
mic
rosim
ulat
ion
mod
el, m
odifi
es
Eas
tman
m
odel
to fi
t cl
inic
al tr
ial
circ
umst
ance
s
Yes
retin
opat
hy (5
stat
es),
neph
ropa
thy
(4 st
ates
), ne
urop
athy
(5 st
ates
), hy
pogl
ycae
mia
, mac
rova
scul
ar
dise
ase,
and
mor
talit
y
Tria
ls an
d la
rge
epid
emio
-lo
gica
l stu
dies
, U
KPD
S, D
CC
T,
Roch
este
r, W
iscon
sin d
ata,
Fram
ingh
am ri
sk
Bag
ust
2001
(D
iDC
T)23
UK
Est
imat
e lif
etim
e di
abet
es-r
elat
ed
mor
bidi
ties,
and
use
the
mod
el fo
r ev
alua
tion
of p
olic
ies
and
inte
rven
tions
in
the
treat
men
t of
diab
etes
T2
Mar
kov-
base
d co
hort
mod
el,
exte
nsiv
e re
desig
n of
the
Eas
tman
mod
el
No
mod
ules
for d
iabe
tic th
erap
y (4
br
oad
clas
ses)
, HbA
1c p
rofil
e, re
tinop
athy
(9 st
ates
), ne
phro
path
y (4
stat
es),
neur
opat
hy (7
stat
es),
card
iova
scul
ar m
orbi
dity
and
di
ffer
ent m
orta
lity
risks
for e
ach
com
plic
atio
n, a
nd e
stim
ates
the
prev
alen
ce o
f al
l CV
D a
t all
ages
. A
fu
rthe
r 4 m
odul
es in
clud
ed (c
atar
act
rem
oval
, can
cer p
reva
lenc
e, m
ajor
hy
pogl
ycae
mic
eve
nts a
nd m
ultip
le
mor
bidi
ty)
UK
PDS,
W
ESD
R

Copyright © 2013-2015 A2 Publications
Journal of Health Economics and Outcomes Research
www.jheor.org 139JHEOR 2015;3(2):132-52
Govan L, et al.
Tabl
e 1.
Sum
mar
y of
Cha
ract
eris
tics
of I
nclu
ded
Mod
els
(con
tinue
d)
Whe
re?
Mod
el A
ims
Typ
e of
D
iabe
tes
Mod
el T
ype
Mon
te C
arlo
Eve
nts/
Com
plic
atio
nsD
ata
Sour
ces
CD
C 2
00221
, 26
US
Est
imat
ed in
crem
enta
l co
st-e
ffec
tiven
ess o
f in
tens
ive
glyc
aem
ic
cont
rol,
inte
nsifi
ed
hype
rten
sion
cont
rol,
and
redu
ctio
n in
seru
m
chol
este
rol
T2
Mar
kov-
bas
ed
coho
rt m
odel
bu
ildin
g on
E
astm
an a
nd a
sc
reen
ing
mod
el
prev
ious
ly
deve
lope
d by
C
DC.
[ref
CD
C
scre
enin
g]
Unc
lear
, no
men
tion
of M
C b
ut
Eas
tman
an
d C
DC
sc
reen
ing
was
retin
opat
hy (3
stat
es),
neph
ropa
thy
(5
stat
es),
neur
opat
hy (6
stat
es),
coro
nary
he
art d
iseas
e (6
stat
es),
stro
ke (4
stat
es)
and
mor
talit
y
UK
PDS,
N
HA
NE
S II
I
Edd
y 20
03(A
rchi
med
es)
39, 5
1, 5
2U
S
A m
athe
mat
ical
mod
el
of th
e an
atom
y, pa
thop
hysio
logy
, te
sts,
treat
men
ts a
nd
outc
omes
of
diab
etes
th
at si
mul
ates
wha
t ha
ppen
s in
real
life
in a
re
al h
ealth
car
e sy
stem
at
real
istic
and
nat
ural
le
vel o
f de
tail
Join
t T1
and
T2
Con
tinuo
us ti
me
mod
el u
sing
diff
eren
tial
equa
tions
an
d ob
ject
-or
ient
ated
pr
ogra
mm
ing.
No
Sim
ulat
es: p
atie
nts,
anat
omy
and
phys
iolo
gy, h
ealth
care
faci
litie
s and
pe
rson
nel,
test
s and
trea
tmen
ts,
outc
omes
. M
odel
can
be
redu
ced
in
deta
il de
pend
ing
on th
e ap
plic
atio
n
DC
CT,
U
KPD
S
Cla
rke
2004
(UK
PDS
OM
1)28
UK
Syst
em o
f eq
uatio
ns
to e
stim
ate
likel
y oc
curr
ence
and
tim
ing
of m
ajor
dia
bete
s an
d ca
rdio
vasc
ular
co
mpl
icat
ions
and
de
ath
T2D
iscre
te-ti
me
Mon
te C
arlo
m
icro
simul
atio
n
Yes,
rand
om
num
bers
ge
nera
ted
to
dete
rmin
e ev
ents
Firs
t com
plic
atio
ns fo
r: fa
tal o
r non
-fa
tal M
I, ot
her I
HD
, stro
ke, c
onge
stiv
e he
art f
ailu
re, a
mpu
tatio
n, re
nal f
ailu
re,
eye
dise
ase
(blin
dnes
s in
1 ey
e), d
eath
(im
med
iate
dea
th, d
iabe
tes-
rela
ted
deat
h an
d ot
her d
eath
)
UK
PDS
Copyright © 2013-2015 A2 Publications
Journal of Health Economics and Outcomes Research
www.jheor.org140 JHEOR 2015;3(2):132-52
Govan L, et al.
Tabl
e 1.
Sum
mar
y of
Cha
ract
eris
tics
of I
nclu
ded
Mod
els
(con
tinue
d)
Whe
re?
Mod
el A
ims
Typ
e of
D
iabe
tes
Mod
el T
ype
Mon
te C
arlo
Eve
nts/
Com
plic
atio
nsD
ata
Sour
ces
Palm
er
2004
(CO
RE
) 41
, 53
Swiss
, US
To d
eter
min
e lo
ng-
term
hea
lth o
utco
mes
an
d ec
onom
ic
cons
eque
nces
of
impl
emen
ting
diff
eren
t tre
atm
ents
for d
iabe
tes
Join
t T1
and
T2
Mar
kov-
base
d M
onte
Car
lo
mic
rosim
ulat
ion
mod
el
Yes,
rand
om
num
bers
ge
nera
ted
to
dete
rmin
e ev
ents
retin
opat
hy (4
stat
es p
lus
scre
enin
g, d
iagn
osis,
and
tre
atm
ent),
nep
hrop
athy
(7
stat
es),
neur
opat
hy (2
st
ates
), fo
ot u
lcer
(9 st
ates
), m
acul
ar o
edem
a (3
stat
es),
cata
ract
(3 st
ates
), hy
po
(2 st
ates
), ke
toac
idos
is (2
stat
es),
lact
ic a
cido
sis
(2 st
ates
), M
I (3
stat
es),
angi
na (2
stat
es),
CH
F (3
st
ates
), st
roke
(3 st
ates
), PV
D (2
stat
es),
non-
spec
ific
mor
talit
y
Fram
ingh
am, U
KPD
S,
DC
CT,
WE
SDR,
E
URO
DIA
B an
d ot
her
publ
ished
sour
ces
Mue
ller
2006
(E
AG
LE)
40
Fran
ce,
Ger
man
y, Sp
ain,
U
S,
UK
To si
mul
ate
diab
etes
-re
late
d co
mpl
icat
ions
an
d th
eir i
mpa
ct o
n co
sts a
cros
s a w
ide
spec
trum
of
diff
eren
t pa
tient
pop
ulat
ions
Join
t T1
and
T2
Disc
rete
-tim
e M
onte
Car
lo
mic
rosim
ulat
ion
NB:
pap
er sa
ys
disc
rete
eve
nt, b
ut
it is
disc
rete
tim
e sin
ce y
early
incr
e-m
ents
Yes
Retin
opat
hy (6
stat
es),
neph
ropa
thy
(3
stat
es),
neur
opat
hy (4
st
ates
), hy
pogl
ycae
mia
, ca
rdio
vasc
ular
syst
em
(non
-fat
al M
I, no
n-fa
tal
angi
na p
ecto
ris, n
on-f
atal
he
art f
ailu
re, n
on-f
atal
st
roke
), sp
ecifi
c ca
use
mor
talit
y (fa
tal M
I, fa
tal
HF,
fata
l stro
ke, d
eath
afte
r re
nal d
iseas
e), a
ll-ca
use
mor
talit
y
DC
CT,
U
KPD
S,
WE
SDR

Copyright © 2013-2015 A2 Publications
Journal of Health Economics and Outcomes Research
www.jheor.org 141JHEOR 2015;3(2):132-52
Govan L, et al.
Tabl
e 1.
Sum
mar
y of
Cha
ract
eris
tics
of I
nclu
ded
Mod
els
(con
tinue
d)
Whe
re?
Mod
el A
ims
Typ
e of
D
iabe
tes
Mod
el T
ype
Mon
te C
arlo
Eve
nts/
Com
plic
atio
nsD
ata
Sour
ces
Grim
a 20
0737
Can
ada
T1: d
eter
min
e he
alth
out
com
es a
nd
cons
eque
nces
of
diff
eren
t com
bina
tions
of
dia
bete
s in
terv
entio
ns in
new
ly
diag
nose
d T1
T2: E
xam
ine
long
te
rm c
ost-e
ffec
tiven
ess
of in
sulin
gla
rgin
e co
mpa
red
to N
PH
insu
lin in
pat
ient
s with
H
bA1c
>-7
%
T1,
T2M
arko
v-ba
sed
coho
rt m
odel
No
5 st
ates
ove
rall
rela
ting
to n
o co
mpl
icat
ions
, firs
t non
-fat
al
com
plic
atio
n, se
cond
non
-fat
al
com
plic
atio
n, fa
tal c
ompl
icat
ion,
an
d de
ath
from
oth
er c
ause
s.
Com
plic
atio
ns fo
r T1:
hyp
ogly
caem
ia,
keto
acid
osis,
MI,
stro
ke, a
mpu
tatio
n,
neph
ropa
thy,
retin
opat
hy C
ompl
icat
ions
for T
2: E
SRD
, am
puta
tion,
retin
opat
hy, M
I, H
F, st
roke
UK
PDS,
Pa
lmer
00
Tild
en
2007
32U
K
Com
pare
cos
ts
and
bene
fits o
f pi
oglit
azon
e vs
. ro
siglit
azon
e co
mbi
ned
with
met
form
in
T2
Mar
kov-
base
d M
onte
Car
lo
coho
rt si
mul
atio
n m
odel
usin
g U
K-
PDS
risk
equa
tions
Yes,
assu
me
rand
om
num
bers
ge
nera
ted
to
dete
rmin
e ev
ents
8 st
ates
ove
rall
rela
ting
to c
ombi
natio
n th
erap
y w
ith o
r with
out h
istor
y of
co
mpl
icat
ions
, ins
ulin
ther
apy
with
or
with
out h
istor
y of
com
plic
atio
ns,
disc
ontin
ued
ther
apy
ther
apy
with
or
with
out h
istor
y of
com
plic
atio
ns,
diab
etes
rela
ted
deat
h an
d no
n-di
abet
es
rela
ted
deat
h. E
vent
s inc
lude
IHD
, bl
indn
ess,
non-
fata
l/fa
tal M
I, no
n-fa
tal/
fata
l stro
ke, a
mpu
tatio
n, re
nal
failu
re
UK
PDS,
RC
T st
udie
s

Copyright © 2013-2015 A2 Publications
Journal of Health Economics and Outcomes Research
www.jheor.org142 JHEOR 2015;3(2):132-52
Govan L, et al.
Tabl
e 1.
Sum
mar
y of
Cha
ract
eris
tics
of I
nclu
ded
Mod
els
(con
tinue
d)
Whe
re?
Mod
el A
ims
Typ
e of
D
iabe
tes
Mod
el T
ype
Mon
te C
arlo
Eve
nts/
Com
plic
atio
nsD
ata
Sour
ces
Che
n 20
08
(JA
DE
)27, 5
4U
S
Inve
stig
ate
the
impa
ct o
f al
tern
ativ
e H
bA1c
thre
shol
ds
for t
reat
men
t in
tens
ifica
tion
T2
Disc
rete
-tim
e M
onte
Car
lo
mic
rosim
ulat
ion
with
risk
eq
uatio
ns fo
r eac
h co
mpl
icat
ion
and
deat
h
NB:
pap
er sa
ys
disc
rete
eve
nt,
but i
t is d
iscre
te
time
since
yea
rly
incr
emen
ts
Yes,
rand
om
num
bers
ge
nera
ted
to
dete
rmin
e ev
ents
Firs
t com
plic
atio
ns fo
r: fa
tal o
r non
-fat
al M
I, ot
her
IHD
, stro
ke, c
onge
stiv
e he
art f
ailu
re, a
mpu
tatio
n,
rena
l fai
lure
, eye
dise
ase
(blin
dnes
s in
1 ey
e), d
eath
(im
med
iate
dea
th, d
iabe
tes-
rela
ted
deat
h an
d ot
her
deat
h), a
nd a
trea
tmen
t m
odul
e w
hich
is u
pdat
ed
base
d on
HbA
1c
UK
PDS
OM
eve
nt
equa
tions
, Rea
l-life
E
ffec
tiven
ess a
nd C
are
Patte
rns o
f D
iabe
tes
Man
agem
ent s
tudy
Will
is 2
013
(EC
HO
) 34Sw
eden
To p
redi
ct c
osts
and
he
alth
out
com
es
and
to e
stim
ate
the
cost
-eff
ectiv
enes
s of
alte
rnat
ive
diab
etes
tre
atm
ents
T2M
arko
v-ba
sed
mic
rosim
ulat
ion
mod
el
Yes,
trans
ition
pr
obab
ilitie
s de
pend
on
tim
e-de
pend
ent
patie
nt-le
vel
cova
riate
s fr
om
prob
abili
stic
di
strib
utio
ns
Mar
co-v
ascu
lar
com
plic
atio
ns in
clud
e IH
D, M
I, C
HF,
Stro
ke.
Mar
kov
heal
th st
ates
in
clud
e m
icro
-vas
cula
r co
mpl
icat
ions
[ret
inop
athy
(1
0 st
ates
), ne
phro
path
y (4
stat
es),
neur
opat
hy (7
st
ates
)], a
nd a
dver
se e
vent
s of
trea
tmen
t [H
ypo
(2
stat
es),
Oth
er (4
stat
es)].
3
mor
talit
y eq
uatio
ns.
UK
PDS
for
mac
rova
scul
ar e
vent
s an
d m
orta
lity
equa
tions
, tra
nsiti
on p
roba
bilit
ies
from
NIH
and
DiD
AC
T m
odel
and
stru
ctur
e fr
om C
ORE
Copyright © 2013-2015 A2 Publications
Journal of Health Economics and Outcomes Research
www.jheor.org 143JHEOR 2015;3(2):132-52
Govan L, et al.
Tabl
e 1.
Sum
mar
y of
cha
ract
eris
tics
of in
clud
ed m
odel
s (c
ontin
ued)
Whe
re?
Mod
el A
ims
Typ
e of
di
abet
esM
odel
Typ
eM
onte
Car
loE
vent
s/C
ompl
icat
ions
Dat
a So
urce
s
Hay
es 2
013
(UK
PDS
OM
2)30
UK
Sim
ulat
e di
abet
es-
rela
ted
com
plic
atio
ns
over
a li
fetim
e an
d ca
lcul
ate
heal
th
outc
omes
by
re-
estim
atin
g th
e or
igin
al
risk
and
mor
talit
y eq
uatio
ns, e
stim
atin
g eq
uatio
ns fo
r new
ev
ents,
and
the
use
of
new
risk
fact
ors
T2
Disc
rete
-tim
e M
onte
Car
lo
mic
rosim
ulat
ion
with
risk
eq
uatio
ns fo
r eac
h co
mpl
icat
ion
and
deat
h
Yes,
rand
om
num
bers
ge
nera
ted
to
dete
rmin
e ev
ents
Firs
t com
plic
atio
ns: f
atal
or
non
-fat
al M
I, ot
her
IHD
, stro
ke, c
onge
stiv
e he
art f
ailu
re, a
mpu
tatio
n,
rena
l fai
lure
, eye
dise
ase
(blin
dnes
s in
1 ey
e),
diab
etic
ulc
er o
f th
e lo
wer
lim
b; se
cond
ary
com
plic
atio
ns: M
I, st
roke
an
d am
puta
tion;
dea
th
(imm
edia
te d
eath
, dia
bete
s-re
late
d de
ath
and
othe
r de
ath)
UK
PDS,
Lipi
ds in
Dia
bete
s Stu
dy
(LD
S)
Kru
ger 2
013
(She
ffiel
d)36
, 55
UK
Allo
w a
num
ber o
f co
st-e
ffec
tiven
ess
eval
uatio
ns fo
r adu
lts
with
type
1 d
iabe
tes
T1M
arko
v-ba
sed
mic
rosim
ulat
ion
mod
el
Unc
lear
, al
thou
gh
rand
om
num
bers
ge
nera
ted
to
dete
rmin
e ev
ents
and
ca
n be
use
d to
per
form
pr
obab
ilist
ic
sens
itivi
ty
anal
ysis
retin
opat
hy (5
stat
es),
neph
ropa
thy
(5 st
ates
, in
clud
ing
deat
h fr
om
ESR
D),
neur
opat
hy (3
st
ates
), ca
rdio
vasc
ular
(a
ngin
a, M
I, st
roke
, he
art f
ailu
re, d
eath
from
st
roke
, MI a
nd H
F),
acut
e co
mpl
icat
ions
(h
ypog
lyca
emia
, DK
A),
othe
r mor
talit
y
DC
CT,
W
ESD
R,
UK
PDS,
Eas
tman
, E
DIC
(Epi
dem
iolo
gy o
f D
iabe
tes I
nter
vent
ions
an
d C
ompl
icat
ions
)
Copyright © 2013-2015 A2 Publications
Journal of Health Economics and Outcomes Research
www.jheor.org144 JHEOR 2015;3(2):132-52
Govan L, et al.
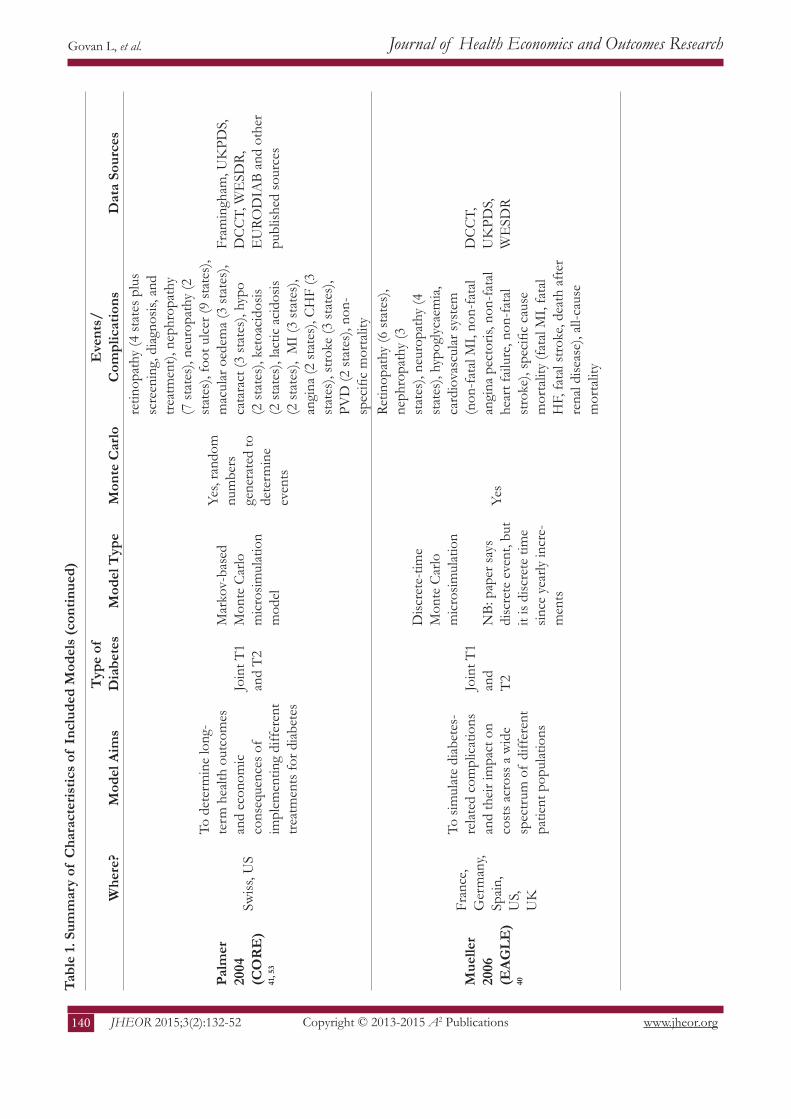
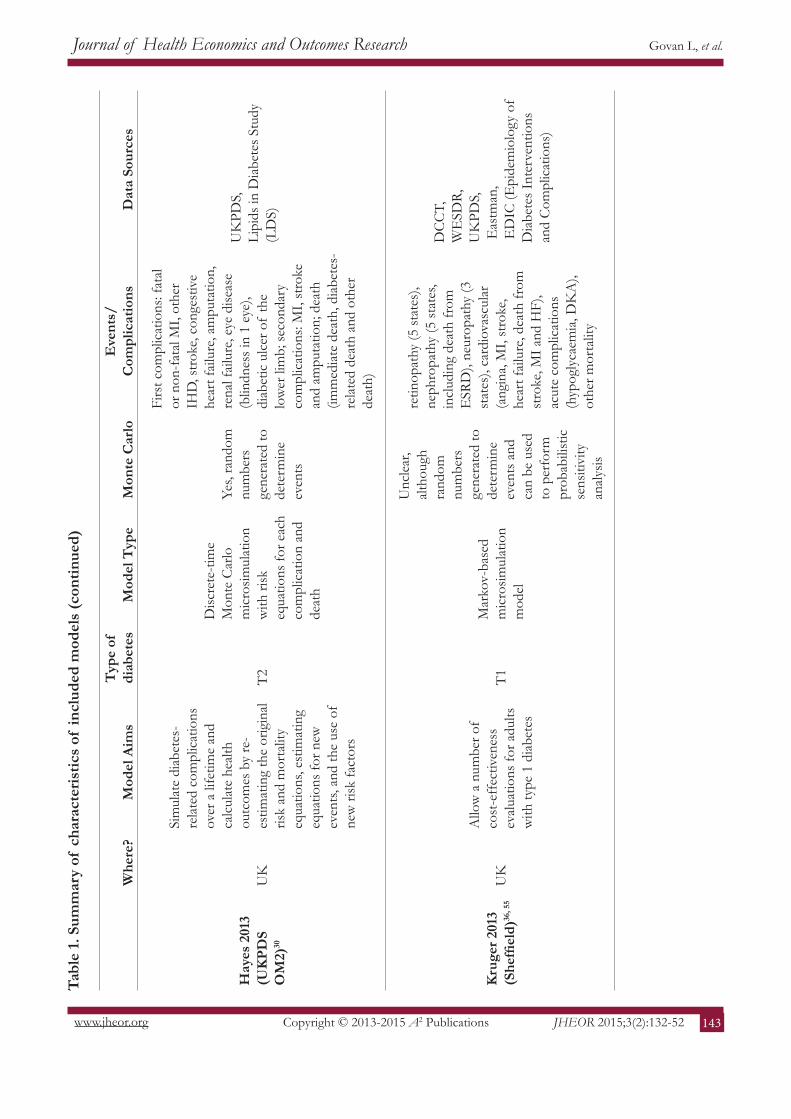
There are four main types of models that were reviewed: five were Markov-based cohort models23,26,32,33,37,38; six were Markov-based microsimulations25,29,34-36,41; five were discrete-time microsimulations using risk equations to determine events24,27,28,30,40; two models were a combination of Markov and discrete-time risk equations31,32; and one model used continuous time differential equations.39 A discrete-time simulation, also known as time-slicing, models the progression through time in which a constant time step is adopted.42 The model then assesses which events have happened at the end of each time step (or cycle). Multiple events can occur in each cycle until death. Markov-type models also, typically, use discrete-time steps.43 Markov models are state-transition models that assess the probabilities of transition to determine if a patient has moved from one state to another at the end of each cycle. The main assumption around Markov models is that it is memoryless. In other words, the transition to another state relies solely on the current state. However, techniques have been developed to mimic memory in these types of models.44 Markov models can be analysed using a cohort of patients, or following the path of an individual.
Of the models, eleven used Monte Carlo techniques24,25,27-30,32,34,35,40,41, five did not23,33,37,39,45, and three were unclear in their descriptions26,31,36. Monte Carlo simulation is used in order to provide a more stable estimate of outcomes or probabilistic answers to the simulation.
ADA Guidelines
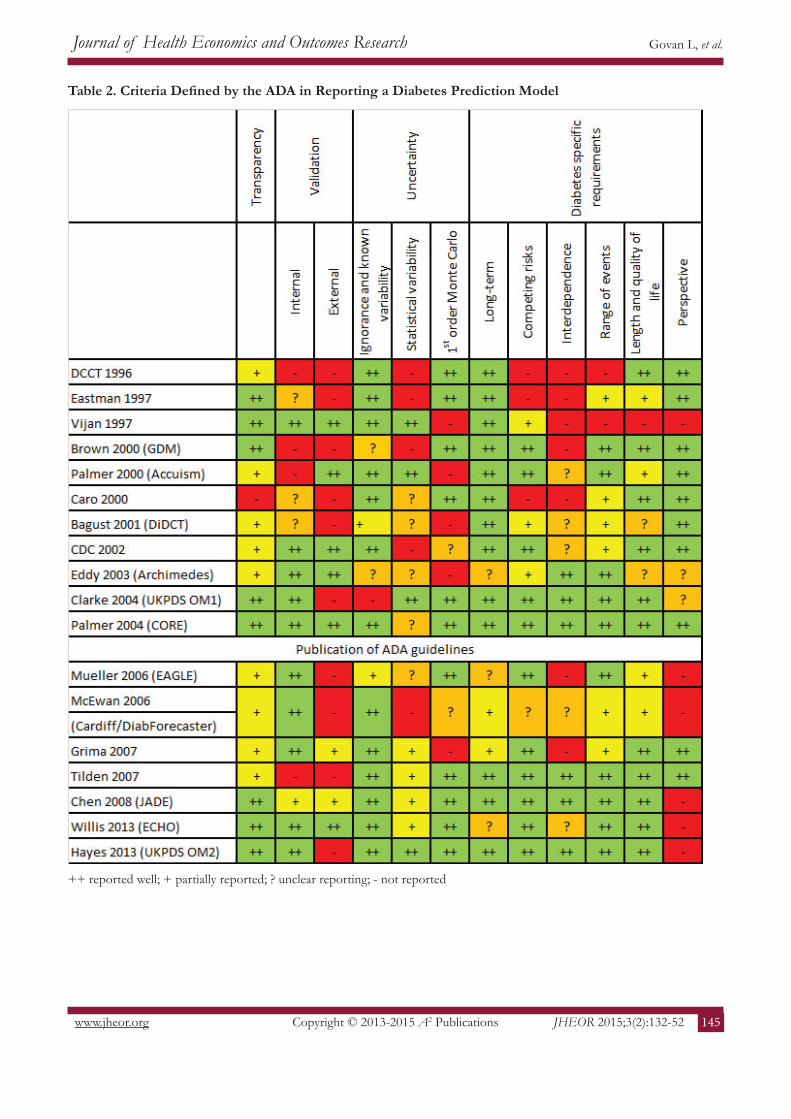
Table 2 provides a coding system for adequacy of reporting of the ADA criteria. In order for models to be reproducible, transparency is a key component of reporting a model. When assessing the transparency of the reporting of the models, we determined if a model diagram was reported along with equations, transition probabilities or other information relating to determination of events or transition between states. Nine models24,27-30,33,34,36,41 provided a model diagram and a description of further details needed to determine events or transitions, thereby providing adequate transparency in the model. A further six models23,26,32,35,37,45 provide a model diagram in detail but not all the details required to determine events/transitions; two models31,39 provide diagrams for some events but not a full diagram; and two models25,40 did not provide a model diagram in the paper.
Internal validation of models is reported in over half of the models reviewed, either within the original paper or as a companion article. External validation was less frequently reported alongside the original descriptive paper, though many have been validated in follow-up articles years after first publication.
ADA guidelines suggest different types of uncertainty that can be assessed, and suggestions on how to assess them. They advise assessing ignorance and known variability through sensitivity analysis, of which all models reported in some way. The majority of models reported both performing sensitivity and providing results within the article, with only five exceptions: one model24 was unclear in their descriptions of sensitivity analysis by stating it could be performed but did not detail what variables or parameters could be varied or report the results; two models state that sensitivity analysis was performed but did not report the results23,40; one did not mention sensitivity analysis28; and one model39 reported that uncertainty was dealt with through extensive validation, making it unclear how uncertainty was dealt with. Statistical variability (parameters derived from statistical analysis) was less well reported. ADA suggests either reporting confidence intervals for the parameter, confidence intervals for model results that depend on that parameter, or sensitivity analysis. However, for most models confidence intervals were not reported for the parameter, or sensitivity analyses performed around the parameters. Over half of the models reported the use of Monte Carlo techniques for dealing with uncertainty.
Copyright © 2013-2015 A2 Publications
Journal of Health Economics and Outcomes Research
www.jheor.org 145JHEOR 2015;3(2):132-52
Govan L, et al.
Table 2. Criteria Defined by the ADA in Reporting a Diabetes Prediction Model
++ reported well; + partially reported; ? unclear reporting; - not reported
Copyright © 2013-2015 A2 Publications
Journal of Health Economics and Outcomes Research
www.jheor.org146 JHEOR 2015;3(2):132-52
Govan L, et al.
The inclusion criteria determined that all models would be lifetime models. However, some do not report for how long the model is run, or cap the model at a particular age. For example, the Cardiff model stops after 20 years, but can be extended to 40 years if further information is provided to the model.31 Other models do not provide an estimate of the end point for the model, or for how long it can conceivably run.34,39,40 In early models, competing risks were not well reported or incorporated. However, only three models did not report any incorporation of competing risks.25,29,35
Interdependence is the least well reported of the diabetes specific criteria. The Archimedes model in 2003 and UKPDS in 2004 were the first models to explicitly report that interdependence was modelled between the complications. Neither of these models were Markov-based models, where interdependence may be difficult to incorporate between the different states. However, most Markov-based microsimulation models after this also included interdependence between types of events in some way, such as tracker variables. UKPDS, being the first discrete-time microsimulation, incorporated interdependence through the use of indicator variables. Consequently, many later models, such as the JADE model and ECHO amongst others, incorporated event equations from the UKPDS model, and so incorporated interdependence.
All models include retinopathy or blindness, and nephrology, renal failure or end-stage renal disease (ESRD) as possible complication events. All but one model includes neuropathy or amputation.33 Eastman29 and GDM24 include a CVD module where states included yes or no but Accuism45 was the first to incorporate specific CVD complications as modules or events in the model. Following this, all models included both micro- and macrovascular complications.
Length of life is reported in all but one of the models, which instead reported duration of treatment to prevent 1 year of blindness.33 One model did not report QALY45; two studies were unclear in their reporting if QALYs or QALEs could be calculated using the model23,39; and one reported QALYs in a companion paper.46 Perspective of costs was not often reported, mainly because the paper reports the model description and method and costs, QALYS and perspective are reported in application papers published after the initial article.
Discussion
This article aimed to critically appraise how well the models are described in relation to the criteria described by the ADA guidelines, which included four main areas: transparency, validation, uncertainty and diabetes specific criteria. In total, 19 models were identified which were described in over 28 articles. The majority of models provided adequate descriptions of the models, although a clear, descriptive short summary of the model was often lacking. In early diabetes modelling, before the ADA guidelines were published, the majority of models did not include descriptions of all the diabetes specific components of the ADA guidelines. However, by 2004 most models were reporting these components. All models were long-term diabetes models with the majority providing estimates of length and quality of life, and incorporating a wide range of compilations from various organ systems. However, descriptions of model validation and uncertainty were the most poorly reported of the four main areas, with interdependence between the complications being the least well incorporated or reported of the diabetes-specific criterion. These areas will be discussed further.
Validation
Model transparency does not indicate that a model is accurate. Therefore, it is important that a model
Copyright © 2013-2015 A2 Publications
Journal of Health Economics and Outcomes Research
www.jheor.org 147JHEOR 2015;3(2):132-52
Govan L, et al.
is also valid. Validation aims to determine if a model accurately calculates the outcomes of interest.10 Five main types of validation are identified: face validity, verification (internal validity), cross validity, external validity and predictive validity. The ADA guidelines recommend describing internal validity and external validity of a model.
Internal validity is the extent to which a model reproduces the results of the studies that are used to develop the model.17 In other words, ensuring that the model behaves as intended and has been implemented correctly.10 The ISPOR-SMDM Modelling Good Research Practices Task Force recommend that all model should be subjected to rigorous verification and the methods used should be described in the non-technical documentation of the model. The majority of models in this review report internal validation either within the original paper or as a companion paper. The authors often only state that the model was validated against the data from which it was created but do not provide specific details. However, this does not mean that further details are not available elsewhere, such as a non-peer reviewed report or requested from authors.
External validation should show if the model can reproduce results of studies that were not used to develop the model and involves three steps: identifying data sources, running the model and comparing the results. Models often draw on the same data sources in order to populate or create the models. For example, the UKPDS dataset47 and risk equations28 are used for creation by all but three models, two of which were published before the UKPDS trial29,35, and one that used in for external validation.33 This poses a problem for externally validating the models. Due to the lack of appropriate, independent data at the time of model creation, external validation often occurs years after the model was first reported, for example the CDC model.48 The UKPDS trial was one of very few large trials conducted that could be used for validation, but if the majority of the other models already use the UKPDS risk equations in their construction then this would exclude it from being used for independent external validation. Another complication in the effort to externally validate a model occurs when older datasets are not necessarily relevant today given new drugs on market, lifestyle interventions and better standard of living/life expectancy. Additionally, validation of a model using one data source does not necessarily make it valid, as it would need to be tested using various patient groups, timescales and other factors.10,49 However, the Mount Hood diabetes challenge (http://www.mthooddiabeteschallenge.org/) has been instrumental in encouraging external validation (and cross validation) by issuing ‘short term’ challenges designed to look at how models predict trials that have been published after model development. The Mount Hood Diabetes Challenge provides a platform to externally validate models. The conference brings together diabetes researchers to help solve the challenge of treating diabetes, discuss the modelling of diabetes progression and diabetes complications. Hypothetical modelling challenges are provided to modelling groups in advance of the conference, and the results are compared and examined during the conference.
Uncertainty
Uncertainty analysis aims to assess the confidence in a chosen course of action and determine the value of additional information to inform a decision.11 All models included in the review assessed uncertainty through some means, either by deterministic sensitivity analysis, probabilistic sensitivity analysis or Monte Carlo simulations. However, Expected Value of Perfect Information (EVPI) and Expected Value of Perfect Parameter Information (EVPPI) were not assessed or reported by any of the models. The Archimedes model39 aimed to assess uncertainty through extensive validation, but the authors concede that this approach introduces further error and bias since trials are subject to random and systematic errors.

Copyright © 2013-2015 A2 Publications
Journal of Health Economics and Outcomes Research
www.jheor.org148 JHEOR 2015;3(2):132-52
Govan L, et al.
The structure of the model will determine whether Monte Carlo error (of stochastic error) can be ignored.11 For individual patient simulation, such as the discrete-time models or Markov-based microsimulations, Monte Carlo error needs to be eliminated before addressing parameter uncertainty. Of the models included in this review, five were Markov-based cohort models, which do not require elimination of Monte Carlo error. This means that the model articles did not report the use of Monte Carlo techniques, as it was not required to assess uncertainty.
Bagust et al23 argues against the use of microsimulation and Monte Carlo simulation. They argue that in long-term models using these techniques introduces further uncertainty in the model due to the assumptions around the source and nature of variations. Also, the authors believe that any confidence regions obtained will offer little information due to being too wide. The authors suggest that the only practical approach to assessing uncertainty is to perform selective sensitivity analysis. However, recent guidelines11 suggest that selectively varying the inputs of the model to assess the changes on the outputs should only be used as a measure of sensitivity and does not represent uncertainty in the parameters.
Interdependence
Previous to 2003 (and therefore the publication of the ADA guidelines) many models did not include adequate descriptions of the diabetes specific requirements as outlined by ADA. Interdependence between diabetes endpoints was least well reported or incorporated by the models. However, the type of model used may be a possible explanation for this. Twelve models were Markov based models (six microsimulation), five were discrete-time, one was a combination of discrete-time and Markov-based modelling, and the last used continuous time differential equations. The different modelling approaches have different strengths and limitations.
Cohort Markov models simplify the model into a discrete number of states and minimise computing time by simulating a cohort and not individual patients. Markov microsimulation models allow variation between individual patients to be modelled. Markov models by definition do not carry a history of events or of time spent in previous states. This can be overcome by incorporating temporary or tunnel states, which can only be visited in a specific sequence44; or tracker variables, which update when an event has taken place.43 Tracker variables will generally only be incorporated when the model is a microsimulation meaning that a record of that patient’s movements may be recorded.
Discrete-time models allow a larger number of possible events to be included and can more easily incorporate interdependence between types of events. This was achieved by including an indicator variable that would update when an event occurred. Three discrete-time models were described as discrete-event models within the article. However, each of these models actually used a discrete-time step in the simulation. A discrete-time simulation, also known as time-slicing, models the progression through time in which a constant time step is adopted.42 The model then assesses which events have happened at the end of each time step. In contrast, in a discrete-event simulation, the simulator need not explicitly represent the state of the system at non-event times and can therefore move from one event to the next without simulating all time-steps in between.9,50 None of the models included in this review utilise a discrete-event simulation structure.
Continuous-time differential equations have many advantages, including preserving the continuous nature of risk factors, and incorporating this into interactions between comorbidities, complications and disease. Thus interdependence is achieved between all disease, complications and comorbidities included in the model. However, due to the complex nature of the more advanced mathematics used, the model is less transparent due to fewer people having the training and knowledge to use these models.39
Copyright © 2013-2015 A2 Publications
Journal of Health Economics and Outcomes Research
www.jheor.org 149JHEOR 2015;3(2):132-52
Govan L, et al.
Conclusions
After the publication of the ADA guidelines, several models reference the guidelines and work towards better reporting based on them. The guidelines themselves do not take into account that some requirements are unnecessary for inclusion in the model. For example, Markov-based cohort models do not require the elimination of Monte Carlo error and so this will not be reported. Bagust and McEwan49 warn that strictly following the guidelines may mislead users into believing that the models are accurate and reliable. They state that models are only a tool to guide decision makers and not objective evidence.
This is the first review to assess diabetes model on how adequately published diabetes models report on the criteria set out by the ADA guidelines for diabetes modelling. Diabetes modelling is still in its relative infancy with the first major model published in 1996. As more models have been developed, the quality of reporting of the model has improved, but more emphasis should be placed on including a clear, descriptive short summary of the model; reporting the validation procedures; the assessment of uncertainty in models; and incorporating interdependence between complications.
Declaration of Competing Interests
The authors confirm that this is original work that has not been published or submitted for publication elsewhere, and that there are no conflicts of interest for any author. Author contributions are as follows. LG designed and carried out the systematic search and drafted the manuscript. All authors were involved in design of the study, decision for inclusion and exclusion of articles, and editing of the manuscript for submission. All authors read and approved the final manuscript.
References
1 Caro JJ, Möller J, Getsios D: Discrete Event Simulation: The Preferred Technique for Health Economic Evaluations? Value Health 2010;13:1056-60.
2 Philips Z, Bojke L, Sculpher M, Claxton K, Golder S: Good practice guidelines for decision-analytic modelling in health technology assessment: a review and consolidation of quality assessment. Pharmacoeconomics 2006;24:355-371.
3 Philips Z, Ginnelly L, Sculpher M, et al: Review of guidelines for good practice in decision-analytic modelling in health technology assessment. Health Technol Assess 2004;8(36):iii-iv, ix-xi, 1-158.
4 Sculpher M, Fenwick E, Claxton K: Assessing quality in decision analytic cost-effectiveness models. A suggested framework and example of application. Pharmacoeconomics 2000;17:461-77.
5 Weinstein MC, O’Brien B, Hornberger J, et al: Principles of good practice for decision analytic modeling in health-care evaluation: report of the ISPOR Task Force on Good Research Practices--Modeling Studies. Value Health 2003;6:9-17.
6 Veenstra DL, Ramsey SD, Sullivan SD: A guideline for the use of pharmacoeconomic models of diabetes treatment in the US managed-care environment. Pharmacoeconomics 2002;20(Suppl 1):21-30.
7 Coyle D, Lee KM, O’Brien BJ: The role of models within economic analysis: focus on type 2 diabetes mellitus. Pharmacoeconomics 2002;20 Suppl 1:11-19.
8 Caro JJ, Briggs AH, Siebert U, Kuntz KM: Modeling good research practices--overview: a report of the ISPOR-SMDM Modeling Good Research Practices Task Force--1. Value Health 2012;15:796-803.
9 Karnon J, Stahl J, Brennan A, Caro JJ, Mar J, Möller J: Modeling Using Discrete Event Simulation: A Report of the ISPOR-SMDM Modeling Good Research Practices Task Force–4. Med Decis Making 2012;32(5):701-11.
Copyright © 2013-2015 A2 Publications
Journal of Health Economics and Outcomes Research
www.jheor.org150 JHEOR 2015;3(2):132-52
Govan L, et al.
10 Eddy DM, Hollingworth W, Caro JJ, Tsevat J, McDonald KM, Wong JB: Model transparency and validation: a report of the ISPOR-SMDM Modeling Good Research Practices Task Force-7. Med Decis Making 2012;32(5):733-43.
11 Briggs AH, Weinstein MC, Fenwick EA, Karnon J, Sculpher MJ, Paltiel AD: Model parameter estimation and uncertainty analysis: a report of the ISPOR-SMDM Modeling Good Research Practices Task Force Working Group-6. Med Decis Making 2012;32:722-32.
12 Pitman R, Fisman D, Zaric GS, et al: Dynamic transmission modeling: a report of the ISPOR-SMDM Modeling Good Research Practices Task Force Working Group-5. Med Decis Making 2012;32:712-21.
13 Roberts M, Russell LB, Paltiel AD, Chambers M, McEwan P, Krahn M: Conceptualizing a Model: A Report of the ISPOR-SMDM Modeling Good Research Practices Task Force-2. Value Health 2012;15:804-11.
14 Siebert U, Alagoz O, Bayoumi AM, et al: State-Transition Modeling: A Report of the ISPOR-SMDM Modeling Good Research Practices Task Force–3. Med Decis Making 2012;32:690-700.
15 Shaw JE, Sicree RA, Zimmet PZ: Global estimates of the prevalence of diabetes for 2010 and 2030. Diabetes Res Clin Pract 2010;87(1):4-14.
16 Zhang P, Zhang X, Brown J, et al: Global healthcare expenditure on diabetes for 2010 and 2030. Diabetes Res Clin Pract 2010;87:293-301.
17 American Diabetes Association: Guidelines for computer modeling of diabetes and its complications. Diabetes Care 2004;27:2262-5.
18 Yi Y, Philips Z, Bergman G, Burslem K: Economic models in type 2 diabetes. Curr Med Res Opin 2010;26(9):2105-18.
19 Tarride JE, Hopkins R, Blackhouse G, et al: A review of methods used in long-term cost-effectiveness models of diabetes mellitus treatment. [Review] [67 refs]. Pharmacoeconomics 2010;28:255-77.
20 Schlosser RW, Wendt O, Bhavnani S, Nail-Chiwetalu B: Use of information-seeking strategies for developing systematic reviews and engaging in evidence-based practice: the application of traditional and comprehensive Pearl Growing. A review. Int J Language Communication Disord 2006;41(5):567-82.
21 [No authors listed] The cost-effectiveness of screening for type 2 diabetes. CDC Diabetes Cost-Effectiveness Study Group, Centers for Disease Control and Prevention. JAMA 1998;280(20):1757-63.
22 Zhou H, Isaman DJ, Messinger S, et al: A computer simulation model of diabetes progression, quality of life, and cost. Diabetes Care 2005;28(12):2856-63.
23 Bagust A, Hopkinson PK, Maier W, Currie CJ: An economic model of the long-term health care burden of Type II diabetes. Diabetologia 2001;44:2140-55.
24 Brown JB, Russell A, Chan W, Pedula K, Aickin M: The global diabetes model: user friendly version 3.0. Diabetes Res Clin Pract 2000;50:Suppl 3:S15-46.
25 Caro JJ, Klittich WS, Raggio G, et al: Economic assessment of troglitazone as an adjunct to sulfonylurea therapy in the treatment of type 2 diabetes. Clin Ther 2000;22(1):116-27.
26 CDC Diabetes Cost-Effectiveness Group: Cost-effectiveness of intensive glycemic control, intensified hypertension control, and serum cholesterol level reduction for type 2 diabetes. JAMA 2002;287:2542-51.
27 Chen J, Alemao E, Yin D, Cook J: Development of a diabetes treatment simulation model: with application to assessing alternative treatment intensification strategies on survival and diabetes-related complications. Diabetes Obes Metab 2008;10 Suppl 1:33-42.
28 Clarke PM, Gray AM, Briggs A, et al: A model to estimate the lifetime health outcomes of patients with Type 2 diabetes: The United Kingdom Prospective Diabetes Study (UKPDS) Outcomes Model (UKPDS no. 68). Diabetologia 2004;47(10):1747-59.
29 Eastman RC, Javitt JC, Herman WH, et al: Model of complications of NIDDM. I. Model construction and assumptions. Diabetes Care 1997;20:725-34.

Copyright © 2013-2015 A2 Publications
Journal of Health Economics and Outcomes Research
www.jheor.org 151JHEOR 2015;3(2):132-52
Govan L, et al.
30 Hayes AJ, Leal J, Gray AM, Holman RR, Clarke PM: UKPDS Outcomes Model 2: a new version of a model to simulate lifetime health outcomes of patients with type 2 diabetes mellitus using data from the 30 year United Kingdom Prospective Diabetes Study: UKPDS 82. Diabetologia 2013;56:1925-33.
31 McEwan P, Peters JR, Bergenheim K, Currie CJ: Evaluation of the costs and outcomes from changes in risk factors in type 2 diabetes using the Cardiff stochastic simulation cost-utility model (DiabForecaster). Curr Med Res Opin 2006;22(1):121-9.
32 Tilden DP, Mariz S, O’Bryan-Tear G, Bottomley J, Diamantopoulos A: A lifetime modelled economic evaluation comparing pioglitazone and rosiglitazone for the treatment of type 2 diabetes mellitus in the UK. Pharmacoeconomics 2007;25(1):39-54.
33 Vijan S, Hofer TP, Hayward RA: Estimated benefits of glycemic control in microvascular complications in type 2 diabetes. Ann Intern Med 1997;127(9):788-95.
34 Willis M, Asseburg C, He J: Validation of economic and health outcomes simulation model of type 2 diabetes mellitus (ECHO-T2DM). J Med Econ 2013;16(8):1007-21.
35 [No authors listed] Lifetime benefits and costs of intensive therapy as practiced in the diabetes control and complications trial. The Diabetes Control and Complications Trial Research Group. JAMA 1996;276(17):1409-15.
36 Kruger J, Brennan A, Thokala P, et al: The cost-effectiveness of the Dose Adjustment for Normal Eating (DAFNE) structured education programme: an update using the Sheffield Type 1 Diabetes Policy Model. Diabet Med 2013;30(10):1236-44.
37 Grima DT, Thompson MF, Sauriol L: Modelling cost effectiveness of insulin glargine for the treatment of type 1 and 2 diabetes in Canada. Pharmacoeconomics 2007;25(3):253-66.
38 Palmer AJ, Brandt A, Gozzoli V, Weiss C, Stock H, Wenzel H: Outline of a diabetes disease management model: principles and applications. Diabetes Res Clin Pract 2000;50 Suppl 3:S47-S56.
39 Eddy DM, Schlessinger L: Archimedes: a trial-validated model of diabetes. Diabetes Care 2003;26:3093-101.40 Mueller E, Maxion-Bergemann S, Gultyaev D, et al: Development and validation of the Economic Assessment
of Glycemic Control and Long-Term Effects of diabetes (EAGLE) model. Diabetes Technol Ther 2006;8:219-36.
41 Palmer AJ, Roze S, Valentine WJ, et al: The CORE Diabetes Model: Projecting long-term clinical outcomes, costs and cost-effectiveness of interventions in diabetes mellitus (types 1 and 2) to support clinical and reimbursement decision-making. CurrMed Res Opin 2004;20 Suppl 1:S5-26.
42 Robinson S. Simulation: The practice of model development and use. John Wiley & Sons; 2004.43 Stahl JE: Modelling methods for pharmacoeconomics and health technology assessment: An overview and
guide. Pharmacoeconomics 2008;26(2):131-48.44 Sonnenberg FA, Beck JR: Markov models in medical decision making: a practical guide. Med Decis Making
1993;13(4):322-38.45 Palmer AJ, Weiss C, Sendi PP, et al: The cost-effectiveness of different management strategies for type I
diabetes: a Swiss perspective. Diabetologia 2000;43(1):13-26.46 Eastman RC, Javitt JC, Herman WH, et al: Model of complications of NIDDM. II. Analysis of the health
benefits and cost-effectiveness of treating NIDDM with the goal of normoglycemia. Diabetes Care 1997;20(5):735-44.
47 UKPDS Group. UK Prospective Diabetes Study (UKPDS). VIII. Study design, progress and performance. Diabetologia 1991;34(12):877-90.
48 Hoerger TJ, Segel JE, Zhang P, Sorensen SW: Validation of the CDC-RTI diabetes cost-effectiveness model. Research Triangle Park, NC: RTI International: http://www.rti.org/rtipress. 2009. Accessed November 2013.
Copyright © 2013-2015 A2 Publications
Journal of Health Economics and Outcomes Research
www.jheor.org152 JHEOR 2015;3(2):132-52
Govan L, et al.
49 Bagust A, McEwan P: Guidelines for computer modeling of diabetes and its complications: response to American Diabetes Association Consensus Panel. Diabetes Care 2005;28(2):500; author reply 500-1.
50 Karnon J: Alternative decision modelling techniques for the evaluation of health care technologies: Markov processes versus discrete event simulation. Health Econ 2003;12(10):837-48.
51 Eddy DM, Schlessinger L: Validation of the archimedes diabetes model. Diabetes Care 2003;26(11):3102-10.52 Schlessinger L, Eddy DM: Archimedes: a new model for simulating health care systems-the mathematical
formulation. J Biomed Inform 2002;35(1):37-50.53 Palmer AJ, Roze S, Valentine WJ, et al: Validation of the CORE Diabetes Model against epidemiological and
clinical studies. Curr Med Res Opin 2004;20 Suppl 1:S27-40.54 Schwarz B, Gouveia M, Chen J, et al: Cost-effectiveness of sitagliptin-based treatment regimens in European
patients with type 2 diabetes and haemoglobin A1c above target on metformin monotherapy. Diabetes Obes Metab 2008;10 Suppl 1:43-55.
55 Thokala P, Kruger J, Brennan A, et al: The Sheffield Type 1 Diabetes Policy Model. http://www.shef.ac.uk/scharr/sections/heds/discussion-papers/1305-1.258469. Accessed November 2013.