how do foreign institutional investors enhance firm
TRANSCRIPT

JOURNAL OF FINANCIAL AND QUANTITATIVE ANALYSIS Vol. 52, No. 4, Aug. 2017, pp. 1449–1490COPYRIGHT 2017, MICHAEL G. FOSTER SCHOOL OF BUSINESS, UNIVERSITY OF WASHINGTON, SEATTLE, WA 98195doi:10.1017/S0022109017000497
How Do Foreign Institutional Investors EnhanceFirm Innovation?
Hoang Luong, Fariborz Moshirian, Lily Nguyen, Xuan Tian, andBohui Zhang*
AbstractWe examine the effect of foreign institutional investors on firm innovation. Using firm-leveldata across 26 non-U.S. economies between 2000 and 2010, we show that foreign institu-tional ownership has a positive, causal effect on firm innovation. We further explore threepossible underlying mechanisms through which foreign institutions affect firm innovation:Foreign institutions act as active monitors, provide insurance for firm managers against in-novation failures, and promote knowledge spillovers from high-innovation economies. Ourarticle sheds new light on the real effects of foreign institutions on firm innovation.
I. IntroductionTechnological innovation determines a country’s long-term economic growth
(Solow (1957)). Despite various efforts to promote innovation, it remains a sig-nificant challenge for firms in economies outside the United States to engage ininnovative activities.1 Existing literature shows that firms’ obstacles to innovationare often formed internally according to the country’s culture and institutionalenvironments (e.g., Acharya and Subramanian (2009), Brown, Martinsson, and
*Luong, [email protected], Moshirian, [email protected], UNSW BusinessSchool, University of New South Wales; Nguyen, [email protected], La Trobe BusinessSchool, La Trobe University; Tian (corresponding author), [email protected], PBC Schoolof Finance, Tsinghua University; and Zhang, [email protected], UNSW Business School,University of New South Wales, and Shenzhen Finance Institute, School of Management and Eco-nomics, The Chinese University of Hong Kong, Shenzhen. We thank Jarrad Harford (the editor) andSara Holland (the referee) for their valuable comments and suggestions that have helped improveour article significantly. We are grateful for constructive comments from Rachita Gullapalli, MarcoPagano, Terry Walter, and participants at the 2015 Financial Management Association Annual Meet-ing, the 2014 Entrepreneurial Finance and Innovation Conference, and the 2013 Financial IntegrityResearch Network Research Topic Group Meeting in Corporate Finance. Tian acknowledges financialsupport from Tsinghua University Research Grant (Project No. 20151080451). All errors remain ourown.
1See Hsu, Tian, and Xu (2014) and Chang, McLean, Zhang, and Zhang (2015) for a stylizeddistribution of innovation output around the world.
1449
https://doi.org/10.1017/S0022109017000497D
ownloaded from
https://ww
w.cam
bridge.org/core . Tsinghua University , on 19 Jan 2018 at 02:45:22 , subject to the Cam
bridge Core terms of use, available at https://w
ww
.cambridge.org/core/term
s .

1450 Journal of Financial and Quantitative Analysis
Petersen (2013), Hsu et al. (2014), and Xie, Zhang, and Zhang (2016)).2 In thisstudy, we propose an external solution to overcome local firms’ innovation con-straints: foreign institutional investors. We investigate how foreign institutionalinvestors affect firm innovation in non-U.S. economies.
We hypothesize that foreign institutional investors are able to enhance firminnovation. This conjecture is motivated by Aghion, Van Reenen, and Zin-gales’s (2013) findings that institutional investors promote innovation in U.S.firms. Foreign institutional investors not only share common characteristics offinancial institutions but also possess unique features that are different from thoseof domestic institutional investors. Specifically, foreign institutions are creditedwith their independence from local management, with holding internationally di-versified portfolios, and with expertise in monitoring firms (e.g., Gillan and Starks(2003), Grinblatt and Keloharju (2000)). According to FactSet, foreign institu-tional ownership accounts for about 50% of total institutional ownership in non-U.S. firms, which is substantially different from that in the United States.3 As animportant force in non-U.S. economies, we expect that foreign institutions pro-mote firms’ innovation activities and strategies for at least three reasons.4
First, when the market cannot observe the full spectrum of managerial ac-tions, moral hazard could induce managers to shirk and avoid investment in riskyand costly innovative projects (Hart (1983), Bertrand and Mullainathan (2003)).Even worse, managers could divert firms’ resources for their own private bene-fit and retain less capital for investment in innovative projects. Throughout thiscorporate capital-allocation process, institutional investors can act as corporatemonitors and actively intervene to create firm value (e.g., Shleifer and Vishny(1986), Kahn and Winton (1998), Burkart, Gromb, and Panunzi (1997), and Gillanand Starks (2003)). Specifically, Gillan and Starks (2003) argue that becauseof their independent positions and a lack of conflicts of interest, foreign insti-tutional investors play a more important role in corporate governance than do-mestic peers. This statement is further supported by Aggarwal, Erel, Ferreira, andMatos’s (2011) finding that foreign institutional investors are proactively involvedin monitoring investee firms worldwide. Therefore, we expect that intensive
2According to Carayannis, Samara, and Bakouros ((2015), p. 73), “in only a few cases the basicbarriers are the scientific or technological problems. Usually, organizational, administrative, and insti-tutional problems get in the way.” Chen, Leung, and Evans (2016) find that a firm’s treatment of itsemployees affects innovation.
3The ownership structure of U.S. firms is different from that of non-U.S. firms in the sense thatforeign institutional ownership of U.S. firms accounts for just a negligible proportion of total eq-uity ownership. For example, according to FactSet, foreign institutional investors hold merely 1.8%,whereas domestic institutions own as much as 38.4% for an average U.S. firm during the 2000–2010period. To the best of our knowledge, the impact of institutional investors outside the United States,especially that of foreign institutions, on firm innovation is still largely unanswered in the literature.
4A famous recent anecdote supports the innovation-enhancing role of foreign institutional in-vestors. Alibaba, a Chinese e-commerce company, raised $25 billion on Sept. 19, 2014, which isthe world’s largest initial public offering (IPO). Alibaba is regarded as one of the most innovativecompanies in China. Before Alibaba’s IPO, it was financed by SoftBank (a Japanese investment com-pany) and Yahoo (a U.S. technology firm), which later became Alibaba’s largest and second largestshareholders, respectively. Due to Alibaba’s IPO success in the United States, a question is frequentlyraised by the Chinese public and regulators: Why are innovative Chinese firms typically financed byforeign institutions?
https://doi.org/10.1017/S0022109017000497D
ownloaded from
https://ww
w.cam
bridge.org/core . Tsinghua University , on 19 Jan 2018 at 02:45:22 , subject to the Cam
bridge Core terms of use, available at https://w
ww
.cambridge.org/core/term
s .

Luong, Moshirian, Nguyen, Tian, and Zhang 1451
monitoring by foreign institutions can induce managers to invest in long-term,value-enhancing innovative activities. We call this view the monitoring channel.
Second, optimal incentive contracts that motivate innovation should exhibitsubstantial tolerance for early failure and reward for long-term success (e.g.,Manso (2011), Ederer and Manso (2013)). Aghion et al. (2013) state that if incen-tive contracts cannot fully motivate innovation, institutional investors could stepin to alleviate managers’ career or reputational concerns by providing them withinsurance against early failures of their innovative activities. Compared with do-mestic peers, foreign institutional investors hold internationally diversified port-folios and thus should have a greater ability to tolerate the failure risk of invest-ing in innovative projects. Therefore, they are more likely to insulate managersfrom punishment for innovation failures. We expect that the tolerance for failureby foreign institutions would encourage firm innovation. We term this view theinsurance channel.
Third, investments in knowledge creation by one party create positive exter-nalities in innovation on the other parties (Jaffe, Trajtenberg, and Fogarty (2000)).5
Foreign institutions could facilitate knowledge spillovers through business net-works.6 For example, anecdotal evidence shows that foreign institutions can actas a bridge for networks of managers, investors, and other stakeholders of for-eign and domestic firms to exchange opportunities and knowledge.7 Moreover,given that foreign institutional investors promote cross-border mergers and acqui-sitions (Ferreira, Massa, and Matos (2010)), these cross-border investments couldfacilitate knowledge spillovers and further contribute to local firms’ innovation ac-tivities (e.g., Guadalupe, Kuzmina, and Thomas (2012)). Taken together, foreigninstitutions could enhance knowledge spillovers across countries by promotingbusiness networks and cross-border mergers and acquisitions, which could con-tribute to the success of innovation activities in investee firms. We call this viewthe knowledge-spillover channel.
We test our hypothesis using data from 26 non-U.S. economies for the2000–2010 period. The data are from a unique international database of firm-level patents and citations, the Derwent World Patents Index (DWPI) compiledby Thomson Reuters. The existing cross-country studies on innovation typicallyuse either research and development (R&D) expenditures from the Worldscopedatabase or the number of patents granted by the U.S. Patent and TrademarkOffice (USPTO) as innovation measures. These measures, however, have some
5There are a number of factors that affect knowledge spillovers, such as the mobility of highlyskilled human capital (Agrawal, Cockburn, and McHale (2006)), international trade and foreign directinvestment (Branstetter (2006)), and geographic location (Keller (2002)).
6Networks create value by synthesizing information and knowledge, exploiting expertise, andpooling resources across traditional boundaries to create new knowledge and achieve innovations out-side of the individual capabilities and resource bases of individual organizations (Johnson, Heimann,and O’Neill (2001), Pawar and Sharifi (2000), Prasad and Akhilesh (2002), Ratcheva and Vyakarnam(2001), and Trott (2008)).
7For example, the chief executive officer (CEO) of BlackRock, a leading U.S. investment man-agement company with investments in over 100 countries and offices in 30 countries, including India,offered to host a global investors meeting in India in early 2015.
https://doi.org/10.1017/S0022109017000497D
ownloaded from
https://ww
w.cam
bridge.org/core . Tsinghua University , on 19 Jan 2018 at 02:45:22 , subject to the Cam
bridge Core terms of use, available at https://w
ww
.cambridge.org/core/term
s .

1452 Journal of Financial and Quantitative Analysis
limitations.8 Our innovation measures based on patents granted by both domesticand foreign patent offices are complementary to the use of R&D investments inmeasuring innovative activities.
Our baseline results show a positive relation between foreign institutionalownership and firm innovation output, consistent with our hypothesis. Specifi-cally, an increase in foreign institutional ownership from the 25th percentile tothe 75th percentile is associated with a 5.6% increase in patent counts and a7.8% increase in patent citations in the following year. This result is economicallysignificant.
Although this evidence supports our hypothesis, an important concern is thatthe relation between foreign institutions and firm innovation could be endoge-nously determined. Specifically, the result could be biased by unobservable firmand country characteristics that are correlated with both foreign institutional own-ership and firm innovation (i.e., the omitted-variable concern) or by the possibil-ity that firms with greater innovation potential attract more foreign institutionalinvestors (i.e., the reverse-causality concern). As a result, a positive associationbetween foreign institutional ownership and firm innovation does not necessarilyimply that foreign institutions increase firm innovation. To address these endo-geneity concerns, we use 2 different identification strategies.
Our first identification strategy is to use a difference-in-differences (DID)approach that relies on plausibly exogenous variation in foreign institutional own-ership generated by a quasi-natural experiment: the passage of the U.S. Jobs andGrowth Tax Relief Reconciliation Act (JGTRRA) of 2003. JGTRRA was de-signed to lower dividend tax rates not only for U.S. firms but also for firms domi-ciled in foreign countries that have tax treaties with the United States. Dividend-paying stocks in treaty countries thus become more attractive to U.S. institutionalinvestors after the passage of JGTRRA. If U.S. institutions were to tilt their port-folio allocations to dividend-paying stocks in treaty countries following the pas-sage of JGTRRA, the event would create plausibly exogenous variation in U.S.foreign institutional ownership in non-U.S. firms. After undertaking a number ofdiagnostic tests to ensure the satisfaction of the parallel-trend assumption, the keyidentifying assumption of the DID approach, we find that firms with an increasein U.S. foreign institutional ownership generate a larger number of patents andcitations than those that do not experience an increase in U.S. foreign institutionalownership surrounding the enactment of JGTRRA.
Our second identification strategy is based on an instrumental variable (IV)approach. We follow Aggarwal et al. (2011) and use the time-varying membershipin the Morgan Stanley Capital International (MSCI) All Country World Index be-tween 2000 and 2010 as an IV for foreign institutional ownership. According toMSCI Inc., the MSCI is the industry’s accepted gauge of global stock market ac-tivity and is a commonly used benchmark index for foreign institutional investors.Ferreira and Matos (2008) and Leuz, Lins, and Warnock (2010) find that MSCImembership increases a firm’s probability of attracting foreign capital. More im-portantly, it is reasonable to believe that the inclusion of MSCI membership is less
8We discuss the limitations of existing innovation measures used in cross-country studies in greaterdetail in Section II.
https://doi.org/10.1017/S0022109017000497D
ownloaded from
https://ww
w.cam
bridge.org/core . Tsinghua University , on 19 Jan 2018 at 02:45:22 , subject to the Cam
bridge Core terms of use, available at https://w
ww
.cambridge.org/core/term
s .

Luong, Moshirian, Nguyen, Tian, and Zhang 1453
likely to depend on a firm’s innovation output. Our IV-approach analysis contin-ues to find a positive effect of foreign institutional ownership on firm innovation.
We next examine three plausible underlying economic mechanisms throughwhich foreign institutions enhance firm innovation. First, to test the monitoringchannel, we classify foreign institutional investors into independent and gray in-vestors, as well as long-term and short-term investors. Compared with gray (orshort-term) foreign institutions, independent (or long-term) foreign institutionsare regarded as active monitors that play a more important role in governingfirms (e.g., Chen, Harford, and Li (2007)). Consistent with our conjecture, we findthat only independent (or long-term) foreign institutions enhance firm innovation,whereas gray (or short-term) foreign institutions do not. Our evidence suggeststhat foreign institutional investors promote innovation through their active moni-toring of firms.
Second, we explore the insurance channel. We find that the sensitivity ofCEO turnover (or compensation) to performance is lower in firms with greaterforeign institutional ownership. According to Manso (2011), a high sensitivityof CEO turnover (or compensation) to performance is detrimental to motivatingfirm innovation because these incentive contracts are intolerant of failure. Thus,this finding suggests that by providing insurance (against failure risk) to man-agers with career and reputational concerns, foreign institutional investors allowmanagers to focus more on long-term, risky investment in innovative projects andhence positively contribute to their investee firms’ innovation output.
Finally, we examine the knowledge-spillover channel. To the extent that for-eign institutions could act as a bridge that facilitates knowledge spillovers fromtheir home countries to investee countries, we expect foreign institutions frommore innovative countries to play a greater role in promoting investee firms’ inno-vation than those from less innovative countries. Consistent with our hypothesis,we find that the positive effect of foreign institutional ownership on firm innova-tion is largely driven by institutions from foreign countries with a high innovationlevel.
Our article contributes to two strands of the literature. First, our article isrelated to the literature on the economic impacts of foreign institutions. Exist-ing evidence shows that foreign institutional ownership affects firm value andperformance (Ferreira and Matos (2008)), promotes improvements in governance(Aggarwal et al. (2011)), and facilitates the global convergence of financial report-ing practices (Fang, Maffett, and Zhang (2015)). In addition, foreign ownership,in the aftermath of financial liberalization, affects the cost of capital (Bekaert andHarvey (2000), Lau, Ng, and Zhang (2010)), real wages (Chari, Henry, and Sasson(2012)), consumption growth volatility (Bekaert, Harvey, and Lundblad (2006)),emerging equity market volatility (Bekaert and Harvey (1997)), and stock mar-ket liquidity (Ng, Wu, Yu, and Zhang (2016)). Our study documents the positiverole of foreign institutional ownership in promoting technological innovation. Ourevidence is consistent with the findings of the contemporaneous article by Bena,Ferreira, Matos, and Pires (2017). Using a set of metrics such as tangible assets,intangible assets, human capital, and innovation output, they show that foreign in-stitutional ownership fosters long-term investment. Our article differs from theirsby providing extensive evidence on firm innovation and by exploring possible
https://doi.org/10.1017/S0022109017000497D
ownloaded from
https://ww
w.cam
bridge.org/core . Tsinghua University , on 19 Jan 2018 at 02:45:22 , subject to the Cam
bridge Core terms of use, available at https://w
ww
.cambridge.org/core/term
s .

1454 Journal of Financial and Quantitative Analysis
underlying economic mechanisms through which foreign institutional investorsenhance innovation.
Second, our article contributes to the emerging literature on finance and in-novation by investigating an important driver of innovation outside the UnitedStates. There is a fast-growing body of literature that examines, both theoreti-cally and empirically, various ways to promote innovation. Manso (2011) showsthat managerial contracts that tolerate failure in the short run and reward suc-cess in the long run are best at motivating innovation. Empirical evidence showsthat laws (Acharya and Subramanian (2009), Acharya, Baghai, and Subramanian(2014)), financial market development (Hsu et al. (2014)), firm boundaries (Seru(2014)), stock liquidity (Fang, Tian, and Tice (2014)), market conditions (Nandaand Rhodes-Kropf (2013)), financial analysts (He and Tian (2013)), banking com-petition (Cornaggia, Mao, Tian, and Wolfe (2015)), labor unions (Bradley, Kim,and Tian (2017)), product market competition (Aghion, Bloom, Blundell, Griffith,and Howitt (2005)), and corporate venture-capital investors (Chemmanur, Lout-skina, and Tian (2014)) all alter agents’ incentives and affect innovation. However,there is little insight into the causal effect of foreign institutional investors. We fillin this gap by showing that foreign institutional investors are an important driverof firm innovation, particularly in less innovative economies.
Our study complements the work of Aghion et al. (2013). In their model,institutional investors are assumed to affect stock prices through either the threatof exit or voice. Using a sample of U.S. firms, Aghion et al. (2013) show thatinstitutional investors enhance firm innovation, which is consistent with the pre-dictions of their model. Because the key assumptions of Aghion et al.’s (2013)model apply to an international setting, we expect institutional investors to havethe same positive effect on firm innovation in non-U.S. countries.
Moreover, existing literature shows that compared with domestic institutions,foreign institutions are more likely to use their threat of exit and voice as disci-plinary mechanisms. For example, Ahmadjian and Robbins (2005) find that for-eign institutional investors in Japan use both exit and voice to send clear messagesto management about their interests. In more general studies, Gillan and Starks(2003) argue that, due to their independent positions and a lack of conflicts ofinterest, foreign institutions play a crucial role in promoting governance changesin local firms. Aggarwal et al. (2011) find that foreign institutional investors en-gage in monitoring investee firms worldwide, which results in higher operatingperformance and firm value.
Thus, in the spirit of Aghion et al. (2013), we argue that, through the monitor-ing channel as well as the insurance channel, foreign institutional investors wouldcontribute positively to firm innovation. Our study also explores a new underly-ing channel, unique to foreign institutions, that facilitates knowledge spilloversfrom more to less innovative countries. Taken together, our study complementsthe work of Aghion et al. (2013) by documenting the positive effect of foreigninstitutional ownership on firm innovation.
The article proceeds as follows: Section II describes the data and the variableconstruction. Section III presents our baseline results. Section IV addresses iden-tification issues. Section V explores plausible underlying mechanisms. Section VIconcludes.
https://doi.org/10.1017/S0022109017000497D
ownloaded from
https://ww
w.cam
bridge.org/core . Tsinghua University , on 19 Jan 2018 at 02:45:22 , subject to the Cam
bridge Core terms of use, available at https://w
ww
.cambridge.org/core/term
s .

Luong, Moshirian, Nguyen, Tian, and Zhang 1455
II. Data, Variable Construction, and Descriptive Statistics
A. DataOur sample includes publicly listed firms from 26 economies (excluding the
United States) for the 2000–2010 period. We construct firm-level patent and cita-tion variables based on the DWPI database compiled by Thomson Reuters. TheDWPI is a comprehensive collection of global patent information in English,translated from over 30 languages. For example, in 2013, the DWPI containedpatent data from 48 patenting authorities, covering 51 million patent documentsand 23 million patent families across all innovation technologies.
We obtain institutional ownership data from the FactSet database, a leadingsource of global institutional ownership information. For non-U.S. firms, FactSetcollects ownership data directly from sources such as national regulatory agencies,stock exchange announcements (e.g., the Regulatory News Service in the UnitedKingdom), local and offshore mutual funds, mutual fund industry directories (e.g.,European Fund Industry Directory), and company proxies and financial reports.Because the FactSet historical ownership data are available from 1999 only, oursample period starts in 2000 and ends in 2010. We obtain firm accounting datafrom the Worldscope database.
To combine innovation, ownership, and accounting information from variousdatabases, we match the DWPI’s standardized assignee names with the names ofpublic firms in Worldscope. We follow this procedure because the DWPI providesonly firm names, not stock identifiers. Following procedures specified on the Na-tional Bureau of Economic Research (NBER) patent database’s Web site, we startwith all DWPI patents, as well as the universe of firms from Worldscope that havefirm names and nonmissing Stock Exchange Daily Official List (SEDOL) codes(a SEDOL code is a 7-digit security identifier assigned by the London Stock Ex-change).9 We use both exact and fuzzy matching methods to match the DWPI’sassignee names with those from Worldscope. To eliminate any lingering doubtin the data-matching process, we manually search for information about samplefirms from different newswire services and Internet sources. In this process, werequire a firm to have valid innovation and accounting information to be includedin the sample. Finally, we require an economy to have at least 10 firms to be re-tained in the sample. Our final sample covers 4,249 unique non-U.S. firms from 26economies (with a total of 30,008 firm-year observations), of which 1,506 firmsare located in emerging economies and 2,743 firms in developed economies.
B. Variable Construction
1. Firm-Level Innovation Variables
Due to the lack of global patent data, prior studies either construct inno-vation measures based on R&D expenditures from Worldscope or use patentsapplied for through the USPTO as a proxy for a firm’s total innovation output(e.g., Hsu et al. (2014)). According to the National Research Council (2014),although R&D expenditures are an important input of the innovation process, they
9For detailed information about the NBER patent and citation data-cleaning and data-matchingprocedures, see https://sites.google.com/site/patentdataproject/Home/posts/namestandardizationroutinesuploaded.
https://doi.org/10.1017/S0022109017000497D
ownloaded from
https://ww
w.cam
bridge.org/core . Tsinghua University , on 19 Jan 2018 at 02:45:22 , subject to the Cam
bridge Core terms of use, available at https://w
ww
.cambridge.org/core/term
s .

1456 Journal of Financial and Quantitative Analysis
cannot adequately substitute for the innovation output. First, many firms do notreport R&D expenditures in their financial statements due to differences in ac-counting standards among countries. However, missing R&D information doesnot necessarily mean that firms are not involved in innovative activities (Koh andReeb (2015)).
Second, not all R&D investments lead to patent granting because only suc-cessful or significant innovation is patentable. According to the World IntellectualProperty Organization (WIPO), “the invention must consist of patentable sub-ject matter, the invention must be industrially applicable (useful), it must be new(novel), it must exhibit a sufficient ‘inventive step’ (be nonobvious), and the dis-closure of the invention in the patent application must meet certain standards”((2004), p. 17). Our use of patents as a measure of innovation output or success-ful patent applications captures an important dimension of innovation and thus iscomplementary to the use of R&D investments in measuring innovative activities.
Third, many non-U.S. firms may not apply for patents to the USPTO, whichresults in an underestimation of innovation output using only U.S. patents as aproxy for non-U.S. firms’ total innovation output.10 Comparing the USPTO withthe DWPI, we find that the latter compiles more patents than the former, espe-cially for innovative economies. For example, in Japan, there are a total of 212,034(285,283) patents filed by Japanese firms in the USPTO (DWPI), which suggeststhat about 25% of Japanese patents in the DWPI are not covered in the USPTO.Regarding Germany, there are a total of 29,484 (35,528) patents from the USPTO(DWPI), which suggests that about 17% of awarded patents of German firms cov-ered in the DWPI are not from the USPTO. We observe similar patterns in othereconomies, such as Korea and Taiwan.11 The DWPI database contains informationon all patents applied for through patent offices around the world. Therefore, weare able to construct more accurate measures for non-U.S. firm innovation usingthis database. From the DWPI database, we obtain information on patent assigneenames, application numbers, application dates, application countries, the numberof future citations received by each patent, patent grant dates, and grant countries.
We construct two measures to capture firm innovation. The first one isa firm’s total number of patent applications that are eventually granted in agiven year; this measure captures a firm’s innovation quantity. We use a patent’sapplication year instead of its grant year because the former is superior whencapturing the actual time of innovation (Griliches, Pakes, and Hall (1988)). Toaccount for the fact that a patent can be assigned to multiple assignees in theDWPI database, we scale a patent by the number of assignees that own the patent,
10There are two plausible reasons why many non-U.S. firms do not apply for patents through theUSPTO. First, these non-U.S. firms may not do business in the United States. According to the U.S.patent law, patents filed to the USPTO are protected in the United States but not in other countries.As a result, firms that do not do business in the United States and hence do not need their intellectualproperty to be protected in the United States do not apply for patents through the USPTO. Second,“home bias” in patenting due to patent policy familiarity and geographical distance could be anotherreason. Chang et al. (2015) find that about 39.1% of the patents owned by firms are awarded within afirm’s home country and that 76.3% of non-U.S. patents are filed in patent offices outside the UnitedStates.
11Of course, for studies focusing on U.S. firms, the USPTO database has its own compara-tive advantage because its patenting policy and patent application and granting procedures are allstandardized.
https://doi.org/10.1017/S0022109017000497D
ownloaded from
https://ww
w.cam
bridge.org/core . Tsinghua University , on 19 Jan 2018 at 02:45:22 , subject to the Cam
bridge Core terms of use, available at https://w
ww
.cambridge.org/core/term
s .

Luong, Moshirian, Nguyen, Tian, and Zhang 1457
assuming equal patent ownership. Because a patent may belong to more than onetechnology group, we further scale this measure by the mean number of patent ap-plications filed in a year for technology groups to which the patent belongs. TheDWPI database classifies all patents into 3 broad categories (chemical, engineer-ing, and electronic and electrical engineering), which are further divided into 20broad subject areas (see Appendix A for details). We use these 20 patent groupsto normalize our first innovation measure.
The second measure is the total number of citations received by each patentin subsequent years, scaled by the average citation count received by each patentfor the technology group of patents to which the patent of interest belongs. Thismeasure is better for assessing the quality of a patent because it captures the eco-nomic value of innovation by distinguishing breakthrough innovation from incre-mental discoveries.
We address several concerns regarding the innovation variables calculatedbased on the DWPI data set. The first one is the truncation problem caused by thefact that patents appear in the database only after they are granted. Because thelag between a patent’s application year and its grant year is significant (about 2years on average), many patent applications were still under review and had notbeen granted by 2015 (when we retrieved the data). To adjust the truncation biasin patent counts, we end our study period in 2010, which allows 5 more years forpatents under review to be granted. Another truncation problem is related to patentcitations. Patents keep receiving citations over a long period (e.g., 60 years), butwe observe citations received only up to 2015. Following Hall, Jaffe, and Tra-jtenberg (2001), we address the truncation bias in citation counts by scaling thenumber of citation counts by the mean citation counts of the patent in the technol-ogy groups to which the patent belongs.
Second, we avoid the double-counting problem, that is, a firm may submitpatent applications to and be granted patents by more than one patenting authoritybased on the same invention. The DWPI database allows us to retrieve patents thatare based on the same invention and are granted by all patenting authorities. Forthe same invention’s patents, we keep the record of the earliest grant date andcount the number of unique patents.
The third issue is the right skewness of the distribution of patent grants andfuture citations in our sample with its median at 0. This observation is similarto what has been documented in the innovation literature (e.g., Acharya et al.(2014), Seru (2014), and Tian and Wang (2014)). To address the right skewnessof patent and citation count distributions, we winsorize these two variables atthe 99th percentile and then use the natural logarithms of patents and citationsas our main innovation measures. To avoid losing firm-year observations with 0patents or citations, we add 1 to the actual patent values before taking the naturallogarithm.
2. Institutional Ownership
Following the literature on institutional investors (e.g., Gompers and Metrick(2001), Aggarwal et al. (2011)), we use institutional ownership at the latest reportdate of a calendar year and construct ownership variables as follows. Foreign in-stitutional ownership (FIO) is the sum of shares held by all institutions domiciled
https://doi.org/10.1017/S0022109017000497D
ownloaded from
https://ww
w.cam
bridge.org/core . Tsinghua University , on 19 Jan 2018 at 02:45:22 , subject to the Cam
bridge Core terms of use, available at https://w
ww
.cambridge.org/core/term
s .

1458 Journal of Financial and Quantitative Analysis
in a different country from where the firm’s stock is listed, as a percentage of thefirm’s total number of shares outstanding. We set FIO to 0 if a stock is not heldby any foreign institution. Similarly, domestic institutional ownership (DIO) isthe sum of shares held by all institutions domiciled in the same country as the onewhere the firm’s stock is listed, as a percentage of the firm’s total number of sharesoutstanding. We set DIO to 0 if a stock is not held by any domestic institution.
3. Control Variables
Following the literature on innovation, we control for a full set of firm andcountry characteristics that can affect a firm’s innovation output. At the firm level,we use firm size (ln(SALE)), firm age (ln(AGE)), investments in intangible assets(RD), capital expenditures (CAPEX), asset tangibility (PPE), leverage (LEV),profitability (ROA), financial constraints (the Kaplan and Zingales (KZ) (1997)index), and growth opportunities (TOBINS Q). We also include industry concen-tration (the Herfindahl index (HHI) and the squared Herfindahl index (HHI2)) tomitigate the nonlinear effects of product market competition on innovation out-put (Aghion et al. (2005)). In addition, we add the percentage of foreign sales intotal sales (FSALE) as a firm-level control variable because MacGarvie (2006)suggests that a firm’s innovation may be related to its export and import markets.Last, we also control for insider ownership (INSIDE) because managers may havestronger incentives and greater power to pursue innovative projects when insiderownership increases. We winsorize all firm-level variables at the 1st and 99th per-centiles to eliminate the effects of outliers.
At the country level, we adopt several controls drawn from the literature thatmay be related to firm innovation. Specifically, we follow Aghion, Howitt, andPrantl (2015) to control for the patent regulatory environment by using the patentright protection index of Park (2008) (P INDEX). We also use 2 dimensions ofworldwide governance indicators, namely, the rule of law (RULE) and the gov-ernment effectiveness (GOODGOV) constructed by Kaufmann, Kraay, and Mas-truzzi (2011), as additional controls for country-level institutions. Because Hsuet al. (2014) find that financial development is related to innovation, we control forequity market development, using the ratio of a country’s stock market capitaliza-tion to its gross domestic product (GDP) (EQUITY) and its credit market devel-opment, which is the ratio of a country’s domestic credit to its GDP (CREDIT).Finally, we follow Acharya and Subramanian (2009) to control for a country’sGDP per capita (ln(GDP)) and its levels of exports (EXPORT) and imports(IMPORT), defined as the ratios of exports and imports to its GDP, respectively.Appendix B provides detailed variable definitions.
C. Summary StatisticsTable 1 presents sample statistics. Panel A of Table 1 reports the means of
innovation measures and institutional ownership by economy. PATENT refers tothe total number of patent applications that are filed by a firm and are eventu-ally granted in a year. CITEPAT is the total number of citations received by eachpatent. Of all the economies in the sample, Japan has the largest number of firms(1,309), followed by Taiwan (594), Korea (591), and Canada (246). An averagefirm in the entire sample has about 16 patents granted per year and about 27citations received by its patents. Firms in Japan have the largest number of
https://doi.org/10.1017/S0022109017000497D
ownloaded from
https://ww
w.cam
bridge.org/core . Tsinghua University , on 19 Jan 2018 at 02:45:22 , subject to the Cam
bridge Core terms of use, available at https://w
ww
.cambridge.org/core/term
s .

Luong, Moshirian, Nguyen, Tian, and Zhang 1459
patents per year (25), followed by firms in Germany (21), Korea (18), theNetherlands (15), Taiwan (12), and Switzerland (12). The pattern is broadly sim-ilar for citations. On average, a firm in a developed economy has a larger numberof both patents and citations (17 and 28, respectively) than one in an emergingeconomy (12 and 25, respectively). For institutional ownership, an average firmin a developed economy has an FIO that is just about the same as the DIO (5.1%and 5.0%, respectively), whereas the FIO of an average firm in an emerging econ-omy is substantially higher than its DIO (3.6% vs. 0.7%); for the entire sample,FIO is generally greater than DIO.
Panel B of Table 1 presents the summary statistics of firm and country char-acteristics. On average, a firm has a book value of assets of $315.7 million, a ratioof R&D to assets of 3.2%, a ratio of capital expenditures to assets of 5.5%, a ratioof PPE to assets of 28.6%, a leverage ratio of 21.3%, an ROA of 7.4%, and a TO-BINS Q of 1.57. The average length of time that a firm has been listed on a stockexchange is 14.5 years.
TABLE 1Summary of Firm Innovation and Institutional Ownership
Table 1 reports the sample statistics for the 2000–2010 period. Panel A reports the means of innovation and institutionalownership sample data by country. Type of Market reports whether the economies are developed (DEV) or emerging(EMG) economies. No. of Firms is the number of firms in each sample country. No. of Firm-Years is the number of firm-year observations. PATENT is the total number of patent applications filed by each firm in each year. CITEPAT is thetotal number of citations received by each firm’s patents in each year. FIO and DIO are foreign institutional ownershipand domestic institutional ownership, respectively. Panel B contains the summary statistics of firm- and country-levelvariables. Details of variable definitions are in Appendix B.
Panel A. Firm Innovation and Institutional Ownership by Country
InstitutionalInnovation Ownership
Type of No. of No. ofCountry Market Firms Firm-Years PATENT CITEPAT FIO DIO
Australia DEV 120 730 0.886 2.697 4.220 1.347Austria DEV 29 205 1.676 2.710 9.125 1.860Belgium DEV 23 173 11.327 27.638 11.038 3.310Brazil EMG 46 313 1.324 2.782 7.972 0.373Canada DEV 246 1,579 1.954 4.272 9.589 13.996Denmark DEV 19 231 6.547 31.353 7.932 10.826Finland DEV 49 399 2.033 7.638 11.406 8.998France DEV 215 1,466 9.194 13.053 6.903 4.539Germany DEV 243 1,716 20.704 32.997 7.743 4.719Greece EMG 14 66 0.242 0.098 1.834 0.570Hong Kong DEV 13 101 0.426 0.391 7.399 1.205India EMG 183 1,080 3.422 12.637 3.713 3.114Israel EMG 62 343 1.708 4.123 18.997 1.029Italy DEV 66 461 3.059 4.542 7.566 2.605Japan DEV 1,309 11,209 25.451 40.599 2.747 2.369Korea EMG 591 3,173 18.452 33.157 3.479 0.107Netherlands DEV 20 160 14.721 21.250 18.668 4.631New Zealand DEV 12 74 1.027 0.930 1.155 0.524Norway DEV 47 267 2.404 4.506 8.722 10.223Singapore DEV 36 291 1.218 1.594 5.460 1.083South Africa EMG 16 120 0.267 0.193 8.429 4.197Spain DEV 23 191 0.803 0.508 6.796 4.687Sweden DEV 85 596 4.552 7.485 6.856 12.721Switzerland DEV 40 323 12.251 29.860 9.891 6.039Taiwan EMG 594 3,700 12.319 26.095 2.306 0.287United Kingdom DEV 148 1,041 2.772 6.727 4.596 19.056
Developed DEV 2,743 21,213 16.841 27.514 5.052 5.036Emerging EMG 1,506 8,795 12.379 24.755 3.834 0.656All economies ALL 4,249 30,008 15.533 26.705 4.695 3.753
(continued on next page)
https://doi.org/10.1017/S0022109017000497D
ownloaded from
https://ww
w.cam
bridge.org/core . Tsinghua University , on 19 Jan 2018 at 02:45:22 , subject to the Cam
bridge Core terms of use, available at https://w
ww
.cambridge.org/core/term
s .

1460 Journal of Financial and Quantitative Analysis
TABLE 1 (continued)Summary of Firm Innovation and Institutional Ownership
Panel B. Summary Statistics
No. of No. ofVariables Firms Firm-Years Mean Std. Dev. P25 Median P75
Innovation VariablesPATENT 4,249 30,008 15.533 61.319 0.000 0.000 3.000CITEPAT 4,249 30,008 26.705 106.483 0.000 0.000 3.460ln(PATENT) 4,249 30,008 0.904 1.427 0.000 0.000 1.386ln(CITEPAT) 4,249 30,008 0.957 1.670 0.000 0.000 1.495
Ownership VariablesFIO 4,249 30,008 4.695 8.779 0.000 0.937 5.585FIOUS 4,249 30,008 2.380 6.245 0.000 0.269 1.949FIONONUS 4,249 30,008 2.316 4.418 0.000 0.247 2.840FIOLONG_TERM 4,249 30,008 4.561 8.583 0.000 0.835 5.388FIOSHORT_TERM 4,249 30,008 0.135 0.850 0.000 0.000 0.028FIOINDEPENDENT 4,249 30,008 4.443 8.456 0.000 0.852 5.203FIOGRAY 4,249 30,008 0.252 0.657 0.000 0.000 0.153FIOHIGH_PATENT_GDP 4,249 30,008 3.980 7.971 0.000 0.674 4.458FIOLOW_PATENT_GDP 4,249 30,008 0.715 1.681 0.000 0.000 0.636FIOHIGH_PATENT_POP 4,249 30,008 4.403 8.442 0.000 0.826 5.128FIOLOW_PATENT_POP 4,249 30,008 0.292 0.952 0.000 0.000 0.080FIOHIGH_PATENT_FIRMS 4,249 30,008 4.166 8.225 0.000 0.711 4.711FIOLOW_PATENT_FIRMS 4,249 30,008 0.530 1.514 0.000 0.000 0.300FIOHIGH_PATENT_MCAP 4,249 30,008 2.710 6.519 0.000 0.341 2.447FIOLOW_PATENT_MCAP 4,249 30,008 1.985 3.881 0.000 0.182 2.418DIO 4,249 30,008 3.753 7.254 0.000 0.577 4.347
Control Variablesln(TA) 4,249 30,008 5.755 1.984 4.393 5.555 6.968AGE 4,249 30,008 14.528 10.634 6.000 12.000 20.000ln(SALE) 4,249 30,008 5.587 2.172 4.257 5.518 6.963FSALE 4,249 30,008 0.212 0.355 0.000 0.000 0.373INSIDE 4,249 30,008 0.273 0.260 0.000 0.244 0.467HHI 4,249 30,008 0.252 0.259 0.072 0.145 0.338HHI2 4,249 30,008 0.130 0.246 0.005 0.021 0.114RD 4,249 30,008 0.032 0.067 0.000 0.008 0.033CAPEX 4,249 30,008 0.055 0.052 0.019 0.040 0.072PPE 4,249 30,008 0.286 0.181 0.142 0.271 0.405LEV 4,249 30,008 0.213 0.180 0.053 0.190 0.328ROA 4,249 30,008 0.074 0.119 0.044 0.089 0.137TOBINS_Q 4,249 30,008 1.570 1.392 0.922 1.151 1.636KZ 4,249 30,008 −7.351 23.848 −4.828 −1.069 0.647P_INDEX 4,249 30,008 4.370 0.451 4.170 4.670 4.670GOODGOV 4,249 30,008 1.338 0.470 1.120 1.420 1.620RULE 4,249 30,008 1.227 0.438 0.970 1.290 1.550EXPORT 4,249 30,008 0.324 0.265 0.143 0.263 0.421IMPORT 4,249 30,008 0.300 0.238 0.129 0.278 0.371EQUITY 4,249 30,008 0.896 0.446 0.613 0.790 1.085CREDIT 4,249 30,008 1.372 1.368 0.000 1.255 3.020ln(GDP) 4,249 30,008 10.207 0.502 10.248 10.320 10.376
III. Baseline Regression ResultsTo examine the relation between foreign institutional ownership and firm in-
novation, we estimate various forms of the following model using pooled ordinaryleast squares (OLS) regressions:
INNOVATIONi j t = α+β1FIOi j t−1+β2DIOi j t−1+ γ′
X i j t−1(1)+φi +ψk +ω j +ϕt + εi j t ,
where i ,k, j , and t refer to firm, industry, country, and year, respectively. Thedependent variable (INNOVATION) captures firm innovation outcomes: The nat-ural logarithm of 1 plus the number of patents (ln(PATENT)) reflects inno-vation quantity; the natural logarithm of 1 plus the number of citations perpatent (ln(CITEPAT)) captures innovation quality. We measure both foreign and
https://doi.org/10.1017/S0022109017000497D
ownloaded from
https://ww
w.cam
bridge.org/core . Tsinghua University , on 19 Jan 2018 at 02:45:22 , subject to the Cam
bridge Core terms of use, available at https://w
ww
.cambridge.org/core/term
s .

Luong, Moshirian, Nguyen, Tian, and Zhang 1461
domestic institutional ownership in year t−1. X denotes a vector of firm andcountry characteristics, as discussed in Section II.B.3, which are measured in yeart−1. We include year fixed effects (ϕ) and firm fixed effects (φ) (or industry fixedeffects (ψ) and country fixed effects (ω)) in various specifications. In all regres-sions, we report in parentheses robust standard errors clustered at the firm level.
Columns 1 and 2 of Table 2 report the results from pooled OLS regressionscontrolling for industry, country, and year fixed effects. The coefficient estimateson FIO are positive and significant at the 1% level across all specifications, sug-gesting a positive relation between foreign institutional ownership and innovationoutput. In terms of economic significance, a coefficient estimate of 0.010 (0.014)in model 1 (model 2) suggests that an increase in foreign institutional ownershipfrom the 25th percentile to the 75th percentile of its distribution is associated witha 5.6% (7.8%) increase in the number of patents (citations per patent) in the fol-lowing year.12 This result is economically significant.
Although the pooled OLS regression results show a positive association be-tween foreign institutional ownership and firm innovation, one concern is thatthese results could be driven by omitted variables. To alleviate this concern, weinclude firm fixed effects (and drop industry and country fixed effects because theydo not vary within a firm) in the regressions and report the results in columns 3 and4 of Table 2. Firm fixed effects absorb time-invariant unobservable firm charac-teristics that affect both foreign institutional ownership and firm innovation. Onceagain, we find that the coefficient estimates on FIO remain positive and signifi-cant at the 1% level in all specifications. The magnitudes of the FIO coefficientestimates become slightly smaller in columns 3 and 4 but are still comparable tothose in columns 1 and 2. This evidence suggests that our baseline finding is notdriven by time-invariant, unobservable firm characteristics.
Regarding firm-level control variables, the coefficient estimates on DIO arenot uniformly significant across different model specifications, suggesting thatthere is no clear evidence for the effect of domestic institutional investors onfirm innovation in non-U.S economies. One possible explanation for this resultis that domestic institutional investors in non-U.S. economies may not satisfy themodel assumptions of Aghion et al. (2013); that is, they are weak at monitoringmanagers and do not effectively provide managers with insurance against failure.This argument is generally supported by the existing literature.13
12This way of quantifying the size of the effect of foreign institutional ownership is consistent withseveral studies on institutional ownership, such as those by Chung and Zhang (2011) and Wahal andMcConnell (2000).
13For example, Douma, George, and Kabir (2006) document that domestic institutional investorsin India are predominantly government owned, which significantly reduces their monitoring incentivesdue to several problems; for example, the government’s nominees on the board are typically bureau-crats with minimal expertise in corporate matters. Similarly, Ahmadjian and Robbins (2005) documentthat Japanese institutional investors are less likely to exercise exit or voice because, as compared withforeign investors, they have very different interests and relationships with the companies whose sharesthey hold. Trust banks, usually close affiliates of commercial banks, are unlikely to do anything to un-dermine the banks’ interests. Pension funds are hesitant to make demands on suppliers or customers.Life insurance companies, among the largest shareholders in the Japanese economy, tend to makemoney by selling insurance to employees of corporations in which they have ownership stakes. Banksare also unlikely to promote restructuring actively.
https://doi.org/10.1017/S0022109017000497D
ownloaded from
https://ww
w.cam
bridge.org/core . Tsinghua University , on 19 Jan 2018 at 02:45:22 , subject to the Cam
bridge Core terms of use, available at https://w
ww
.cambridge.org/core/term
s .

1462 Journal of Financial and Quantitative Analysis
TABLE 2Baseline Regressions
Table 2 reports the regressions of firm innovation on institutional ownership. Columns 1 and 2 (3 and 4) show the pooledordinary least squares (OLS) (Firm fixed effects) regression results. The dependent variable is shown as the columnheading in columns 1–4. The main independent variable is foreign institutional ownership (FIO). All explanatory variablesare lagged by 1 year. Variable definitions are in Appendix B. Standard errors are clustered at the firm level and reportedin parentheses. *, **, and *** indicate significance at the 10%, 5%, and 1% levels, respectively.
ln(PATENT) ln(CITEPAT) ln(PATENT) ln(CITEPAT)
Variables 1 2 3 4
FIO 0.010*** 0.014*** 0.008*** 0.011***(0.003) (0.004) (0.003) (0.004)
DIO −0.010*** −0.012*** −0.001 −0.001(0.002) (0.003) (0.001) (0.002)
INSIDE −0.072 −0.054 0.062* 0.084*(0.063) (0.070) (0.032) (0.044)
ln(AGE) 0.062** 0.062* 0.086** 0.118**(0.029) (0.032) (0.037) (0.049)
HHI 0.396 0.400 −0.170 0.152(0.292) (0.326) (0.274) (0.347)
HHI2 −0.277 −0.280 0.152 0.050(0.277) (0.307) (0.241) (0.290)
RD 2.267*** 2.637*** 0.054 −0.232(0.238) (0.288) (0.132) (0.215)
CAPEX 2.313*** 2.913*** 0.378*** 0.519***(0.269) (0.308) (0.134) (0.184)
PPE −0.232** −0.192 −0.082 −0.095(0.116) (0.129) (0.086) (0.114)
LEV −0.365*** −0.453*** −0.132** −0.185***(0.097) (0.104) (0.057) (0.070)
ROA −0.616*** −0.850*** −0.037 −0.169(0.144) (0.165) (0.079) (0.108)
FSALE 0.138** 0.169* 0.000 −0.009(0.067) (0.088) (0.020) (0.018)
ln(SALE) 0.276*** 0.317*** 0.110*** 0.115***(0.016) (0.018) (0.015) (0.020)
TOBINS_Q 0.071*** 0.099*** 0.005 0.001(0.011) (0.014) (0.005) (0.008)
KZ −0.002*** −0.003*** −0.001*** −0.001***(0.001) (0.001) (0.000) (0.000)
P_INDEX 0.115** 0.186*** 0.116*** 0.150**(0.047) (0.064) (0.045) (0.062)
RULE 0.098 0.051 −0.033 −0.081(0.080) (0.100) (0.071) (0.093)
GOODGOV 0.128** 0.116* 0.131*** 0.131**(0.053) (0.066) (0.049) (0.062)
EXPORT 0.283 0.096 −0.027 −0.117(0.409) (0.498) (0.383) (0.465)
IMPORT 0.886** 0.555 0.793* 0.483(0.440) (0.549) (0.406) (0.517)
EQUITY 0.078** 0.012 0.089*** 0.067*(0.031) (0.039) (0.028) (0.036)
CREDIT −0.017 −0.048*** 0.014 −0.005(0.014) (0.017) (0.011) (0.015)
ln(GDP) 0.233*** 0.155* 0.151** 0.105(0.073) (0.090) (0.066) (0.086)
Year fixed effects Yes Yes Yes YesFirm fixed effects No No Yes YesIndustry fixed effects Yes Yes No NoCountry fixed effects Yes Yes No No
Adj. R 2 0.246 0.238 0.851 0.766No. of obs. 30,008 30,008 30,008 30,008
https://doi.org/10.1017/S0022109017000497D
ownloaded from
https://ww
w.cam
bridge.org/core . Tsinghua University , on 19 Jan 2018 at 02:45:22 , subject to the Cam
bridge Core terms of use, available at https://w
ww
.cambridge.org/core/term
s .

Luong, Moshirian, Nguyen, Tian, and Zhang 1463
For other firm-level control variables, the coefficient estimates on INSIDEare positive and significant in firm fixed effects regressions, which suggests thatinsider ownership is positively associated with firm innovation. Larger and olderfirms are associated with higher innovation output. Firms with higher capital ex-penditures have more innovation output. Firms with higher leverage are associatedwith lower innovation output. Financial constraints are negatively related to inno-vation output. All these results are consistent with earlier work (e.g., see Hall andLerner (2010) for a survey).
As for country-level control variables, firms in countries with stronger patentregulatory environments are associated with higher innovation output. Similarly,firms located in countries with a higher government effectiveness index or withdeveloped stock markets have higher innovation output. We find weaker evidencefor the effect of exports and imports and GDP per capita on firm innovation.
We conduct a few robustness checks. First, because Japanese and Taiwanesefirms are much larger in the number of firms than the rest of our sample firms, weexclude firms in these two economies from the regressions. We continue to find apositive relation between foreign institutional ownership and firm innovation. Wenext use a dummy variable to capture large foreign institutional ownership, whichequals 1 if foreign institutional ownership is greater than 5%, and 0 otherwise. Wefind that foreign institutional investors holding more than 5% of equity ownershipin a firm are positively related to firm innovation. We report these results in TablesA1 and A2 in the Internet Appendix (available at www.jfqa.org).
Overall, our baseline regression results suggest a positive relation betweenforeign institutional ownership and firm innovation, consistent with our hypothe-sis that foreign institutional ownership enhances firm innovation.
IV. Identification AttemptsOur evidence so far suggests a positive relation between foreign institutional
ownership and firm innovation. Although our results are robust to the inclusion offirm fixed effects that absorb time-invariant unobservables, the finding may stillbe subject to endogeneity concerns because time-varying, unobservable firm char-acteristics omitted from the regression could bias the inference. Reverse causal-ity is another concern. It is possible that firms with high innovation potentialattract foreign institutional investors. Hence, the direction of causality goes frominnovation to foreign institutional ownership. In this section, we attempt to ad-dress these identification concerns by using 2 identification strategies: a DIDapproach and an instrumental variable approach.
A. Difference-in-Differences ApproachOur first identification strategy is to exploit a quasi-natural experiment that
generates plausibly exogenous variation in foreign institutional ownership: thepassage of JGTRRA of 2003. JGTRRA substantially lowered dividend tax rates(from 38.6% to 15%) not just for U.S. firms but also for firms domiciled in coun-tries that have tax treaties with the United States. Dividends from firms in non-treaty countries, however, remain taxable at the ordinary personal income taxrate after the passage of JGTRRA (e.g., 35% for the top income tax bracket).Therefore, nontreaty economies, which include Brazil, Hong Kong, Singapore,
https://doi.org/10.1017/S0022109017000497D
ownloaded from
https://ww
w.cam
bridge.org/core . Tsinghua University , on 19 Jan 2018 at 02:45:22 , subject to the Cam
bridge Core terms of use, available at https://w
ww
.cambridge.org/core/term
s .

1464 Journal of Financial and Quantitative Analysis
and Taiwan, do not receive this favorable tax treatment.14 We then use a DID ap-proach that compares the innovation output of treatment firms with that of controlfirms before and after the passage of JGTRRA that causes an exogenous shock toforeign institutional ownership.
The passage of JGTRRA appears to be a good candidate for a quasi-naturalexperiment that generates plausibly exogenous variation in foreign institutionalownership for non-U.S. firms in our sample. Because JGTRRA was designedto lower dividend tax rates for both U.S. firms and firms domiciled in foreigncountries that have tax treaties with the United States, it is unlikely to be de-signed to directly affect the innovation output of non-U.S. firms. Regarding thereverse-causality concern, we do not expect the change in future innovation to af-fect the change in foreign institutional ownership brought about by the passage ofJGTRRA. We use the DID approach to compare the innovation output of the treat-ment and control firms 3 years before (2000–2002) and 3 years after (2004–2006)the passage of JGTRRA.
To select treatment firms, we first require that these firms are domiciled intax treaty countries and pay dividends in the year prior to the passage of JGTRRAof 2002. This filter leaves us with 1,693 treatment firms. To select control firms,we require firms to be domiciled in nontreaty countries and also pay dividends inthe year prior to the passage of JGTRRA. We end up with 228 control firms. Wethen match each control firm with 5 treatment firms using the nearest neighborpropensity score matching algorithm. Specifically, we estimate a probit modelfor observations in the year immediately preceding the passage of JGTRRA. Thedependent variable equals 1 for firm-year observations of the treatment group,and 0 for those of the control group. The probit regression has the same set ofindependent variables as the control variables in the baseline OLS regressions,which include firm- and country-level time-varying controls as well as industryfixed effects.
In addition, because JGTRRA directly affects U.S. institutional investors,we divide foreign institutional ownership into U.S. foreign institutional own-ership (FIOUS) and non-U.S. foreign institutional ownership (FIONONUS). Weinclude 2 innovation growth variables (i.e., the growth in the number ofpatents, GROWTHPATENT, and the growth in the number of citations per patent,GROWTHCITEPAT), both computed over the 3-year period before the passage ofJGTRRA, in the regressions to ensure the satisfaction of the parallel-trend as-sumption, which is a key identifying assumption of the DID approach.15 We endup with 456 unique treatment firms and 228 unique control firms.16
14The list of nontreaty economies also includes Argentina, Chile, Colombia, Jordan, Malaysia,Peru, and Sri Lanka.
15This assumption states that in the absence of treatment (the passage of JGTRRA in our setting),the observed DID estimator is 0. The parallel-trend assumption does not require the level of innovationvariables to be the same between the treatment and the control firms over the 2 periods before and afterthe passage of JGTRRA because these distinctions are differenced out in the estimation. Instead, thisassumption requires similar pre-JGTRRA trends in innovation variables for both the treatment and thecontrol groups.
16Because we require treatment and control firms to pay dividends, the DID sample is differentfrom our baseline sample. To check whether our baseline results continue to hold in this DID sample,we reestimate the baseline regressions in this sample and find a positive effect of foreign institutionalownership on firm innovation. We report the results in Panel A of Table A3 in the Internet Appendix.
https://doi.org/10.1017/S0022109017000497D
ownloaded from
https://ww
w.cam
bridge.org/core . Tsinghua University , on 19 Jan 2018 at 02:45:22 , subject to the Cam
bridge Core terms of use, available at https://w
ww
.cambridge.org/core/term
s .

Luong, Moshirian, Nguyen, Tian, and Zhang 1465
Because the validity of the DID depends on the parallel-trend assumption,we perform 3 diagnostic tests to verify that this assumption is not violated. Inthe first diagnostic test, we report, in Panel A of Table 3, the univariate compar-isons between the pre-JGTRRA innovation growth variables of treatment firmsand those of control firms and their corresponding t-statistics. Pre-JGTRRA inno-vation growth variables are not significantly different between treatment and con-trol firms. These results suggest that there is no observable pre-JGTRRA trend ininnovation outcomes between the two groups of firms, suggesting the satisfactionof the parallel-trend assumption.
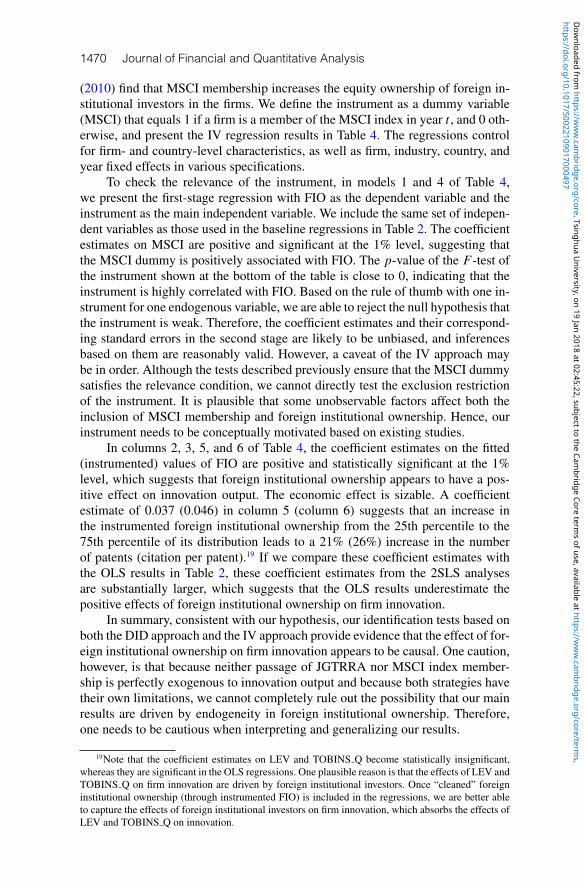
In the second diagnostic test, we plot the average logarithm of the number ofpatents (citations per patent) for treatment and control firms over a 7-year periodaround the passage of JGTRRA in Graph A (B) of Figure 1. As one can observe,the two lines trend closely in parallel in the years leading up to the passage ofJGTRRA, which suggests the satisfaction of the parallel-trend assumption. In ad-dition, after the passage of JGTRRA, the line representing treatment firms beginsto trend upward across the line representing control firms, suggesting that treat-ment firms experience an increase in innovation output.
In the third test, we reestimate the probit model, restricted to the matchedsample, and find that the coefficient estimates of the pre-JGTRRA innovationgrowth variables (GROWTHPATENT and GROWTHCITEPAT) are not statistically sig-nificant. We report this test in Table A4 of the Internet Appendix. Overall, thesediagnostic tests suggest that the propensity-score-matching process reasonably re-moves meaningful observable differences in the covariates between treatment andcontrol firms.
TABLE 3Difference-in-Differences Analysis
Table 3 reports the diagnostics and results of the difference-in-differences (DID) tests on how a plausibly exogenousshock to foreign institutional ownership due to the passage of the Jobs andGrowth Tax Relief Reconciliation Act (JGTRRA)in 2003 affects firm innovation. Treatment firms must pay dividends in the year before the tax cut (2002) and be domiciledin treaty countries. Control firms must be domiciled in nontreaty countries and pay dividends in the year before thetax cut (2002). Each control firm is then matched to 5 treatment firms using the nearest-neighbor propensity-score-matching procedure, on a vector of firm- and country-level characteristics as in the baseline regression, and innovationgrowth variables (GROWTHPATENT and GROWTHCITEPAT) over 3 years before the tax cut. Panel A reports the univariatecomparison between innovation growth variables of treatment firms and those of control firms and their correspondingt -statistics. Panel B reports the univariate DID estimators, with standard errors displayed in parentheses. Panel C reportsthe multivariate DID test results, with standard errors adjusted for firm-level clustering displayed in parentheses. *, **,and *** indicate significance at the 10%, 5%, and 1% levels, respectively.
Panel A. Differences in Innovation Growth Variables
Variables Treatment Control Differences t -Statistics
GROWTHPATENT 0.468 0.391 0.077 1.56GROWTHCITEPAT 0.363 0.301 0.062 1.15
Panel B. Difference-in-Differences Test
Treatment Control Treatment − Control t -StatisticsAfter − Before After − Before DID Estimator for DID
Variables 1 2 3 4
ln(PATENT) 0.178 0.079 0.099** 2.215(0.047) (0.035)
ln(CITEPAT) 0.205 0.082 0.123*** 2.849(0.054) (0.033)
(continued on next page)
https://doi.org/10.1017/S0022109017000497D
ownloaded from
https://ww
w.cam
bridge.org/core . Tsinghua University , on 19 Jan 2018 at 02:45:22 , subject to the Cam
bridge Core terms of use, available at https://w
ww
.cambridge.org/core/term
s .

1466 Journal of Financial and Quantitative Analysis
TABLE 3 (continued)Difference-in-Differences Analysis
Panel C. Multivariate Difference-in-Differences Test
FIOUS ln(PATENT) ln(CITEPAT)
Variables 1 2 3 4 5 6
TREAT × POST 1.501*** 1.089*** 0.109*** 0.091*** 0.121*** 0.115***(0.076) (0.079) (0.020) (0.022) (0.029) (0.033)
FIONONUS 0.091*** 0.017** 0.021*(0.022) (0.007) (0.011)
DIO 0.018** −0.002 −0.009(0.009) (0.005) (0.008)
INSIDE 0.194 0.094 0.077(0.181) (0.092) (0.123)
ln(AGE) −0.058 0.338*** 0.243**(0.152) (0.071) (0.108)
HHI 1.250 1.013* 0.753(1.286) (0.586) (0.883)
HHI2 −1.229 −0.751 −0.591(1.240) (0.512) (0.837)
RD −0.648 0.621 0.002(1.527) (0.851) (1.164)
CAPEX 0.487 0.261 0.135(0.673) (0.303) (0.483)
PPE 0.915* 0.280 0.090(0.469) (0.195) (0.301)
LEV 0.077 −0.240 −0.277(0.362) (0.174) (0.254)
ROA −0.695 −0.767*** −0.504(0.578) (0.292) (0.393)
FSALE −0.161 0.098 −0.139(0.247) (0.101) (0.166)
ln(SALE) 0.578*** 0.111*** 0.137***(0.113) (0.037) (0.042)
TOBINS_Q 0.055 −0.040** −0.066**(0.038) (0.018) (0.029)
KZ 0.003 −0.002* −0.002*(0.002) (0.001) (0.001)
P_INDEX 0.049 0.246*** 0.386***(0.187) (0.071) (0.136)
RULE −0.392 −0.212 0.031(0.323) (0.137) (0.197)
GOODGOV 0.884*** 0.144 0.159(0.267) (0.107) (0.165)
EXPORT 6.209*** 0.143 −2.502**(2.032) (0.738) (1.072)
IMPORT −6.101*** −0.454 3.039**(2.213) (0.916) (1.355)
EQUITY 0.162 0.194** 0.350***(0.218) (0.086) (0.136)
CREDIT 0.114 −0.016 −0.024(0.071) (0.032) (0.045)
ln(GDP) 0.570 0.293* 0.002(0.360) (0.153) (0.246)
Year fixed effects Yes Yes Yes Yes Yes YesFirm fixed effects Yes Yes Yes Yes Yes Yes
Adj. R 2 0.821 0.839 0.844 0.867 0.800 0.826No. of obs. 4,788 4,788 4,788 4,788 4,788 4,788
https://doi.org/10.1017/S0022109017000497D
ownloaded from
https://ww
w.cam
bridge.org/core . Tsinghua University , on 19 Jan 2018 at 02:45:22 , subject to the Cam
bridge Core terms of use, available at https://w
ww
.cambridge.org/core/term
s .

Luong, Moshirian, Nguyen, Tian, and Zhang 1467
FIGURE 1Innovation Output of Treatment and Control Firms Surrounding JGTRRA
Figure 1 shows the average innovation output of the treatment and control firms from 3 years before to 3 years after thepassage of the Jobs and Growth Tax Relief Reconciliation Act (JGTRRA) in 2003. The event year is denoted as year 0(2003). The sample contains 456 unique treatment firms and 228 unique control firms. Graph A reports the mean naturallogarithm of the total number of patents (ln(PATENT)), and Graph B reports the mean natural logarithm of the total numberof citations per patent (ln(CITEPAT)).
Graph A. ln(PATENT)
0.5
0.6
0.7
0.8
0.9
1.0
1.1
ln(P
ATE
NT)
Control Firms
Treatment Firms
Graph B. ln(CITEPAT)
0.5
0.6
0.7
0.8
0.9
1.0
1.1
–3 –2 –1 0 1 2 3
ln(C
ITE
PA
T)
Year
–3 –2 –1 0 1 2 3
Year
Control Firms
Treatment Firms
Panel B of Table 3 presents the results of the univariate DID test. We computeDID estimators for innovation variables by first subtracting the average numberof patents (citations) over the 3-year period preceding the passage of JGTRRAfrom the average number of patents (citations) over the 3-year period after thepassage of JGTRRA for each treatment and control firm. We then average thedifference over the 2 groups and report the results in columns 1 and 2, respectively.In columns 3 and 4, we report the DID estimates and the corresponding t-statisticswith the null hypothesis that the DID estimates are 0, respectively.
The results in columns 3 and 4 of Panel B show that the DID estimators arepositive and significant at the 1% level, suggesting that the increase in innovationoutput is significantly larger for the treatment group than for the control group
https://doi.org/10.1017/S0022109017000497D
ownloaded from
https://ww
w.cam
bridge.org/core . Tsinghua University , on 19 Jan 2018 at 02:45:22 , subject to the Cam
bridge Core terms of use, available at https://w
ww
.cambridge.org/core/term
s .

1468 Journal of Financial and Quantitative Analysis
during the period from 3 years before to 3 years after the passage of JGTRRA.The magnitudes of the DID estimates are economically significant as well. For ex-ample, the DID estimate on ln(PATENT) is 0.099, suggesting that treatment firmsexperience an increase of 11% in ln(PATENT) relative to the mean ln(PATENT)of control firms (0.853) surrounding the passage of JGTRRA. Similarly, the DIDestimator for ln(CITEPAT) is 0.123, indicating that treatment firms experiencean increase of 14% in ln(CITEPAT) relative to the mean ln(CITEPAT) of controlfirms (0.850) surrounding the passage of JGTRRA.
Next, we perform the DID tests in a multivariate regression framework byestimating the following model:
INNOVATIONi t
(FIOUSi t
)= α+βTREATi ×POSTt(2)
+γ′
X i t−1+φi +ϕt + εi t ,
where the dependent variable INNOVATION captures firm innovation outcomes:the natural logarithm of 1 plus the number of patents (ln(PATENT)); the nat-ural logarithm of 1 plus the number of citations received by each patent(ln(CITEPAT)). The dependent variable FIOUS captures U.S. foreign institutionalownership. TREAT is a dummy variable that equals 1 for treatment firms, and 0for control firms. POST is a dummy variable that equals 1 if the fiscal year is after2003, and 0 otherwise. X consists of non-U.S. foreign institutional ownership anda vector of firm- and country-level control variables used in equation (1). φi and ϕt
represent firm fixed effects and year fixed effects, respectively.17 The coefficientestimate on TREAT × POST is the DID estimator that captures the causal effectof U.S. foreign institutional ownership on firm innovation.18
Panel C of Table 3 reports the regression results estimating equation (2) withstandard errors clustered at the firm level. In models 1 and 2, where the dependentvariables are FIOUS, the coefficient estimates on TREAT× POST are positive andstatistically significant, which suggests that treatment firms, on average, experi-ence an increase in U.S. foreign institutional ownership following the passage ofJGTRRA. For example, a coefficient estimate of 1.501 in model 1 suggests thatU.S. foreign institutional ownership in treatment firms is 1.5% higher than thatin control firms subsequent to the passage of JGTRRA. In models 3–6, where thedependent variables are ln(PATENT) or ln(CITEPAT), the coefficient estimates onTREAT×POST are positive and significant at the 1% level, which suggests thattreatment firms, on average, experience a larger increase in innovation output thancontrol firms following the passage of JGTRRA. A coefficient estimate of 0.091(0.115) in model 4 (model 6) suggests that, compared with the control group, thetreatment group experiences an increase of 9.1% (11.5%) in the number of patents(the number of citations per patent).
To ensure that our DID test results are robust, we conduct a few more tests.First, because it is plausible that firms anticipate the passage of JGTRRA, ourselection of treatment and control firms that pay dividends 1 year in advance ofthe event could still be subject to potential endogeneity. To address this concern,
17TREAT and POST are absorbed by firm fixed effects and year fixed effects.18When we run a similar regression with FIONONUS being the dependent variable, we find that the
coefficient estimate on TREAT × POST is not significant. We report the results in Panel B of TableA3 in the Internet Appendix.
https://doi.org/10.1017/S0022109017000497D
ownloaded from
https://ww
w.cam
bridge.org/core . Tsinghua University , on 19 Jan 2018 at 02:45:22 , subject to the Cam
bridge Core terms of use, available at https://w
ww
.cambridge.org/core/term
s .

Luong, Moshirian, Nguyen, Tian, and Zhang 1469
we require that treatment and control firms pay dividends 2 years, as compared to1 year, prior to the passage of JGTRRA (i.e., starting from 2001) and repeat theDID analysis. Our DID results do not change qualitatively. We report these resultsin Table A5 in the Internet Appendix.
Second, if the passage of JGTRRA affects U.S. foreign institutional own-ership of dividend-paying stocks in treaty countries, then this event should notaffect the U.S. institutional ownership of non-dividend-paying stocks in thesetreaty countries. As a result, the innovation output of non-dividend-paying stocksin treaty countries should not differ significantly from that of non-dividend-payingstocks in nontreaty countries surrounding the event. We thus conduct one placebotest by selecting treatment and control firms that do not pay dividends in 2002 andperform a similar DID analysis. We find that the DID estimators are statisticallyinsignificant, which suggests that the event does not have a significant effect onthe innovation output of non-dividend-paying stocks in both treaty and nontreatycountries. This placebo test indicates that our main DID test results are unlikelyto be driven by chance.
Third, we argue that if JGTRRA affects U.S. institutional investors, thereshould be no significant difference in the innovation output between dividend-paying firms that do not have U.S. foreign institutional ownership in treaty coun-tries and those in nontreaty countries. We thus conduct a second placebo test byselecting treatment and control firms that have zero U.S. institutional ownershipin 2002. We find insignificant DID estimators, which supports our conjecture. Wereport the results of the two placebo tests in Table A6 in the Internet Appendix.
B. Instrumental Variable ApproachThe use of the passage of JGTRRA in the DID approach is not com-
pletely free of concerns. For example, even though Desai and Dharmapala (2011)find that following the passage of JGTRRA, U.S. institutions tilt their portfolioallocations to dividend-paying equities in treaty countries, Ammer, Holland,Smith, and Warnock (2012) document that this finding becomes weaker after con-trolling for international cross-listing. It is plausible that the passage of JGTRRAreduces the cost of equity capital for innovative firms and incentivizes these firmsto finance future projects through cross-listing in the United States. As a result,the passage of JGTRRA could lead to more innovation and U.S. institutionalownership.
To further ensure that the documented results are likely to be causal, oursecond identification strategy is to construct an instrumental variable and use the2-stage least squares (2SLS) approach. An ideal instrument should capture thevariation in foreign institutional ownership that is exogenous to a firm’s innovationoutput. Because the exclusion restriction of an instrument is inherently untestable,the instrument needs to be conceptually motivated.
We follow Aggarwal et al. (2011) and use the time-varying membership inthe MSCI All Country World Index to create a possible exogenous variation inforeign institutional ownership. The MSCI is a market capitalization–weightedindex adjusted for free float that is designed to measure global equity marketperformance. Launched in 1987, this index consists of 45 indices (24 developed-country and 21 emerging-country indices), with coverage of about 85% of theglobal investable equity opportunity set. Ferreira and Matos (2008) and Leuz et al.
https://doi.org/10.1017/S0022109017000497D
ownloaded from
https://ww
w.cam
bridge.org/core . Tsinghua University , on 19 Jan 2018 at 02:45:22 , subject to the Cam
bridge Core terms of use, available at https://w
ww
.cambridge.org/core/term
s .
1470 Journal of Financial and Quantitative Analysis
(2010) find that MSCI membership increases the equity ownership of foreign in-stitutional investors in the firms. We define the instrument as a dummy variable(MSCI) that equals 1 if a firm is a member of the MSCI index in year t , and 0 oth-erwise, and present the IV regression results in Table 4. The regressions controlfor firm- and country-level characteristics, as well as firm, industry, country, andyear fixed effects in various specifications.
To check the relevance of the instrument, in models 1 and 4 of Table 4,we present the first-stage regression with FIO as the dependent variable and theinstrument as the main independent variable. We include the same set of indepen-dent variables as those used in the baseline regressions in Table 2. The coefficientestimates on MSCI are positive and significant at the 1% level, suggesting thatthe MSCI dummy is positively associated with FIO. The p-value of the F-test ofthe instrument shown at the bottom of the table is close to 0, indicating that theinstrument is highly correlated with FIO. Based on the rule of thumb with one in-strument for one endogenous variable, we are able to reject the null hypothesis thatthe instrument is weak. Therefore, the coefficient estimates and their correspond-ing standard errors in the second stage are likely to be unbiased, and inferencesbased on them are reasonably valid. However, a caveat of the IV approach maybe in order. Although the tests described previously ensure that the MSCI dummysatisfies the relevance condition, we cannot directly test the exclusion restrictionof the instrument. It is plausible that some unobservable factors affect both theinclusion of MSCI membership and foreign institutional ownership. Hence, ourinstrument needs to be conceptually motivated based on existing studies.
In columns 2, 3, 5, and 6 of Table 4, the coefficient estimates on the fitted(instrumented) values of FIO are positive and statistically significant at the 1%level, which suggests that foreign institutional ownership appears to have a pos-itive effect on innovation output. The economic effect is sizable. A coefficientestimate of 0.037 (0.046) in column 5 (column 6) suggests that an increase inthe instrumented foreign institutional ownership from the 25th percentile to the75th percentile of its distribution leads to a 21% (26%) increase in the numberof patents (citation per patent).19 If we compare these coefficient estimates withthe OLS results in Table 2, these coefficient estimates from the 2SLS analysesare substantially larger, which suggests that the OLS results underestimate thepositive effects of foreign institutional ownership on firm innovation.
In summary, consistent with our hypothesis, our identification tests based onboth the DID approach and the IV approach provide evidence that the effect of for-eign institutional ownership on firm innovation appears to be causal. One caution,however, is that because neither passage of JGTRRA nor MSCI index member-ship is perfectly exogenous to innovation output and because both strategies havetheir own limitations, we cannot completely rule out the possibility that our mainresults are driven by endogeneity in foreign institutional ownership. Therefore,one needs to be cautious when interpreting and generalizing our results.
19Note that the coefficient estimates on LEV and TOBINS Q become statistically insignificant,whereas they are significant in the OLS regressions. One plausible reason is that the effects of LEV andTOBINS Q on firm innovation are driven by foreign institutional investors. Once “cleaned” foreigninstitutional ownership (through instrumented FIO) is included in the regressions, we are better ableto capture the effects of foreign institutional investors on firm innovation, which absorbs the effects ofLEV and TOBINS Q on innovation.
https://doi.org/10.1017/S0022109017000497D
ownloaded from
https://ww
w.cam
bridge.org/core . Tsinghua University , on 19 Jan 2018 at 02:45:22 , subject to the Cam
bridge Core terms of use, available at https://w
ww
.cambridge.org/core/term
s .

Luong, Moshirian, Nguyen, Tian, and Zhang 1471
TABLE 4Instrumental Variable Approach
Table 4 presents the 2-stage least squares (2SLS) regressions of firm innovation on foreign institutional ownership. Theinstrumental variable for foreign institutional ownership (MSCI) is the time-varying membership in the Morgan StanleyCapital International (MSCI) All Country World Index. All explanatory variables are lagged by 1 year and defined as inAppendix B. Standard errors are clustered at the firm level and reported in parentheses. *, **, and *** indicate significanceat the 10%, 5%, and 1% levels, respectively.
1SLS 2SLS 1SLS 2SLS
FIO ln(PATENT) ln(CITEPAT) FIO ln(PATENT) ln(CITEPAT)
Variables 1 2 3 4 5 6
MSCI 4.331*** 2.141***(0.314) (0.130)
FIOPREDICTED 0.076*** 0.084*** 0.037*** 0.046***(0.022) (0.024) (0.009) (0.013)
DIO 0.107*** −0.019*** −0.025*** 0.016*** −0.001 −0.001(0.023) (0.005) (0.005) (0.005) (0.001) (0.002)
INSIDE −4.275*** 0.570*** 0.667*** −2.125*** 0.096** 0.159***(0.354) (0.127) (0.142) (0.188) (0.047) (0.057)
ln(AGE) −0.452*** 0.097*** 0.102** −0.709*** 0.110*** 0.135***(0.149) (0.036) (0.040) (0.165) (0.023) (0.033)
HHI 0.099 0.270 0.258 2.112* −0.258 0.084(1.438) (0.350) (0.391) (1.157) (0.162) (0.229)
HHI2 0.198 −0.257 −0.257 −1.588 0.213 0.097(1.479) (0.334) (0.372) (1.023) (0.143) (0.202)
RD 3.233* 1.819*** 2.137*** −2.139** 0.149 −0.160(1.927) (0.353) (0.403) (0.873) (0.123) (0.174)
CAPEX 3.861*** 1.708*** 2.238*** 2.414*** 0.274** 0.443***(1.408) (0.345) (0.390) (0.739) (0.105) (0.149)
PPE 0.781 −0.332** −0.304* 0.353 −0.090 −0.101(0.710) (0.151) (0.168) (0.454) (0.063) (0.089)
LEV −4.076*** −0.191 −0.170 −2.264*** −0.033 −0.110*(0.495) (0.150) (0.164) (0.185) (0.047) (0.067)
ROA 0.438 −0.467** −0.683*** −1.180** 0.016 −0.129(0.904) (0.181) (0.206) (0.475) (0.067) (0.095)
FSALE 2.674** −0.223* −0.236* 0.193* −0.009 −0.016(1.047) (0.118) (0.121) (0.115) (0.016) (0.023)
ln(SALE) 1.402*** 0.037*** 0.049*** 1.318*** 0.050*** 0.070***(0.092) (0.012) (0.016) (0.044) (0.016) (0.023)
TOBINS_Q 0.576*** 0.022 0.005 0.211*** 0.007 0.009(0.078) (0.021) (0.024) (0.031) (0.005) (0.007)
KZ −0.009*** −0.002** −0.002* −0.005*** −0.001** −0.001***(0.004) (0.001) (0.001) (0.001) (0.000) (0.000)
P_INDEX 0.378 0.160** 0.237*** 0.291** 0.121*** 0.156***(0.329) (0.063) (0.079) (0.136) (0.031) (0.044)
RULE 0.492 0.026 0.029 −0.083 −0.015 −0.068(0.660) (0.118) (0.139) (0.241) (0.055) (0.078)
GOODGOV −2.315*** 0.431*** 0.456*** −0.306* 0.194*** 0.182***(0.471) (0.096) (0.111) (0.161) (0.039) (0.055)
EXPORT 7.363* −0.732 −1.038 5.806*** −0.504 −0.489(4.132) (0.710) (0.820) (1.244) (0.391) (0.425)
IMPORT −8.516** 2.047*** 1.854** −6.556*** 1.419*** 0.972**(4.206) (0.732) (0.853) (1.403) (0.345) (0.488)
EQUITY −0.281 0.115** 0.053 −0.138 0.098*** 0.074**(0.370) (0.058) (0.068) (0.172) (0.024) (0.034)
CREDIT −0.308*** 0.019 −0.007 −0.390*** 0.031*** 0.008(0.098) (0.020) (0.023) (0.074) (0.011) (0.015)
ln(GDP) 1.091** 0.128 0.036 0.892** 0.105** 0.117*(0.530) (0.101) (0.122) (0.305) (0.043) (0.060)
Year fixed effects Yes Yes Yes Yes Yes YesFirm fixed effects No No No Yes Yes YesIndustry fixed effects Yes Yes Yes No No NoCountry fixed effects Yes Yes Yes No No No
F -test (p-value) <0.001 <0.001R2 0.391 0.213 0.155 0.138 0.065 0.053No. of obs. 30,008 30,008 30,008 30,008 30,008 30,008
https://doi.org/10.1017/S0022109017000497D
ownloaded from
https://ww
w.cam
bridge.org/core . Tsinghua University , on 19 Jan 2018 at 02:45:22 , subject to the Cam
bridge Core terms of use, available at https://w
ww
.cambridge.org/core/term
s .

1472 Journal of Financial and Quantitative Analysis
V. Possible Economic MechanismsIn this section, we explore three possible underlying economic mechanisms
through which foreign institutional investors promote firm innovation. Althoughwe attempt to identify different economic mechanisms that underlie the positiveeffect of foreign institutional ownership on innovation, we acknowledge that theseunderlying mechanisms are not necessarily mutually exclusive and, if anything,may jointly contribute to the positive effect of foreign institutions on innovation.
A. MonitoringDue to agency problems caused by the separation of ownership and control,
a potential moral-hazard problem emerges in which firm managers overinvestin routine tasks that are less challenging to enjoy private benefits (Hart (1983),Bertrand and Mullainathan (2003)). The theory of Stein (1988) shows that man-agers could underinvest in innovative projects because of their high-risk natureand inability to generate predictable returns in the short run.
Monitoring by institutional investors is thus an important governance mech-anism to mitigate managerial myopia. Compared with small investors who arerelatively less informed, institutional investors are better able to provide effec-tive and active monitoring due to their large ownership stakes in firms, as wellas their ability to exploit the economy of scale in information production andprocessing (e.g., Shleifer and Vishny (1986), Grossman and Hart (1988), andGillan and Starks (2000), (2003)). However, not all institutions are actively en-gaged in monitoring. For instance, Bushee (1998) finds that institutional investorswith short-term investments induce managerial myopia, whereas institutions withlong-term investments reduce managers’ myopic behavior. Chen et al. (2007)show that long-term institutions focus more on monitoring and influencing effortsthan on trading. They also find that independent institutions are more inclined togather information and get actively involved in the corporate decisions of firms inwhich they invest, whereas gray institutions are more likely to hold shares withoutintervening in firms’ business.20
We thus postulate that if monitoring by foreign institutional investors con-tributes to increases in firm innovation, then those foreign institutions that havestrong incentives to monitor, that is, independent or long-term foreign institutions,should play a more significant role in promoting firm innovation. As such, weseparate foreign institutional ownership into 2 components: ownership by inde-pendent (or long-term) foreign institutional investors and by gray (or short-term)foreign institutional investors. We then examine the effects of these types of for-eign institutions on firm innovation.
Similar to our main analysis, we use OLS regressions with firm fixed effectsand the DID analysis to test our conjecture. We present the results in Table 5.In Panel A, we reestimate the baseline OLS regressions but distinguish betweenindependent and gray institutions, as well as long-term and short-term institu-tions. Columns 1 and 3 focus on 2 key independent variables: the percentage ofshares held by independent institutions (FIOINDEPENDENT), such as mutual funds
20Chen et al. (2007) define mutual fund managers and investment advisors as “independent” insti-tutions and bank trusts, insurance companies, pension funds, and endowments as “gray” institutions.
https://doi.org/10.1017/S0022109017000497D
ownloaded from
https://ww
w.cam
bridge.org/core . Tsinghua University , on 19 Jan 2018 at 02:45:22 , subject to the Cam
bridge Core terms of use, available at https://w
ww
.cambridge.org/core/term
s .

Luong, Moshirian, Nguyen, Tian, and Zhang 1473
TABLE 5Economic Mechanisms: Monitoring
Table 5 presents the results on how the monitoring channel explains the effect of foreign institutional ownership on firminnovation. Panel A presents the regressions with firm fixed effects. Foreign institutional ownership is classified into inde-pendent and gray foreign institutional ownership (models 1 and 3) or into long-term and short-term foreign institutionalownership (models 2 and 4). All explanatory variables are lagged by 1 year and defined as in Appendix B. Standarderrors are clustered at the firm level and reported in parentheses. Panel B reports the DID estimates. *, **, and *** indicatesignificance at the 10%, 5%, and 1% levels, respectively.
Panel A. Firm Fixed Effects
ln(PATENT) ln(CITEPAT)
X = INDEPENDENT X = LONG_TERM X = INDEPENDENT X = LONG_TERM
Variables 1 2 3 4
FIOX 0.008** 0.008*** 0.011*** 0.011***(0.003) (0.003) (0.004) (0.004)
FIOEXCLUDING_X −0.004 0.005 0.002 0.000(0.012) (0.004) (0.015) (0.008)
DIO −0.001 −0.001 −0.000 −0.001(0.001) (0.001) (0.002) (0.002)
INSIDE 0.062* 0.062* 0.084* 0.084*(0.032) (0.032) (0.044) (0.044)
ln(AGE) 0.085** 0.087** 0.117** 0.118**(0.037) (0.037) (0.048) (0.049)
HHI −0.168 −0.171 0.153 0.152(0.274) (0.274) (0.347) (0.347)
HHI2 0.150 0.152 0.048 0.049(0.241) (0.241) (0.290) (0.290)
RD 0.054 0.056 −0.231 −0.233(0.132) (0.132) (0.215) (0.215)
CAPEX 0.379*** 0.375*** 0.519*** 0.519***(0.134) (0.134) (0.184) (0.184)
PPE −0.082 −0.083 −0.095 −0.096(0.086) (0.086) (0.114) (0.114)
LEV −0.134** −0.131** −0.185*** −0.185***(0.057) (0.057) (0.070) (0.071)
ROA −0.038 −0.035 −0.170 −0.168(0.079) (0.079) (0.109) (0.109)
FSALE 0.000 0.000 −0.009 −0.009(0.020) (0.020) (0.018) (0.018)
ln(SALE) 0.111*** 0.109*** 0.115*** 0.115***(0.015) (0.015) (0.020) (0.020)
TOBINS_Q 0.005 0.005 0.001 0.001(0.005) (0.005) (0.008) (0.008)
KZ −0.001*** −0.001*** −0.001*** −0.001***(0.000) (0.000) (0.000) (0.000)
P_INDEX 0.116*** 0.116*** 0.150** 0.150**(0.045) (0.045) (0.062) (0.062)
RULE −0.032 −0.033 −0.081 −0.081(0.071) (0.071) (0.093) (0.093)
GOODGOV 0.130*** 0.132*** 0.131** 0.131**(0.049) (0.049) (0.062) (0.062)
EXPORT −0.019 −0.030 −0.119 −0.118(0.382) (0.383) (0.464) (0.465)
IMPORT 0.786* 0.794* 0.485 0.482(0.405) (0.406) (0.517) (0.517)
EQUITY 0.089*** 0.089*** 0.067* 0.067*(0.028) (0.028) (0.036) (0.036)
CREDIT 0.014 0.014 −0.005 −0.006(0.011) (0.011) (0.015) (0.015)
ln(GDP) 0.150** 0.152** 0.103 0.104(0.066) (0.066) (0.086) (0.086)
Year fixed effects Yes Yes Yes YesFirm fixed effects Yes Yes Yes Yes
Adj. R2 0.872 0.872 0.799 0.799No. of obs. 30,008 30,008 30,008 30,008
(continued on next page)
https://doi.org/10.1017/S0022109017000497D
ownloaded from
https://ww
w.cam
bridge.org/core . Tsinghua University , on 19 Jan 2018 at 02:45:22 , subject to the Cam
bridge Core terms of use, available at https://w
ww
.cambridge.org/core/term
s .

1474 Journal of Financial and Quantitative Analysis
TABLE 5 (continued)Economic Mechanisms: Monitoring
Panel B. Difference-in-Differences Test
Treatment Control Treatment −Group Group Control t -Statistics for
After − Before After − Before DID Estimator DID Estimator
Variables 1 2 3 4
Independent Institutionsln(PATENT) 0.175 0.079 0.096*** 2.567
(0.039) (0.035)
ln(CITEPAT) 0.202 0.082 0.120** 2.165(0.050) (0.033)
Gray Institutionsln(PATENT) 0.160 0.079 0.081 1.610
(0.045) (0.035)
ln(CITEPAT) 0.161 0.082 0.079* 1.733(0.085) (0.033)
Long-Term Institutionsln(PATENT) 0.204 0.079 0.125*** 3.149
(0.044) (0.035)
ln(CITEPAT) 0.233 0.082 0.151*** 3.246(0.041) (0.033)
Short-Term Institutionsln(PATENT) 0.154 0.079 0.075 1.451
(0.075) (0.035)
ln(CITEPAT) 0.165 0.082 0.083 1.521(0.084) (0.033)
and investment advisors, and the percentage of shares held by gray institutions(FIOGRAY), such as bank trusts, insurance companies, and other institutions. Thecoefficient estimates on FIOINDEPENDENT are positive and significant at the 1% or5% level in these models. However, the coefficient estimates on FIOGRAY are sta-tistically insignificant. These results imply that the positive effect of foreign insti-tutional investors on firm innovation is largely driven by independent institutions,which are more actively engaged in monitoring.
In columns 2 and 4 of Panel A of Table 5, we classify foreign institutionsinto long-term and short-term institutional investors based on investment horizonand rerun the regressions by focusing on 2 independent variables, FIOLONG TERM
(the percentage of shares held by foreign institutions for more than 1 year) andFIOSHORT TERM (the percentage of shares held by foreign institutions for less than 1year). The coefficient estimates on FIOLONG TERM are positive and significant at the1% level in both models, whereas the coefficient estimates on FIOSHORT TERM areinsignificant. This evidence suggests that the positive effect of foreign institutionalownership on firm innovation is mainly driven by long-term foreign institutionalinvestors.
In addition to these firm fixed effects regressions, we conduct the DID testin Panel B of Table 5. We perform the DID analysis for different types of institu-tions using the same procedures discussed in Section IV.A. When undertaking thepropensity-score-matching algorithm, we use the same set of matching variablesas before except that the equity ownership of U.S. foreign institutions (FIOUS) isreplaced with the equity ownership of a certain type of U.S. foreign institution(independent, gray, long-term, or short-term U.S. foreign institutions). Using thismatching procedure, we assume that the treatment group experiences, to some
https://doi.org/10.1017/S0022109017000497D
ownloaded from
https://ww
w.cam
bridge.org/core . Tsinghua University , on 19 Jan 2018 at 02:45:22 , subject to the Cam
bridge Core terms of use, available at https://w
ww
.cambridge.org/core/term
s .

Luong, Moshirian, Nguyen, Tian, and Zhang 1475
extent, exogenous changes in equity ownership for each type of U.S. foreigninstitution following the passage of JGTRRA.
After conducting the matching procedure for each type of U.S. foreign insti-tution, we compute the DID estimators for innovation variables in the same way asin Section IV.A. We find that the DID estimates for independent or long-term U.S.foreign institutions are positive and significant at the 1% or 5% levels, whereasthe DID estimates for gray or short-term U.S. foreign institutions are largely in-significant. These results once again suggest that the positive effect of foreigninstitutional ownership on firm innovation is primarily driven by independent orlong-term foreign institutions.
Overall, this subsection shows that independent or long-term foreign institu-tional investors who actively monitor firms play a crucial role in motivating inno-vation. This evidence suggests that intensive monitoring by foreign institutionalinvestors appears to be a possible underlying mechanism through which foreigninstitutional investors enhance firm innovation.
B. InsuranceEconomics and psychology literature on motivating innovation has shown
that although the standard pay-for-performance incentive scheme has positiveeffects on motivating effort in routine tasks, it may actually undermine perfor-mance in tasks that require creativity and exploration (Glucksberg (1962), Manso(2011)). Incentive schemes that motivate innovation must exhibit substantial tol-erance for failure, implying that compensation schemes that are less sensitive toperformance can, to some extent, be better motivators of innovation (Holmstrom(1989), Ederer and Manso (2013)).
Aghion et al. (2013) find that managerial turnover in U.S. firms is less sensi-tive to firm performance in the presence of institutional investors, consistent withthe argument that institutional investors provide partial insurance to managerswith career or reputational concerns against failure risks arising from their in-tensive innovation activities. In an experimental study, Ederer and Manso (2013)show that a manager’s incentive to innovate is undermined by the threat of con-tractual termination. Based on these studies, we argue that if foreign institutionalinvestors promote innovation by insulating managers from punishment for inno-vation failures, CEO turnover and compensation should be less sensitive to per-formance in the presence of foreign institutional investors.
To test this conjecture, we collect CEO turnover data from the BoardExdatabase and match them with our sample firms for the period from 2000 to 2010.We are able to match 167 CEO turnover events in our sample firms and end upwith 755 firm-year observations in the matched sample. Similarly, we collect CEOcompensation data from BoardEx and match them with our sample firms. The re-sulting matched sample contains 785 firm-year observations.
To test the effect of foreign institutional ownership on the CEO turnover–performance sensitivity, we follow Aghion et al. (2013) and estimate the followinglinear probability model:
CEO TURNi t = α+β11ROAi t−1+β2FIOi t−1×1ROAi t−1(3)+β3DIOi t−1×1ROAi t−1+β4FIOi t−1+β5DIOi t−1
+β6ln(MCAP)i t−1+φi +ϕt + εi t ,
https://doi.org/10.1017/S0022109017000497D
ownloaded from
https://ww
w.cam
bridge.org/core . Tsinghua University , on 19 Jan 2018 at 02:45:22 , subject to the Cam
bridge Core terms of use, available at https://w
ww
.cambridge.org/core/term
s .

1476 Journal of Financial and Quantitative Analysis
where i and t refer to firm and year, respectively. CEO TURN is a dummy variablethat equals 1 if the CEO leaves firm i during year t , and 0 otherwise.1ROA is thechange in profitability in percentage points. ln(MCAP) is the natural logarithm ofmarket capitalization. The specification includes firm fixed effects (φ) and yearfixed effects (ϕ).
To examine the effect of institutional ownership on pay-for-performance sen-sitivity, we follow Hartzell and Starks (2003) and estimate the following model:
1CEO CASH(TOTAL)i t = α+β11WEALTHi t−1+β2FIOi t−1(4)×1WEALTHi t−1+β3DIOi t−1×1WEALTHi t−1+β4FIOi t−1
+β5DIOi t−1+β6ln(MCAP)i t−1+φi +ϕt + εi t ,
where i and t refer to firm and year, respectively. 1CEO CASH (TOTAL) is thechange in the level of cash and bonus compensation (total compensation, whichincludes cash, bonus, equity, option, and long-term incentive plans). 1WEALTHis the change in market value from period t−1 to t . The specification includesfirm fixed effects (φ) and year fixed effects (ϕ).
To address the endogeneity concern, we first estimate regressions with firmfixed effects to absorb time-invariant unobservable firm characteristics. Panel Aof Table 6 reports the results estimating equations (3) and (4). Model 1 presentsthe results estimating equation (3). Consistent with the previous literature, weobserve that a higher profitability growth is associated with a lower probabilitythat the CEO will be fired, as suggested by a negative and significant coefficientestimate on 1ROA (−0.011). More importantly, the coefficient estimate on theinteraction term, FIO×1ROA, is positive and significant at the 5% level (0.001),which suggests that the negative effect of performance on CEO turnover is mit-igated by foreign institutional ownership. In other words, in firms with greaterforeign institutional ownership, CEO performance–turnover sensitivity is lower.In terms of economic significance, an increase in foreign institutional ownershipfrom the 25th percentile to the 75th percentile of its distribution leads to a decreasein the sensitivity of CEO turnover to firm performance from 1.1% to 0.54%.21
Models 2 and 3 of Table 6 examine how foreign institutional ownership af-fects the CEO’s pay-for-performance sensitivity. The dependent variable is thechange in cash and bonus compensation (model 2) or the change in total com-pensation (model 3). Consistent with Hartzell and Starks (2003), the coefficientestimates on 1WEALTH are positive and significant, suggesting that changes inshareholder wealth are positively related to changes in CEO compensation. Moreimportantly, the coefficient estimates on the interaction term, FIO×1WEALTH,are negative and significant at the 5% level in both specifications, suggestingthat greater foreign institutional ownership largely weakens the CEO’s pay-for-performance sensitivity.
21We have both FIO and1ROA measured in percentage points, and the sensitivity of CEO turnoverto performance is ∂Pr(CEO TURN)/∂1ROA=−0.011+0.001×FIO, where −0.011 and 0.001 arethe coefficient estimates on1ROA and FIO×1ROA, respectively. An increase in foreign institutionalownership from the 25th percentile (FIO=0) to the 75th percentile (FIO=5.585) of its distribution isassociated with a decrease in the sensitivity of CEO turnover to performance from 1.1% [(−0.011+0.001×0)×100=−1.1%] to 0.54% [(−0.011+0.001×5.585)×100∼=−0.54%].
https://doi.org/10.1017/S0022109017000497D
ownloaded from
https://ww
w.cam
bridge.org/core . Tsinghua University , on 19 Jan 2018 at 02:45:22 , subject to the Cam
bridge Core terms of use, available at https://w
ww
.cambridge.org/core/term
s .

Luong, Moshirian, Nguyen, Tian, and Zhang 1477
TABLE 6Economic Mechanisms: Insurance
Table 6 presents the results on how the insurance channel explains the effect of foreign institutional ownership on firminnovation. Panel A reports the regression results with firm fixed effects. In model 1, the dependent variable is a dummyvariable (CEO_TURN), which equals 1 if the CEO at the end of the fiscal year is different from the CEO at the endof the previous fiscal year, and 0 otherwise. The main independent variable is the interaction between the change inprofitability and foreign institutional ownership (FIO×1ROA). Models 2 and 3 show the results of regressions of thechange in the managers’ compensation on foreign institutional ownership, where the dependent variables are measuredby the change in cash and bonus compensation (model 2) and the change in total compensation (model 3). The mainindependent variable is the interaction between the change in shareholders’ wealth and foreign institutional ownership(FIO×1WEALTH). Panel B report the DID test results. All explanatory variables are lagged by 1 year. Variable definitionsare in Appendix B. Standard errors clustered at the firm level (Panel A) and bootstrapped and clustered at the firm level(Panel B) are reported in parentheses. *, **, and *** indicate significance at the 10%, 5%, and 1% levels, respectively.
CEO_TURN 1CEO_CASH 1CEO_TOTAL
Variables 1 2 3
Panel A. Firm Fixed Effects
FIO×1ROA 0.001**(0.000)
DIO×1ROA 0.000(0.000)
1ROA −0.011**(0.005)
FIO×1WEALTH −0.018** −0.027**(0.007) (0.012)
DIO×1WEALTH 0.002 0.003(0.005) (0.009)
1WEALTH 0.382** 0.458***(0.175) (0.176)
FIO 0.000 15.065* 26.776(0.006) (9.011) (33.620)
DIO 0.001 −3.018 −24.286(0.004) (5.688) (19.870)
ln(MCAP) 0.017 −0.007 0.047(0.036) (0.083) (0.083)
Year fixed effects Yes Yes YesFirm fixed effects Yes Yes Yes
Adj. R 2 0.125 0.227 0.122No. of obs. 755 785 785
Panel B. Difference-in-Differences Test
1ROA×TREAT×POST 0.005***(0.002)
1ROA×TREAT −0.004**(0.002)
1ROA×POST −0.003***(0.001)
1ROA −0.006**(0.003)
1WEALTH×TREAT×POST −0.015* −0.023***(0.008) (0.007)
1WEALTH×TREAT −0.007 −0.026(0.010) (0.017)
1WEALTH×POST −0.039 −0.012**(0.085) (0.006)
1WEALTH 0.455* 0.716***(0.263) (0.226)
TREAT×POST 0.028 16.786 −24.132(0.112) (13.156) (15.643)
ln(MCAP) 0.011* 0.074 0.017*(0.006) (0.042) (0.009)
Year fixed effects Yes Yes YesFirm fixed effects Yes Yes Yes
Adj. R 2 0.096 0.042 0.078No. of obs. 110 121 121
https://doi.org/10.1017/S0022109017000497D
ownloaded from
https://ww
w.cam
bridge.org/core . Tsinghua University , on 19 Jan 2018 at 02:45:22 , subject to the Cam
bridge Core terms of use, available at https://w
ww
.cambridge.org/core/term
s .

1478 Journal of Financial and Quantitative Analysis
Next, we perform a DID analysis and present the results in Panel B ofTable 6. Specifically, we match CEO turnover and compensation data from theBoardEx database with the DID analysis sample as constructed in Section IV.Athat has 456 treatment firms and 228 control firms. The final samples consist of110 firm-year observations for the CEO-turnover test and 121 firm-year observa-tions for the CEO-compensation test. To conduct the DID analysis for this mech-anism, we estimate the following two models:
CEO TURNi t = α+β11ROAi t−1×TREATi ×POSTt(5)+β21ROAi t−1×TREATi +β31ROAi t−1×POSTt
+β41ROAi t−1+β5TREATi ×POSTt
+β6ln(MCAP)i t−1+φi +ϕt + εi t ,
1CEO CASH(TOTAL)i t = α+β11WEALTHi t−1×TREATi ×POSTt(6)+β21WEALTHi t−1×TREATi
+β31WEALTHi t−1×POSTt
+β41WEALTHi t−1+β5TREATi ×POSTt
+β6ln(MCAP)i t−1+φi +ϕt + εi t ,
where i and t refer to firm and year, respectively. CEO TURN, 1ROA,1CEO CASH (TOTAL),1WEALTH, TREAT, POST, and ln(MCAP) are definedthe same way as in equations (3) and (4). The specification includes firm fixed ef-fects (φ) and year fixed effects (ϕ). Robust standard errors are clustered at the firmlevel and bootstrapped with 1,000 replications.
Panel B of Table 6 reports the results estimating equations (5) and (6). Model1 presents the results estimating equation (5). We find that the coefficient es-timate on the triple-interaction term, 1ROA×TREAT×POST, is positive andsignificant at the 5% level. These results suggest that the negative effect of per-formance on CEO turnover is mitigated more for treatment firms than for con-trol firms following the passage of JGTRRA. Models 2 and 3 present the resultsestimating equation (6). The coefficient estimates on the triple-interaction term,1WEALTH×TREAT×POST, are negative and significant at the 10% and the1% levels in models 2 and 3, respectively. These results suggest that treatmentfirms’ pay-for-performance sensitivity becomes weaker than that of control firmsafter the passage of JGTRRA.
Overall, in this subsection, we show that the sensitivities of CEO turnoverand compensation to firm performance are weakened in the presence of foreign in-stitutional investors. This finding is consistent with the argument that by providinginsurance to managers with career and reputational concerns, foreign institutionalinvestors allow managers to focus more on long-term, risky investments in inno-vative projects and hence positively contribute to their investee firms’ innovationoutput.
C. Knowledge SpilloversIn this subsection, we explore a third possible mechanism through which for-
eign institutions contribute positively to firm innovation. In addition to monitoringand insurance, foreign institutions could enhance innovation through facilitating
https://doi.org/10.1017/S0022109017000497D
ownloaded from
https://ww
w.cam
bridge.org/core . Tsinghua University , on 19 Jan 2018 at 02:45:22 , subject to the Cam
bridge Core terms of use, available at https://w
ww
.cambridge.org/core/term
s .

Luong, Moshirian, Nguyen, Tian, and Zhang 1479
knowledge spillovers in their cross-border investment activities. Compared withdomestic institutional investors, this mechanism is unique to foreign institutionalinvestors.
Investment in knowledge creation by one party facilitates innovation byothers (Jaffe et al. (2000)). Knowledge spillovers could be indirect and involvedifferent types of stakeholders, including firms, investors, customers, suppliers,competitors, and governments. The literature has suggested that the locus of in-novation and knowledge circulation lies in dynamic, competency-based businessnetworks (Voss (2003), Walters and Buchanan (2001), and Wright and Burns(1998)). One example is that CEO network connections facilitate corporate in-novation (Faleye, Kovacs, and Venkateswaran (2014)). In this regard, there isanecdotal evidence suggesting that foreign institutional investors could facilitatenetworks among different stakeholders. For example, Laurence Fink, the CEO ofBlackRock, a leading U.S. investment management company with investments inover 100 countries and offices in 30 countries, including India, offered to host aglobal investors meeting in India in early 2015 in response to the call for invest-ment by the prime minister of India, Narendra Modi, during his visit to the UnitedStates in 2014.22 This example suggests that foreign institutions could facilitateknowledge spillovers through business networks by acting as a bridge betweenlocal firms and foreign firms or investors so that they can exchange opportunitiesand knowledge, which then could contribute to innovation.
Knowledge spillovers can also occur within a multinational corporation. Ina study of cross-border mergers and acquisitions, Ferreira et al. (2010) find thatforeign institutional investors are a driving force behind cross-border mergers andacquisitions because they act as facilitators, build bridges between firms, and re-duce transaction costs and information asymmetry between bidders and targetacquisitions. Relatedly, Guadalupe et al. (2012) find that after being acquired byforeign acquirers, domestic firms are likely to innovate through their access toforeign technologies and widening foreign markets. Based on these two studies,a reasonable argument is that foreign institutional investors could contribute tothe innovation of domestic firms through facilitating cross-border mergers andacquisitions and, ultimately, knowledge spillovers.
Along these lines, we argue that one possible channel through which for-eign institutional investors promote innovation is that they facilitate knowledgespillovers from a more innovative economy to a less innovative economy. Theycan do so by acting as a facilitator in cross-border mergers and acquisitions oras a bridge for a network of managers, investors, and other stakeholders of for-eign and domestic firms to exchange knowledge, ideas, and opportunities, which,to a certain extent, contributes to investee firms’ innovation. If our conjecture issupported, the innovativeness of institutional investors’ home countries shouldplay a role in firm innovation. In particular, foreign institutional investors fromeconomies with a higher level of innovation output may affect investee firms’ in-novation output to a larger extent than those from economies with a lower level of
22http://www.dnaindia.com/india/report-after-meeting-pm-narendra-modi-blackrock-ceo-offers-to-host-global-investors-meet-in-india-in-2015-2022468.
https://doi.org/10.1017/S0022109017000497D
ownloaded from
https://ww
w.cam
bridge.org/core . Tsinghua University , on 19 Jan 2018 at 02:45:22 , subject to the Cam
bridge Core terms of use, available at https://w
ww
.cambridge.org/core/term
s .

1480 Journal of Financial and Quantitative Analysis
innovation output because the former can provide better advice and/or have betterexpertise on how to speed up knowledge transfers.
We test this hypothesis using a data set of country-level patents collectedfrom the World Bank database.23 We construct 4 measures of country-level in-novativeness for each of the 73 countries in which the institutions in our sampleare domiciled. The first measure is the total number of patents applied for by allresidents of a country in a year scaled by its GDP (PATENT GDP). The secondmeasure is the total number of patents applied for by all residents of a coun-try in a year scaled by its total population (PATENT POP). The third measureis the total number of patents applied for by all residents of a country in a yearscaled by its total number of listed firms (PATENT FIRMS). The last measureis the total number of patents applied for by all residents of a country in a yearscaled by its market capitalization (PATENT MCAP). We then take the average ofeach of these country-level innovativeness measures over the 2000–2010 period.We define an institution’s home country as a high-innovation (low-innovation)country if the country’s innovation measure is above (below) the median of all 73countries’ measures. We then classify foreign institutional ownership according towhether the institutional investors come from high-innovation countries or low-innovation countries and examine the effects of these ownership components onfirm innovation.
We run OLS regressions with firm fixed effects to mitigate the endogene-ity concern. We reestimate the baseline regressions but distinguish betweenthe ownership of foreign institutional investors from high-innovation countries(FIOHIGH INNO) and the ownership of foreign institutional investors from low-innovation countries (FIOLOW INNO). Panel A of Table 7 presents these regres-sion results, based on the innovativeness of foreign institutional investors’ homecountries, in which the dependent variables are ln(PATENT) (models 1–4) andln(CITEPAT) (models 5–8). The results show that the coefficient estimates onFIOHIGH INNO are positive and significant in almost all models except for model4. The coefficient estimates on FIOLOW INNO are insignificant in all specifications.These results suggest that the positive effect of foreign institutional ownershipon firm innovation is largely driven by institutions from high-innovation foreigncountries.
However, it is plausible that the innovativeness of institutional investors’home countries might be correlated with their institutional environments. Toaddress this concern, we include country-level governance of foreign institu-tions, measured by the anti-self-dealing index of La Porta, Lopez-de-Silanes, andShleifer (2006), in our analysis. Specifically, we classify foreign institutional in-vestors into 4 groups according to whether a foreign institution comes from ahigh-innovation (low-innovation) or high-governance (low-governance) country.An institution’s home country is defined as a high- or low-governance country ifits anti-self-dealing index is above or below the median of all domiciled countriesof the sample institutional investors. We classify foreign institutions into 4 groups:
23Although the DWPI database contains patent information at the assignee level, it does not havedetailed information on the resident country of assignees. The World Bank patent database providesaggregate country-level data on both resident and nonresident patent holders.
https://doi.org/10.1017/S0022109017000497D
ownloaded from
https://ww
w.cam
bridge.org/core . Tsinghua University , on 19 Jan 2018 at 02:45:22 , subject to the Cam
bridge Core terms of use, available at https://w
ww
.cambridge.org/core/term
s .

Luong, Moshirian, Nguyen, Tian, and Zhang 1481
TABLE 7Economic Mechanisms: Knowledge Spillovers
Table 7 reports the results on how the knowledge-spillover channel explains the effect of foreign institutional ownership onfirm innovation. A country-level measure of innovativeness is constructed based on 4 ratios: the total number of patentsapplied for by all residents of a country in a year scaled by i) GDP (PATENT_GDP), ii) total population (PATENT_POP),iii) total number of listed firms (PATENT_FIRMS), and iv) country market capitalization (PATENT_MCAP) measured in thatyear. A country-level measure of governance is based on the anti-self-dealing index of La Porta et al. (2006). An insti-tution’s home country is a high- or low-innovation (governance) country if its measure of innovativeness (governance)is above or below the median of all domiciled countries of sample institutional investors. In Panel A, foreign institutionalownership is classified into ownership from high-innovation countries (FIOHIGH_INNO) and ownership from low-innovationcountries (FIOLOW_INNO). In Panel B, foreign institutional ownership is classified into ownership from high-innovation andhigh-governance countries (FIOHIGHINNO_HIGHGOV), high-innovation and low-governance countries (FIOHIGHINNO_LOWGOV),low-innovation and high-governance countries (FIOLOWINNO_HIGHGOV), and low-innovation and low-governance countries(FIOLOWINNO_LOWGOV). All explanatory variables are lagged by 1 year. Variable definitions are in Appendix B. Standarderrors clustered at the firm level are reported in parentheses. *, **, and *** indicate significance at the 10%, 5%, and 1%levels, respectively.
ln(PATENT) ln(CITEPAT)
PATE
NT_
GDP
PATE
NT_
POP
PATE
NT_
FIRMS
PATE
NT_
MCAP
PATE
NT_
GDP
PATE
NT_
POP
PATE
NT_
FIRMS
PATE
NT_
MCAP
Variables 1 2 3 4 5 6 7 8
Panel A. Foreign Institutional Ownership Classified by Foreign Institutions’ Home-Country Innovativeness
FIOHIGH_INNO 0.007* 0.009*** 0.009** 0.011 0.011** 0.012*** 0.013** 0.020**(0.004) (0.003) (0.004) (0.008) (0.005) (0.004) (0.005) (0.010)
FIOLOW_INNO 0.014 0.001 0.014 0.006 0.018 0.015 0.015 0.007(0.009) (0.025) (0.012) (0.004) (0.011) (0.033) (0.015) (0.005)
DIO −0.001 −0.001 −0.001 −0.001 −0.001 −0.001 −0.001 −0.001(0.001) (0.001) (0.001) (0.001) (0.002) (0.002) (0.002) (0.002)
INSIDE 0.062* 0.061* 0.061* 0.062* 0.086* 0.084* 0.085* 0.086*(0.032) (0.032) (0.032) (0.032) (0.044) (0.044) (0.044) (0.044)
ln(AGE) 0.087** 0.087** 0.086** 0.087** 0.119** 0.118** 0.118** 0.120**(0.037) (0.038) (0.038) (0.038) (0.049) (0.049) (0.049) (0.049)
HHI −0.169 −0.171 −0.169 −0.171 0.152 0.151 0.152 0.151(0.274) (0.274) (0.274) (0.274) (0.346) (0.347) (0.347) (0.347)
HHI2 0.149 0.151 0.150 0.151 0.046 0.049 0.048 0.048(0.241) (0.241) (0.241) (0.241) (0.290) (0.290) (0.290) (0.291)
RD 0.053 0.055 0.055 0.054 −0.233 −0.231 −0.230 −0.231(0.132) (0.132) (0.132) (0.132) (0.215) (0.215) (0.215) (0.215)
CAPEX 0.378*** 0.378*** 0.377*** 0.378*** 0.517*** 0.519*** 0.518*** 0.518***(0.134) (0.134) (0.134) (0.134) (0.184) (0.184) (0.184) (0.184)
PPE −0.080 −0.083 −0.082 −0.081 −0.093 −0.095 −0.095 −0.093(0.086) (0.086) (0.086) (0.086) (0.114) (0.114) (0.114) (0.114)
LEV −0.133** −0.133** −0.132** −0.134** −0.184*** −0.185*** −0.185*** −0.185***(0.057) (0.057) (0.057) (0.058) (0.071) (0.071) (0.071) (0.071)
ROA −0.039 −0.037 −0.039 −0.040 −0.170 −0.170 −0.170 −0.171(0.079) (0.079) (0.079) (0.079) (0.108) (0.108) (0.108) (0.108)
FSALE 0.001 0.000 0.001 0.000 −0.009 −0.009 −0.009 −0.009(0.019) (0.020) (0.020) (0.020) (0.018) (0.018) (0.018) (0.018)
ln(SALE) 0.110*** 0.110*** 0.110*** 0.110*** 0.114*** 0.115*** 0.114*** 0.115***(0.015) (0.015) (0.015) (0.015) (0.020) (0.020) (0.020) (0.020)
TOBINS_Q 0.005 0.005 0.005 0.005 0.001 0.001 0.001 0.001(0.005) (0.005) (0.005) (0.005) (0.008) (0.008) (0.008) (0.008)
KZ −0.001*** −0.001*** −0.001*** −0.001*** −0.001*** −0.001*** −0.001*** −0.001***(0.000) (0.000) (0.000) (0.000) (0.000) (0.000) (0.000) (0.000)
P_INDEX 0.114** 0.117*** 0.115*** 0.115*** 0.148** 0.151** 0.150** 0.150**(0.044) (0.044) (0.044) (0.044) (0.062) (0.061) (0.061) (0.062)
RULE −0.033 −0.031 −0.031 −0.033 −0.081 −0.080 −0.078 −0.081(0.071) (0.071) (0.071) (0.071) (0.093) (0.093) (0.093) (0.093)
(continued on next page)
https://doi.org/10.1017/S0022109017000497D
ownloaded from
https://ww
w.cam
bridge.org/core . Tsinghua University , on 19 Jan 2018 at 02:45:22 , subject to the Cam
bridge Core terms of use, available at https://w
ww
.cambridge.org/core/term
s .

1482 Journal of Financial and Quantitative Analysis
TABLE 7 (continued)Economic Mechanisms: Knowledge Spillovers
ln(PATENT) ln(CITEPAT)
PATE
NT_
GDP
PATE
NT_
POP
PATE
NT_
FIRMS
PATE
NT_
MCAP
PATE
NT_
GDP
PATE
NT_
POP
PATE
NT_
FIRMS
PATE
NT_
MCAP
Variables 1 2 3 4 5 6 7 8
Panel A. Foreign Institutional Ownership Classified by Foreign Institutions’ Home-Country Innovativeness (continued)
GOODGOV 0.134*** 0.130*** 0.131*** 0.133*** 0.133** 0.130** 0.129** 0.131**(0.049) (0.049) (0.049) (0.049) (0.062) (0.062) (0.062) (0.062)
EXPORT −0.043 −0.029 −0.042 −0.039 −0.142 −0.123 −0.137 −0.136(0.383) (0.383) (0.384) (0.383) (0.464) (0.465) (0.465) (0.465)
IMPORT 0.803** 0.792* 0.803** 0.802** 0.501 0.486 0.497 0.500(0.406) (0.406) (0.406) (0.406) (0.517) (0.517) (0.518) (0.518)
EQUITY 0.091*** 0.089*** 0.090*** 0.090*** 0.069* 0.067* 0.068* 0.068*(0.028) (0.028) (0.028) (0.028) (0.036) (0.036) (0.036) (0.036)
CREDIT 0.014 0.014 0.014 0.014 −0.005 −0.006 −0.005 −0.005(0.011) (0.011) (0.011) (0.011) (0.015) (0.015) (0.015) (0.015)
ln(GDP) 0.149** 0.152** 0.150** 0.150** 0.102 0.104 0.104 0.105(0.066) (0.066) (0.066) (0.066) (0.086) (0.086) (0.086) (0.086)
Year fixed effects Yes Yes Yes Yes Yes Yes Yes YesFirm fixed effects Yes Yes Yes Yes Yes Yes Yes Yes
Adj. R 2 0.872 0.872 0.872 0.872 0.799 0.799 0.799 0.799No. of obs. 30,008 30,008 30,008 30,008 30,008 30,008 30,008 30,008
Panel B. Foreign Institutional Ownership Classified by Foreign Institutions’ Home-CountryInnovativeness and Governance
FIOHIGHINNO_HIGHGOV 0.009*** 0.007* 0.010** 0.013* 0.011** 0.009* 0.012** 0.018*(0.003) (0.004) (0.005) (0.008) (0.005) (0.006) (0.006) (0.010)
FIOHIGHINNO_LOWGOV 0.004** 0.003* 0.005*** 0.004 0.004** 0.004** 0.005*** 0.003(0.002) (0.002) (0.002) (0.003) (0.002) (0.002) (0.002) (0.003)
FIOLOWINNO_HIGHGOV 0.013 0.019 0.011* 0.005* 0.019 0.035 0.011** 0.005*(0.009) (0.012) (0.006) (0.003) (0.012) (0.025) (0.005) (0.003)
FIOLOWINNO_LOWGOV 0.009 0.008 0.005 0.001 0.008 0.006 0.004 0.006(0.006) (0.012) (0.009) (0.004) (0.008) (0.015) (0.011) (0.005)
Other controls Yes Yes Yes Yes Yes Yes Yes YesYear fixed effects Yes Yes Yes Yes Yes Yes Yes YesFirm fixed effects Yes Yes Yes Yes Yes Yes Yes Yes
Adj. R 2 0.872 0.872 0.872 0.872 0.799 0.799 0.799 0.799No. of obs. 30,008 30,008 30,008 30,008 30,008 30,008 30,008 30,008
high-innovation and high-governance countries (FIOHIGHINNO HIGHGOV), high-innovation and low-governance countries (FIOHIGHINNO LOWGOV), low-innovationand high-governance countries (FIOLOWINNO HIGHGOV), and low-innovation and low-governance countries (FIOLOWINNO LOWGOV).
In Panel B of Table 7, we find that the coefficient estimates onFIOHIGHINNO HIGHGOV are positive and significant, suggesting that foreign institu-tions from high-innovation and high-governance countries positively influencefirm innovation. In addition, the coefficient estimates on FIOHIGHINNO LOWGOV re-main positive and significant (except for models 4 and 8), which suggests thatthose foreign institutions from high-innovation but low-governance countries pos-itively affect the innovation of their investee firms. In summary, we find evidencesuggesting that foreign institutions coming from high-innovation countries posi-tively affect firm innovation, regardless of their governance level.
https://doi.org/10.1017/S0022109017000497D
ownloaded from
https://ww
w.cam
bridge.org/core . Tsinghua University , on 19 Jan 2018 at 02:45:22 , subject to the Cam
bridge Core terms of use, available at https://w
ww
.cambridge.org/core/term
s .

Luong, Moshirian, Nguyen, Tian, and Zhang 1483
To the extent that the United States is the most innovative country in oursample, the DID analysis reported in Panel C of Table 3 also provides evidencethat supports this underlying economic mechanism. Specifically, the coefficientestimates on TREAT×POST, which captures the exogenous increase in U.S. for-eign institutional ownership following the passage of JGTRRA, are positive andstatistically significant at the 1% level, whereas those of FIONONUS are significantonly at the marginal level. The magnitudes of these estimates on TREAT×POSTare much larger (5 times larger) than those on FIONONUS. These results suggestthat a positive shock in the foreign equity ownership of institutions coming froma more innovative country (e.g., the United States) leads to a significantly largerincrease in the innovation output of investee firms.
Overall, in this subsection, we show that the innovativeness of foreign insti-tutional investors’ home countries positively contributes to investee firms’ inno-vation output, which suggests that innovation travels with foreign institutions thatcome from high-innovation countries. Hence, knowledge spillovers are a plausiblemechanism through which foreign institutional investors promote innovation.24
VI. ConclusionWe examine the effect of foreign institutional investors on firm innovation.
Using firm-level data across 26 non-U.S. economies for the 2000–2010 period,we document a positive effect of foreign institutional ownership on firm innova-tion. To address endogeneity concerns, we use both an IV approach and a DIDapproach that relies on a plausibly exogenous variation in foreign institutionalownership generated by a quasi-natural experiment, the passage of JGTRRA. Ouridentification tests suggest that this positive effect is causal.
We further explore three possible underlying economic mechanisms throughwhich foreign institutional investors promote innovation. We find that foreign in-stitutions promote firm innovation by acting as active monitors, by providing in-surance against innovation failures to firm managers with career or reputationalconcerns, and by promoting knowledge spillovers from high-innovation coun-tries. Our article provides the first rigorous empirical study to examine the roleof foreign institutional investors in motivating technological innovation outsidethe United States.
24It is reasonable to argue that foreign institutional ownership affects firm innovation over a long-term period, and how fast this effect takes place should depend on the underlying economic mecha-nisms. We thus extend our analysis by using 2- or 3-year-ahead, instead of 1-year-ahead, innovationmeasures as the dependent variables in the baseline regression, as well as in regressions that explorethe underlying economic mechanisms. Under the monitoring mechanism, it appears that foreign insti-tutional investors have more immediate effects on firm innovation, because the coefficient estimateson FIOINDEPENDENT and FIOLONG TERM become less significant when the 2- or 3-year-ahead innovationmeasures are used as the dependent variables. Conversely, in the knowledge-spillover mechanism, itapparently takes foreign institutional investors a longer time before they can influence firm innovation;the coefficient estimates on FIOHIGH INNO remain highly significant when the 2-year-ahead innovationmeasures are used as the dependent variables. We present these regression results in Table A7 in theInternet Appendix.
https://doi.org/10.1017/S0022109017000497D
ownloaded from
https://ww
w.cam
bridge.org/core . Tsinghua University , on 19 Jan 2018 at 02:45:22 , subject to the Cam
bridge Core terms of use, available at https://w
ww
.cambridge.org/core/term
s .

1484 Journal of Financial and Quantitative Analysis
Appendix A. Thomson Reuters DWPI Classification SystemDWPI categorizes patents using a simple classification for all technologies. Patents
are divided into 3 broad areas: chemical, engineering, and electronic and electrical engi-neering. Each of these is then further classified into smaller subject areas called “sections,”which describe the technical area or areas covered by the patent. There is a total of 20 suchsections, designated A–M for chemical, P–Q for engineering, and S–X for electronic andelectrical engineering, as follows:
Chemical
A. Polymers and PlasticsB. PharmaceuticalsC. Agricultural ChemicalsD. Food, Detergents, Water Treatment and BiotechnologyE. General ChemicalsF. Textiles and Paper-MakingG. Printing, Coating, PhotographicH. PetroleumJ. Chemical EngineeringK. Nucleonics, Explosives and ProtectionL. Refractories, Ceramics, Cement and Electro(in)organicsM. Metallurgy
Engineering
P1. Agriculture, Food, TobaccoP2. Personal, DomesticP3. Health, AmusementP4. Separating, MixingP5. Shaping MetalP6. Shaping Non-metalP7. Pressing, PrintingP8. Optics, Photography, GeneralQ1. Vehicles in GeneralQ2. Special VehiclesQ3. Conveying, Packaging, StoringQ4. Buildings, ConstructionQ5. Engines, PumpsQ6. Engineering ElementsQ7. Lighting, Heating
Electronic and Electrical Engineering
S. Instrumentation, Measuring and TestingT. Computing and ControlU. Semiconductors and Electronic CircuitryV. Electronic ComponentsW. CommunicationsX. Electric Power Engineering
https://doi.org/10.1017/S0022109017000497D
ownloaded from
https://ww
w.cam
bridge.org/core . Tsinghua University , on 19 Jan 2018 at 02:45:22 , subject to the Cam
bridge Core terms of use, available at https://w
ww
.cambridge.org/core/term
s .

Luong, Moshirian, Nguyen, Tian, and Zhang 1485
Appendix B. Variable Definitions
1. Innovation Variables (Source: Thomson Innovation)ln(PATENT): Natural logarithm of 1 plus the total number of patents granted to each firm
in each year scaled by the mean number of patent applications filed in a year fortechnology groups to which the patent belongs.
ln(CITEPAT): Natural logarithm of 1 plus the total number of citations made to each firm’spatents in each year scaled by the mean citation count received by each patent in ayear for technology groups to which the patent belongs.
2. Institutional Ownership Variables (Source: FactSet Ownership)DIO: Domestic institutional ownership, defined as the sum of shares owned by all institu-
tions domiciled in the same country as where the stock is listed, as a percentage ofthe firm’s total number of shares outstanding, set to 0 if the stock is not held by anyinstitution.
FIO: Foreign institutional ownership, defined as the sum of shares owned by all institutionsdomiciled in a country different from where the stock is listed, as a percentage of thefirm’s total number of shares outstanding, set to 0 if the stock is not held by anyinstitution.
FIOINDEPENDENT: Independent foreign institutional ownership, defined as the sum of sharesowned by all active foreign institutions (mutual funds and independent investmentadvisers), as a percentage of the firm’s total number of shares outstanding.
FIOGRAY: Gray foreign institutional ownership, defined as the sum of shares owned by allpassive foreign institutions (bank trusts, insurance companies, and other institutions),as a percentage of the firm’s total number of shares outstanding.
FIOLONG TERM: Long-term foreign institutional ownership, defined as the sum of sharesowned by all foreign institutions that hold the stock for more than 1 year, as a per-centage of the firm’s total number of shares outstanding.
FIOSHORT TERM: Short-term foreign institutional ownership, defined as the sum of sharesowned by all foreign institutions that hold the stock for less than 1 year, as a per-centage of the firm’s total number of shares outstanding.
FIOHIGH INNO: High-innovation foreign institutional ownership, defined as the sum of sharesowned by all foreign institutions that come from high-innovation countries, as a per-centage of the firm’s total number of shares outstanding.
FIOLOW INNO: Low-innovation foreign institutional ownership, defined as the sum of sharesowned by all foreign institutions that come from low-innovation countries, as a per-centage of the firm’s total number of shares outstanding.
FIOHIGHINNO HIGHGOV: High-innovation and high-governance foreign institutional ownership,defined as the sum of shares owned by all foreign institutions that come from high-innovation and high-governance countries, as a percentage of the firm’s total numberof shares outstanding.
FIOHIGHINNO LOWGOV: High-innovation and low-governance foreign institutional ownership,defined as the sum of shares owned by all foreign institutions that come from high-innovation and low-governance countries as a percentage of the firm’s total numberof shares outstanding.
FIOLOWINNO HIGHGOV: Low-innovation and high-governance foreign institutional ownership,defined as the sum of shares owned by all foreign institutions that come from low-innovation and high-governance countries, as a percentage of the firm’s total numberof shares outstanding.
https://doi.org/10.1017/S0022109017000497D
ownloaded from
https://ww
w.cam
bridge.org/core . Tsinghua University , on 19 Jan 2018 at 02:45:22 , subject to the Cam
bridge Core terms of use, available at https://w
ww
.cambridge.org/core/term
s .

1486 Journal of Financial and Quantitative Analysis
FIOLOWINNO LOWGOV: Low-innovation and low-governance foreign institutional ownership,defined as the sum of shares owned by all foreign institutions that come from low-innovation and low-governance countries, as a percentage of the firm’s total numberof shares outstanding.
3. Control Variables (Source: Worldscope)TA: Book value of total assets, measured at the end of the fiscal year in millions.RD: Research and development expenditures scaled by total assets, measured at the end of
the fiscal year; set to 0 if missing.FSALE: The percentage of foreign sales in total sales.INSIDE: Number of shares held by insiders as a proportion of the total number of shares
outstanding.ln(SALE): Natural logarithm of net sales.ln(AGE): Natural logarithm of the number of years since the firm has its listed price.CAPEX: Capital expenditures divided by total assets, measured at the end of the fiscal year.PPE: Net property, plant, and equipment scaled by total assets, measured at the end of the
fiscal year.LEV: Ratio of total debt to total assets, measured at the end of the fiscal year.ROA: Return on assets, defined as operating income before depreciation divided by total
assets, measured at the end of the fiscal year.KZ: The Kaplan and Zingales (1997) index measured at the end of fiscal year, calculated as
−1.002 × cash flow [(income before extraordinary items + depreciation and amor-tization)/lagged net property, plant, and equipment] +0.283×Q [market value ofequity + book value of total assets − book value of equity − balance sheet deferredtax] + 3.139 × leverage[total debt/total assets] − 39.368 × dividends [(preferreddividends + common dividends)/lagged net property, plant, and equipment] − 3.315× cash holdings [(cash and short-term investment)/(lagged net property, plant, andequipment)].
TOBINS Q: Growth opportunities, defined as market value of equity plus book value ofassets minus book value of equity minus balance sheet deferred taxes, scaled by totalassets, measured at the end of the fiscal year.
HHI: Herfindahl index of 4-digit Standard Industrial Classification (SIC) industry to whichthe firm belongs, measured at the end of the fiscal year.
HHI2: Squared HHI.
4. Country-Level Innovativeness and Control Variables (Source: WorldBank, World Development Indicators (WDI), and other sources)
PATENT GDP: Total number of patent applications applied for in a year by all residentsof a country divided by GDP.
PATENT POP: Total number of patent applications applied for in a year by all residents ofa country divided by total population.
PATENT FIRMS: Total number of patent applications applied for in a year by all residentsof a country divided by the number of listed firms.
PATENT MCAP: Total number of patent applications applied for in a year by all residentsof a country divided by market capitalization.
https://doi.org/10.1017/S0022109017000497D
ownloaded from
https://ww
w.cam
bridge.org/core . Tsinghua University , on 19 Jan 2018 at 02:45:22 , subject to the Cam
bridge Core terms of use, available at https://w
ww
.cambridge.org/core/term
s .

Luong, Moshirian, Nguyen, Tian, and Zhang 1487
P INDEX: Patent protection index, developed by Ginarte and Park (1997) and updated byPark (2008). The index data are constructed for more than 100 countries, updatedevery 5 years since 1960. The index takes values between 0 and 5. Higher values in-dicate patent laws with stronger intellectual property rights. The index coding schemeaggregates information on i) membership in international treaties (Paris Convention,International Convention for the Protection of New Varieties of Plants, Patent Coop-eration Treaty, Budapest Treaty, Agreement on Trade-Related Aspects of IntellectualProperty Rights), ii) enforcement mechanisms (preliminary injunctions, contributoryinfringement pleadings, burden-of-proof reversal), iii) restrictions on patent rights(working requirements, compulsory licensing, revocation of patents), iv) durationof protection, and v) extent of coverage (pharmaceuticals, chemicals, food, surgicalproducts, microorganisms, utility models, software, plant and animal varieties).
RULE: The rule-of-law indicator of Kaufmann et al. (2011), which captures perceptionsof the extent to which agents have confidence in and abide by the rules of society,in particular, the quality of contract enforcement, property rights, the police, and thecourts, as well as the likelihood of crime and violence.
GOODGOV: The government effectiveness indicator of Kaufmann et al. (2011), whichcaptures perceptions of the quality of public services, the quality of the civil serviceand the degree of its independence from political pressures, the quality of policyformulation and implementation, and the credibility of the government’s commitmentto such policies.
EXPORT: The ratio of a country’s exports to its GDP.IMPORT: The ratio of a country’s imports to its GDP.EQUITY: The ratio of a country’s stock market capitalization to its GDP.CREDIT: The ratio of a country’s bank credit to its GDP.ln(GDP): The natural logarithm of real GDP per capita.
ReferencesAcharya, V. V.; R. P. Baghai; and K. V. Subramanian. “Wrongful Discharge Laws and Innovation.”
Review of Financial Studies, 27 (2014), 301–346.Acharya, V. V., and K. V. Subramanian. “Bankruptcy Codes and Innovation.” Review of Financial
Studies, 22 (2009), 4949–4988.Aggarwal, R.; I. Erel; M. Ferreira; and P. Matos. “Does Governance Travel around the World?
Evidence from Institutional Investors.” Journal of Financial Economics, 100 (2011), 154–181.Aghion, P.; N. Bloom; R. Blundell; R. Griffith; and P. Howitt. “Competition and Innovation: An
Inverted-U Relationship.” Quarterly Journal of Economics, 120 (2005), 701–728.Aghion, P.; P. Howitt; and S. Prantl. “Patent Rights, Product Market Reforms, and Innovation.” Journal
of Economic Growth, 20 (2015), 223–262.Aghion, P.; J. Van Reenen; and L. Zingales. “Innovation and Institutional Ownership.” American
Economic Review, 103 (2013), 277–304.Agrawal, A.; I. Cockburn; and J. McHale. “Gone but Not Forgotten: Knowledge Flows, Labor Mobil-
ity, and Enduring Social Relationships.” Journal of Economic Geography, 6 (2006), 571–591.Ahmadjian, C. L., and G. E. Robbins. “A Clash of Capitalisms: Foreign Shareholders and Corporate
Restructuring in 1990s Japan.” American Sociological Review, 70 (2005), 451–471.Ammer, J.; S. B. Holland; D. C. Smith; and F. E. Warnock. “U.S. International Equity Investment.”
Journal of Accounting Research, 50 (2012), 1109–1139.Bekaert, G., and C. R. Harvey. “Emerging Equity Market Volatility.” Journal of Financial Economics,
43 (1997), 29–77.Bekaert, G., and C. R. Harvey. “Foreign Speculators and Emerging Equity Markets.” Journal of
Finance, 55 (2000), 565–613.Bekaert, G.; C. R. Harvey; and C. Lundblad. “Growth Volatility and Financial Liberalization.” Journal
of International Money and Finance, 25 (2006), 370–403.Bena, J.; M. A. Ferreira; P. Matos; and P. Pires. “Are Foreign Investors Locusts? The Long-Term
Effects of Foreign Institutional Ownership.” Journal of Financial Economics, forthcoming (2017).
https://doi.org/10.1017/S0022109017000497D
ownloaded from
https://ww
w.cam
bridge.org/core . Tsinghua University , on 19 Jan 2018 at 02:45:22 , subject to the Cam
bridge Core terms of use, available at https://w
ww
.cambridge.org/core/term
s .

1488 Journal of Financial and Quantitative Analysis
Bertrand, M., and S. Mullainathan. “Enjoying the Quiet Life? Corporate Governance and ManagerialPreferences.” Journal of Political Economy, 111 (2003), 1043–1075.
Bradley, D.; I. Kim; and X. Tian. “Do Unions Affect Innovation?” Management Science, forthcoming(2017).
Branstetter, L. “Is Foreign Direct Investment a Channel of Knowledge Spillovers? Evidence fromJapan’s FDI in the United States.” Journal of International Economics, 68 (2006), 325–344.
Brown, J. R.; G. Martinsson; and B. C. Petersen. “Law, Stock Markets, and Innovation.” Journal ofFinance, 68 (2013), 1517–1549.
Burkart, M.; D. Gromb; and F. Panunzi. “Large Shareholders, Monitoring, and the Value of the Firm.”Quarterly Journal of Economics, 112 (1997), 693–728.
Bushee, B. J. “The Influence of Institutional Investors in Myopic R&D Investment Behavior.”Accounting Review, 73 (1998), 305–333.
Carayannis, E. G.; E. T. Samara; and Y. L. Bakouros. Innovation and Entrepreneurship: Theory, Policy,and Practice. London, UK: Springer (2015).
Chang, X.; R. D. McLean; B. Zhang; and W. Zhang. “Innovation and Productivity Growth: Evidencefrom Global Patents.” SSRN Working Paper Series (2015).
Chari, A.; P. B. Henry; and D. Sasson. “Capital Market Integration and Wages.” American EconomicJournal: Macroeconomics, 4 (2012), 102–132.
Chemmanur, T. J.; E. Loutskina; and X. Tian. “Corporate Venture Capital, Value Creation, andInnovation.” Review of Financial Studies, 27 (2014), 2434–2473.
Chen, X.; J. Harford; and K. Li. “Monitoring: Which Institutions Matter?” Journal of FinancialEconomics, 86 (2007), 279–305.
Chen, J.; W. S. Leung; and K. P. Evans. “Are Employee-Friendly Workplaces Conducive to Innova-tion?” Journal of Corporate Finance, 40 (2016), 61–79.
Chung, K. H., and H. Zhang. “Corporate Governance and Institutional Ownership.” Journal ofFinancial and Quantitative Analysis, 46 (2011), 247–273.
Cornaggia, J.; Y. Mao; X. Tian; and B. Wolfe. “Does Banking Competition Affect Innovation?”Journal of Financial Economics, 115 (2015), 189–209.
Desai, M. A., and D. Dharmapala. “Dividend Taxes and International Portfolio Choice.” Review ofEconomics and Statistics, 93 (2011), 266–284.
Douma, S.; R. George; and R. Kabir. “Foreign and Domestic Ownership, Business Groups, andFirm Performance: Evidence from a Large Emerging Market.” Strategic Management Journal,27 (2006), 637–657.
Ederer, F., and G. Manso. “Is Pay for Performance Detrimental to Innovation?” Management Science,59 (2013), 1496–1513.
Faleye, O.; T. Kovacs; and A. Venkateswaran. “Do Better-Connected CEOs Innovate More?” Journalof Financial and Quantitative Analysis, 49 (2014), 1201–1225.
Fang, V. W.; M. Maffett; and B. Zhang. “Foreign Institutional Ownership and the Global Convergenceof Financial Reporting Practices.” Journal of Accounting Research, 53 (2015), 593–631.
Fang, V. W.; X. Tian; and S. Tice. “Does Stock Liquidity Enhance or Impede Firm Innovation?”Journal of Finance, 69 (2014), 2085–2125.
Ferreira, M. A.; M. Massa; and P. Matos. “Shareholders at the Gate? Institutional Investors and Cross-Border Mergers and Acquisitions.” Review of Financial Studies, 23 (2010), 601–644.
Ferreira, M. A., and P. Matos. “The Colors of Investors’ Money: The Role of Institutional Investorsaround the World.” Journal of Financial Economics, 88 (2008), 499–533.
Gillan, S. L., and L. T. Starks. “Corporate Governance Proposals and Shareholder Activism: The Roleof Institutional Investors.” Journal of Financial Economics, 57 (2000), 275–305.
Gillan, S. L., and L. T. Starks. “Corporate Governance, Corporate Ownership, and the Role of Institu-tional Investors: A Global Perspective.” Journal of Applied Finance, 13 (2003), 4–22.
Ginarte, J. C., and W. G. Park. “Determinants of Patent Rights: A Cross-National Study.” ResearchPolicy, 26 (1997), 283–301.
Glucksberg, S. “The Influence of Strength of Drive on Functional Fixedness and Perceptual Recogni-tion.” Journal of Experimental Psychology, 63 (1962), 36–41.
Gompers, P. A., and A. Metrick. “Institutional Investors and Equity Prices.” Quarterly Journal ofEconomics, 116 (2001), 229–259.
Griliches, Z.; A. Pakes; and B. H. Hall. “The Value of Patents as Indicator of Inventive Activity.”NBER Working Paper No. 2083 (1988).
Grinblatt, M., and M. Keloharju. “The Investment Behavior and Performance of Various InvestorTypes: A Study of Finland’s Unique Data Set.” Journal of Financial Economics, 55 (2000), 43–67.
Grossman, S. J., and O. D. Hart. “One Share-One Vote and the Market for Corporate Control.” Journalof Financial Economics, 20 (1988), 175–202.
https://doi.org/10.1017/S0022109017000497D
ownloaded from
https://ww
w.cam
bridge.org/core . Tsinghua University , on 19 Jan 2018 at 02:45:22 , subject to the Cam
bridge Core terms of use, available at https://w
ww
.cambridge.org/core/term
s .

Luong, Moshirian, Nguyen, Tian, and Zhang 1489
Guadalupe, M.; O. Kuzmina; and C. Thomas. “Innovation and Foreign Ownership.” AmericanEconomic Review, 102 (2012), 3594–3627.
Hall, B. H.; A. B. Jaffe; and M. Trajtenberg. “The NBER Patent Citation Data File: Lessons, Insightsand Methodological Tools.” NBER Working Paper No. 8498 (2001).
Hall, B. H., and J. Lerner. “The Financing of R&D and Innovation.” In Handbook of the Economics ofInnovation, Vol. 1, B. H. Hall and N. Rosenberg, eds. Amsterdam, Netherlands: Elsevier (2010).
Hart, O. D. “The Market Mechanism as an Incentive Scheme.” Bell Journal of Economics, 14 (1983),366–382.
Hartzell, J. C., and L. T. Starks. “Institutional Investors and Executive Compensation.” Journal ofFinance, 58 (2003), 2351–2374.
He, J., and X. Tian. “The Dark Side of Analyst Coverage: The Case of Innovation.” Journal ofFinancial Economics, 109 (2013), 856–878.
Holmstrom, B. “Agency Costs and Innovation.” Journal of Economic Behavior and Organization, 12(1989), 305–327.
Hsu, P.-H.; X. Tian; and Y. Xu. “Financial Development and Innovation: Cross-Country Evidence.”Journal of Financial Economics, 112 (2014), 116–135.
Jaffe, A. B.; M. Trajtenberg; and M. S. Fogarty. “Knowledge Spillovers and Patent Citations: Evidencefrom a Survey of Inventors.” American Economic Review, 90 (2000), 215–218.
Johnson, P.; V. Heimann; and K. O’Neill. “The ‘Wonderland’ of Virtual Teams.” Journal of WorkplaceLearning, 13 (2001), 24–30.
Kahn, C., and A. Winton. “Ownership Structure, Speculation, and Shareholder Intervention.” Journalof Finance, 53 (1998), 99–129.
Kaplan, S. N., and L. Zingales. “Do Investment-Cash Flow Sensitivities Provide Useful Measures ofFinancing Constraints?” Quarterly Journal of Economics, 112 (1997), 169–215.
Kaufmann, D.; A. Kraay; and M. Mastruzzi. “The Worldwide Governance Indicators: Methodologyand Analytical Issues.” Hague Journal on the Rule of Law, 3 (2011), 220–246.
Keller, W. “Geographic Localization of International Technology Diffusion.” American EconomicReview, 92 (2002), 120–142.
Koh, P.-S., and D. M. Reeb. “Missing R&D.” Journal of Accounting and Economics, 60 (2015), 73–94.La Porta, R.; F. Lopez-de-Silanes; and A. Shleifer. “What Works in Securities Laws?” Journal of
Finance, 61 (2006), 1–32.Lau, S. T.; L. Ng; and B. Zhang. “The World Price of Home Bias.” Journal of Financial Economics,
97 (2010), 191–217.Leuz, C.; K. V. Lins; and F. E. Warnock. “Do Foreigners Invest Less in Poorly Governed Firms?”
Review of Financial Studies, 23 (2010), 3245–3285.MacGarvie, M. “Do Firms Learn from International Trade?” Review of Economics and Statistics, 88
(2006), 46–60.Manso, G. “Motivating Innovation.” Journal of Finance, 66 (2011), 1823–1860.Nanda, R., and M. Rhodes-Kropf. “Investment Cycles and Startup Innovation.” Journal of Financial
Economics, 110 (2013), 403–418.National Research Council. “Measuring Innovation.” In Capturing Change in Science, Technology,
and Innovation, R. E. Litan, A. W. Wyckoff, and K. Husbands Fealing, eds. Washington, DC:National Academies Press (2014).
Ng, L.; F. Wu; J. Yu; and B. Zhang. “Foreign Investor Heterogeneity and Stock Liquidity around theWorld.” Review of Finance, 20 (2016), 1867–1910.
Park, W. G. “International Patent Protection: 1960–2005.” Research Policy, 37 (2008), 761–766.Pawar, K. S., and S. Sharifi. “Virtual Collocation of Design Teams: Coordinating for Speed.” Interna-
tional Journal of Agile Management Systems, 2 (2000), 104–113.Prasad, K., and K. B. Akhilesh. “Global Virtual Teams: What Impacts Their Design and Perfor-
mance?” Team Performance Management: An International Journal, 8 (2002), 102–112.Ratcheva, V., and S. Vyakarnam. “The Challenges of Virtual Partnerships: Critical Success Factors in
the Formation of Inter-Organisational Teams.” AI & Society, 15 (2001), 99–116.Seru, A. “Firm Boundaries Matter: Evidence from Conglomerates and R&D Activity.” Journal of
Financial Economics, 111 (2014), 381–405.Shleifer, A., and R. W. Vishny. “Large Shareholders and Corporate Control.” Journal of Political
Economy, 94 (1986), 461–488.Solow, R. M. “Technical Change and the Aggregate Production Function.” Review of Economics and
Statistics, 39 (1957), 312–320.Stein, J. C. “Takeover Threats and Managerial Myopia.” Journal of Political Economy, 96 (1988),
61–80.Tian, X., and T. Y. Wang. “Tolerance for Failure and Corporate Innovation.” Review of Financial
Studies, 27 (2014), 211–255.
https://doi.org/10.1017/S0022109017000497D
ownloaded from
https://ww
w.cam
bridge.org/core . Tsinghua University , on 19 Jan 2018 at 02:45:22 , subject to the Cam
bridge Core terms of use, available at https://w
ww
.cambridge.org/core/term
s .

1490 Journal of Financial and Quantitative Analysis
Trott, P. Innovation Management and New Product Development. Harlow, England: FinancialTimes/Prentice Hall (2008).
Voss, C. A. “Rethinking Paradigms of Service: Service in a Virtual Environment.” International Jour-nal of Operations and Production Management, 23 (2003), 88–104.
Wahal, S., and J. J. McConnell. “Do Institutional Investors Exacerbate Managerial Myopia?” Journalof Corporate Finance, 6 (2000), 307–329.
Walters, D., and J. Buchanan. “The New Economy, New Opportunities and New Structures.”Management Decision, 39 (2001), 818–834.
World Intellectual Property Organization. “Fields of Intellectual Property Protection.” In IntellectualProperty Handbook. Geneva, Switzerland: World Intellectual Property Organization (2004).
Wright, D. T., and N. D. Burns. “New Organisation Structures for Global Business: An EmpiricalStudy.” International Journal of Operations and Production Management, 18 (1998), 896–923.
Xie, F.; B. Zhang; and W. Zhang. “Does Trust Create a Culture of Innovation?” Working Paper, Uni-versity of New South Wales (2016).
https://doi.org/10.1017/S0022109017000497D
ownloaded from
https://ww
w.cam
bridge.org/core . Tsinghua University , on 19 Jan 2018 at 02:45:22 , subject to the Cam
bridge Core terms of use, available at https://w
ww
.cambridge.org/core/term
s .