how do mergers and acquisitions foster corporate
TRANSCRIPT

How Do Mergers and Acquisitions Foster Corporate Innovation? Inventor-level Evidence*
Kai Li
Sauder School of Business, University of British Columbia 2053 Main Mall, Vancouver, BC V6T 1Z2
Jin Wang Lazaridis School of Business and Economics, Wilfrid Laurier University
75 University Avenue West, Waterloo, ON N2L 3C5 [email protected]
This version: January 2020
Abstract
Using a large and unique inventor-level dataset over the period 1981 to 2006, we examine inventor patenting performance to shed light on how acquiring firms benefit from mergers and acquisitions (M&As). We first show that post-merger, while acquirer inventors’ patenting performance improves, target inventors’ patenting performance deteriorates. However, when limiting patenting output in target firm’s core area, we find that target inventors produce more patents and more citation-weighted patents compared to acquirer inventors. Using a quasi-experiment involving withdrawn bids, we then demonstrate that there is a causal effect of M&As on recombinations of inventor teams and knowledge domains. Moreover, we show that post-merger, recombinations of teams and knowledge domains are associated with more impactful and radical patents. Finally, we provide suggestive evidence on the role of incentives in post-merger inventor patenting performance. We conclude that acquiring talent and recombination are the key channels through which mergers and acquisitions foster corporate innovation. Keywords: innovation, mergers and acquisitions, acquiring talent, recombination, knowledge domain, inventor team, impactful innovation, radical innovation, risk-taking JEL classification: G34, O32, O34
* We thank helpful comments from Ramin Baghat (discussant), Shai Bernstein, Bo Bian, Alvin Chen, Ding Dong, Mariassunta Giannetti, Camille Hebert, Dalida Kadyrzhanova, Omesh Kini, Xing Liu, Antonio Macias, Qinxi Wu, seminar participants at Baylor University, the Central University of Finance and Economics, City University of Hong Kong, Development Bank of Japan, Georgia State University, Renmin University, Texas Christian University, and York University, and conference participants at the Workshop on Corporate Governance and Investor Activism (Stockholm). We thank Xing Liu and William Zheng for excellent research assistance. Li acknowledges financial support from the Social Sciences and Humanities Research Council of Canada (Grant Number: 435-2018-0037). All errors are our own.

How Do Mergers and Acquisitions Foster Corporate Innovation? Inventor-level Evidence
Abstract Using a large and unique inventor-level dataset over the period 1981 to 2006, we examine inventor patenting performance to shed light on how acquiring firms benefit from mergers and acquisitions (M&As). We first show that post-merger, while acquirer inventors’ patenting performance improves, target inventors’ patenting performance deteriorates. However, when limiting patenting output in target firm’s core area, we find that target inventors produce more patents and more citation-weighted patents compared to acquirer inventors. Using a quasi-experiment involving withdrawn bids, we then demonstrate that there is a causal effect of M&As on recombinations of inventor teams and knowledge domains. Moreover, we show that post-merger, recombinations of teams and knowledge domains are associated with more impactful and radical patents. Finally, we provide suggestive evidence on the role of incentives in post-merger inventor patenting performance. We conclude that acquiring talent and recombination are the key channels through which mergers and acquisitions foster corporate innovation. Keywords: innovation, mergers and acquisitions, acquiring talent, recombination, knowledge domain, inventor team, impactful innovation, radical innovation, risk-taking JEL classification: G34, O32, O34
1
“…Red Hat is expected to bring three things to IBM: the world’s largest portfolio of open source technology, their innovative hybrid cloud platform, and a vast open source developer community. That’s according to a spokesperson for IBM, who explained that “IBM has been investing to lead in the emerging, high value segments of the IT industry. Red Hat represents the latest and largest move as part of that high value strategy. Together, we become the world’s leading hybrid multi-cloud provider. This is a game-changer for the cloud industry.”1 - Forbes, November 3, 2018
1. Introduction
Corporate innovation is a key driver to firm competitiveness, productivity, and firm value (e.g.,
Pakes 1985; Romer 1990; Aghion and Howitt 1992; Hall, Jaffe, and Trajtenberg 2005). In recent
years, many technology firms have significantly expanded their innovative capabilities through
acquisitions. High-profile examples include IBM’s purchase of open-source software and cloud
services company Red Hat (see the quote above), and Microsoft’s acquisition of open-source
software platform GitHub. In this paper, we fill a void in the literature by examining post-merger
inventor patenting performance to shed light on how acquiring firms benefit from mergers and
acquisitions (M&As).
Management scholars have long held the view that innovation within a firm is often path
dependent, and firms turn to external sources to expand their innovative capacities – hiring,
strategic alliances, and M&As (Cohen and Levinthal 1990; Kogut and Zander 1992; Mowery,
Oxley, and Silverman 1996; Song, Almeida, and Wu 2003). Unlike hiring and forming alliances,
the advantage of M&As derives from the fact that they bring completely new systems, processes,
and routines into the acquiring firm, as well as the people with the management and
technological skills to implement and incorporate them (Kogut and Zander 1996; Phene,
1 https://www.forbes.com/sites/panosmourdoukoutas/2018/11/03/3-things-ibm-sees-in-red-hat-that-others-missed/#2fef205d24cf, accessed on March 9, 2019.
2
Tallman, and Almeida 2012). M&As thus provide the opportunity for acquirers to engage in
path-breaking innovation.
Motivated by recent mega-deals in the technology space (e.g., Microsoft purchases of
Skype and GitHub, and IBM’s purchase of Red Hat), we propose two mutually non-exclusive
human capital-specific channels through which M&As could potentially benefit corporate
innovation: 1) the acquiring talent channel whereby retained target inventors produce patents for
their acquirer, especially in the target firm’s core area; and 2) the recombination channel
whereby acquirers tap into people and knowledge that otherwise would be inaccessible for them
to form teams with diverse knowledge domains and innovation experience. Moreover, we show
that post-merger compensation scheme is more tolerant of experimentation and failure than that
during the normal course of business (Harford and Li 2007; Manso 2011), which helps
incentivize inventors of the merged firm to engage in path-breaking innovation.
To examine inventor patenting performance post-merger, we compile a large and unique
inventor-level dataset that allows us to track inventors from their entry into the Harvard Business
School (HBS) U.S. Patent Inventor Database (Li et al. 2014) since 1975. We match inventor-
level information with firm-level assignee information provided by the National Bureau of
Economic Research (NBER) Patent Citations Date File (Hall, Jaffe, and Trajtenberg 2005),
which ends in 2006, to track inventor careers and identify any job changes associated with
M&As.
There are two clear benefits of using inventor-level data in our analysis. First, it allows us
to examine how acquirers benefit from hiring target inventors by tracking target inventors and
their patenting output post-merger. Second, it allows us to examine recombinations of teams and
knowledge domains by tracking target inventors and their citation patterns behind path-breaking

3
innovation post-merger. Firm-level patenting data will not allow us to delineate how a target firm
and its employees contribute to the innovation performance of the combined firm.
To capture an inventor’s patenting performance, in addition to number of patents and
number of citation-weighted patents (e.g., Aghion, Van Reenen, and Zingales 2013; Acharya,
Baghai, and Subramanian 2014; Bena and Li 2014), we introduce two new measures of path-
breaking innovation to the M&A literature – impactful patents based on (ex post) number of
citations (e.g., Balsmeier, Fleming, and Manso 2017; Eggers and Kaul 2018), and radical patents
based on (ex ante) unprecedented recombination of knowledge (e.g., Weitzman 1998; Eggers
and Kaul 2018; Bernstein, Diamond, McQuade, and Pousada, 2019).
Using a sample of 358,016 inventor-year observations (representing 58,173 acquirer
inventors and 8,558 target inventors) in 412 completed deals announced between 1981-1998, we
first show that post-merger, while acquirer inventors’ patenting performance in terms of the
number of patents (citation-weighted patents) improves, target inventors’ patenting performance
deteriorates. This might not be surprising as target firms and their employees take the brunt of
disruption associated with a deal (Ranft and Lord 2002; Seru 2014).
To address the possibility that the above performance results are driven by selection, i.e.,
firms with increasing (decreasing) inventor performance are more likely to be acquirers (target
firms), rather than treatment—the effect of M&As on inventor performance, we exploit a quasi-
experiment in which the control group is a sample of failed bids due to reasons unrelated to
innovation. As such, we can difference out any selection effects by comparing the patenting
performance of inventors in the completed deal sample pre- and post-merger with that of
inventors in the withdrawn bid sample (i.e., the control group). We find that as far as inventor
4
patenting performance is concerned, there is no significant treatment effect; instead, our results
suggest that firms whose inventors have peaked are more likely to be taken over.
To examine the acquiring talent channel, we compare post-merger patenting performance
of target inventors with that of acquirer inventors matched by core technology class, i.e., the
technology class in which an inventor has the greatest number of patents prior to a deal, and with
similar patenting productivity pre-merger. We first show that post-merger, target inventors
produce fewer patents (citation-weighted patents) relative to acquirer inventors. On the surface,
this finding seems to be inconsistent with the acquiring talent channel. However, when limiting
patenting output in target firm’s core area, i.e., the technology class in which the target firm has
been granted the greatest number of patents prior to a deal, we find that post-merger, target
inventors produce more patents (citation-weighted patents) than do acquirer inventors, consistent
with the acquiring talent channel. Moreover, this effect is stronger for target inventors who are
star inventors, i.e., an inventor whose total number of citations is in the top 5th percentile among
all inventors (Baghai, Silva, and Ye 2018), or who have a broader collaborative network, further
supporting the acquiring talent channel.
To examine the recombination channel, we introduce the concept of a firm’s knowledge
domain as the sum of its portfolio of patents and citations made by those patents over the past
five years following Benner and Tushman (2002). Using the same quasi-experiment involving
withdrawn bids, we show that there is a causal effect of deal completion on recombinations: Both
the number of patents by joint teams of acquirer and target inventors and the number of patents
citing both firms’ knowledge domains increase significantly over time for completed deals
compared to those for firms with failed bids. We further show that post-merger, patents produced
by joint teams of acquirer and target inventors are more likely to be impactful and radical.

5
Moreover, when acquirer inventors citing target’s knowledge domain, their patents are more
likely to be radical; and when target inventors citing acquirer’s knowledge domain, their patents
are more likely to be both impactful and radical. Our findings provide support for the
recombination channel whereby M&As allow firms to tap into people and knowledge that
otherwise would be inaccessible for them, leading to more impactful and radical innovation.
Holmstrom (1989) argues that innovative activities involve the exploration of untested
and unknown approaches that are time consuming and have a high probability of failure. As
such, acquirer management might forgo R&D projects that are beneficial to long-term firm
value. Manso (2011) posits that the optimal innovation-motivating incentive scheme does not
punish short-term failure and rewards long-term success. Harford and Li (2007) show that
acquirer CEOs’ pay following a merger becomes markedly insensitive to performance, with
large new grants of options and restricted stock coming even if the merged firm underperforms.
The bright side of such CEO entrenchment is that it creates an environment conducive to
corporate innovation (Manso 2011). We show that post-merger, acquirers’ risk-taking incentives,
including CEO and employee option grants and employee job security, increase significantly.
Consistent with such environment, we find that specialist inventors, whose prospects are more
sensitive to their employer’s level of risk tolerance (Custódio, Ferreira, and Matos 2019),
produce more impactful and radical patents post-merger. Taken together, our results support the
notion that post-merger, the incentive scheme at the combined firm fosters path-breaking
innovation.
Our paper is most closely related to an emerging strand of the literature examining the
human capital factor in acquisitions. Ouimet and Zarutskie (2016), Beaumont, Hebert, and
Lyonnet (2019), and Chen, Gao, and Ma (2020) show that the desire to gain human capital is a
6
key impetus for corporate takeovers. Tate and Yang (2016) find that diversifying mergers are
more likely to take place among industry pairs with high human capital transferability and that
such acquisitions result in larger labor productivity gains and fewer post-merger divestitures.
Lee, Mauer, and Xu (2018) show that M&As are more likely and announcement period returns
and post-merger performance are higher when merging firms have related human capital.
Lagaras (2018) and Ma, Ouimet, Simintzi (2018) highlight the scope of post-merger labor
restructuring in target firms.2 Seru (2014) is one of the first papers to present evidence on post-
merger target inventor turnover and productivity. He finds that the likelihood of target inventors
leaving increases by around 80%, and that the average number of citations per patent by target
inventors drops by 70% after M&As.
Our paper is also related to the literature on incentive schemes that motivate innovation.
Manso (2011) proposes that an optimal innovation-motivating managerial incentive scheme
includes stock options with long vesting periods, option repricing, golden parachutes, and
entrenchment. Moreover, commitment to a long-term compensation plan and job security are
essential to motivate rank-and-file employees to engage in innovation. Ederer and Manso (2013)
provide experimental evidence in support of Manso (2011). Aghion, Van Reenen, and Zingales
(2013) find that the probability of CEO firing after poor performance is reduced with more
institutional ownership, contributing to the causal effect of more institutional ownership on more
corporate innovation. Acharya, Baghai, and Subramanian (2014) show that wrongful discharge
laws that protect employees against unjust dismissal spur innovation. Using a sample of newly
public firms, Baranchuk, Kieschnick, and Moussawi (2014) show that managers are better
2 Focusing on physical assets, Maksimovic, Phillips, and Prabhala (2011) find extensive restructuring post-merger: Almost half of target firms’ plants are sold or closed within the three-year window after deal completion. Both Maksimovic et al. (2011) and Li (2013) show that retained target firms’ plants increase in productivity. Li (2013) further note that the increase in productivity is driven by more efficient use of capital and labor.

7
motivated to pursue innovation after their firms go public when they are given more incentive
compensation and shielded from the risk of early termination. Chang, Fu, Low, and Zhang
(2015) document a positive risk-taking incentive effect of employee stock options on corporate
innovation. In the setting of hedge fund activism, Brav, Jiang, Ma, and Tian (2018) show that
managerial incentive changes as captured by longer tenure and higher ownership stake post-
hedge fund interventions are positively associated with improvement in targeted firms’
innovation performance. In an international setting, Griffin, Li, and Xu (2020) find that long-
term CEO incentives are positively associated with corporate innovation, particularly with high-
impact, exploratory invention.
Finally, our paper is also related to the vast and still growing literature on corporate
innovation, especially the strand focusing on the role of inventor characteristics in knowledge
transfer and high-variance innovation. Singh (2005) finds that inventor collaborative networks
are important in explaining knowledge diffusion across regional or firm boundaries. Taylor and
Greve (2006) suggest that teams with diverse knowledge domains are more likely to generate
cutting-edge ideas and novel combinations of knowledge components. Baghai, Silva, and Ye
(2018) and Jaravel, Petkova, and Bell (2018) emphasize the importance of team capital in
inventor patenting performance. Bernstein et al. (2019) show that immigrant inventors are more
productive than native inventors and contribute significantly to both the importation and
diffusion of ideas across borders.
Our paper makes two contributions. First, it provides new, large sample inventor-level
evidence on the specific channels – acquiring talent and recombination – through which M&As
foster corporate innovation.3 Second, it highlights a number of target inventor characteristics that
3 Cunningham, Ederer, and Ma (2019) show that about 6% of acquisitions in the pharmaceutical industry are killer acquisitions whereby incumbent firms may acquire innovative targets solely to discontinue the latter’s competing

8
are beneficial to acquirers in terms of talent acquisition. More broadly, our paper and its findings
suggest that M&As are one way to address the pressing issue of “ideas are getting hard to find”
(Bloom, Jones, Van Reenen, and Webb 2019).
2. The Conceptual Framework
2.1. M&As and path-breaking innovation
Management scholars have long held the view that innovation within a firm is often path
dependent (Cohen and Levinthal 1990). Although firms internally develop much of the
knowledge that they use to generate innovation, few firms possess all the inputs required for
successful and continuous technological development (Kogut and Zander 1992). As a result,
firms often turn to external sources to expand their knowledge building and innovative capacities
– hiring, strategic alliances, and M&As (Mowery, Oxley, and Silverman 1996; Rosenkopf and
Almeida 2003; Song, Almeida, and Wu 2003; Li, Qiu, and Wang 2019).
The core competency of an innovative firm comprises technological areas in which it
possesses comparative advantage (e.g., the hybrid cloud platform of Red Hat), and in which
innovative activity is especially intensive (Palomeras and Melero 2010). Given that knowledge
from core technological areas is an important source of firm value, firms tend to build structures
to harness it. As a result, the core knowledge is deeply embedded in a firm’s past experiences
and its resulting managerial systems, processes, routines, and people (Ranft and Lord 2002,
Phene, Tallman, and Almeida 2012), which hampers knowledge transfer through employee
mobility or alliances (Hoetker and Agarwal 2007).
projects. In this paper, we examine M&As across all industries and our results suggest that killer acquisitions are not that prevalent outside the pharmaceutical industry.
9
Unlike hiring and forming alliances, the advantage of M&As in expanding knowledge
building and innovative capacities derives from the fact that they bring completely new systems,
processes, and routines into the acquiring firm, as well as the people with the management and
technological skills to implement and incorporate them (Kogut and Zander 1996; Ahuja and
Katila 2001; Ranft and Lord 2002; Phene, Tallman, and Almeida 2012). M&As thus provide the
opportunity for acquirers to engage in path-breaking innovation.
One form of path-breaking innovation is radical innovation, which combines knowledge
from domains that might usually not be connected (e.g., Weitzman 1998; Eggers and Kaul 2018;
Bernstein et al. 2019). Through acquisitions, firms will be able to tap more easily into knowledge
domains and people that otherwise would be inaccessible for them. Moreover, target inventors
may be uniquely positioned to facilitate acquiring firms to explore novel combinations of
knowledge acquired in their home firms, together with technologies to which they are exposed in
their home firms. Taylor and Greve (2006) suggest that teams with diverse knowledge domains
are associated with more novel knowledge combinations. We thus expect that M&As facilitate
radical innovation.
In this paper, we propose two mutually non-exclusive human capital-specific channels
through which M&As could potentially benefit corporate innovation.
2.2. The acquiring talent channel
One immediate consequence of M&As is that an acquirer gains access to its target firm’s
inventors. Under the acquiring talent channel, we expect that post-merger, retained target
inventors produce more patents for their acquirer, especially in target firm’s core area that
potentially fills a void in acquirer’s innovative capacities (see the Red Hat quote above). We also
expect the above effect to differ across a number of inventor characteristics.
10
First, the capability of a target inventor to contribute to innovation in the merged firm
might depend on whether her pre-merger team is retained. On the one hand, recent studies (e.g.,
Baghai et al. 2018; Jaravel et al. 2018) show that team capital is an important factor in inventor
productivity. Thus, loss of key collaborators might negatively affect an inventor’s post-merger
productivity. On the other hand, an inventor may choose to stay in the merged firm in spite of the
departure of her key collaborators, a self-selection (e.g., due to her less dependence on
collaborators) that might mitigate the negative effect on her productivity. It is thus an empirical
question whether the loss of key collaborators negatively affects target inventors’ post-merger
productivity.
Second, the potential of a target inventor to contribute to innovation in the merged firm
might depend on whether she is a star inventor or not, i.e., inventors who have the most number
of citations. On the one hand, past productivity breeds future productivity given that knowledge
creation is cumulative (see the survey by Jones, Reedy, and Weinberg 2014). On the other hand,
M&As are a watershed event to the research environment of retained target inventors (Ranft and
Lord 2002), who might have a hard time to adapt to the research culture/environment of the
acquirer, leading to lower productivity post-merger. If acquiring talent is one important motive
of M&As, we would expect star target inventors to continue to outperform compared to other
target inventors.
Third, a target inventor’s network might enhance her contribution to innovation in the
merged firm. A broader collaborative network is likely indicative of an inventor’s stronger
ability to fit in the new workplace environment by forming new teams. Such network also
provides the inventor with more options to cope with the loss of her collaborators due to the

11
merger, if there is any. We thus expect that target inventors with a broad network to outperform
those with a small network post-merger.
Finally, we consider the degree of inventor specialization. Specialization could either
strengthen or weaken an inventor’s productivity post-merger. A specialist target inventor might
be more (less) useful if her expertise is (not) in the area the merged firm wants to develop. Thus,
it is an empirical question whether specialist target inventors contribute more in the merged firm
than do generalist target inventors.
2.3. The recombination channel
The property rights theory of the firm developed by Grossman and Hart (1986) and Hart
and Moore (1990) and its extension to M&As by Rhodes-Kropf and Robinson (2008), posit that
complementary assets should be combined under common ownership in a world with incomplete
contracting. Fulghieri and Sevilir (2019) develop a model of mergers between firms with greater
human capital complementarity and show that post-merger, an acquirer relies on employee
human capital in realizing the benefit of collaboration, increasing the likelihood of employee
retention and higher wage increase. Anticipating the importance of their human capital,
employees become ex ante more willing to choose collaboration over competition, resulting in a
greater likelihood of successful human capital integration. Their paper provides a theoretical
justification for why mergers between firms with greater human capital complementary lead to
better merger performance (e.g., Lee, Mauer, and Xu 2018). To the extent that M&As are used to
place complementary assets including human capital attached to those assets under one roof,
common ownership should lead to more efficient usage of those complementary assets through
recombination.
12
Radical innovation, by definition, is combination of knowledge from domains that might
usually not be connected (e.g., Weitzman 1998; Eggers and Kaul 2018; Bernstein et al. 2019).
Through acquisitions, firms can tap into knowledge domains and people that otherwise would be
inaccessible for them or too costly to access due to incomplete contracting. Taylor and Greve
(2006) suggest that teams with diverse knowledge domains are more likely to generate cutting-
edge ideas and novel combinations of knowledge components. However, innovation, especially
radical innovation, involves the exploration of new untested approaches that are likely to fail
(Holmstrom 1989). Thus, a culture of tolerance for failure is called for to support path-breaking
innovation endeavor. Manso (2011) and Ederer and Manso (2013) posit that the optimal
innovation-motivating incentive scheme exhibits an asymmetry in pay-for-performance –
sensitive to positive performance and less sensitive to negative performance. Harford and Li
(2007) find that following a merger, an acquirer CEO’s pay and overall wealth become
insensitive to negative stock performance, but her wealth rises in step with positive stock
performance. The combination of Manso (2011), Ederer and Manso (2013), and Harford and Li
(2007) suggests that a bright side of the decoupling of CEO pay from shareholder value in
M&As is that it helps foster a corporate culture that is more tolerant of failure and hence
encourages radical innovation. Under the recombination channel, we expect that post-merger,
acquirer inventors (target inventors) would produce more impactful and radical patents compared
to what they do pre-merger. We also expect the above effect to differ by an inventor’s degree of
specialization. On the one hand, being a specialist has few outside options if her innovation
endeavor fails (Custódio, Ferreira, and Matos 2019). In a post-merger firm with a risk-taking
culture, specialist inventors are encouraged to take on more risk and will produce more radical
patents. On the other hand, radical innovation entails unprecedented combinations of knowledge.
13
Being a specialist, by construction, limits the scope for experimentation, leading to fewer radical
patents (Taylor and Greve 2006). If the culture shift to more risk-taking is an important factor,
we expect specialist inventors to engage in more path-breaking innovation.
3. Sample Formation and Variable Constructions
3.1. The M&A sample and inventor samples
Our M&A sample comes from Thomson Financial’s SDC Platinum Database on Mergers
and Acquisitions. We start with all U.S. completed deals announced from January 1, 1981 to
December 31, 1998. We impose the following filters to obtain our final sample: 1) the deal is
classified as “Acquisition of Assets (AA)”, “Merger (M),” “Acquisition (A)”, or “Acquisition of
Majority Interest (AM)” by the data provider; 2) both the acquirer and target are a U.S. public
firm; 3) the acquirer holds less than 50% of the shares of the target firm before deal
announcement and ends up owning 100% of the shares of the target firm through the deal; 4) the
deal value is at least $1 million (in constant 2001 dollars); 5) the relative size of the deal (i.e., the
ratio of transaction value over book value of acquirer total assets) is at least 1%, and 6) both the
acquirer and its target firm have at least one inventor in the year prior to the deal announcement.
We end up with a sample of 412 completed deals.
Our sample period starts in 1981, when data coverage on M&As started. Our M&A
sample ends in 1998 for the following reason. The year 2006 was the last year in which patenting
information from the NBER Patent Citations Date File (Hall, Jaffe, and Trajtenberg, 2005) is
available; given the well-known patent approval lag between application and award, the year
2004 would be the last year in which patent-related measure do not suffer serious truncation bias.
Since we require a five-year window after the year of deal completion to examine post-merger

14
innovation outcome, the last year for announced deals to have a full five-year post-merger
window is the year 1998.
The NBER Patent Citations Data File (henceforth, the NBER database) contains
application dates of granted patents, the number of citations received by these patents, as well as
information on the technology classes of patents. It also has the list of assignees of a patent,
which are typically firms or their subsidiaries where the research is conducted. Important for our
purpose, the NBER database provides a unique identifier for each assignee, which is necessary
for us to establish inventor-employer linkage and keep track of inventors’ career path (more on
this in Appendix A).4 The NBER database is linked to Compustat for patents applied for between
1975 and 2006; we use this information to link patent assignees to their corporate parents.
The data on individual inventors is from the HBS U.S. Patent Inventor Database (Li et al.
2014, henceforth, the HBS database), which is based on information from the USPTO. The HBS
database covers over 4.2 million patent records and 3.1 million inventors for the period 1975 to
2010. Important for our purpose, it contains disambiguated inventor names which allows us to
track the careers of inventors across firms.
In our analysis, the place of employment of an inventor is identified by the assignee of
her patent (a Compustat firm). For example, an inventor who applies for one patent with firm A
in 2000 and another with firm B in 2005 is assumed to be an employee of firm A in 2000 and an
employee of firm B in 2005. We then assume that her job change takes place at the midpoint
4 Here is an example to illustrate the importance of a unique identifier for each assignee to help us track the career of an inventor. For example, the assignee names in the original patent records could be “IBM”, “IBM Corp.”, “IBM Business Machines Corp.”, “IBM Corp INT Business Machines Corporation”, “IBM Corp. of Armonk”. Nonetheless, they all share the same unique assignee ID in the NBER database. Unless the assignee ID is different, we assume an inventor with the same assignee ID as working for the same employer (i.e., no career change). As far as we are aware of, the NBER database is the only data source available that has the complete list of patent assignees as well as an unique ID for each assignee.
15
between the two patent application years following the convention (e.g., Song, Almeida, and Wu
2003; Liu, Mao, and Tian 2017). Inventors are included in the sample for their entire active
career, i.e., the period between the year of their first and the year of their last patent applications.
A detailed description of our matching scheme to link inventors in the HBS database with
assignees (and hence Compustat firms) in the NBER database is provided in Appendix A.
The acquirer (target) inventor sample consists of inventors who are with the acquirer
(target firm) in the year right before deal announcement (ayr-1). Specifically, we track an
inventor’s employment history based on the steps in Appendix A, i.e., we know her place of
employment for each year during her active career. An acquirer (target) inventor is identified as
the one whose active career spans ayr-1 and whose employer at that particular point in time (i.e.,
ayr-1) is the acquirer (target firm). We then construct an unbalanced panel data set consisting of
acquirer (target) inventors from ayr-5 to ayr-1 and from one year after deal completion (cyr+1)
to five years after deal completion (cyr+5). For each acquirer (target) inventor, the time series
information about her starts from the earlier of ayr-5 or the first year in which her employer is
the acquirer (target) and ends at the earlier of cyr+5 or the last year in which her employer is the
acquirer (target) or the merged firm.
In the end, our sample comprises 358,016 inventor-year observations (and 58,173
acquirer inventors affiliated with 315 acquirers and 8,558 target inventors affiliated with 409
targets) in 412 completed deals over the period 1981-1998.5 We have more target firms than
acquirers because some acquirers make multiple deals, and we also have more deals than target
firms because some target firms are sold multiple times over the sample period.
5 Among the 412 deals in our sample, there are 35 (24) deals in which the acquirer (target firm) is in the drug industry (SIC code = 283); and 15 deals in which both the acquirer and its target firm are in the drug industry. To the extent that the incentive to kill innovation in target firms applies to those deals in our sample, it would reduce the chance of us finding evidence in support of acquiring talent or recombining teams/knowledge domains.
16
3.2. Key variables
To capture the quantity of an inventor’s patenting output, we use # of patents which is the
natural logarithm of one plus the number of granted patents applied for by an inventor in year t.
To capture the quality of an inventor’s patenting output, we use # of citation-weighted patents
which is the natural logarithm of one plus the total number of citations received during the five-
year period since the grant date of an inventor’s patents applied for in year t.
To capture path-breaking innovation, we introduce two new measures to the M&A
literature – impactful patents based on (ex post) number of citations (Phene, Tallman, and
Almeida 2012; Balsmeier, Fleming, and Manso 2017; Eggers and Kaul 2018), and radical
patents based on (ex ante) unprecedented recombination of knowledge (e.g., Weitzman 1998;
Eggers and Kaul 2018; Bernstein et al. 2019). Specifically, # of impactful patents is the natural
logarithm of one plus the number of an inventor’s impactful patents applied for in year t, and # of
radical patents is the natural logarithm of one plus the number of an inventor’s radical patents
applied for in year t. A patent is impactful if its number of citations (received up to 2006) is in
the top 5th percentile among patents applied for in the same technology class-year. A patent is
radical if it draws on knowledge that has never or rarely been used before by inventors in the
same field. The measure looks at the class-to-class citation pattern of patents to determine how
rare a given citation is. If patents in Class A frequently cite patents in Class B, then a new A-to-B
citation would be common and expected (i.e., not rare or radical). If, however, hardly any patent
in Class A had cited a Class B patent in the last five years, then such a citation would signal an
attempt at a more radical recombination. At the patent-level, the measure looks at all citations a
patent makes and takes the value of the most unlikely citation. We define radical patents as those

17
in the top 5th percentile among granted patents applied in the same technology class-year using
Eggers and Kaul’s (2018) measure of radical invention.6
We also introduce a number of inventor-specific characteristics to shed light on the two
channels. Inventor significant co-inventor stay is an indicator variable that takes the value of one
if at least one significant co-inventor works for the merged firm over the period cyr+1 to cyr+5,
and zero otherwise. A significant co-inventor is a collaborator to a focal inventor whose joint
number of patents is more than 50% of the focal inventor’s total number of patents over the past
five years. Both Baghai, Silva, and Ye (2018) and Jaravel, Petkova, and Bell (2018) emphasize
the importance of team capital in knowledge creation. Star inventor is an indicator variable that
takes the value of one if an inventor’s number of citations (received up to 2006) for granted
patents applied up to year ayr-1 is in the top 5th percentile among all inventors in the HBS
database, and zero otherwise (Baghai, Silva, and Ye, 2018). Inventor network size is the natural
logarithm of one plus the number of unique inventors who have collaborative link of no more
than two teams away from the focal inventor up to year ayr-1. Put differently, this is a measure
of the number of co-inventors and their co-inventors. Singh (2005) finds that collaborative
networks are key to knowledge diffusion. Inventor specialization is the natural logarithm of one
plus the Herfindahl index based on the technology class-share of granted patents filed by an
inventor up to year ayr-1. The bigger this value is, the more specialized the inventor is in terms
of her patenting output. Taylor and Greve (2006) show that specialized inventors are associated
with less novel combinations of knowledge.
6 Applying textual analysis to patent filings, Bowen, Frésard, and Hoberg (2019) construct a measure of technological disruptiveness for individual patents. According to the authors, their measure captures “the extent to which it uses vocabulary that is new and is experiencing rapid growth across all patents compared to existing knowledge.” A key difference between their measure and the radical innovation measure in our study is that the latter is not based on the growth rate of a particular knowledge domain. Thus, it is a relatively clean measure of path-breaking innovation that could take place in either “hot” or “cold” technological areas.
18
3.3. Sample overview
Table 1 presents a sample overview. Panel A presents the temporal distribution of sample
deals for which we have information on their inventors and other deals for which we do not have
inventor information. Panel B compares our sample of M&A deals and their participating firms
with the sample of other deals without inventor information. In terms of deal characteristics, our
sample deals are more likely to involve an acquirer and its target firm in different industries (by
two-digit SIC codes), and are more (less) likely to use all cash (stock) as method of payment,
compared to their peer deals without information on inventors. In terms of acquirer firm
characteristics, our sample acquirers have higher sales, higher Tobin’s Q, better ROA, lower
leverage, and lower prior-year stock returns, than their peer deals without information on
inventors. In terms of target firm characteristics, our sample target firms have higher sales,
higher Tobin’s Q, and lower leverage, than their peer deals without information on inventors.
We conclude that despite of some differences between these two sets of firms, there
seems to be little reason to expect such differences would significantly affect how M&As change
corporate innovation in the merged firms.
3.4. Inventor overview
Table 2 presents the summary statistics of inventor patenting performance over the ten-
year window around deal completion (Panel A), inventor characteristics (Panel B), retained
versus departed target inventor characteristics (Panel C), and retained versus departed acquirer
inventor characteristics (Panel D) in the year just prior to deal announcement. In terms of
inventor patenting performance (Panel A), we show that target inventors on average produce
0.690 patents, generate 3.418 citation-weighted patents, and produce 0.056 impactful patents and

19
0.044 radical patents compared to acquirer inventors’ 0.767 patents, 3.954 citation-weighted
patents, 0.078 impactful patents, and 0.052 radical patents. By all metrics, acquirer inventors are
more productive, and produce more impactful and radical patents than target inventors.
In terms of inventor characteristics (Panel B), we show that target inventors experience
more significant disruption to their teams compared to acquirer inventors: More than half of
target inventors experience disruption to their collaborative teams, whereas less than a quarter of
acquirer inventors do. Interestingly, we show that target inventors are significantly more likely to
be star inventors than acquirer inventors, but the economic significance of the difference is minor
(5.7% of target inventors versus 5.2% of acquirer inventors). The average size of co-inventor
network is 14.96 for target inventors, and 25.57 for acquirer inventors. Finally, we show that
both groups of inventors have similar degrees of specialization.
When comparing retained and departed target/acquirer inventors (Panels C and D), we
first note that slightly over 60% of target inventors depart after deal completion, whereas about a
third of acquirer inventors depart after deal completion. Maksimovic et al. (2011) and Li (2013)
find that about half of target plants are retained. Seru (2014) shows that target inventor turnover
increases by 80% post-merger. Focusing on the pharmaceutical industry, Cunningham, Ederer,
and Ma (2019) find that about one fifth of inventors from target firms stay to work for the
acquirer. Our evidence supports the notion that target employees take the brunt of disruption
associated with a deal (Ranft and Lord 2002; Seru 2014; Lagaras 2018).
Next, we show that across both target and acquirer firms, retained investors are more
likely to have their significant co-inventor stay and to be star inventors, have slightly larger
networks, are less specialized, and are more productive in terms of their total number of patents
and citation-weighted patents as of ayr-1, than departed inventors. The evidence is indicative of a

20
strong selection effect whereby acquirers tend to retain more productive own and target
inventors. Moreover, we find that the merged firms are more likely to retain target inventors
whose core expertise is in the same area as the acquirer’s core expertise. Similarly, the merged
firms are more likely to retain acquirer inventors whose core expertise is in the same area as own
firm’s core expertise; whereas the merged firms are less likely to retain acquirer inventors whose
core expertise is in the same area as target firm’s core expertise. Using plant-level data,
Maksimovic et al. (2011) find that acquirers are more likely to retain target firm plants if they are
in target’s main division, or if they are related to acquirer’s main division. Both retained acquirer
and target firm plants experience improvement in productivity post-merger. They conclude that
the deployment and disposal of target firms’ assets by acquirers is broadly consistent with the
neoclassical comparative advantage view of firm growth. Our results regarding labor
redeployment post-merger complement their findings.7
4. Main Findings
4.1. Inventor patenting performance around M&As
A. The baseline
We run the following regression using a sample of acquirer (target) inventor-year
observations:
!"#$"%&'&)%*)%+,-,. = 0 + 2345%$'. + 6$789:- + !"#$"%&'9:+ + $+,-,., (1)
7 In untabulated analyses, we find that for target inventors, the correlations between # of patents and # of impactful patents and between # of patents and # of radical patents are 0.317 and 0.297, respectively; for acquirer inventors, the corresponding correlations are 0.385 and 0.324, respectively. In terms of target inventor characteristics, the correlations between Star inventor and Inventor network and between Star inventor and Inventor specialization are 0.273 and -0.284, respectively; for acquirer inventors, the corresponding correlations are 0.252 and -0.259, respectively. Overall, these pairwise correlations are similar between the target inventor sample and the acquirer inventor sample as of ayr-1.
21
where the dependent variable is either # of patents or # of citation-weighted patents (see detailed
definitions in Appendix B). After is an indicator variable that takes the value of one for the
period from cyr+1 to cyr+5, and zero for the period from ayr-5 to ayr-1. When we control for
deal fixed effects and there is no variation in firm characteristics within a deal, we do not need to
control for the characteristics of the acquirer or its target firm.8 When we control for inventor
fixed effects, there is no variation in inventor characteristics to control for.
Table 3 Panel A presents the OLS regression results for acquirer inventors. Columns (1)
and (2) present the results with deal fixed effects. We show that post-merger, acquirer inventors’
patenting performance significantly improves. In terms of economic significance, the number of
patents (citation-weighted patents) per year increases by 4.5 (= e0.044 – 1) (2.4) percent after the
completion of the deal.
Panel B columns (1) and (2) present the results with deal fixed effects for target
inventors. We show that post-merger, target inventors’ patenting performance significantly
deteriorates. In terms of economic significance, the number of patents (citation-weighted
patents) per year decreases by 4.9 (16.0) percent after the completion of the deal. This finding is
consistent with prior studies such as Ranft and Lord (2002) and Seru (2014).
When establishing a set of baseline results on inventor patenting performance around
M&As, we are mindful that acquirers may choose target firms with productive inventors (see the
Red Hat quote above) and/or keep the more productive inventors in acquirer/target firms (as
shown in Table 2 Panels C and D). This is the selection bias caused by the deal decision. As
such, the findings above reflect both the treatment and selection effects: M&As and associated
8 Since a firm may participate in different deals over the sample period, we control for deal fixed effects rather than firm fixed effects, so that our regression results are based on within-deal variations in inventor characteristics.
22
changes improve the productivity of retained acquirer and target inventors – the treatment effect,
and acquirers keep the most productive inventors – the selection effect.
To partially address the selection effect, next we include inventor fixed effects
throughout the examination period from pre-merger years to post-merger years. As such, we
effectively control for time-invariant inventor quality and can cleanly identify the change in
inventor patenting performance from pre- to post-deal completion associated with the
acquisitions – the treatment effect.
Panel A columns (3) and (4) present the results for acquirer inventors with inventor fixed
effects. The main findings remain unchanged: Acquirer inventors’ patenting performance
improves. In terms of economic significance, the number of patents (citation-weighted patents)
per year increases by 3.8 (1.0) percent after the completion of the deal. The results suggest that
acquirer inventors benefit from M&As in terms of improved patenting performance, consistent
with prior findings (e.g., Bena and Li 2014).
Panel B columns (3) and (4) present the results for target inventors with inventor fixed
effects. The main findings remain unchanged: Target inventors’ patenting performance drops. In
terms of economic significance, the number of patents (citation-weighted patents) per year
decreases by 5.7 (17.7) percent after the completion of the deal. Focusing on the pharmaceutical
industry, Cunningham, Ederer, and Ma (2019) find that retained target inventors experience a
productivity drop of 30% relative to their pre-merger productivity. These findings might not be
surprising as the target firm and its employees often take the brunt of disruption associated with a
deal (Ranft and Lord 2002; Seru 2014; Lagaras 2018). Indeed, columns (5) and (6) show that
although target inventors tend to perform worse after M&As, those whose teams largely remain
intact tend to perform a bit better. Overall, the evidence in Table 3 is consistent with the findings
23
in prior studies (Ranft and Lord 2002; Bena and Li 2014; Seru 2014) and does not provide
support for the acquiring talent channel.
B. The quasi-experiment
To address the possibility that the above performance results are driven by selection, i.e.,
firms with increasing (decreasing) inventor performance are more likely to be acquirers (target
firms), rather than treatment—the effect of M&As on inventor performance, we exploit a quasi-
experiment in which the control group is a sample of failed bids due to reasons unrelated to
innovation (Bena and Li 2014; Seru 2014). As such, we can difference out any selection
concerns by comparing the patenting performance of inventors in the completed deal sample pre-
and post-merger with that of inventors in the withdrawn bid sample (i.e., the control group).
To form the control sample, we identify withdrawn bids during the period 1981 – 1998
by manually examining the reason for withdrawal and excluding bids whose reason for
withdrawal is likely to be related to innovation performance. For each withdrawn bid, we then
try to identify completed deals in our sample using the following criteria: 1) the announcement
year of the completed deal is no more than one year away from the withdrawn bid; and 2) the
core area of the acquirer in the completed deal is the same as the core area of the acquirer in the
withdrawn bid. We obtain 38 completed deals matched to 21 withdrawn bids. The sample
consists of target (acquirer) inventor-year observations associated with those completed deals or
withdrawn bids over the period from ayr-5 to ayr-1 and the period from cyr+1 to cyr+5.
We then run the following difference-in-differences regression:
!"#$"%&'&)%*)%+,-,. = 0 + 2345%$'. + 2;45%$'. × =&>*8$%$?+,- + 6$789:- + $+,-,., (2)
where the dependent variables are the two measures of patenting performance as defined earlier.
After, is an indicator variable that takes the value of one for year cyr+1 to cyr+5, and zero
24
otherwise. Completed, is an indicator variable that takes the value of one for inventors in
completed deals, and zero otherwise. Deal fixed effects are included to control for deal/firm-
specific time-invariant unobservables that might drive the M&A decision and outcome variables.
Table 4 presents the results.
For acquirer inventors, we find that the coefficient on the interaction term After ´
Completed is not statistically different from zero, suggesting no significant treatment effect from
deal completion on acquirer inventor patenting performance. For target inventors, we find that
post-merger, both their number of patents and number of citation-weighted patents drop
significantly. Importantly, the coefficient on the interaction term After ´ Completed is not
statistically different from zero, suggesting no significant treatment effect from deal completion
on target inventor patenting performance.
In summary, using quasi-experiment to cleanly separate treatment from selection, as far
as inventor patenting performance is concerned, we show that there is no significant treatment
effect. Instead, our results suggest that firms whose inventors have peaked are more likely to be
taken over.
4.2. Acquiring talent
To further explore the acquiring talent channel, we focus on a sample of target inventors
retained by the acquirer and compare their patenting performance with a sample of incumbent
acquirer inventors matched by their pre-merger core technology class and pre-merger patenting
productivity. A priori, it is not clear what the proper benchmark is for target inventors’ patenting
performance post-merger. Given the summary statistics in Table 2 where we show
outperforming target inventors are retained and the results in Table 3 where we show target
inventors’ performance drops post-merger, using pre-merger target inventors’ patenting
25
productivity as a matching criterion sets a high bar for us to find any outperformance by target
inventors. Specifically, for each target inventor, matching acquirer inventors are identified using
the following criteria: 1) the acquirer inventor has the same core technology class as the target
inventor, where an inventor’s core class is the technology class in which the inventor has applied
for the most number of granted patents up to ayr-1; and 2) the absolute difference between the
number of granted patents applied for by the acquirer inventor and that by the target inventor up
to ayr-1 is no greater than four, which is the median difference for the sample of potential
matches. On average, each target inventor has about three matching acquirer inventors.
To investigate post-merger patenting performance of retained target inventors relative to
incumbent acquirer inventors, we run the following OLS regression:
!"#$"%&'&)%*)%+,-,. = 0 + 23@7'A$%B"#$"%&'+ + 6$789:- + C$7'9:. + $+,-,., (3)
where the dependent variable is either # of patents or # of citation-weighted patents (see detailed
definitions in Appendix B). Target inventor is an indicator variable that takes the value of one
for the target inventor, and zero for her matching acquirer inventors. Table 5 presents the results.
In columns (1) and (2) of Panel A, we show that post-merger, target inventors produce
fewer patents or citation-weighted patents, compared to acquirer inventors. On the surface, this
finding seems to be inconsistent with the acquiring talent motive of M&As (see the Red Hat
quote). Columns (3) and (4) present the results from the same regression specification except that
we limit patenting output in the target firm’s core area (i.e., the technology class in which the
target firm has been granted the most number of patents prior to the deal). We find that post-
merger, target inventors produce more patents (citation-weighted patents), compared to acquirer
inventors, consistent with the acquiring talent motive. In terms of economic significance, a target
26
inventor on average produces 3.5 (6.3) percent more patents (citation-weighted patents) in the
target’s core area than a typical acquirer inventor does.
In Panel B, we separate target inventors into two groups based on whether a target
inventor’s core technology class is the same as that of the acquirer. Columns (1) and (2) present
the results when a target inventor shares the same core technology class as that of the acquirer,
and columns (3) and (4) present the results when their core technology classes are different. We
find that the main findings in Panel A columns (3) and (4) remain for both subsamples. We
conclude that acquirers benefit from acquiring talent regardless of whether those target inventors
share the same core competence with them or not.9
Table 6 examines whether there is any cross-sectional variations in target inventors’
productivity post-merger. Two inventor characteristics stand out. Columns (3) and (4) show that
target inventors’ outperformance is strengthened for those who are also star inventors, i.e., an
inventor whose total number of citations is in the top 5th percentile among all inventors, further
supporting the acquiring talent motive. In terms of economic significance, a star target inventor
produces 10.6 (26.2) percent more patents (citation-weighted patents) in the target’s core area
than a typical acquirer inventor does. Columns (5) and (6) further show that target inventors with
larger networks are particularly more productive post-merger compared to their peer at acquirers.
In terms of economic significance, an increase in network size by one percentage point is
associated with an increase in the number of patents (citation-weighted patents) by one (2.2)
percentage point(s).
In summary, Tables 5 and 6 provide supporting evidence for the acquiring talent channel.
9 There could be other benefits associated with the acquiring talent channel, such as attracting other inventors to the combined firm to work on target firms’ core technology and/or with target/acquirer inventors, which is beyond the scope of this paper.
27
4.3. Recombination
In this section, we investigate whether M&As facilitate the recombination of talent and
knowledge domains, in the merged firm. Specifically, we compare the number of patents that
result from the collaboration of acquirer and target inventors, as well as the number of patents
that build on the combined knowledge domain of the two firms from before to after deal
completion. Table 7 presents the results.
In columns (1), we show that post-merger, the number of patents involving both the
acquirer and target inventors increases significantly. In column (2), we find a similar increase in
the number of patents citing both firms’ knowledge domains. In terms of economic significance,
the number of patents involving both the acquirer and target inventors increases by 6.8 percent (=
e0.066 - 1) and the number of patents citing both firms’ knowledge domains by 14.8 percent (=
e0.138 - 1) after the deal, respectively.
To determine to what extent such increase is due to the treatment effect from deal
completion, in columns (3) and (4) we use the same quasi-experiment as in Table 4 (but with
different outcome variables).10 We find that relative to those firms involved in withdrawn bids,
firms in completed deals produce significantly more patents by joint teams of acquirer and target
inventors and significantly more patents citing both firms’ knowledge domains post-merger than
pre-merger. The evidence supports a causal effect of M&As on the level of recombination of
teams and knowledge domains.
Figure 1 presents the recombination of teams over time. We show that indeed there is a
significant increase in such recombination post-merger.11 Figure 2 presents the recombination of
10 Given that the analysis is at the firm-year level and we also control for deal fixed effects, the indicator variable After drops out. 11 The jump in recombination of teams in ayr-1 could be due to the imprecision in our scheme of tracking an inventor’s career path (see Appendix A for details).
28
knowledge domains over time. We find a similar pattern. Both figures are indicative of a gradual,
causal effect of M&As on recombinations.
In the next section, we further examine the consequences of such increase in
recombination at the merged firms.
4.4. Inventor characteristics, recombination, and path-breaking innovation
In this section, we examine how impactful and radical innovation take place after M&As
by making use of detailed information on inventor team composition and citation patterns at the
patent level.12
Teams of inventors keep growing in importance. Jaravel et al. (2018) show that the
majority (over 60%) of patents in the USPTO database are produced by teams of two or three
inventors. The mean (median) inventor team size in our sample is 2.93 (3); the share of a single
inventor accounts for 22% in our sample. Table 8 Panel A presents the patent-level results on the
relation between recombination of teams and path-breaking innovation.13 The dependent
variables are the indicator variables for impactful patent and radical patent
12 In unreported analyses, we find that the share of impactful patents out of all patents over the five-year post-merger period is 8.7%, and the share of radical patents is 6.3%, and the correlation between impactful patents and radical patents is low (0.02), suggesting that these two measures capture different aspects of path-breaking innovation. Moreover, the mean/median number of forward citations of impactful patents received over five-year period subsequent to grant date is 15.824 (13), and the mean/median number of forward citations of radical patents over the same period is 5.043 (3), both are significantly higher than the mean (3.807)/median (2) number of forward citations of patents that are neither impactful nor radical. 13 In unreported analyses, we first show that the vast majority of post-merger patents are produced by acquirer inventors-only teams (at almost 94%), about 6% of post-merger patents are produced by target inventors-only team, and less than 0.5% of post-merger patents are produced by hybrid teams consisting of both acquirer and target inventors. We then show that patents produced by the hybrid teams are most likely to be impactful. Specifically, the probability of filing impactful patents is 8.8% and 7.5% for acquirer inventor only teams and target inventor only teams, respectively; in contrast, such probability is 14.7% for hybrid teams. Moreover, we show that patents produced by the hybrid teams are most likely to be radical. Specifically, the probability of filing radical patents is 6.3% and 6.0% for acquirer inventor only teams and target inventor only teams, respectively; in contrast, such probability is 14.0% for hybrid teams.
29
In column (1), we show that compared to patents produced by acquirer inventors-only
teams, patents produced by target inventors-only teams are less likely to be impactful, whereas
patents produced by the hybrid teams are more likely to be impactful. In column (2), we show
that compared to patents produced by acquirer inventors-only teams, patents produced by the
hybrid teams are more likely to be radical.
To examine how inventor characteristics affect the likelihood of forming hybrid teams
consisting of both target and acquirer inventors, we form pseudo pairs. Specifically, we first
identify acquirer-target inventor pairs where inventors in the pair have collaborated in at least
one patent filed during the period from cyr+1 to cyr+5. For the acquirer (target) inventor in the
sample pair, we then randomly pick three other acquirer (target) inventors and form pseudo pairs
with the target (acquirer) inventor. The sample for the linear probability regressions thus consists
of the true pair plus up to six pseudo pairs. The dependent variable is an indicator variable that
takes the value of one for the sample pair, and zero for the pseudo pairs. Panel B presents the
results.
In column (1), we show that a target inventor and an acquirer inventor are more likely to
form a hybrid team if they share the same core area. In columns (2) – (5), we further show that a
target inventor and an acquirer inventor are more likely to join forces if their significant
collaborators stay in the merged firm, they are star inventors, they have large networks, or they
are less specialized.
In summary, Table 8 provides fresh evidence on how radical innovation takes place post-
merger: Collaboration between acquirer and target inventors are associated with significantly
more impactful and radical patents, as well as inventor characteristics that are conducive to
hybrid team formation.
30
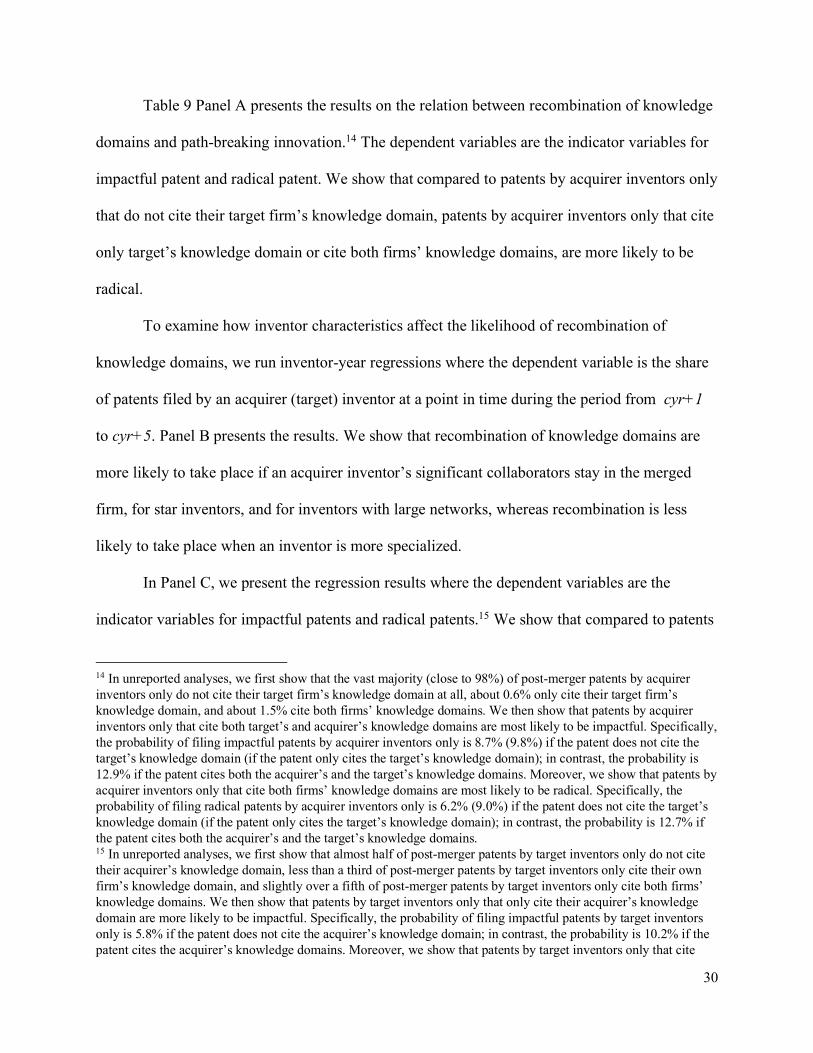
Table 9 Panel A presents the results on the relation between recombination of knowledge
domains and path-breaking innovation.14 The dependent variables are the indicator variables for
impactful patent and radical patent. We show that compared to patents by acquirer inventors only
that do not cite their target firm’s knowledge domain, patents by acquirer inventors only that cite
only target’s knowledge domain or cite both firms’ knowledge domains, are more likely to be
radical.
To examine how inventor characteristics affect the likelihood of recombination of
knowledge domains, we run inventor-year regressions where the dependent variable is the share
of patents filed by an acquirer (target) inventor at a point in time during the period from cyr+1
to cyr+5. Panel B presents the results. We show that recombination of knowledge domains are
more likely to take place if an acquirer inventor’s significant collaborators stay in the merged
firm, for star inventors, and for inventors with large networks, whereas recombination is less
likely to take place when an inventor is more specialized.
In Panel C, we present the regression results where the dependent variables are the
indicator variables for impactful patents and radical patents.15 We show that compared to patents
14 In unreported analyses, we first show that the vast majority (close to 98%) of post-merger patents by acquirer inventors only do not cite their target firm’s knowledge domain at all, about 0.6% only cite their target firm’s knowledge domain, and about 1.5% cite both firms’ knowledge domains. We then show that patents by acquirer inventors only that cite both target’s and acquirer’s knowledge domains are most likely to be impactful. Specifically, the probability of filing impactful patents by acquirer inventors only is 8.7% (9.8%) if the patent does not cite the target’s knowledge domain (if the patent only cites the target’s knowledge domain); in contrast, the probability is 12.9% if the patent cites both the acquirer’s and the target’s knowledge domains. Moreover, we show that patents by acquirer inventors only that cite both firms’ knowledge domains are most likely to be radical. Specifically, the probability of filing radical patents by acquirer inventors only is 6.2% (9.0%) if the patent does not cite the target’s knowledge domain (if the patent only cites the target’s knowledge domain); in contrast, the probability is 12.7% if the patent cites both the acquirer’s and the target’s knowledge domains. 15 In unreported analyses, we first show that almost half of post-merger patents by target inventors only do not cite their acquirer’s knowledge domain, less than a third of post-merger patents by target inventors only cite their own firm’s knowledge domain, and slightly over a fifth of post-merger patents by target inventors only cite both firms’ knowledge domains. We then show that patents by target inventors only that only cite their acquirer’s knowledge domain are more likely to be impactful. Specifically, the probability of filing impactful patents by target inventors only is 5.8% if the patent does not cite the acquirer’s knowledge domain; in contrast, the probability is 10.2% if the patent cites the acquirer’s knowledge domains. Moreover, we show that patents by target inventors only that cite
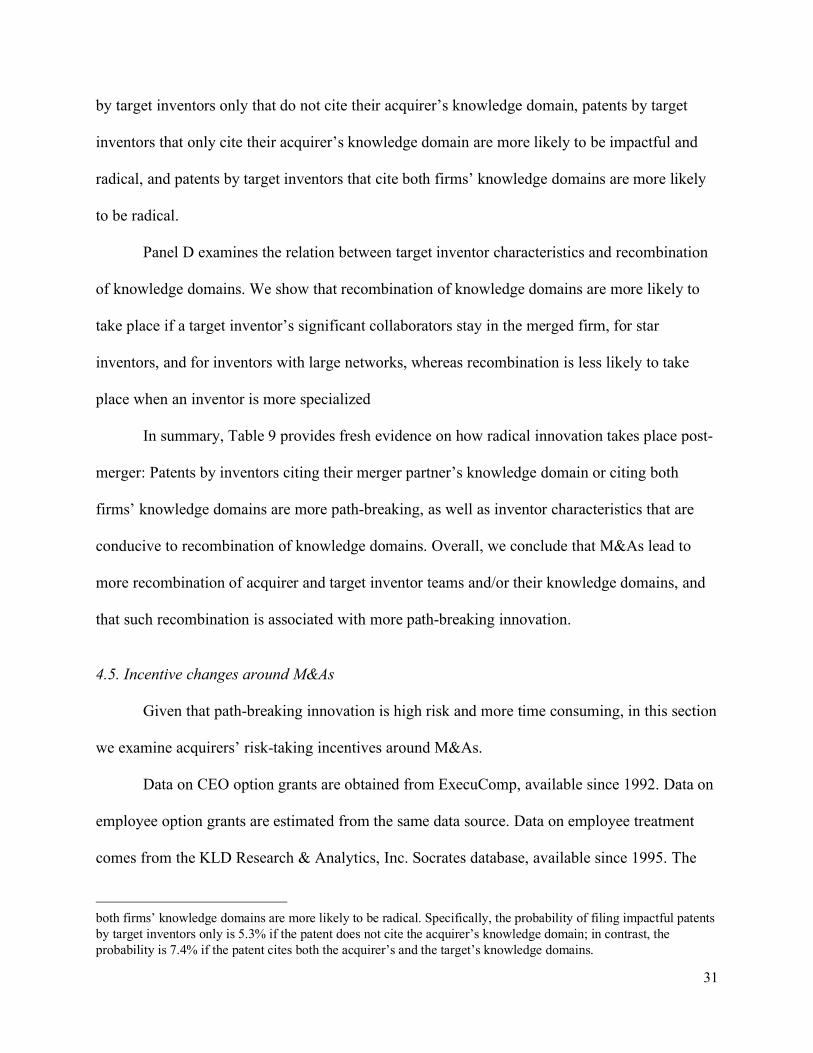
31
by target inventors only that do not cite their acquirer’s knowledge domain, patents by target
inventors that only cite their acquirer’s knowledge domain are more likely to be impactful and
radical, and patents by target inventors that cite both firms’ knowledge domains are more likely
to be radical.
Panel D examines the relation between target inventor characteristics and recombination
of knowledge domains. We show that recombination of knowledge domains are more likely to
take place if a target inventor’s significant collaborators stay in the merged firm, for star
inventors, and for inventors with large networks, whereas recombination is less likely to take
place when an inventor is more specialized
In summary, Table 9 provides fresh evidence on how radical innovation takes place post-
merger: Patents by inventors citing their merger partner’s knowledge domain or citing both
firms’ knowledge domains are more path-breaking, as well as inventor characteristics that are
conducive to recombination of knowledge domains. Overall, we conclude that M&As lead to
more recombination of acquirer and target inventor teams and/or their knowledge domains, and
that such recombination is associated with more path-breaking innovation.
4.5. Incentive changes around M&As
Given that path-breaking innovation is high risk and more time consuming, in this section
we examine acquirers’ risk-taking incentives around M&As.
Data on CEO option grants are obtained from ExecuComp, available since 1992. Data on
employee option grants are estimated from the same data source. Data on employee treatment
comes from the KLD Research & Analytics, Inc. Socrates database, available since 1995. The
both firms’ knowledge domains are more likely to be radical. Specifically, the probability of filing impactful patents by target inventors only is 5.3% if the patent does not cite the acquirer’s knowledge domain; in contrast, the probability is 7.4% if the patent cites both the acquirer’s and the target’s knowledge domains.
32
rating on firms’ employee treatment covers union relations, profit sharing, employee
involvement, retirement benefits, and health and safety. It ranges from zero to five.
Table 10 presents the results on acquirers’ risk-taking incentives around M&As. We find
that all these incentives increase after M&A deals. These results provide evidence that the
change in incentive scheme around M&As encourages more risk-taking.
Consistent with the change in risk-taking incentives, Table 11 presents inventor-level
evidence on path-breaking innovation pre- versus post-merger by running the following OLS
regression:
#!>*7E%5)8/G7?BE78*7%$"%H+,-,. = 0 + 2345%$' + 6$789:- + $+,-,., (4)
where the dependent variable is either the number of impactful patents or the number of radical
patents. After is an indicator variable that takes the value of one for the period from cyr+1 to
cyr+5, and zero for the period from ayr-5 to ayr-1.
Panel A presents the results of path-breaking by acquirer inventors. We show that post-
merger, acquirer inventors produce significantly more impactful patents and more radical patents
compared to what they do pre-merger, supporting the risk-taking channel (columns (1) and (2)).
In columns (3) and (4), we control for inventor specialization and the interaction between After
and inventor specialization. We first show that being a specialist is negatively associated with the
number of impactful patents and the number of radical patents, consistent with the notion that
path-breaking innovation builds on diversity in knowledge domains, which specialist inventors
lack. However, post-merger, the association between an acquirer inventor being a specialist and
the number of impactful (radical) patents becomes positive. Given that specialist inventors’
prospects are more sensitive to their employer’s level of risk tolerance (Custódio, Ferreira, and

33
Matos, 2019), our evidence on them engaging in more risk-taking is indicative of an increase in
risk-taking appetite in the combined firm post-merger.
Panel B presents the results of risk-taking by target inventors. We show that post-merger,
target inventors produce significantly fewer impactful patents compared to what they do pre-
merger, consistent with the prior findings that target inventors’ performance deteriorates after
M&As (columns (1) and (2)). In columns (3) and (4), we control for inventor specialization and
the interaction between After and inventor specialization. Consistent with the expectations that
specialists are more risk averse, we find that being a specialist is negatively associated with the
number of impactful patents and the number of radical patents. However, the interaction between
the post-merger indicator variable and inventor specialization is significantly positive, consistent
with our findings in Table 10 that there is an increase in risk tolerance after M&As.
In summary, Tables 10 and 11 show that both incentives in favor of risk-taking and the
actual outcomes of risk-taking increase around M&As, providing suggestive evidence that the
incentives change might be an impetus to the increase in the recombination of talent and
knowledge domains documented in the previous sections.
5. Conclusions
Using a large and unique inventor-level dataset over the period 1981 to 2006, we
examine inventor patenting performance to shed light on how firms benefit from M&As.
We first show that post-merger, while acquirer inventors’ patenting performance
improves, target inventors’ patenting performance deteriorates. However, when limiting
patenting output in the target firm’s core area, we find that target inventors produce more patents
and more citation-weighted patents compared to acquirer inventors. Using a quasi-experiment

34
involving withdrawn bids, we then demonstrate that there is a causal effect of M&As on the
increase in recombination of inventor teams and knowledge domains. Moreover, we show that
post-merger, recombination of inventor teams and knowledge domains is associated with more
impactful and radical patents. Finally, we provide suggestive evidence on the role of incentives
in post-merger path-breaking innovation.
Our findings suggest that acquiring talent and recombination are the key channels
through which mergers and acquisitions foster corporate innovation. More studies are called for
to shed light on how human capital affects target selection and how target talent is matched to
incumbent talent to produce post-merger innovation success.

35
Appendix A: Tracking an Inventor’s Patenting Career To determine an inventor’s employer(s) throughout her patenting career, we rely on inventor information provided in the HBS U.S. Patent Inventor Database (henceforth, the HBS database) and assignee information provided in the NBER Patent Citations Data File (henceforth, the NBER database). After matching inventors in the HBS database to assignees in the NBER database using patent number, we proceed in the following steps. Step 1 We divide patents in the NBER database into two groups (A and B) where Group A includes all patents owned by a single assignee while Group B includes patents owned by multiple assignees. For inventors whose patents belong to Group A, their employer can be unambiguously identified. We further divide patents in Group B into two subgroups (B1 and B2) where Group B1 includes patents filed by a single inventor and Group B2 by multiple inventors. Step 2 We determine the employer of inventors whose patents belong to Group B1 using the matched information in Step 1. Specifically, we link an inventor to an assignee in the year when the inventor’s patent was granted if the inventor has been linked to the assignee in Group A in the same year. If we cannot determine an assignee for the inventor based on the matched information in Step 1, we link the inventor to an assignee whose geographic location is the same as that of the inventor. If several assignees have the same location as the inventor, we randomly pick one of the assignees. Step 3 For inventors whose patents belong to Group B2, we determine their employees using the matched information obtained in Steps 1 and 2. If we cannot determine an assignee for an inventor, we link the inventor to an assignee whose geographic location is the same as that of the inventor. If several assignees have the same location as the inventor, we randomly pick one of the assignees. Step 4 We combine all inventor-assignee pairs from Steps 1, 2, and 3. If all patents filed by an inventor in a given year belong to a single assignee, we assume that the inventor was an employee of the assignee in that year. If patents filed by an inventor in a given year belong to multiple assignees, we assume that the assignee owning the most of the patents is the employer of the inventor in that year. If there is a tie in terms of the number of patents owned by different assignees in that year, we pick the assignee who was the inventor’s employer in the previous year. If there is a tie and the inventor’s employer in the previous year is undetermined, we randomly pick one of the assignees. Step 5 We augment the inventor-assignee-year (I-A-Y) sample by filling all year gaps in which an inventor is not linked to an assignee. Specifically, if both I-A-Y1 and I-A-Y2 are observations in the sample and there are no other observations of inventor I between Y1 and Y2, then we assume inventor I’s employer is A during the entire period from Y1 to Y2. If both I-A1-Y1 and I-A2-Y2

36
are observations in the sample and there are no other observations of inventor I between Y1 and Y2, then we assume inventor I’s employer is A1 during the period from Y1 to Ym and A2 during the period from Ym+1 to Y2, where Ym = int (Y1 + (Y2 - Y1) / 2). In summary, for each inventor in our sample, her active career spans from the year of her first patent application to the year of her last patent application in the NBER database.
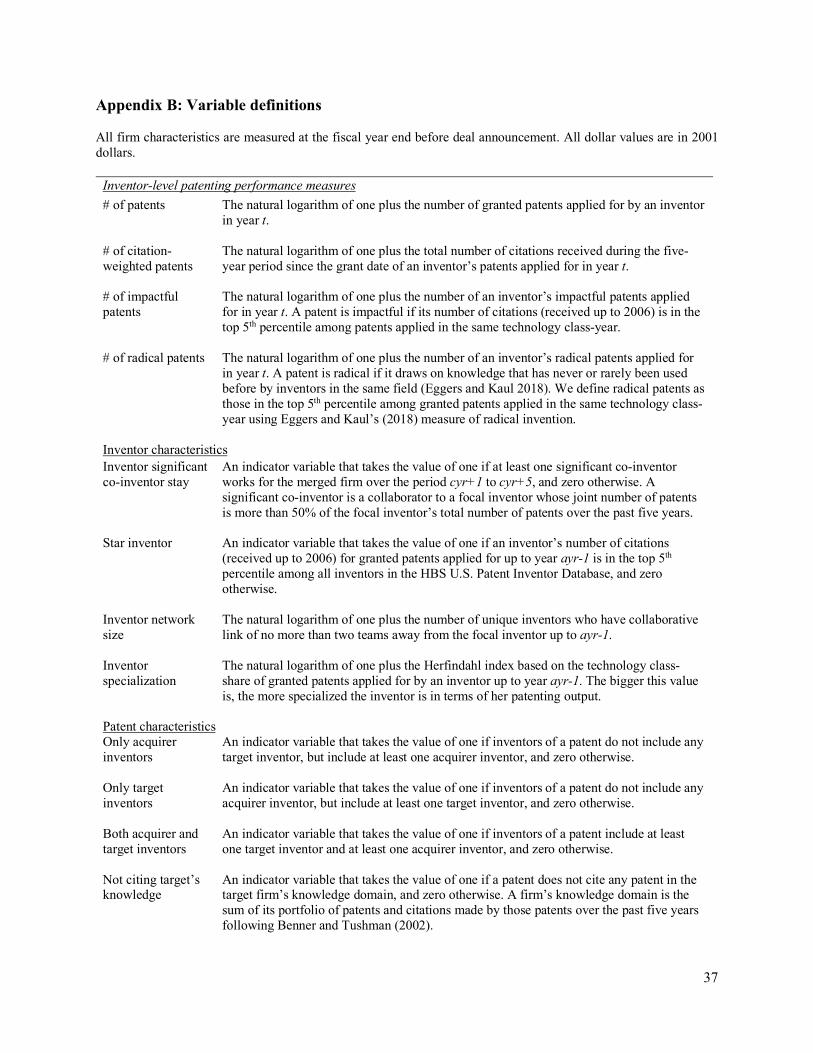
37
Appendix B: Variable definitions All firm characteristics are measured at the fiscal year end before deal announcement. All dollar values are in 2001 dollars.
Inventor-level patenting performance measures # of patents The natural logarithm of one plus the number of granted patents applied for by an inventor
in year t.
# of citation-weighted patents
The natural logarithm of one plus the total number of citations received during the five-year period since the grant date of an inventor’s patents applied for in year t.
# of impactful patents
The natural logarithm of one plus the number of an inventor’s impactful patents applied for in year t. A patent is impactful if its number of citations (received up to 2006) is in the top 5th percentile among patents applied in the same technology class-year.
# of radical patents The natural logarithm of one plus the number of an inventor’s radical patents applied for in year t. A patent is radical if it draws on knowledge that has never or rarely been used before by inventors in the same field (Eggers and Kaul 2018). We define radical patents as those in the top 5th percentile among granted patents applied in the same technology class-year using Eggers and Kaul’s (2018) measure of radical invention.
Inventor characteristics Inventor significant co-inventor stay
An indicator variable that takes the value of one if at least one significant co-inventor works for the merged firm over the period cyr+1 to cyr+5, and zero otherwise. A significant co-inventor is a collaborator to a focal inventor whose joint number of patents is more than 50% of the focal inventor’s total number of patents over the past five years.
Star inventor An indicator variable that takes the value of one if an inventor’s number of citations (received up to 2006) for granted patents applied for up to year ayr-1 is in the top 5th
percentile among all inventors in the HBS U.S. Patent Inventor Database, and zero otherwise.
Inventor network size
The natural logarithm of one plus the number of unique inventors who have collaborative link of no more than two teams away from the focal inventor up to ayr-1.
Inventor specialization
The natural logarithm of one plus the Herfindahl index based on the technology class-share of granted patents applied for by an inventor up to year ayr-1. The bigger this value is, the more specialized the inventor is in terms of her patenting output.
Patent characteristics Only acquirer inventors
An indicator variable that takes the value of one if inventors of a patent do not include any target inventor, but include at least one acquirer inventor, and zero otherwise.
Only target inventors
An indicator variable that takes the value of one if inventors of a patent do not include any acquirer inventor, but include at least one target inventor, and zero otherwise.
Both acquirer and target inventors
An indicator variable that takes the value of one if inventors of a patent include at least one target inventor and at least one acquirer inventor, and zero otherwise.
Not citing target’s knowledge
An indicator variable that takes the value of one if a patent does not cite any patent in the target firm’s knowledge domain, and zero otherwise. A firm’s knowledge domain is the sum of its portfolio of patents and citations made by those patents over the past five years following Benner and Tushman (2002).

38
Citing only target’s knowledge
An indicator variable that takes the value of one if a patent cites at least one patent in the target firm’s knowledge domain but does not cite any patent in the acquirer’s knowledge domain.
Citing both firms’ knowledge
An indicator variable that takes the value of one if a patent cites at least one patent in the target firm’s knowledge domain and also cites at least one patent in the acquirer’s knowledge domain.
Not citing acquirer’s knowledge
An indicator variable that takes the value of one if a patent does not cite any patent in the acquirer’s knowledge domain, and zero otherwise.
Citing only acquirer’s knowledge
An indicator variable that takes the value of one if a patent cites at least one patent in the acquirer’s knowledge domain but does not cite any patent in the target firm’s knowledge domain.
Deal/firm characteristics Diversified An indicator variable that takes the value of one if the first two-digit SIC codes are
different between an acquirer and its target firm, and zero otherwise.
Relative size The ratio of deal value to an acquirer’s book value of assets.
All cash An indicator variable that takes the value of one if the deal is entirely financed by cash, and zero otherwise.
All stock An indicator variable that takes the value of one if the deal is entirely finance by equity, and zero otherwise.
Tobin’s Q The ratio of market value of assets to book value of assets.
ROA The ratio of operating income before depreciation to book value of assets.
Leverage The ratio of total debt to book value of assets. Prior year stock return
The cumulative return over the past 12-month period ending in the month prior to deal announcement.
CEO options
The natural logarithm of the ratio of the Black-Scholes value of a CEO’s option grants to her total compensation.
Employee options The natural logarithm of the value of options granted to nonexecutive employees per worker estimated by the Black-Scholes option pricing model. The total value of employee options granted in a year is calculated as the total value of options granted in that year minus the total value of options granted to the top five executives reported in the ExeuComp database. In ExecuComp: BLKSHVAL/PCTTOTOPT´100 - BLKSHVAL]/[Compustat: Item29], where BLKSHVAL is Black-Scholes option value granted to the top five executives and PCTTOTOPT is the percentage of option granted to the top five executives to the total option granted (Bae, Kang, and Wang 2011).
Employee treatment
The KLD ratings on firms’ employee relations, including union relations, cash profit sharing, employee involvement, retirement benefits, and health and safety. KLD assigns a 0/1 rating for each of these five categories. Our measure is a sum of these 0/1 ratings. A high value indicates better employee treatment.
39
References:
Acharya, Viral, Ramin Baghai, and Krishnamurthy Subramanian, 2014. Wrongful discharge laws and innovation, Review of Financial Studies 27 (1): 301-346.
Aghion, Philippe, and Peter Howitt, 1992. A model of growth through creative destruction,
Econometrica 60 (2): 323-351. Aghion, Philippe, John Van Reenen, and Luigi Zingales, 2013. Innovation and institutional
ownership, American Economics Review 103 (1): 277-304. Ahuja, Gautam, and Riitta Katila, 2001. Technological acquisitions and the innovation
performance of acquiring firms: A longitudinal study, Strategic Management Journal 22 (3): 197-220.
Bae, Kee-Hong, Jun-Koo Kang, and Jin Wang, 2011. Employee treatment and firm leverage: A
test of the stakeholder theory of capital structure, Journal of Financial Economics 100 (1): 130-153
Balsmeier, Benjamin, Lee Fleming, and Gustavo Manso, 2017. Independent boards and
innovation, Journal of Financial Economics 123 (3): 536-557. Baghai, Ramin P., Rui C. Silva, and Luofu Ye, 2018. Bankruptcy, team-specific human capital,
and productivity: Evidence from U.S. inventors, Stockholm School of Economics working paper.
Baranchuk, Nina, Robert Kieschnick, and Rabih Moussawi, 2014. Motivating innovation in
newly public firms, Journal of Financial Economics 111 (3): 578-588. Beaumont, Paul, Camille Hebert, and Victor Lyonnet, 2019. Build or buy? Human capital and
corporate diversification, Université Paris Dauphine working paper. Bena, Jan, and Kai Li, 2014. Corporate innovations and mergers and acquisitions, Journal of
Finance 69 (5): 1923-1960. Benner, Mary J., and Michael Tushman, 2002. Process management and technological
innovation: A longitudinal study of the photography and paint industries, Administrative Science Quarterly 47 (4): 676-706.
Bernstein, Shai, Rebecca Diamond, Timothy McQuade, and Beatriz Pousada, 2019. The
contribution of high-skilled immigrants to innovation in the United States, Stanford University working paper.
Bloom, Nicholas, Charles I. Jones, John Van Reenen, and Michael Webb, 2019. Are ideas
getting harder to find? Stanford University working paper.
40
Bowen, Donald, Laurent Frésard, Gerard Hoberg, 2019. Technological disruptiveness and the evolution of IPOs and Sell-Outs, Virginia Tech working paper.
Brav, Alon, Wei Jiang, Song Ma, and Xuan Tian, 2018. How does hedge fund activism reshape
corporate innovation? Journal of Financial Economics 130 (2): 237-264. Chang, Xin, Kangkang Fu, Angie Low, and Wenrui Zhang, 2015. Non-executive employee stock
options and corporate innovation, Journal of Financial Economics 115 (1): 168-188. Chen, Deqiu, Huasheng Gao, and Yujing Ma, 2020. Human capital driven acquisition: Evidence
from the Inevitable Disclosure Doctrine, University of International Business and Economics working paper.
Cohen, Wesley M., and Daniel A. Levinthal, 1990. Absorptive capacity: A new perspective on
learning and innovation, Administrative Science Quarterly 35 (1): 128-152. Cunningham, Colleen, Florian Ederer, and Song Ma, 2019. Killer acquisitions, London Business
School working paper. Custódio, Cláudia, Miguel A. Ferreira, and Pedro Matos, 2019. Do general managerial skills spur
innovation? Management Science 65 (2): 459-476. Ederer, Florian, and Gustavo Manso, 2013. Is pay for performance detrimental to innovation?
Management Science 59 (7): 1496-1513. Eggers, J. P., and Aseem Kaul, 2018. Motivation and ability? A behavioral perspective on the
pursuit of radical invention in multi-technology incumbents, Academy of Management Journal 61 (1): 67-93.
Fulghieri, Paolo, and Merih Sevilir, 2019. Human capital integration in mergers and acquisitions,
UNC-Chapel Hill working paper. Griffin, Dale, Kai Li, and Ting Xu, 2020. Board gender diversity and corporate innovation:
International evidence, Journal of Financial and Quantitative Analysis in press. Grossman, Sanford J., and Oliver D. Hart, 1986. The costs and benefits of ownership: A theory
of vertical and lateral integration, Journal of Political Economy 94 (4): 691-719. Hall, Bronwyn H., Adam B. Jaffe, and Manuel Trajtenberg, M., 2005. The NBER patent citation
data file: Lessons, insights and methodological tools, in: Jaffe, A.B., Trajtenberg, M. (Eds.), Patents, Citations and Innovations: A Window on the Knowledge Economy, MIT Press: Cambridge, MA, 403-470.
Harford, Jarrad, and Kai Li, 2007. Decoupling CEO wealth and firm performance: The case of
acquiring CEOs, Journal of Finance 62 (2): 917-949.
41
Hart, Oliver D., and John Moore, 1990. Property rights and the nature of the firm, Journal of Political Economy 98 (6): 1119-1158.
Hoetker, Glenn, and Rajshree Agarwal, 2007. Death hurts, but it isn’t fatal: The postexit
diffusion of knowledge created by innovative companies, Academy of Management Journal 50 (2): 446-467.
Holmstrom, Bengt, 1989. Agency costs and innovation, Journal of Economic Behavior &
Organization 12 (3): 305-327. Jaravel, Xavier, Neviana Petkova, and Alex Bell, 2018. Team-specific capital and innovation,
American Economic Review 2018, 108 (4-5): 1034-1073. Jaffe, Adam B., Manuel Trajtenberg, and Rebecca Henderson, 1993. Geographic localization of
knowledge spillovers as evidenced by patent citations, Quarterly Journal of Economics 108, 577-598.
Jones, Benjamin, E.J. Reedy, and Bruce A. Weinberg, 2014. Age and scientific genius, NBER
Working Paper No. 19866. Kogut, Bruce, and Udo Zander, 1992. Knowledge of the firm, combinative capabilities, and the
replication of technology, Organization Science 3 (3): 383-397. Kogut, Bruce, and Udo Zander, 1996. What firms do? Coordination, identity, and learning,
Organization Science 7 (5): 502-518. Lagaras, Spyridon, 2017. Corporate takeovers and labor restructuring, University of Pittsburg
working paper. Lee, Kyeong Hun, David C. Mauer, and Emma Qianying Xu, 2018. Human capital relatedness
and mergers and acquisitions, Journal of Financial Economics 129 (1): 111-135. Li, Guan-Cheng, Ronald Lai, Alexander D’Amour, David M. Doolin, Ye Sun, Vetle I. Torvik,
Amy Z. Yu, and Lee Fleming, 2014. Disambiguation and co-authorship networks of the U.S. patent inventor database (1975-2010), Research Policy 43 (6): 941-955.
Li, Kai, Jiaping Qiu, and Jin Wang, 2019. Technology conglomeration, strategic alliances, and
corporate innovation, Management Science 65 (11): 5065-5090. Li, Xiaoyang, 2013. Productivity, restructuring, and the gains from takeovers, Journal of
Financial Economics 109 (1): 250-271. Liu, Tong, Yifei Mao, and Xuan Tian, 2017. The role of human capital: Evidence from patent
generation, Cornell University working paper.
42
Ma, Wenting, Paige Ouimet, and Elena Simintzi, 2018. Mergers and acquisitions, technological change and inequality, UNC working paper.
Maksimovic, Vojislav, Gordon Phillips, and N. R. Prabhala, 2011. Post-merger restructuring and
the boundaries of the firm, Journal of Financial Economics 102 (2): 317-343. Manso, Gustavo, 2011. Motivating innovation, Journal of Finance 66 (5): 1823-1860. Mowery, David C., Joanne E. Oxley, and Brian S. Silverman, 1996. Strategic alliances and
interfirm knowledge transfer, Strategic Management Journal 17 (S2): 77-91. Ouimet, Paige, and Rebecca Zarutskie, 2016. Acquiring labor, UNC working paper. Pakes, Ariel, 1985. On patents, R & D, and the stock market rate of return, Journal of Political
Economy 93 (2): 390-409. Palomeras, Neus, and Eduardo Melero, 2010. Markets for inventors: Learning-by-hiring as a
driver of mobility, Management Science 56 (5): 881-895. Phene, Anupama, Stephen Tallman, and Paul Almeida, 2012. When do acquisitions facilitate
technological exploration and exploitation? Journal of Management 38 (3): 753-783. Ranft, Annette L., and Michael D. Lord, 2002. Acquiring new technologies and capabilities: A
grounded model of acquisition implementation, Organization Science 13 (4): 420-441. Rhodes-Kropf, Matthew, and David T. Robinson, 2008. The market for mergers and the
boundaries of the firm, Journal of Finance 63 (3): 1170-1211. Romer, Paul M., 1990. Endogenous technological change, Journal of Political Economy 98 (5):
S71-S102. Rosenkopf, Lori, and Paul Almeida, 2003. Overcoming local search through alliances and
mobility, Management Science 49 (6): 751-766. Seru, Amit, 2014. Firm boundaries matter: Evidence from conglomerates and R&D activity,
Journal of Financial Economics 111 (2): 381-405. Singh, Jasjit, 2005. Collaborative networks as determinants of knowledge diffusion patterns,
Management Science 51 (5): 756-770. Song, Jaeyong, Paul Almeida, and Geraldine Wu, 2003. Learning–by–hiring: When is mobility
more likely to facilitate interfirm knowledge transfer? Management Science 49 (4): 351-365. Tate, Geoffrey, and Liu Yang, 2016. The human factor in acquisitions: Cross-industry labor
mobility and corporate diversification, University of Maryland working paper.

43
Taylor, Alva, and Henrich R. Greve, 2006. Superman or the fantastic four? Knowledge combination and experience in innovative teams, Academy of Management Journal 49 (4): 723-740.
Weitzman, Martin L. 1998. Recombinant growth, Quarterly Journal of Economics 113 (2): 331-
360.
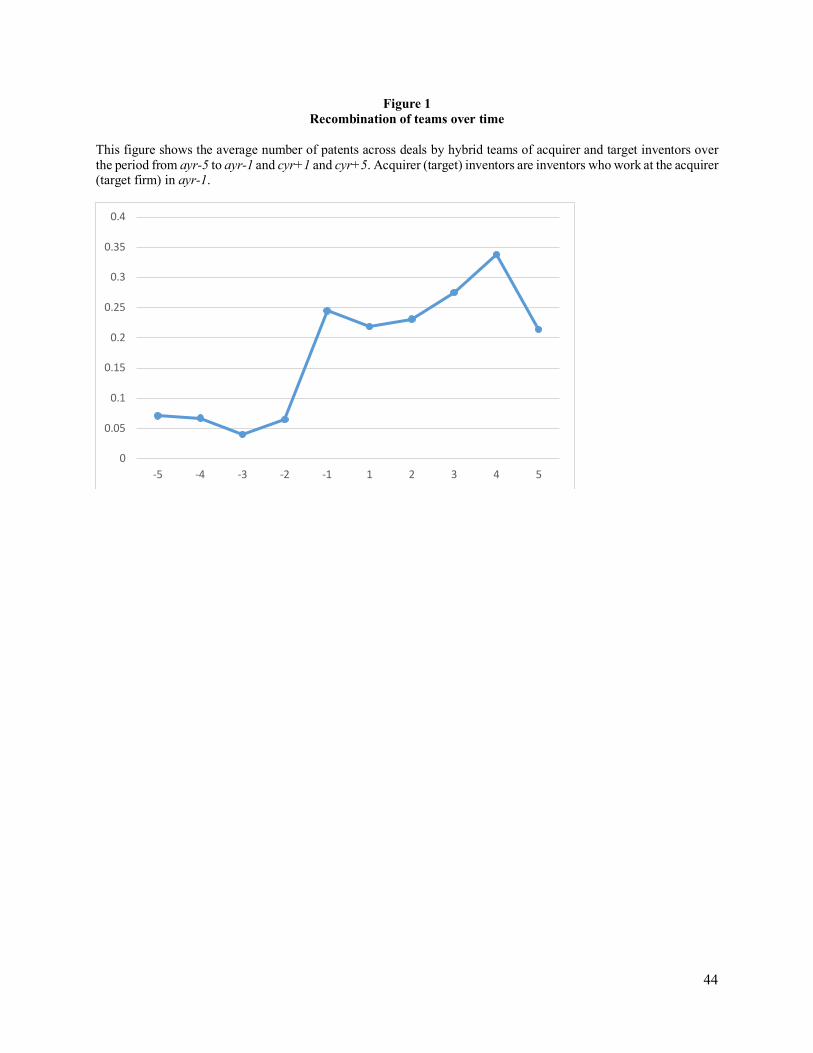
44
Figure 1 Recombination of teams over time
This figure shows the average number of patents across deals by hybrid teams of acquirer and target inventors over the period from ayr-5 to ayr-1 and cyr+1 and cyr+5. Acquirer (target) inventors are inventors who work at the acquirer (target firm) in ayr-1.
0
0.05
0.1
0.15
0.2
0.25
0.3
0.35
0.4
-5 -4 -3 -2 -1 1 2 3 4 5
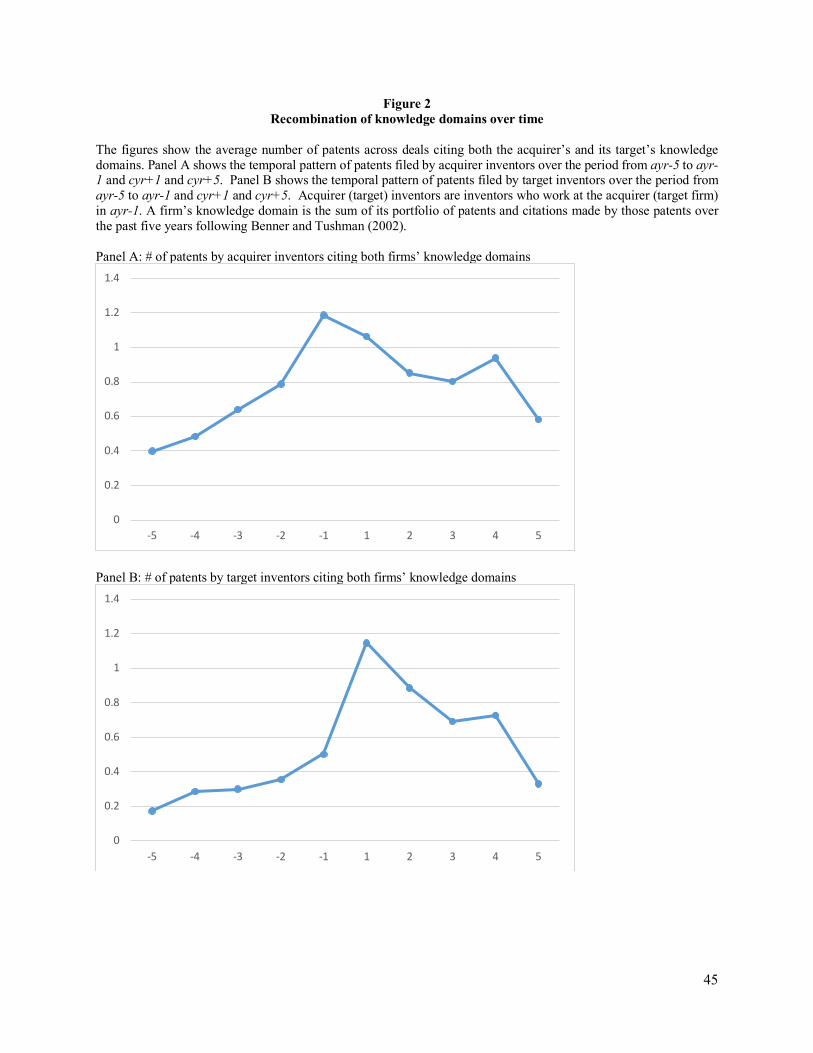
45
Figure 2 Recombination of knowledge domains over time
The figures show the average number of patents across deals citing both the acquirer’s and its target’s knowledge domains. Panel A shows the temporal pattern of patents filed by acquirer inventors over the period from ayr-5 to ayr-1 and cyr+1 and cyr+5. Panel B shows the temporal pattern of patents filed by target inventors over the period from ayr-5 to ayr-1 and cyr+1 and cyr+5. Acquirer (target) inventors are inventors who work at the acquirer (target firm) in ayr-1. A firm’s knowledge domain is the sum of its portfolio of patents and citations made by those patents over the past five years following Benner and Tushman (2002). Panel A: # of patents by acquirer inventors citing both firms’ knowledge domains
Panel B: # of patents by target inventors citing both firms’ knowledge domains
0
0.2
0.4
0.6
0.8
1
1.2
1.4
-5 -4 -3 -2 -1 1 2 3 4 5
0
0.2
0.4
0.6
0.8
1
1.2
1.4
-5 -4 -3 -2 -1 1 2 3 4 5
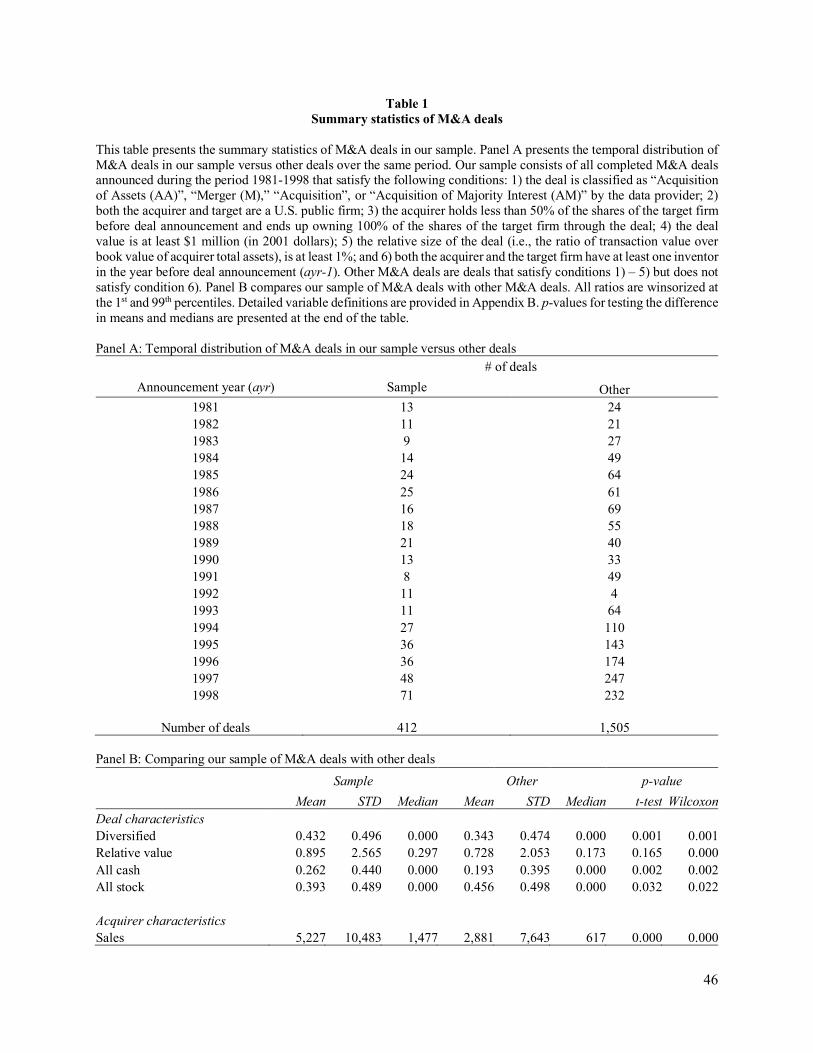
46
Table 1 Summary statistics of M&A deals
This table presents the summary statistics of M&A deals in our sample. Panel A presents the temporal distribution of M&A deals in our sample versus other deals over the same period. Our sample consists of all completed M&A deals announced during the period 1981-1998 that satisfy the following conditions: 1) the deal is classified as “Acquisition of Assets (AA)”, “Merger (M),” “Acquisition”, or “Acquisition of Majority Interest (AM)” by the data provider; 2) both the acquirer and target are a U.S. public firm; 3) the acquirer holds less than 50% of the shares of the target firm before deal announcement and ends up owning 100% of the shares of the target firm through the deal; 4) the deal value is at least $1 million (in 2001 dollars); 5) the relative size of the deal (i.e., the ratio of transaction value over book value of acquirer total assets), is at least 1%; and 6) both the acquirer and the target firm have at least one inventor in the year before deal announcement (ayr-1). Other M&A deals are deals that satisfy conditions 1) – 5) but does not satisfy condition 6). Panel B compares our sample of M&A deals with other M&A deals. All ratios are winsorized at the 1st and 99th percentiles. Detailed variable definitions are provided in Appendix B. p-values for testing the difference in means and medians are presented at the end of the table. Panel A: Temporal distribution of M&A deals in our sample versus other deals
# of deals Announcement year (ayr) Sample Other
1981 13 24 1982 11 21 1983 9 27 1984 14 49 1985 24 64 1986 25 61 1987 16 69 1988 18 55 1989 21 40 1990 13 33 1991 8 49 1992 11 4 1993 11 64 1994 27 110 1995 36 143 1996 36 174 1997 48 247 1998 71 232
Number of deals 412 1,505
Panel B: Comparing our sample of M&A deals with other deals
Sample Other p-value
Mean STD Median Mean STD Median t-test Wilcoxon Deal characteristics Diversified 0.432 0.496 0.000 0.343 0.474 0.000 0.001 0.001 Relative value 0.895 2.565 0.297 0.728 2.053 0.173 0.165 0.000 All cash 0.262 0.440 0.000 0.193 0.395 0.000 0.002 0.002 All stock 0.393 0.489 0.000 0.456 0.498 0.000 0.032 0.022 Acquirer characteristics Sales 5,227 10,483 1,477 2,881 7,643 617 0.000 0.000

47
Book assets 6,505 24,376 1,410 7,545 21,775 1,292 0.404 0.563 Tobin’s Q 2.340 1.918 1.736 1.890 1.839 1.321 0.000 0.000 ROA 0.142 0.156 0.157 0.111 0.135 0.114 0.001 0.000 Leverage 0.203 0.165 0.176 0.232 0.191 0.202 0.004 0.008 Prior year stock return 0.372 1.361 0.243 0.558 1.338 0.312 0.017 0.000 Target characteristics Sales 1,412 4,476 215 683 2,474 131 0.000 0.000 Book assets 2,385 17,886 185 2,560 13,980 219 0.835 0.422 Tobin’s Q 2.178 2.283 1.542 1.601 1.350 1.198 0.000 0.000 ROA 0.074 0.317 0.133 0.086 0.148 0.099 0.283 0.000 Leverage 0.208 0.194 0.174 0.231 0.218 0.188 0.047 0.107 Prior year stock return 0.216 0.598 0.078 0.334 1.546 0.129 0.142 0.399 Number of deals 412 1,505
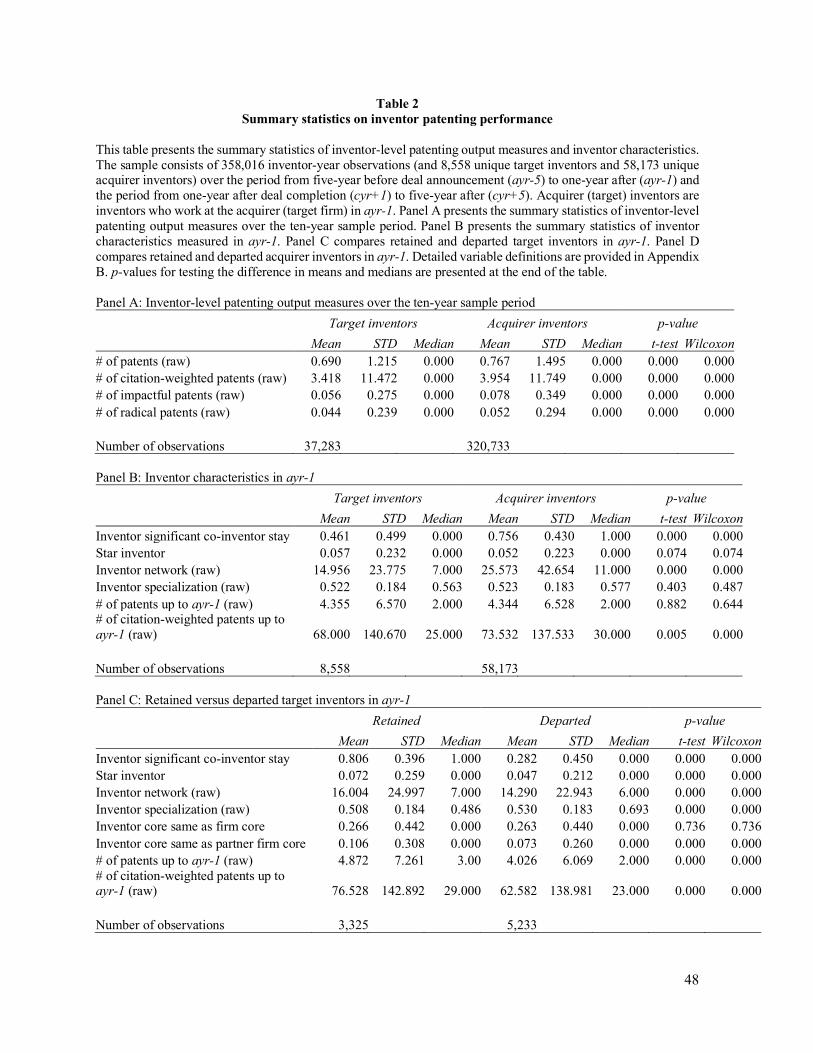
48
Table 2 Summary statistics on inventor patenting performance
This table presents the summary statistics of inventor-level patenting output measures and inventor characteristics. The sample consists of 358,016 inventor-year observations (and 8,558 unique target inventors and 58,173 unique acquirer inventors) over the period from five-year before deal announcement (ayr-5) to one-year after (ayr-1) and the period from one-year after deal completion (cyr+1) to five-year after (cyr+5). Acquirer (target) inventors are inventors who work at the acquirer (target firm) in ayr-1. Panel A presents the summary statistics of inventor-level patenting output measures over the ten-year sample period. Panel B presents the summary statistics of inventor characteristics measured in ayr-1. Panel C compares retained and departed target inventors in ayr-1. Panel D compares retained and departed acquirer inventors in ayr-1. Detailed variable definitions are provided in Appendix B. p-values for testing the difference in means and medians are presented at the end of the table. Panel A: Inventor-level patenting output measures over the ten-year sample period
Target inventors Acquirer inventors p-value
Mean STD Median Mean STD Median t-test Wilcoxon # of patents (raw) 0.690 1.215 0.000 0.767 1.495 0.000 0.000 0.000 # of citation-weighted patents (raw) 3.418 11.472 0.000 3.954 11.749 0.000 0.000 0.000 # of impactful patents (raw) 0.056 0.275 0.000 0.078 0.349 0.000 0.000 0.000 # of radical patents (raw) 0.044 0.239 0.000 0.052 0.294 0.000 0.000 0.000 Number of observations 37,283 320,733 Panel B: Inventor characteristics in ayr-1
Target inventors Acquirer inventors p-value
Mean STD Median Mean STD Median t-test Wilcoxon Inventor significant co-inventor stay 0.461 0.499 0.000 0.756 0.430 1.000 0.000 0.000 Star inventor 0.057 0.232 0.000 0.052 0.223 0.000 0.074 0.074 Inventor network (raw) 14.956 23.775 7.000 25.573 42.654 11.000 0.000 0.000 Inventor specialization (raw) 0.522 0.184 0.563 0.523 0.183 0.577 0.403 0.487 # of patents up to ayr-1 (raw) 4.355 6.570 2.000 4.344 6.528 2.000 0.882 0.644 # of citation-weighted patents up to ayr-1 (raw) 68.000 140.670 25.000 73.532 137.533 30.000 0.005 0.000 Number of observations 8,558 58,173 Panel C: Retained versus departed target inventors in ayr-1
Retained Departed p-value
Mean STD Median Mean STD Median t-test Wilcoxon Inventor significant co-inventor stay 0.806 0.396 1.000 0.282 0.450 0.000 0.000 0.000 Star inventor 0.072 0.259 0.000 0.047 0.212 0.000 0.000 0.000 Inventor network (raw) 16.004 24.997 7.000 14.290 22.943 6.000 0.000 0.000 Inventor specialization (raw) 0.508 0.184 0.486 0.530 0.183 0.693 0.000 0.000 Inventor core same as firm core 0.266 0.442 0.000 0.263 0.440 0.000 0.736 0.736 Inventor core same as partner firm core 0.106 0.308 0.000 0.073 0.260 0.000 0.000 0.000 # of patents up to ayr-1 (raw) 4.872 7.261 3.00 4.026 6.069 2.000 0.000 0.000 # of citation-weighted patents up to ayr-1 (raw) 76.528 142.892 29.000 62.582 138.981 23.000 0.000 0.000 Number of observations 3,325 5,233
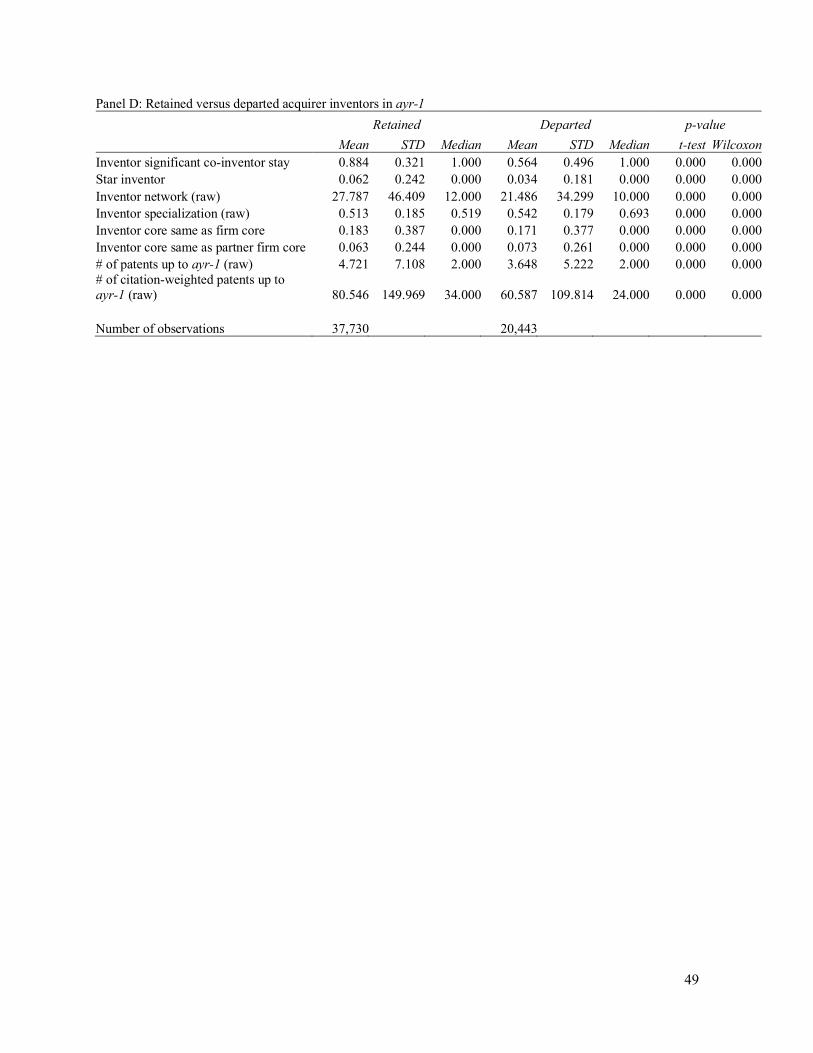
49
Panel D: Retained versus departed acquirer inventors in ayr-1 Retained Departed p-value
Mean STD Median Mean STD Median t-test Wilcoxon Inventor significant co-inventor stay 0.884 0.321 1.000 0.564 0.496 1.000 0.000 0.000 Star inventor 0.062 0.242 0.000 0.034 0.181 0.000 0.000 0.000 Inventor network (raw) 27.787 46.409 12.000 21.486 34.299 10.000 0.000 0.000 Inventor specialization (raw) 0.513 0.185 0.519 0.542 0.179 0.693 0.000 0.000 Inventor core same as firm core 0.183 0.387 0.000 0.171 0.377 0.000 0.000 0.000 Inventor core same as partner firm core 0.063 0.244 0.000 0.073 0.261 0.000 0.000 0.000 # of patents up to ayr-1 (raw) 4.721 7.108 2.000 3.648 5.222 2.000 0.000 0.000 # of citation-weighted patents up to ayr-1 (raw) 80.546 149.969 34.000 60.587 109.814 24.000 0.000 0.000 Number of observations 37,730 20,443
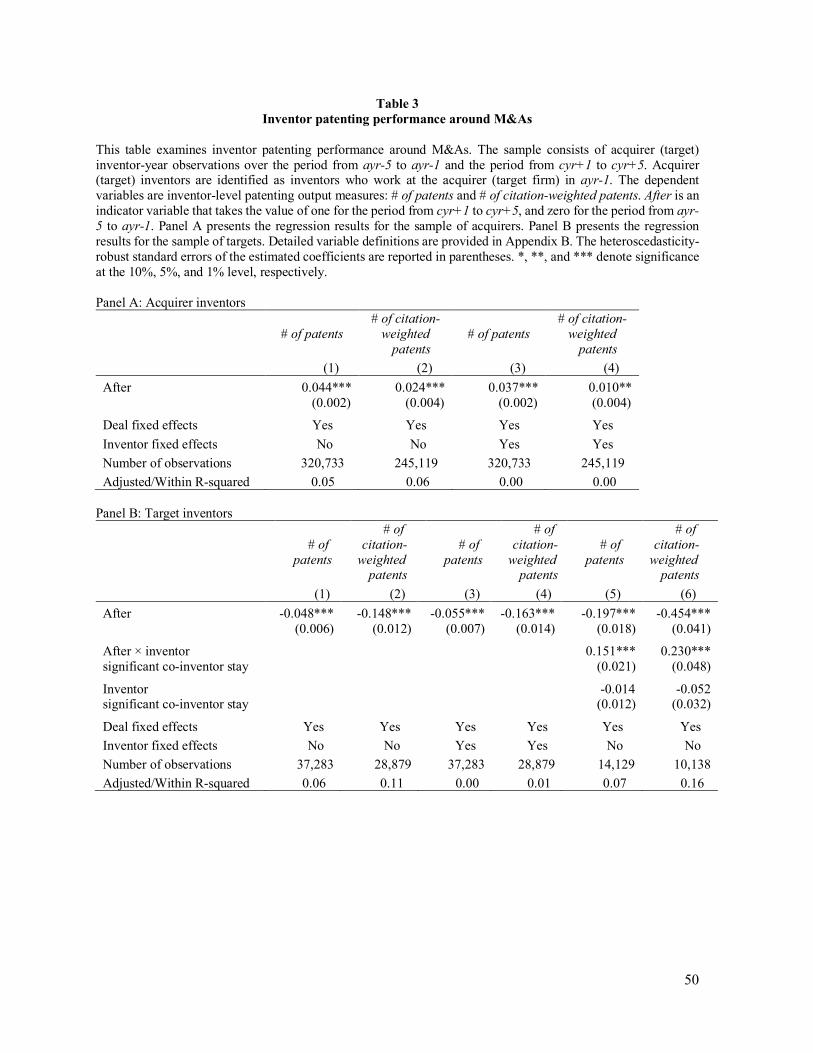
50
Table 3 Inventor patenting performance around M&As
This table examines inventor patenting performance around M&As. The sample consists of acquirer (target) inventor-year observations over the period from ayr-5 to ayr-1 and the period from cyr+1 to cyr+5. Acquirer (target) inventors are identified as inventors who work at the acquirer (target firm) in ayr-1. The dependent variables are inventor-level patenting output measures: # of patents and # of citation-weighted patents. After is an indicator variable that takes the value of one for the period from cyr+1 to cyr+5, and zero for the period from ayr-5 to ayr-1. Panel A presents the regression results for the sample of acquirers. Panel B presents the regression results for the sample of targets. Detailed variable definitions are provided in Appendix B. The heteroscedasticity-robust standard errors of the estimated coefficients are reported in parentheses. *, **, and *** denote significance at the 10%, 5%, and 1% level, respectively. Panel A: Acquirer inventors
# of patents # of citation-
weighted patents
# of patents # of citation-
weighted patents
(1) (2) (3) (4) After 0.044*** 0.024*** 0.037*** 0.010** (0.002) (0.004) (0.002) (0.004)
Deal fixed effects Yes Yes Yes Yes Inventor fixed effects No No Yes Yes Number of observations 320,733 245,119 320,733 245,119 Adjusted/Within R-squared 0.05 0.06 0.00 0.00
Panel B: Target inventors
# of patents
# of citation-
weighted patents
# of patents
# of citation-
weighted patents
# of patents
# of citation-
weighted patents
(1) (2) (3) (4) (5) (6) After -0.048*** -0.148*** -0.055*** -0.163*** -0.197*** -0.454*** (0.006) (0.012) (0.007) (0.014) (0.018) (0.041)
After × inventor 0.151*** 0.230*** significant co-inventor stay (0.021) (0.048)
Inventor -0.014 -0.052 significant co-inventor stay (0.012) (0.032)
Deal fixed effects Yes Yes Yes Yes Yes Yes Inventor fixed effects No No Yes Yes No No Number of observations 37,283 28,879 37,283 28,879 14,129 10,138 Adjusted/Within R-squared 0.06 0.11 0.00 0.01 0.07 0.16

51
Table 4 Inventor patenting performance around M&As: A quasi-experiment
This table examines inventor patenting performance around M&As using a quasi-experiment. We identify withdrawn bids during the period 1981 – 1998 by manually examining the reason for withdrawal and excluding bids whose reason for withdrawal is likely to be related to innovation performance. For each withdrawn bid, we then try to identify completed deals in our sample using the following criteria: 1) the announcement year of the completed deal is no more than one year away from the withdrawn bid; and 2) the core area of the acquirer in the completed deal is the same as the core area of the acquirer in the withdrawn bid. We obtain 38 completed deals matched to 21 withdrawn bids. The sample consists of target (acquirer) inventor-year observations associated with those completed deals or withdrawn bids over the period from ayr-5 to ayr-1 and the period from cyr+1 to cyr+5. Acquirer (target) inventors are identified as inventors who work at the acquirer (target firm) in ayr-1. The dependent variables are inventor-level patenting output measures: # of patents and # of citation-weighted patents. After is an indicator variable that takes the value of one for the period from cyr+1 to cyr+5, and zero for the period from ayr-5 to ayr-1. Completed is an indicator variable that takes the value of one for completed deals, and zero for withdrawn bids. Columns (1) – (2) presents the regression results for the sample of acquirer inventors. Columns (3) – (4) presents the regression results for the sample of target inventors. Detailed variable definitions are provided in Appendix B. The heteroscedasticity-robust standard errors of the estimated coefficients are reported in parentheses. *, **, and *** denote significance at the 10%, 5%, and 1% level, respectively.
Acquirer inventors Target inventors
# of patents # of citation-weighted patents # of patents
# of citation-weighted
patents (1) (2) (3) (4) After 0.025* -0.092* -0.072*** -0.110*** (0.014) (0.055) (0.012) (0.025) After × Completed 0.028 0.088 0.010 -0.064 (0.020) (0.065) (0.033) (0.070) Deal fixed effects Yes Yes Yes Yes Number of observations 10,608 4,729 7,417 4,556 Adjusted R-squared 0.04 0.12 0.03 0.08
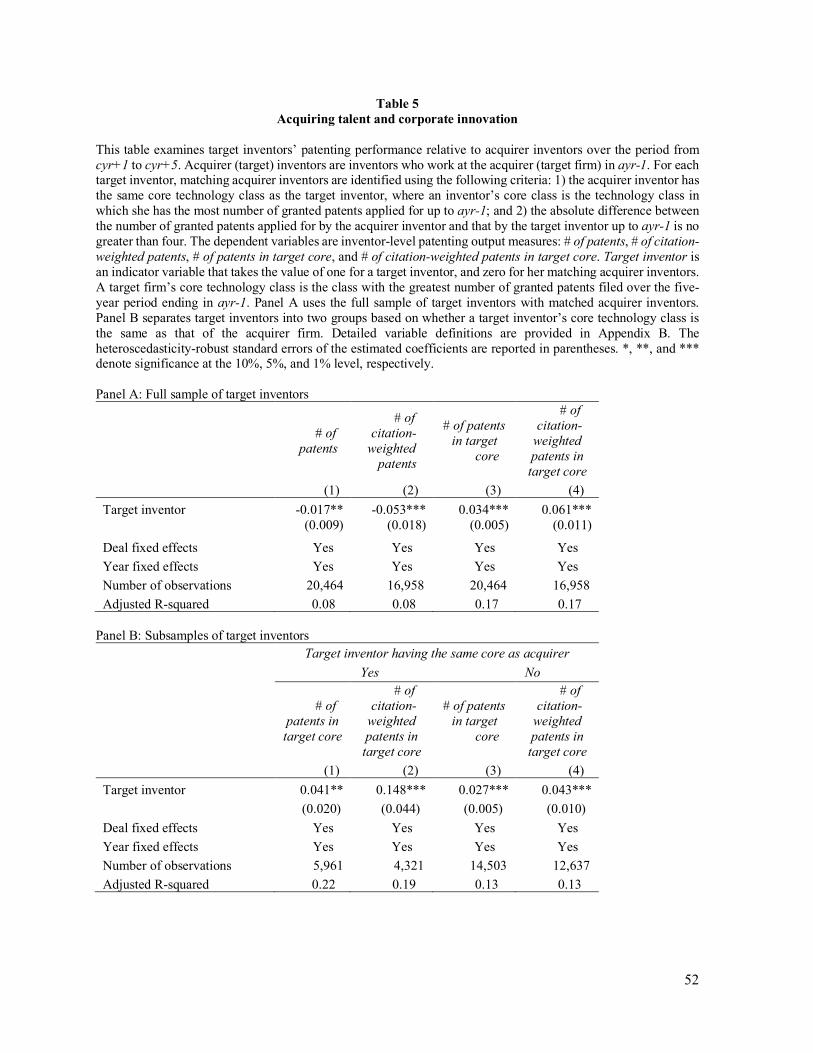
52
Table 5 Acquiring talent and corporate innovation
This table examines target inventors’ patenting performance relative to acquirer inventors over the period from cyr+1 to cyr+5. Acquirer (target) inventors are inventors who work at the acquirer (target firm) in ayr-1. For each target inventor, matching acquirer inventors are identified using the following criteria: 1) the acquirer inventor has the same core technology class as the target inventor, where an inventor’s core class is the technology class in which she has the most number of granted patents applied for up to ayr-1; and 2) the absolute difference between the number of granted patents applied for by the acquirer inventor and that by the target inventor up to ayr-1 is no greater than four. The dependent variables are inventor-level patenting output measures: # of patents, # of citation-weighted patents, # of patents in target core, and # of citation-weighted patents in target core. Target inventor is an indicator variable that takes the value of one for a target inventor, and zero for her matching acquirer inventors. A target firm’s core technology class is the class with the greatest number of granted patents filed over the five-year period ending in ayr-1. Panel A uses the full sample of target inventors with matched acquirer inventors. Panel B separates target inventors into two groups based on whether a target inventor’s core technology class is the same as that of the acquirer firm. Detailed variable definitions are provided in Appendix B. The heteroscedasticity-robust standard errors of the estimated coefficients are reported in parentheses. *, **, and *** denote significance at the 10%, 5%, and 1% level, respectively. Panel A: Full sample of target inventors
# of patents
# of citation-
weighted patents
# of patents in target
core
# of citation-
weighted patents in target core
(1) (2) (3) (4) Target inventor -0.017** -0.053*** 0.034*** 0.061*** (0.009) (0.018) (0.005) (0.011)
Deal fixed effects Yes Yes Yes Yes Year fixed effects Yes Yes Yes Yes Number of observations 20,464 16,958 20,464 16,958 Adjusted R-squared 0.08 0.08 0.17 0.17
Panel B: Subsamples of target inventors
Target inventor having the same core as acquirer Yes No
# of
patents in target core
# of citation-
weighted patents in target core
# of patents in target
core
# of citation-
weighted patents in target core
(1) (2) (3) (4) Target inventor 0.041** 0.148*** 0.027*** 0.043*** (0.020) (0.044) (0.005) (0.010) Deal fixed effects Yes Yes Yes Yes Year fixed effects Yes Yes Yes Yes Number of observations 5,961 4,321 14,503 12,637 Adjusted R-squared 0.22 0.19 0.13 0.13
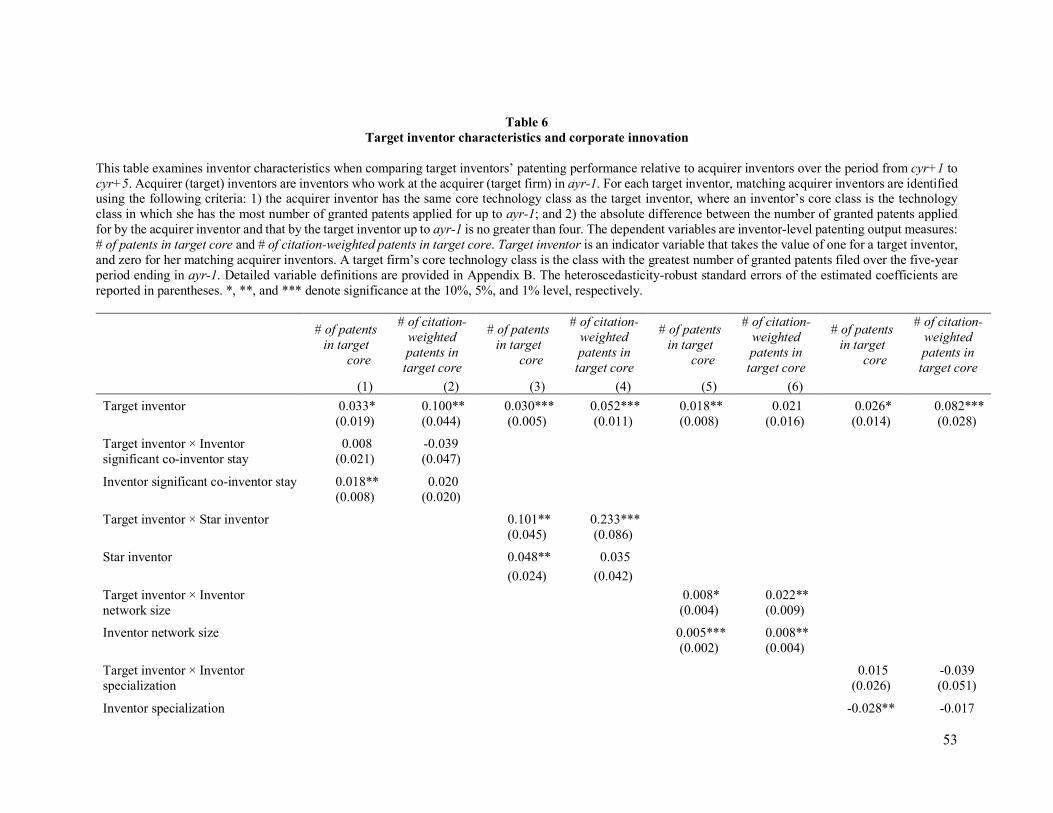
53
Table 6 Target inventor characteristics and corporate innovation
This table examines inventor characteristics when comparing target inventors’ patenting performance relative to acquirer inventors over the period from cyr+1 to cyr+5. Acquirer (target) inventors are inventors who work at the acquirer (target firm) in ayr-1. For each target inventor, matching acquirer inventors are identified using the following criteria: 1) the acquirer inventor has the same core technology class as the target inventor, where an inventor’s core class is the technology class in which she has the most number of granted patents applied for up to ayr-1; and 2) the absolute difference between the number of granted patents applied for by the acquirer inventor and that by the target inventor up to ayr-1 is no greater than four. The dependent variables are inventor-level patenting output measures: # of patents in target core and # of citation-weighted patents in target core. Target inventor is an indicator variable that takes the value of one for a target inventor, and zero for her matching acquirer inventors. A target firm’s core technology class is the class with the greatest number of granted patents filed over the five-year period ending in ayr-1. Detailed variable definitions are provided in Appendix B. The heteroscedasticity-robust standard errors of the estimated coefficients are reported in parentheses. *, **, and *** denote significance at the 10%, 5%, and 1% level, respectively.
# of patents
in target core
# of citation-weighted patents in target core
# of patents in target
core
# of citation-weighted patents in target core
# of patents in target
core
# of citation-weighted patents in target core
# of patents in target
core
# of citation-weighted patents in target core
(1) (2) (3) (4) (5) (6)
Target inventor 0.033* 0.100** 0.030*** 0.052*** 0.018** 0.021 0.026* 0.082*** (0.019) (0.044) (0.005) (0.011) (0.008) (0.016) (0.014) (0.028)
Target inventor × Inventor 0.008 -0.039 significant co-inventor stay (0.021) (0.047)
Inventor significant co-inventor stay 0.018** 0.020 (0.008) (0.020)
Target inventor × Star inventor 0.101** 0.233*** (0.045) (0.086)
Star inventor 0.048** 0.035 (0.024) (0.042) Target inventor × Inventor 0.008* 0.022** network size (0.004) (0.009)
Inventor network size 0.005*** 0.008** (0.002) (0.004)
Target inventor × Inventor 0.015 -0.039 specialization (0.026) (0.051)
Inventor specialization -0.028** -0.017
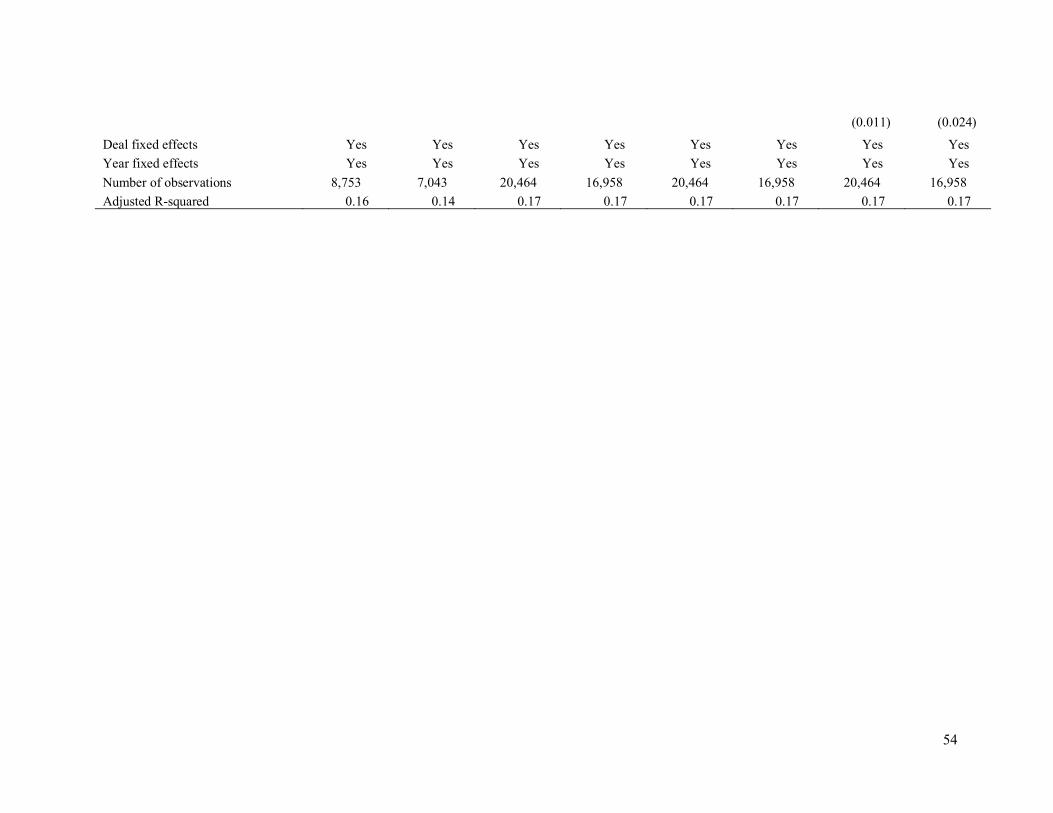
54
(0.011) (0.024)
Deal fixed effects Yes Yes Yes Yes Yes Yes Yes Yes Year fixed effects Yes Yes Yes Yes Yes Yes Yes Yes Number of observations 8,753 7,043 20,464 16,958 20,464 16,958 20,464 16,958 Adjusted R-squared 0.16 0.14 0.17 0.17 0.17 0.17 0.17 0.17
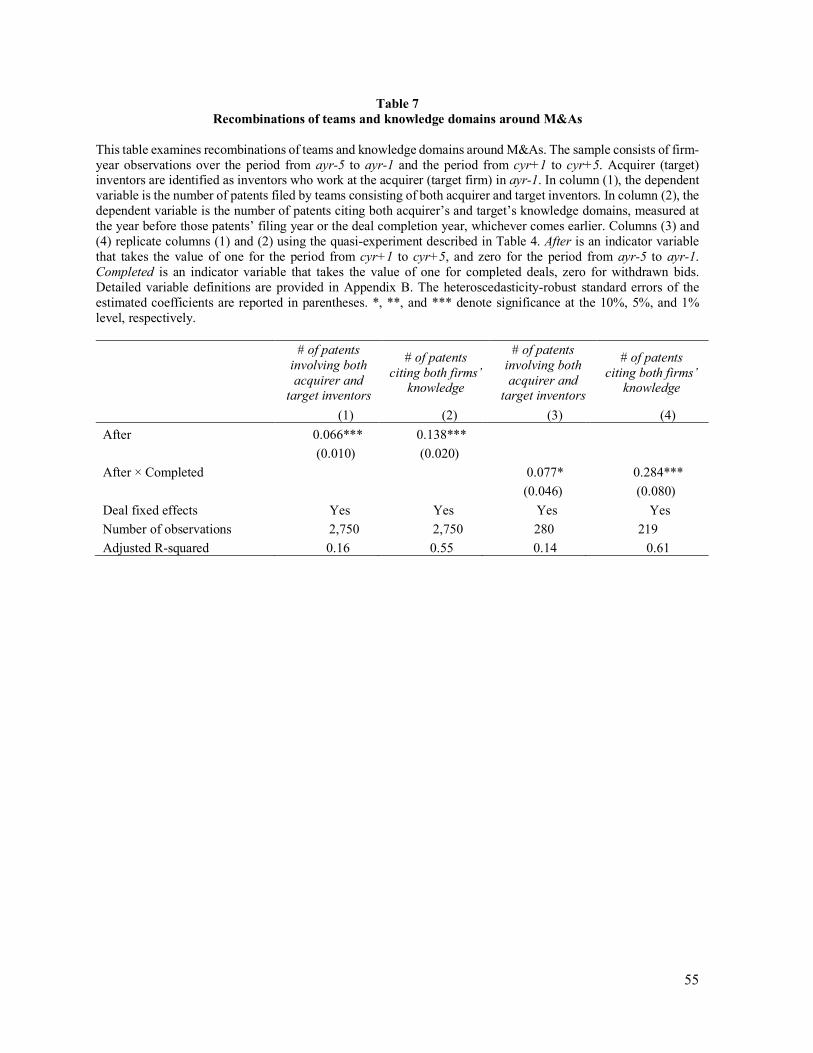
55
Table 7 Recombinations of teams and knowledge domains around M&As
This table examines recombinations of teams and knowledge domains around M&As. The sample consists of firm-year observations over the period from ayr-5 to ayr-1 and the period from cyr+1 to cyr+5. Acquirer (target) inventors are identified as inventors who work at the acquirer (target firm) in ayr-1. In column (1), the dependent variable is the number of patents filed by teams consisting of both acquirer and target inventors. In column (2), the dependent variable is the number of patents citing both acquirer’s and target’s knowledge domains, measured at the year before those patents’ filing year or the deal completion year, whichever comes earlier. Columns (3) and (4) replicate columns (1) and (2) using the quasi-experiment described in Table 4. After is an indicator variable that takes the value of one for the period from cyr+1 to cyr+5, and zero for the period from ayr-5 to ayr-1. Completed is an indicator variable that takes the value of one for completed deals, zero for withdrawn bids. Detailed variable definitions are provided in Appendix B. The heteroscedasticity-robust standard errors of the estimated coefficients are reported in parentheses. *, **, and *** denote significance at the 10%, 5%, and 1% level, respectively.
# of patents involving both acquirer and
target inventors
# of patents citing both firms’
knowledge
# of patents involving both acquirer and
target inventors
# of patents citing both firms’
knowledge
(1) (2) (3) (4) After 0.066*** 0.138*** (0.010) (0.020)
After × Completed 0.077* 0.284*** (0.046) (0.080) Deal fixed effects Yes Yes Yes Yes Number of observations 2,750 2,750 280 219 Adjusted R-squared 0.16 0.55 0.14 0.61
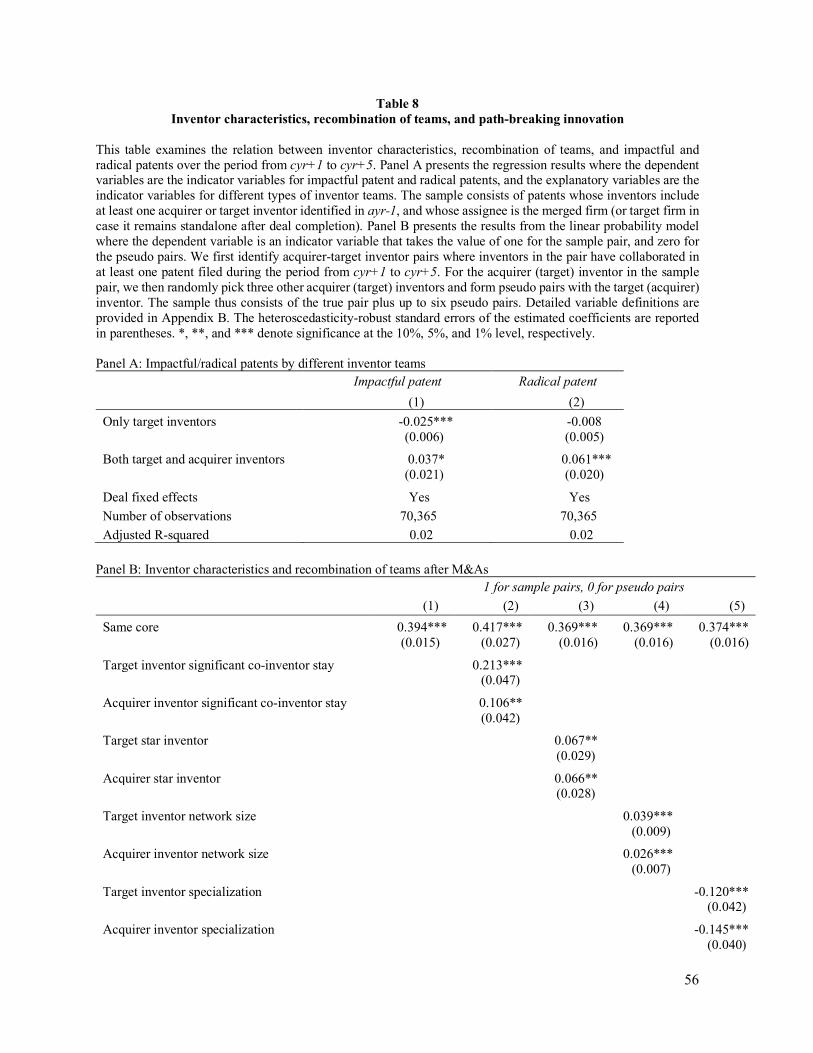
56
Table 8 Inventor characteristics, recombination of teams, and path-breaking innovation
This table examines the relation between inventor characteristics, recombination of teams, and impactful and radical patents over the period from cyr+1 to cyr+5. Panel A presents the regression results where the dependent variables are the indicator variables for impactful patent and radical patents, and the explanatory variables are the indicator variables for different types of inventor teams. The sample consists of patents whose inventors include at least one acquirer or target inventor identified in ayr-1, and whose assignee is the merged firm (or target firm in case it remains standalone after deal completion). Panel B presents the results from the linear probability model where the dependent variable is an indicator variable that takes the value of one for the sample pair, and zero for the pseudo pairs. We first identify acquirer-target inventor pairs where inventors in the pair have collaborated in at least one patent filed during the period from cyr+1 to cyr+5. For the acquirer (target) inventor in the sample pair, we then randomly pick three other acquirer (target) inventors and form pseudo pairs with the target (acquirer) inventor. The sample thus consists of the true pair plus up to six pseudo pairs. Detailed variable definitions are provided in Appendix B. The heteroscedasticity-robust standard errors of the estimated coefficients are reported in parentheses. *, **, and *** denote significance at the 10%, 5%, and 1% level, respectively. Panel A: Impactful/radical patents by different inventor teams
Impactful patent Radical patent (1) (2) Only target inventors -0.025*** -0.008 (0.006) (0.005)
Both target and acquirer inventors 0.037* 0.061*** (0.021) (0.020)
Deal fixed effects Yes Yes Number of observations 70,365 70,365 Adjusted R-squared 0.02 0.02
Panel B: Inventor characteristics and recombination of teams after M&As
1 for sample pairs, 0 for pseudo pairs (1) (2) (3) (4) (5) Same core 0.394*** 0.417*** 0.369*** 0.369*** 0.374*** (0.015) (0.027) (0.016) (0.016) (0.016)
Target inventor significant co-inventor stay 0.213*** (0.047)
Acquirer inventor significant co-inventor stay 0.106** (0.042)
Target star inventor 0.067** (0.029)
Acquirer star inventor 0.066** (0.028)
Target inventor network size 0.039*** (0.009)
Acquirer inventor network size 0.026*** (0.007)
Target inventor specialization -0.120*** (0.042)
Acquirer inventor specialization -0.145*** (0.040)

57
Deal fixed effects Yes Yes Yes Yes Yes Number of observations 5,553 1,201 4,678 4,385 4,678 Adjusted R-squared 0.13 0.30 0.13 0.14 0.13
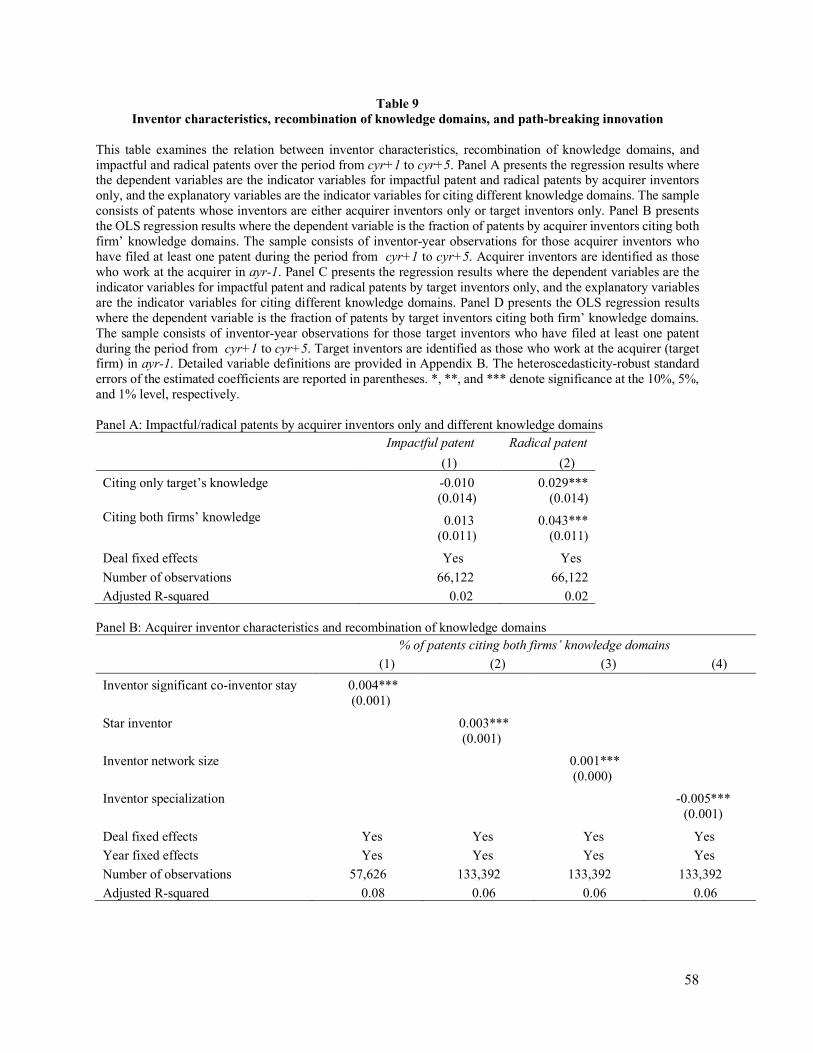
58
Table 9 Inventor characteristics, recombination of knowledge domains, and path-breaking innovation
This table examines the relation between inventor characteristics, recombination of knowledge domains, and impactful and radical patents over the period from cyr+1 to cyr+5. Panel A presents the regression results where the dependent variables are the indicator variables for impactful patent and radical patents by acquirer inventors only, and the explanatory variables are the indicator variables for citing different knowledge domains. The sample consists of patents whose inventors are either acquirer inventors only or target inventors only. Panel B presents the OLS regression results where the dependent variable is the fraction of patents by acquirer inventors citing both firm’ knowledge domains. The sample consists of inventor-year observations for those acquirer inventors who have filed at least one patent during the period from cyr+1 to cyr+5. Acquirer inventors are identified as those who work at the acquirer in ayr-1. Panel C presents the regression results where the dependent variables are the indicator variables for impactful patent and radical patents by target inventors only, and the explanatory variables are the indicator variables for citing different knowledge domains. Panel D presents the OLS regression results where the dependent variable is the fraction of patents by target inventors citing both firm’ knowledge domains. The sample consists of inventor-year observations for those target inventors who have filed at least one patent during the period from cyr+1 to cyr+5. Target inventors are identified as those who work at the acquirer (target firm) in ayr-1. Detailed variable definitions are provided in Appendix B. The heteroscedasticity-robust standard errors of the estimated coefficients are reported in parentheses. *, **, and *** denote significance at the 10%, 5%, and 1% level, respectively. Panel A: Impactful/radical patents by acquirer inventors only and different knowledge domains
Impactful patent Radical patent (1) (2) Citing only target’s knowledge -0.010 0.029*** (0.014) (0.014) Citing both firms’ knowledge 0.013 0.043*** (0.011) (0.011)
Deal fixed effects Yes Yes Number of observations 66,122 66,122 Adjusted R-squared 0.02 0.02
Panel B: Acquirer inventor characteristics and recombination of knowledge domains
% of patents citing both firms’ knowledge domains (1) (2) (3) (4) Inventor significant co-inventor stay 0.004*** (0.001)
Star inventor 0.003*** (0.001)
Inventor network size 0.001*** (0.000)
Inventor specialization -0.005*** (0.001)
Deal fixed effects Yes Yes Yes Yes Year fixed effects Yes Yes Yes Yes Number of observations 57,626 133,392 133,392 133,392 Adjusted R-squared 0.08 0.06 0.06 0.06
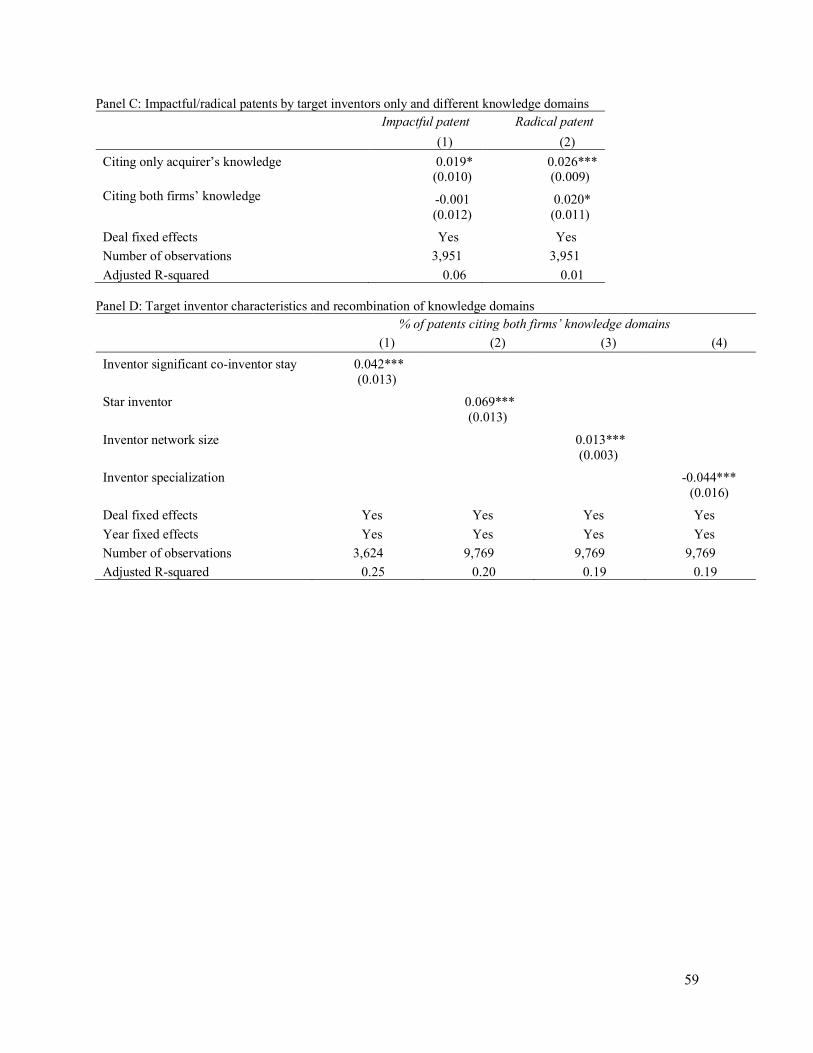
59
Panel C: Impactful/radical patents by target inventors only and different knowledge domains Impactful patent Radical patent (1) (2) Citing only acquirer’s knowledge 0.019* 0.026*** (0.010) (0.009) Citing both firms’ knowledge -0.001 0.020* (0.012) (0.011)
Deal fixed effects Yes Yes Number of observations 3,951 3,951 Adjusted R-squared 0.06 0.01
Panel D: Target inventor characteristics and recombination of knowledge domains
% of patents citing both firms’ knowledge domains (1) (2) (3) (4) Inventor significant co-inventor stay 0.042*** (0.013)
Star inventor 0.069*** (0.013)
Inventor network size 0.013*** (0.003)
Inventor specialization -0.044*** (0.016)
Deal fixed effects Yes Yes Yes Yes Year fixed effects Yes Yes Yes Yes Number of observations 3,624 9,769 9,769 9,769 Adjusted R-squared 0.25 0.20 0.19 0.19

60
Table 10 Changes in incentives around M&As
This table examines changes in acquirers’ risk-taking incentives around M&As. The sample consists of acquirers with data on risk-taking incentives over the period from ayr-3 to ayr-1 and from cyr+1 to cyr+3. In column (1), the dependent variable is the logarithm of the ratio of the Black-Scholes value of a CEO’s option grants to her total compensation. In column (2), the dependent variable is the logarithm of the Black-Scholes value of employee options per employee granted. In column (3), the dependent variable is the KLD’s rating of employee treatment. Detailed variable definitions are provided in Appendix B. Given that the ExecuComp data on CEO/employee options starts in 1992, columns (1) and (2) cover M&A deals announced over the period 1995-1998. Given that the KLD data starts in 1995, column (3) covers M&A deals announced in 1998. The heteroscedasticity-robust standard errors of the estimated coefficients are reported in parentheses. *, **, and *** denote significance at the 10%, 5%, and 1% level, respectively.
CEO options Employee options Employee treatment (1) (2) (3) After 0.718*** 0.887*** 0.153*** (0.112) (0.070) (0.074)
Deal fixed effects Yes Yes Yes Number of observations 372 668 165 Adjusted R-squared 0.37 0.80 0.71
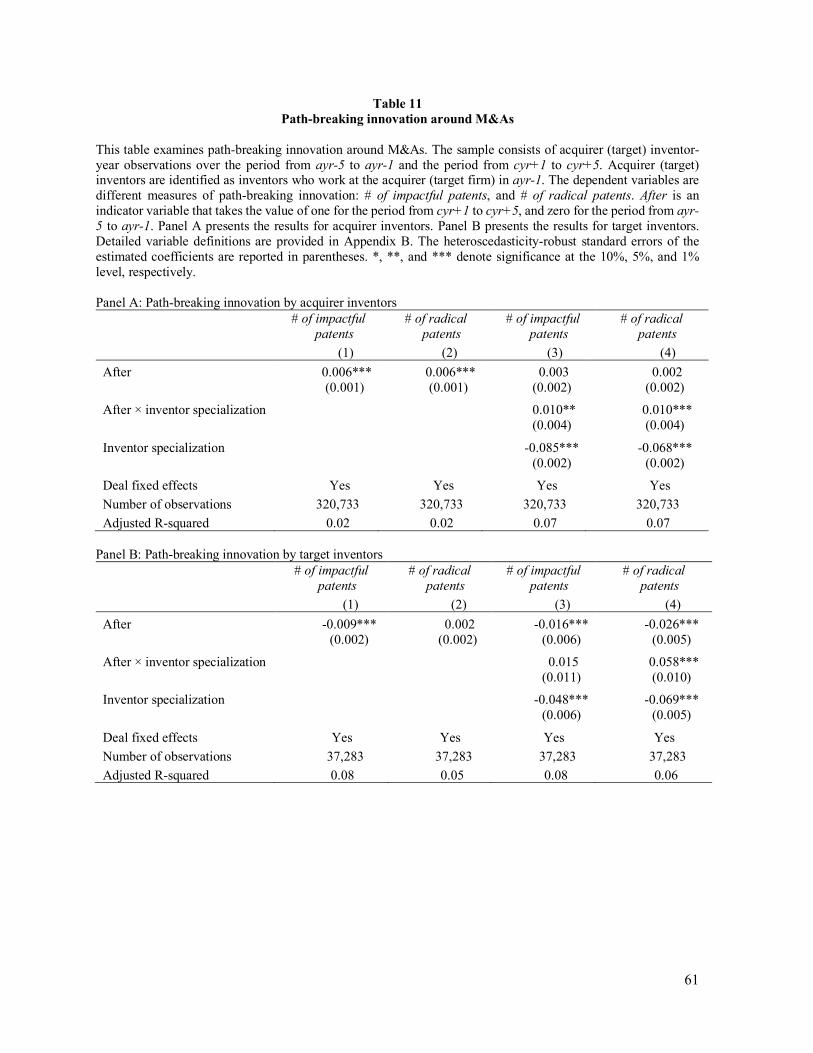
61
Table 11 Path-breaking innovation around M&As
This table examines path-breaking innovation around M&As. The sample consists of acquirer (target) inventor-year observations over the period from ayr-5 to ayr-1 and the period from cyr+1 to cyr+5. Acquirer (target) inventors are identified as inventors who work at the acquirer (target firm) in ayr-1. The dependent variables are different measures of path-breaking innovation: # of impactful patents, and # of radical patents. After is an indicator variable that takes the value of one for the period from cyr+1 to cyr+5, and zero for the period from ayr-5 to ayr-1. Panel A presents the results for acquirer inventors. Panel B presents the results for target inventors. Detailed variable definitions are provided in Appendix B. The heteroscedasticity-robust standard errors of the estimated coefficients are reported in parentheses. *, **, and *** denote significance at the 10%, 5%, and 1% level, respectively. Panel A: Path-breaking innovation by acquirer inventors
# of impactful patents
# of radical patents
# of impactful patents
# of radical patents
(1) (2) (3) (4) After 0.006*** 0.006*** 0.003 0.002 (0.001) (0.001) (0.002) (0.002)
After × inventor specialization 0.010** 0.010*** (0.004) (0.004)
Inventor specialization -0.085*** -0.068*** (0.002) (0.002)
Deal fixed effects Yes Yes Yes Yes Number of observations 320,733 320,733 320,733 320,733 Adjusted R-squared 0.02 0.02 0.07 0.07
Panel B: Path-breaking innovation by target inventors
# of impactful patents
# of radical patents
# of impactful patents
# of radical patents
(1) (2) (3) (4) After -0.009*** 0.002 -0.016*** -0.026*** (0.002) (0.002) (0.006) (0.005)
After × inventor specialization 0.015 0.058*** (0.011) (0.010)
Inventor specialization -0.048*** -0.069*** (0.006) (0.005)
Deal fixed effects Yes Yes Yes Yes Number of observations 37,283 37,283 37,283 37,283 Adjusted R-squared 0.08 0.05 0.08 0.06