how do strategic repositioning moves impact the ... · how do strategic repositioning moves impact...
TRANSCRIPT
1
HOW DO STRATEGIC REPOSITIONING MOVES IMPACT THE EFFECTIVENESS
OF FIRM’S IT GOVERNANCE, RISK, AND CONTROL MECHANISMS?
By
Hüseyin Tanriverdi
The University of Texas at Austin
Red McCombs School of Business
Information, Risk and Operations Management (IROM) Department
1 University Station, B6500, CBA 5.208
Austin, Texas 78712-0212
+1 (512) 232-9164
&
Kui (Andy) Du
College of Management
University of Massachusetts Boston
100 Morrissey Blvd
Boston, MA 02125
October 19, 2016
Under Revision
Limited circulation for feedback
Please do not cite or circulate without the permission of authors

2
HOW DO STRATEGIC REPOSITIONING MOVES IMPACT THE EFFECTIVENESS
OF FIRM’S IT GOVERNANCE, RISK, AND CONTROL MECHANISMS?
ABSTRACT
In an increasingly digitized economy, undesired IT events such as data security and privacy
breaches, digital fraud, and operational IT glitches have emerged as wicked IT-related risks. Firms
institute IT governance, risk, and control (IT-GRC) mechanisms to defend against such IT-related
risks. However, the pervasiveness of the undesired IT events indicates that firms struggle to
maintain effective IT-GRC mechanisms. This study explains how and why a firm’s own strategic
repositioning moves could reduce the effectiveness of the firm’s IT-GRC mechanisms. A firm is
a complex adaptive system operating in a complex, and dynamically changing environment. To
seize emerging opportunities or cope with unexpected threats in the environment, a firm makes
adjustments to the strategic positions of its business portfolio. For example, it diversifies into new
product market positions in domestic and foreign markets; it engages in mergers and acquisitions;
it divests some of its existing businesses; and it internally restructures its business portfolio. We
hypothesize that such strategic repositioning moves could disrupt and reduce the effectiveness of
the firm’s current IT-GRC mechanisms and make it challenging to design and operate new IT-
GRC mechanisms effectively. We find empirical support for these ideas in a longitudinal study of
2,248 publicly traded U.S. firms. We discuss the implications of these findings for IS research and
practice.
Keywords: IT risks, IT Governance, Risk and Control, Diversification, Acquisition, Divestiture,
Restructuring, Complexity

3
HOW DO STRATEGIC REPOSITIONING MOVES IMPACT THE EFFECTIVENESS
OF FIRM’S IT GOVERNANCE, RISK, AND CONTROL MECHANISMS?
The very digital technologies that open up productivity, profitability, and growth opportunities
for firms also expose firms to major IT-related risks such as data security and privacy breaches,
digital fraud, deception, theft, and disruptions through operational IT glitches (IIA 2012). The year
2014 was dubbed as “the year of the data breach.” Cyberattacks compromised the security and
privacy of over a billion personal data records in publicly traded firms such as Target, Home Depot,
JPMorgan and eBay.1 As digital spend has increased, so has the digital fraud. For example, $1 out
of every $3 spent on digital ads is lost to ad fraud.2 Glitches in IT operations have also risen. In
2015, computer glitches forced the United, Southwest, and American Airlines to ground or delay
large percentages of their flights.3 Such IT-related risks also expose firms to strategic, financial,
operational, and regulatory compliance risks.
To defend against the IT-related risks, firms institute IT governance, risk, and control (IT-GRC)
mechanisms4 . IS practice classifies IT-GRC into: (i) IT general controls (ITGC) and (ii) IT
application controls, also known as automated process controls (APC). ITGC aims to mitigate risks
in the firm’s general computing environment. It includes the firm’s strategic IT plans, IT policies,
procedures, standards, and processes. ITGC governs and controls the firm’s IT infrastructures,
applications, computer operations, IT human resources, IT program development, IT change
management, and the segregation of IT duties. APC aims to mitigate risks in the IT applications
that automate business processes of the firm. It includes input controls, processing controls, output
controls, and segregation of duty controls embedded in the applications that support business
1 http://www.cnbc.com/2015/02/12/year-of-the-hack-a-billion-records-compromised-in-2014.html 2 http://adage.com/article/digital/ad-fraud-eating-digital-advertising-revenue/301017/ 3 http://money.cnn.com/2015/10/11/news/companies/southwest-technical-issues-flight-delay/ 4 Appendix A provides a list of common IT-GRC mechanisms used by firms and external audit firms.

4
processes. These IT-GRC mechanisms seek to ensure the confidentiality, integrity, accessibility,
and privacy of the firm’s data. They also seek to ensure the continuity of the firm’s business.
Ultimately, the IT-GRC mechanisms seek to minimize the probability of loss and the magnitude
of loss associated with IT-related risks of the firm.
However, firms struggle to maintain effective IT-GRC mechanisms. The proliferation and
increasing frequency of data security and privacy breaches, digital fraud, digital deception, digital
theft, and operational IT glitches all point to weaknesses in IT-GRC mechanisms of firms. This
paper seeks to explain why firms struggle to maintain effective IT-GRC mechanisms.
An obvious explanation could be that firms may not be instituting IT-GRC mechanisms. While
this explanation was partially valid until early 2000s, it is no longer valid. Due to increasing IT-
related risks in the environment, a multitude of laws, regulations, and industry standards have been
instituted to require firms in general, and publicly traded firms in particular, to institute IT-GRC
mechanisms. For example, the Sarbanes-Oxley (SOX) Act of 2002 mandates that the CEO and
CFO of public firms be held personally accountable for instituting and effectively operating
internal controls over financial reporting including IT-GRC (Li et al. 2012; Li et al. 2010; Masli
et al. 2016). Periodically, executives as well as the independent external auditors of the firms assess
the design and operating effectiveness of the firms’ IT-GRC mechanisms for compliance with a
multitude of relevant laws, regulations, and industry standards (e.g., SOX, HIPAA, GLB,
PCI/DSS, etc.).5
In SOX audits, the finding of a material weakness, the most severe type of control deficiency,
in internal controls of a firm, including the IT-GRC, could have serious consequences for the firm,
its investors, and it top executives. After the enactment of SOX, the quality of Internal Controls
5 SOX: The Sarbanes–Oxley Act; HIPAA: The Health Insurance Portability and Accountability Act; GLB: The Gramm-Leach-
Bliley Act; PCI/DSS: The Payment Card Industry Data Security Standard.
5
over Financial Reporting (ICFR) became highly visible to capital markets. Failing to maintain an
effective ICFR, including an effective IT-GRC, elicits negative reactions from the capital markets
(Beneish et al. 2008; Hammersley et al. 2008); increases noise in accounting information of the
firm and causes unintentional accounting and forecasting errors (Ashbaugh-Skaife et al. 2008;
Feng et al. 2009); increase firm’s compliance costs (Hogan and Wilkins 2008; Krishnan et al. 2008;
Raghunandan and Rama 2006); increase firm’s cost of capital (Ashbaugh-Skaife et al. 2009); and
leads to more frequent executive turnover (Johnstone et al. 2011; Li et al. 2010; Masli et al. 2016).
Under certain circumstances, it can also lead to the de-listing of the firm from the stock exchange.
The CEO and CFO of the firm could be fined up to $5 Million and sent to jail for up to 20 years.
IS researchers who focus on consequences of ineffective IT-GRC mechanisms find that firms
that have material weaknesses in their IT-GRC mechanisms: (1) are not able to make accurate
management forecasts (Li et al. 2012); (2) are more likely to terminate the employments of their
CEOs and CFOs (Masli et al. 2016) who in turn have a hard time in finding comparable jobs
(Haislip et al. 2015); (3) report lower accounting earnings and lower market valuations (Stoel and
Muhanna 2011); (4) have less ability to pay their debts (Kuhn et al. 2013); and (5) and end up
reporting more material weaknesses and misstatements than firms which do not have material
weaknesses in their IT controls (Klamm and Watson 2009).
Given what is at stake for the firm and the executives, a more plausible explanation could be
that firm institutes the IT-GRC mechanisms required by the relevant laws, regulations, and
industry standards, but that the mechanisms become ineffective over time. If the firm’s business
is changing dynamically to adapt to the changes in the environment, the IT-GRC mechanisms can
fail to catch up with the changing business objectives, risk profile, and the new IT-GRC needs of
the firm. In this study, we focus on this explanation. We seek to identify strategic repositioning

6
moves of the firm that have unintended negative impacts on the effectiveness of the firm’s IT-
GRC mechanisms.
We ground our theoretical development in complexity science. We view both firms and their
competitive environments as complex adaptive systems (CAS). As the complexity level in the
external CAS increases, firms face adaptive tension (Boisot and McKelvey 2011). They address
the adaptive tension by adjusting the variety and complexity levels within their internal CAS
(Ashby 1956). They make strategic repositioning moves that add new businesses to their business
portfolio or delete some of the existing ones. An unintended consequence of such strategic
repositioning moves is that they change the business objectives and the risk profile of the firm.
Accordingly, they also change the IT-GRC requirements of the firm. Thus, we expect strategic
repositioning moves to significantly disrupt and reduce the effectiveness of the firm’s IT-GRC
mechanisms.
In complex dynamically changing environments, firms make diversification and merger and
acquisition (M&A) moves to add new businesses to adjust the internal variety and complexity of
their business their portfolios. Such moves have significant implications for IT integrations across
the old and the newly added businesses, which could disrupt the existing IT-GRC mechanisms of
the firm (Tanriverdi 2005; Tanriverdi and Uysal 2011; Tanriverdi and Uysal 2015). Firms also
make divestiture moves to sell off some of their businesses and focus their business portfolios.
However, carving out and separating previously integrated IT systems of the divested unit often
proves problematic to the remaining businesses, and hence, it could disrupt the effectiveness of
IT-GRC mechanisms (Tanriverdi and Du 2009). Firms also make internal restructuring moves to
redefine the relationships among their businesses in ways to match the changing complexity level
in the environment (Eisenhardt and Brown 1999). Such restructuring initiatives could also disrupt

7
and reduce the effectiveness of IT-GRC mechanisms.
In section II, we review the theoretical foundations in which the proposed theory will be
grounded. In section III, we develop hypotheses to explain how and why strategic repositioning
moves impact the effectiveness of the IT-GRC mechanisms. In section IV, we present the sample,
data, and procedures used for testing the hypotheses, and present the results. In section V, we
discusses the contributions and implications of the proposed theory for IS research and practice.
THEORETICAL FOUNDATIONS
Management control theory provides the theoretical underpinnings of our dependent construct,
IT-GRC mechanisms. IS literatures on governance, control and risks provide the foundations for
different types of IT-GRC mechanisms. Complexity science provides the theoretical foundations
for developing the nomological links between our independent constructs, strategic repositioning
moves of firms, and our dependent construct, the effectiveness of IT-GRC mechanisms.
Management Control Theory
Firms have business objectives such as profitability, growth, and shareholder wealth creation.
However, there is a multitude of hurdles that could inhibit the achievement of those business
objectives: e.g., technical risk, financial risk, operational risk, regulatory compliance risk, etc. Risk
is defined as the probability of loss and the magnitude of loss (Tanriverdi and Ruefli 2004).
Management control systems aim to avoid or minimize such hurdles, and enable the firm to achieve
its business objectives.
Management control systems refer to a wide range of formal and informal governance and
control mechanisms (Simons 1991). Informal mechanisms include leadership, culture, values, and
norms (Macintosh 1994). Formal mechanisms include agreements and assumptions about firm’s
business objectives and the risks that could potentially inhibit their achievement (Goold and Quinn
8
1990). Then, managers institute formal GRC or internal control mechanisms to provide reasonable
assurance (not absolute assurance) for the achievement of the business objectives and the
minimization of the risks. The scope of the GRC mechanisms usually covers: (i) effectiveness and
efficiency of operations, (ii) reliability of financial reporting, and (iii) compliance with applicable
laws and regulations (COSO 1992). After designing and implementing the GRC mechanisms,
managers also continuously monitor their operating effectiveness (Eisenhardt 1985; Ouchi and
Maguire 1975). If there are deviations from the desired business objectives, managers intervene
by imposing sanctions, redesigning the GRC mechanisms, changing the objectives, etc. (Goold
and Quinn 1990).
Information Systems Literature on IT-GRC Mechanisms
In an increasingly digital world, firms digitize their products, services, business processes, and
relationships with their customers and business partners. While digitization offers many business
benefits and opportunities, it also increases IT-related risks such as data security and privacy
breaches, digital fraud, and operational IT glitches (IIA 2012). Hence, IT becomes an increasingly
critical component of a firm’s management control systems (Weidenmier and Ramamoorti 2006).
Consistent with the management control theory, IS research and practice recommend IT-GRC
mechanisms for mitigating IT-related risks of firms in: (i) the general computing infrastructure of
the firm, and (ii) the IT applications that automate and support the firm’s business processes (IIA
2008; IIA 2009; IIA 2012).
IT general controls (ITGC). In the general computing infrastructure of the firm, the firm
faces many risks in: (i) planning and organizing its IT assets, (ii) acquiring and implementing the
IT assets, (iii) delivering and servicing the IT solutions, and (iv) monitoring if the general
computing infrastructure of the firm operate as intended on an ongoing bases (ITGI 2007).

9
The IS literature on IT governance, control, and security focus on such ITGC risks: e.g., IT
investment risks, IT application development risks, IT implementation risks, IT operational failure
risks, IT security risks, IT outsourcing risks, etc. (e.g., Barki et al. 2001; Keil et al. 1998; Lyytinen
et al. 1998; Weill and Broadbent 1998). To mitigate the ITGC risks, IS researchers suggest various
IT-GRC mechanisms such as aligning business and IT strategies and investment objectives
(Henderson and Venkatraman 1993); setting up IT governance structures (Sambamurthy and
Zmud 1999; Weill and Ross 2005); choosing proper control modes to regulate individual behaviors
and obtain desired behaviors in software development projects and IT implementation projects
(e.g., Kirsch 1996; Kirsch 1997); establishing IT security policies, training users for IT security
awareness, and establishing security countermeasures (e.g., D'Arcy et al. 2009; Ransbotham and
Mitra 2009; Straub 1990). IS practice also suggests IT-GRC mechanisms for IT human resource
management, IT documentation, IT program change management, segregation of IT duties, backup
and recovery, and business continuity (ITGI 2007).
Automated process controls (APC). Firms also face IT-related risks in IT applications that
automate their business processes. For example, input data going into an IT application might be
at risk of being invalid, incorrect, incomplete or unauthorized. The processing logic embedded in
the IT application might be at risk of not following the most up-to-date business rules and look-up
tables, not handling the exceptions, and hence, not being valid. The outputs coming out of the IT
application might be at risk of not being valid, not displaying the relevant outputs, or not being
accurate (IIA 2009). In addition, if the duties of users who have access rights to the IT applications
are not segregated properly, opportunities for fraud could be created. For example, if a user, who
has access rights to create vendors in the system, is also mistakenly given access rights to pay
vendors, opportunity is created for fraud. The user can create fake vendors and pay himself. To

10
mitigate such risks, firms embed automated process controls (APC) into the IT applications. APC
cover input controls, processing controls, outcome controls, and segregation of duty controls (IIA,
2009).
Managers inject explicit business rules, norms, roles, process prescriptions, and APCs into IT
applications (Gosain 2004). Then, the IT applications monitor and regulate the inputs, outputs, and
processing integrity of the business processes in real time. Automating the process controls offer
many benefits such as continuous auditing, remote monitoring, real-time alerts on errors and
glitches, and automatic match, validation, and reconciliation of different data sources (Hansen and
Hill 1989). For example, one IT application can automatically validate a payment transaction prior
to the actual payment by matching the purchase order, the receiving report, and the invoice from
vendors, raise a flag and alert management if exceptions are identified. In addition to automating
preventive controls, APC also increases the effectiveness of detective and corrective controls by
increasing the traceability of business transactions through recording of audit trails or logs along
with the execution of each business transaction (Weber 1982). To automate business processes,
managers standardize and document the inner workings of, and the interfaces among, processes,
which further increase the transparency and thus the auditability of business processes (Chapman
and Kihn 2009).
Complexity Science
Complexity is a property of a system that is made up of a large number of parts that interact
with each other in non-linear ways (Maguire 2011). The focal complex system of interest in this
study is a firm, which is made up of businesses. The parts of this complex system are the business
units. Relationships among the business units (e.g., resource sharing) are the interactions among
the parts (Eisenhardt and Piezunka 2011). Business units are heterogeneous, intelligent, and

11
adaptive parts. They can observe and interpret stimuli from each other and from the environment.
They can learn, change their behaviors, and adapt to the changes in the environment intelligently
(Casti 1997; Holland 1995). Business units can also have agency. They can pursue their own self-
interests rather than the strategies, objectives, and prescribed behaviors of the corporate center of
the firm. While the corporate center emphasizes cross-business synergies to maximize the overall
performance of the corporation (Tanriverdi 2005), individual business units can forego the
synergies and seek to maximize their own performance, which is suboptimal for the performance
of the corporation (Campbell et al. 2014). Thus, there is constant tension between the business
units and the corporate center as to which objectives the business units ought to pursue. This is
important for our theory because the changing business objectives change the risk profile of the
firm, which in turn changes the IT-GRC needs of the firm.
The competitive environment in which the firm operates is also a complex adaptive system
(CAS). The parts of the external CAS are customers, markets, rival firms, regulators, etc.
Competitive actions and reactions of rival firms, changing customer needs, market conditions, and
regulations are the interactions among the parts of the external CAS. As the complexity in the
external CAS changes, firms face adaptive tension (Boisot and McKelvey 2011). Ashby (1956)
law of requisite variety suggests that firms can address the adaptive tension by adjusting their
internal complexity. Indeed, managers adjust internal structures of their firms based on the
complexity and uncertainty levels in the external environment (Davis et al. 2009). Managers
strategically reposition their business portfolios. They reconfigure the composition of the
businesses in the portfolio (parts) and the nature of the relationships (interactions) among them in
order to adjust the variety and complexity levels of their internal CAS in ways to match the external
CAS. Such strategic repositioning moves are likely to change the business objectives, risk profiles,
12
and hence, IT-GRC needs of the firm.
In this study, we build on the corporate strategy literature to identify the strategic repositioning
moves that enable managers to adjust the complexity level of their internal CAS (Campbell et al.
2014; Eisenhardt and Brown 1999; Ramanujam and Varadarajan 1989). First, firms increase their
internal variety and complexity by adding new businesses (new parts) to their business portfolios.
They do so through organic diversification moves or mergers and acquisitions. Further, firms can
diversify within domestic markets or foreign (international) markets. Second, firms strategically
decide on the nature of the relationships (interactions) among the businesses in their portfolio.
They either create related, synergistic business portfolios (tight interactions) or diverse, unrelated
business portfolios (loose interactions). Third, firms decrease their internal variety and complexity
by exiting some of their businesses (parts) through divestiture moves. They cut the relationships
(interactions) between the divested business and the rest of the business portfolio. Fourth, firms
make internal restructuring moves to patch and restitch a continually shifting mix of businesses in
their portfolios to match the changing complexity in the external environment (Eisenhardt and
Brown 1999). In the next section, we explain how and why these strategic repositioning moves are
likely to impact the effectiveness of IT-GRC mechanisms.
HYPOTHESES DEVELOPMENT
Corporate Diversification and the Effectiveness of IT-GRC Mechanisms
A key element of a firm’s corporate strategy choices is where to position and play. Some
firms choose to focus on one industry position or a limited number of industry positions while
others diversify across multiple industry positions (Campbell et al. 2014). Diversification is
defined as the entry of a firm into new lines of businesses that entail changes in the firm’s
administrative structures, systems, and other management processes (Ramanujam and Varadarajan

13
1989). Firms diversify for both proactive and defensive reasons. Diversification can enable a firm
to seize emerging new opportunities in a dynamically changing environment. Diversification can
also enable the firm to diversify its cash flow risks. While cash flows from some businesses can
decline, cash flows from other businesses can increase and smooth out the overall cash flows of a
diversified firm. The firm can strategically adjust its diversification level up or down over time to
adapt to the changing variety and complexity levels in the external CAS.
Increasing diversification level increases the variety and complexity of a firm’s internal CAS
by adding more parts (businesses) to it. While it helps to match the variety and complexity of the
external CAS, increasing diversification level also increases the scope and diversity of the
businesses in the firm’s business portfolio and puts strains on the firm’s administrative structures,
managerial systems, processes, and controls (Chandler 1962). In response, the firm seeks to expand
the scope of its IT environment to accommodate the increased communication, coordination, and
knowledge management needs of its business portfolio (Tanriverdi 2005; Tanriverdi 2006).
Accordingly, the IT-GRC mechanisms need to be revised or redesigned to accommodate the new
business objectives, the new risk profile, and the new IT-GRC needs of an expanded portfolio of
businesses. Such changes are likely to disrupt the firm’s IT-GRC mechanisms.
H1: Firms that have higher diversification levels are more likely to reduce the effectiveness of
their IT-GRC mechanisms.
Foreign (international) Operations and the Effectiveness of IT-GRC Mechanisms
The “direction of diversification” is another key element of a firm’s corporate strategy choices:
e.g., which customers and geographic markets to enter (Ramanujam and Varadarajan 1989). In an
increasingly global economy, boundaries of the firm’s external environment are no longer confined
to the domestic economy. Firms make strategic moves to take advantage of opportunities emerging
in foreign (international) economies as well. According to Goldman Sachs, S&P 500 firms

14
generated 33% of their aggregate revenues from foreign operations in 2014.6 Such statistics attest
to the pervasiveness and the importance of firms’ strategic repositioning moves to foreign markets.
Entry into foreign operations not only adds more parts (businesses and markets) to the internal
CAS of the firm, but it also increases the diversity of the parts and the interactions among the parts.
Diversity of the parts increases due to the differences in the institutional environments (e.g., laws,
regulations, intellectual property regimes, currencies), cultural environments (e.g., norms, beliefs,
language), and geographies (e.g., time zones) of the firm’s businesses and markets across the globe.
Diversity of the interactions among the parts also increases due to increasing resource flows and
arbitrage opportunities. For example, recent policy debates stemming from currency fluctuations
and tax differentials across world economies affect the strategic decisions and performance of not
only the foreign subsidiaries of a firm but also the entire firm. The increasing diversity of the parts
and the interactions within the firm’s CAS has significant implications for the IT environment and
IT-GRC mechanisms of the firm. IS researchers coined the term, “digitally-enabled, globally
extended enterprise” to emphasize the central role that IT plays in enabling foreign operations
(Krishnan et al. 2007). IT-GRC mechanisms which used to be optimized for the domestic
operations of the firm will need to take into account the new business objectives, new risk profiles,
and new IT-GRC needs of the newly added foreign operations. Such changes are likely to disrupt
the firm’s IT-GRC mechanisms.
H2: Firms that operate in foreign markets are more likely to reduce the effectiveness of their
IT-GRC mechanisms.
Corporate Acquisitions and the Effectiveness of IT-GRC Mechanisms
The “mode of diversification” is also a key element of the firm’s corporate strategy choices
(Ramanujam and Varadarajan 1989). In diversifying into a new market, the firm can either use the
6 http://www.businessinsider.com/foreign-revenues-by-region-2015-7

15
processes of internal business development or acquire an existing firm in that market. Increasing
costs of internal business development coupled with rapidly changing market conditions motivate
firms to rely more on corporate acquisitions as the mode of diversification (Ramanujam and
Varadarajan 1989). In acquisition transactions, acquirers often aim to integrate targets to achieve
synergy benefits. Most of the synergies are IT-dependent because administrative structures,
managerial systems, processes, and controls of modern firms are implemented in IT (e.g., Mehta
and Hirschheim 2007; Tanriverdi and Uysal 2011).
From a complexity perspective, the post-acquisition IT integrations are very challenging and
disruptive to both acquirers and targets (Tanriverdi and Uysal 2015). To start with, each firm is a
CAS. Bringing the two CAS together means that there will be disruptions to both (Allen et al.
2002). Even if the strategies, structures, processes, control systems, cultures, human resources, and
information systems of the two CAS were very similar, during the integration process there are
two competing parts for each new part of the integrated CAS. For example, there are two CIOs,
two sets of IT infrastructures, two sets of IT applications, etc. One of them will survive, the other
one will have to go; or both will have to go; or both will survive but will assume new roles and
functions. This is a highly political and emotional change management process in which both CAS
experience disruptions in creating the new CAS (Allen et al. 2002). The implication for IT-GRC
mechanisms is that the IT-GRC mechanisms of the acquirer and the target will also be disrupted,
but that the requirements of the new IT-GRC mechanisms of the merged CAS will not be clear
until after the rational, political, and emotional dynamics of the integration unfold and stabilize.
Thus:
H3: Firms that have higher M&A intensity levels are more likely to reduce the effectiveness of
their IT-GRC mechanisms.
Corporate Divestitures and the Effectiveness of IT-GRC Mechanisms
16
Corporate divestiture is the opposite “mode of diversification” in which a firm reduces the
scope and the diversification level of its business portfolio by selling some of its business positions
or assets to another firm (Brauer 2006). Firms often use divestitures to exit positions whose
profitability levels decline over time due to changes in the environment. By reducing the number
of parts in the firm’s internal CAS, divestiture can reduce the internal variety of the firm. However,
divestiture does not necessarily reduce the complexity level of the firm’s internal CAS.
Prior to the divestiture, the seller and the to-be-divested unit were in a parent-subsidiary
relationship. To be able to comply with the relevant laws and regulations, parent firms integrate
mundane support functions such as accounting, finance, HR, payroll, treasury, tax, etc., even
though the businesses in their portfolios are unrelated in terms of customers and products
(Tanriverdi 2005). Since the mundane support functions are implemented in IT systems and
applications, there is also IT integration between parents and business units. After the divestiture
transaction, the divested unit needs to be legally separated from the parent. Thus, the parent needs
to carve out and separate it from the shared support and IT services environment of the corporation.
Carving out and separating one of the parts of the firm’s internal CAS means that some of the
connections and interactions of the remaining parts need to be terminated, or rewired and redefined.
As the IT carve-out and separation process severs the previous connections and interactions, it
causes disruptions to both the parent and the divested unit (Tanriverdi and Du 2009). The previous
IT-GRC mechanisms, which were designed for a larger scope and diversity of businesses, also
need to be redesigned. The changing business objectives, risk profiles, and the IT-GRC needs of
the smaller, more focused portfolio of businesses is likely to disrupt the IT-GRC mechanisms.
H4: Firms that have higher divestiture intensity levels are more likely to reduce the
effectiveness of their IT-GRC mechanisms.
Corporate Restructuring and the Effectiveness of IT-GRC Mechanisms

17
Corporate restructuring refers to changes in administrative structures, management
systems, processes, and workforce reconfiguration moves of corporations (Brauer 2006; McKinley
and Scherer 2000). After a period of strategic repositioning moves such as the diversification,
foreign entry, M&A, and divestiture moves discussed above, the firm’s internal administrative
structures, systems, processes, and workforce skills are likely to lose coherence. Firm makes
corporate restructuring moves to patch and restitch the continually shifting mix of businesses to
better match its internal CAS better with the external CAS (Eisenhardt and Brown 1999). The
scope of changes in structuring is very large since the administrative structures, management
systems, processes, and workforce skills of the corporation are affected. Those changes also imply
major changes in the IT-GRC mechanisms. Thus, the risk of disruption to the IT-GRC mechanisms
is high.
H5: Firms that engage in corporate restructuring are more likely to reduce the effectiveness
of their IT-GRC mechanisms.
METHODS
Data and Research Context
The test of the proposed theory requires a longitudinal data set in which strategic repositioning
moves and IT-GRC effectiveness of firms could be measured. Data for measuring strategic
repositioning moves are available from Compustat, SDC platinum, and SEC’s EDGAR databases.
Longitudinal data on the effectiveness of IT-GRC mechanisms is available for publicly traded
firms in the US that are subject to the Sarbanes–Oxley (SOX) Act. Section 404 of SOX requires
publicly traded firms to design and effectively operate IT-GRC mechanisms, as part of their
internal controls, to ensure the accuracy and reliability of financial information generated through
the IT systems of the firm.
In SOX 404 compliance audits, external auditors evaluate hundreds of IT controls that

18
constitute a firm’s IT-GRC mechanisms, and issue an opinion about their overall effectiveness (Li
et al. 2012; Masli et al. 2016). They classify the severity of any IT control deficiencies into: (i)
lowest severity: ordinary deficiency (D); (ii) moderate severity: significant deficiency (SD); or (iii)
highest severity: material weakness (MW). If the IT control deficiencies remain at low (D) or
moderate (SD) severity levels, auditors conclude that the IT-GRC mechanism of the firm is
effective. They report the D and SD types of IT control deficiencies only to the management of
the firm. Thus, our dataset indicates that the firm’s IT-GRC mechanism is effective even when the
firm may have D and SD types of IT control deficiencies. If the auditors elevate the severity level
of IT control deficiencies to MW, they conclude that the IT-GRC mechanism of the firm is
ineffective. This means that the financial information that goes into the financial statements of the
firm is not reliable. This conclusion as well as the detail of the IT control deficiencies are reported
to the SEC and the investing public. Our dataset captures the MW type of IT control deficiencies.
Strategic repositioning moves of firm could potentially create D (low), SD (moderate), or MW
(high) types of deficiencies in the firm’s IT-GRC mechanisms. By capturing whether or not there
is any MW type of IT control deficiency in firms, our data allows the strongest possible test of the
proposed theory. If this dataset shows that the hypothesized strategic repositioning moves create
MW in IT-GRC mechanisms, it would imply that the hypothesized relationships are so strong that
they are detected with even the most severe type of IT control deficiencies.
Sample
Our sampling frame is the list of publicly traded firms in the U.S. stock markets. SOX 404
audit results of these firms are available in Audit Analytics, a premium public company
intelligence database. Our study timeframe ranges from firms’ fiscal year 2004, the first SOX
compliance year, to their fiscal year 2009. We use the “SOX 404 Internal Controls” section of the
19
database and rely on the independent auditor’s opinion rather than the management’s own opinion.
If a firm restates its SOX auditing reports several times for a particular year, we use the latest
available restatement.
We selected our sample based on three criteria. First, following previous studies in the SOX
context (e.g., Feng et al. 2015), we selected only those firms known as “accelerated filers,” which
are defined by the SEC based on the size of firms’ public shares.7 Second, we excluded foreign
firms that were listed in the U.S. stock markets. This criterion ensures that all firms in our sample
are U.S firms and that they are subject to the same regulatory environment.8 Third, following
previous studies (e.g., Iliev 2010), we exclude firms from the financial industry because they had
long been under other regulations similar to SOX.
We then collected further data from a variety of data sources for the computation of
independent and control variables, including Compustat, SDC platinum, SEC’s EDGAR, Bureau
of Economic Analysis’s industrial IT investment database, and the Information Week 500 annual
rankings. The final estimation sample consists of 2,475 firms with 10,938 observations across six
years (2004-2009).
Dependent Variables
Internal Control MW, Non-IT Control MW, and IT-GRC MW. While our primary
research interest is to develop and test the relationships between strategic moves and the
effectiveness of IT GRC mechanisms, our empirical investigation started by analyzing the
7 After the SOX Act was enacted in 2002, the regulator required publicly-traded firms with a public float of at least $75 million,
known as accelerated filers, to comply with the regulation in 2004, while non-accelerated filers did not have to comply before
2007. In addition, accelerated filers need to comply with both Section 404(a) and 404(b) of the SOX Act, while non-accelerated
filers only need to comply with 404(a). Thus, excluding non-accelerated filers can ensure the comparability of firms in our
sample. In addition, because we are theoretically interested in complexity, accelerated filers, which by definition are larger in size
than non-accelerated filers, provide a better empirical context for our hypothesis testing. 8 Foreign firms listed in the U.S. stock markets are also subject to the SOX rules but with a different deadline. While U.S.
accelerated filers need to comply with the regulation in 2004, foreign firms only need to submit their SOX 404 audit reports for
the fiscal year ending on or after 15 July 2006 (Piotroski and Srinivasan 2008).

20
influence of these moves on the overall internal control effectiveness. The relationships between
some of the strategic moves (diversification, foreign operation, acquisitions, and restructuring) and
the overall internal control systems have been empirically investigated in the accounting literature
(e.g., Ashbaugh-Skaife et al. 2007; Doyle et al. 2007; Ge and McVay 2005). We started by trying
to replicate the previous findings by using new datasets and new estimation techniques. In addition,
because divestiture has not been emphasized in the literature, we also aim to add to the general
accounting literature by testing the influence of divestiture on the overall internal control systems.
Thus, our first dependent variable is the presence [1] or absence [0] of material weaknesses (MWs)
in a firm’s overall internal control systems in a given year.
A firm reporting MWs in its internal control systems could have both IT-related and non-IT-
related MWs. To better understand the specific control mechanisms that could be disrupted by
various strategic moves, we use the presence [1] or absence [0] of only non-IT control MWs and
IT GRC MWs in a firm in a given year as our second and third dependent variables respectively.
For a firm with MWs identified, the Audit Analytics database will also record the nature of the
MWs by coding them into a list of predefined categories. IT-related MWs are coded as #22, and
we treat all the other types of MWs as non-IT MWs. However, prior studies report that Audit
Analytics make occasional classification mistakes by labeling some non-IT weaknesses as IT
weaknesses (Canada et al. 2009). Thus, following prior studies (Canada et al. 2009; Masli et al.
2016), we read the original SEC annual filings (usually forms 10-K or 10-KSB) of firms that
reportedly had MW in their IT-GRC. We identified that in 14 cases Audit Analytics misclassified
non-IT MW as IT MWs. We corrected them accordingly. After this correction, 163 unique firms
in our sample had reported IT GRC MW in our study timeframe.
Categorizing IT-GRC Mechanism MWs. While our primary dependent variable (IT GRC

21
MW) appears to be a binary variable capturing whether the external auditor found material
weaknesses in the IT GRC mechanisms of the firm or not, this opinion is the result of an extensive
review and evaluation of the design and the operating effectiveness of hundreds of IT general
controls (ITGC) and IT application controls, or automated process controls (APC) as we label
them in this study. The auditors’ evaluation also covers both the design and the operation
effectiveness of IT GRC mechanisms. If a firm’s external auditors conclude that its IT GRC is free
of MWs, the firm does not need to disclose any further detailed information. However, if MWs in
IT-GRC exist in either its design or its operation, the firm will disclose the specific IT controls and
the nature of their MWs in its regulatory filings. This allows us to conduct additional analyses as
to whether the hypothesized strategic repositioning moves affect (1) the ITGC and APC, and (2)
IT GRC design and operation in similar or different ways. To be able to conduct such analyses,
we manually coded the IT-GRC MW disclosures along two dimensions: ITGC MW versus APC
MW; and design MWs versus operation MWs.
To code IT GRC MWs, we followed the similar procedures used in previous studies from the
same research context (e.g., Li et al. 2012; Masli et al. 2016). We started with developing a coding
scheme that classifies IT controls into ITGC/APC and design/operation by synthesizing the
academic and practitioner literatures on ITGC audits and IT application audits (AICPA 2004; IIA
2009; IIA 2012; ITGI 2006; ITGI 2007). The coding scheme was then refined based on our
intensive discussion with partners and senior managers from big public accounting firms. The final
coding scheme used is presented in Appendix A. As shown in the coding scheme, ITGC controls
include IT governance controls, IT human resource controls, IT documentation controls, IT access
controls, IT computer operations controls, IT program development controls, IT change
management controls, and IT segregation of duty controls. Automated process controls (APC)
22
include controls embedded in IT applications such as input controls, processing controls, output
controls, and segregation of duty controls in business roles. The design of IT GRC mechanisms is
concerned with whether necessary mechanisms are present, adequate, and effective to mitigate
various IT-related risks at least on paper, and the operation of IT GRC mechanism is concerned
with whether the mechanisms are actually carried out consistently and effectively as designed.
From the SEC’s EDGAR database, we collected the annual filings of the firms that experienced
material weaknesses in their IT-GRC and excerpted the contents disclosing the nature of these
weaknesses. We then had two independent coders follow the coding scheme to classify whether
the IT material weaknesses were in ITGC/APC and design/operation categories. The concordance
rates between the classifications of the two coders, measured as Cohen’s Kappa (Cohen 1960),
were well over 90%. Remaining discrepancies, mostly caused by the ambiguity of the original
disclosure wording, were discussed by the authors to make final coding decisions.
Independent Variables
Diversification Level. As in prior studies, we use Palepu’s (1985) entropy measure of total
diversification to compute the total diversification level of a firm’s business portfolio across
different business segments in a given year. Specifically, Palepu computes the total diversification
with: ∑ 𝑃𝑖ln(1
𝑃𝑖)𝑁
𝑖=1 , where Pi is the share of the sales in segment i to the total sales of the firm; N
is the number of business segments the firm operates in. The data is obtained from Compustat
segment database.
Foreign Operations. As in prior SOX studies (e.g., Ashbaugh-Skaife et al. 2007; Doyle et al.
2007), we measure if a firm has foreign operations or not by examining if the firm reported [1]
foreign currency translation gain/loss [Compustat item FCA] in its firm’s financial statements or
not [0]. Because financially immaterial items are not reported separately, the presence of foreign
23
currency transaction gain/loss in a financial statement is a reliable indicator of the firm’s foreign
operations (Doyle et al. 2007; Masli et al. 2010).
Acquisition Intensity. We build on Moeller et al. (2004) in computing the acquisition intensity
of a firm in a given year. We compute the ratio of the total value of the firm’s acquisition
transactions completed during that year to the market value of the firm’s invested capital at the
end of that year. This measure captures what percentage of the firm’s year-end market value came
through the acquisitions during the year. We first select all acquisition transactions of the firm in
a given year from the SDC Platinum database and sum their transaction values. Then, we follow
previous finance studies (e.g., Hitchner 2006; Moeller et al. 2004) to compute the market value of
the firm’s invested capital as the sum of the market value of the firm's outstanding shares
[Compustat item CSHO multiplied by item PRCC_F], the liquidating value of preferred stock
[Compustat item PSTKL], the book value of long-term debt [Compustat item DLTT], and the book
value of debt in current liabilities [Compustat item DLC]. The specific fiscal year ending date of
each firm had been taken into account to formulate the correct one-year time window to select
acquisition transactions. There were five observations in which the total transaction value of the
firms’ acquisitions in a particular year exceeded the firms’ year-end market value. We excluded
those observations to avoid extreme acquisition cases.
Divestiture Intensity. We build on Klein (1986) in computing the divestiture intensity of the
firm as the total value of a firm’s divestiture transactions completed during a year divided by the
firm’s market value of invested capital at the beginning of that year. This measure captures what
percentage of the firm’s market value at the beginning of the year was divested during the
divestiture transactions that year. The value of divestiture transactions was obtained from the SDC
database. The market value of the firm’s invested capital was calculated with the same formula as

24
in the acquisition intensity. We dropped one observation where the firm’s divestiture intensity in
a particular year exceeded 100% of the firm’s market value of invested capital.
Corporate Restructuring. As in prior studies, we examine the presence [1] or absence [0] of
restructuring costs [CompuStat item RCP] in the firm’s financial statement to measure if the firm
engaged in significant corporate restructuring in that year (Masli et al. 2010). The generally
accepted accounting principles mandate that, to be reported as a separate item in financial
statements, a restructuring cost needs to be significant enough.
Control Variables
There are potential alternative explanations at the industry and firm levels as to why a firm’s
IT-GRC mechanism could become ineffective. At the industry level, industries that change
dynamically and digitize more intensively could increase disruptions to IT-GRC mechanisms. At
the firm level, if the overall governance and internal control environment of the firm is weak, if
the firm is financially distressed, or if the firm has poor IT capabilities, IT-GRC mechanisms could
also be weak. We control for these factors to be able to rule out the alternative explanations and
minimize endogeneity concerns. We also control for year effects.
Environmental Turbulence and Munificence levels of the firm’s businesses. Environmental
turbulence refers to the extent which the environment changes frequently and unpredictably, and
environmental munificence refers to the extent to which the environment can provide abundant
resources and opportunities to support a firm’s sustained growth (Dess and Beard 1984). As our
theory implies, firms operating in more turbulent environments face more adaptive tension, and
hence they may make more strategic repositioning moves and increase the likelihood of disruption
to their IT-GRC mechanisms. In contrast, firms operating in munificent environments often
accumulate more slack resources internally, and thus, they may be buffered from immediate

25
environmental disruptions.
We follow Dess and Beard (1984) to compute environmental turbulence and munificence. First,
we measure the two constructs at the level of an industry sector, defined based on NAICS (North
American Industry Classification System). Then, we compute the measures at the firm level by
taking a revenue-weighted average of the industry level measures based on the industry sectors
from which the firm generates revenues. In specific, for an industry sector i at year t, we calculate
the average revenue of all the firms in that sector, denoted as yit. Then, for each industry sector i
and year t, we regress the sector-average revenue on time in a five-year time window by estimating
equations yit = βit+ βitT+εit, where T takes values of t, t-1, t-2, t-3, t-4, and t-5 and εit is the residual.
Then, the environmental turbulence of the industry segment i at year t is computed as the standard
error of estimated βit divided by the average of yit in the past five years; while the environmental
munificence is computed as the estimated value of βit divided by the average of yit in the past five
years (Dess and Beard 1984). Second, we calculate turbulence and munificence for a given firm
by analyzing the industry sector(s) in which the firm operates. For a firm operating in only one
industry sector, we apply the turbulence and munificence measures of the same industry sector to
the firm. For a firm operating in multiple industry sectors, we measure environmental turbulence
and munificence as the revenue weighted average of all industry-level turbulence and munificence
scores of the industry sectors in which the firm operates. The weight of a sector is the percentage
of revenue the firm generates from that sector (Carpenter and Fredrickson 2001).
Environmental IT intensity of the firm’s businesses. We also argued that industries in which
digitization levels are higher could be subject to more disruptions in IT GRC. Thus, we need to
control for the environmental IT intensity of a firm’s businesses. We first computed the IT intensity
of every industry sector as the ratio of the software and hardware stock value to the total equipment

26
stock value in that segment (McAfee and Brynjolfsson 2008). Bureau of Economic Analysis (BEA)
provided these industry-level IT data needed for this calculation. Then, we computed firm-level
IT intensity as the revenue-weighted average of the IT intensity levels of all industry sectors in
which the firm operates in a particular year.
Following previous studies (e.g., Ashbaugh-Skaife et al. 2007; Doyle et al. 2007; Masli et al.
2010), we also control for firms’ size, profitability, and financial leverage ratios.
Firm size. We measure firm size as the book value of the firm's total assets [CompuStat item
AT]. We log-transform this measure to reduce its skewness.
Firm profitability. We measure a firm’s profitability with the firm’s return on equity (ROE),
calculated as Earnings Before Interest and Taxes / (Total Assets – Total Liabilities) [CompuStat
items EBIT / (AT - LT)]. Following previous studies (e.g., Doyle et al. 2007), we winsorized the
ROE variable at the 1th and 99th percentiles to limit extreme values.
Firm’s financial leverage. We measure a firm’s financial leverage as the ratio of the firm’s
total liability [CompuStat item LT] to total assets [CompuStat item AT].
Corporate Governance Weaknesses. If the overall corporate governance environment of the
firm is weak, IT-GRC mechanisms could by negatively influenced by the “tone at the top” and
also become weak. Thus, we control for weaknesses in the firm’s overall corporate governance.
As part of the SOX audit, independent external auditors assess a variety of corporate governance
mechanisms. We use three of them to measure this control. First, auditors assess whether the Board
of Directors (BoD) has an effective, adequately staffed Audit Committee. An Audit Committee
that has adequate experience and expertise can constantly engage in overseeing internal controls
and communicating with auditors about potential control deficiencies and remediation (Hoitash et
al. 2009; Krishnan 2005; Zhang et al. 2007). Second, auditors assess whether the Top Management

27
Team (TMT) is competent, whether the TMT sets an appropriate, ethical tone at the top for the
organization, and whether the TMT is reliable. TMT and CFOs in particular are immediately
responsible for the effectiveness of internal control systems. Their qualification and experiences
will influence the quality of internal control systems. Similarly, CIO experience and IT experiences
of other senior executives will influence the IT aspect of SOX compliance (Li et al. 2007; Li et al.
2010). Finally, auditors assess whether the firm has a sufficient internal audit function.9 If there is
an MW in any of these governance mechanisms, it would indicate that the firm has weak
governance structures. We count the MWs in these three categories to measure the weakness of
the firm’s overall corporate governance.
Auditor Status. The quality of a public firm’s external auditors could signal the firm’s
confidence on its financial reporting and internal control effectiveness. Thus, following previous
studies (e.g., Masli et al. 2010), we control for a firm's auditor status by including a binary variable
indicating whether [1] or not [0] the firm was audited by one of the prestigious “Big Four”
accounting firms (i.e., KMPG, PricewaterhouseCoopers, Ernst & Young, and Deloitte).
IT Capability of firm. There are differences in firms’ IT capabilities, i.e., how they use IT
resources to develop technological, procedural, and organizational innovations. The differences in
IT capabilities could affect IT-GRC mechanisms as well. Thus, we control for firms’ IT
capabilities. Every year, Information Week (IW) magazine invites firms to submit application
packages for listing consideration in the annual IW500 list. IW asks a panel of IW experts and
industry peers of the applicants to assess whether IT capabilities of the applicant firms are above
average in their respective industries. This assessment is not simply about IT investments of firms
9 In the Audit Analytics database, material weaknesses in corporate governance are reported as categories #11
(“Ineffective, non-existent, or understaffed audit committee”), #13 (“Senior management competency, tone, reliability
issues”), and #18 (“Insufficient or non-existent internal audit function”).

28
into generic IT applications and services provided by IT vendors. It is about how the firm
configures and customizes those generic IT resources to its specific business, and how the firm
achieves technological, procedural, and organizational innovations with those IT resources. If a
firm is selected into the IW500 list, it is considered to have strong IT capabilities. Thus, following
previous studies (e.g., Bharadwaj 2000), we measure IT capability of a firm by assessing whether
or not the firm was listed [1=strong IT capability] in the IW500 list [0=weak IT capability] in a
year.
Year Effects. We include dummy variables to control for unobserved year fixed effects.
To mitigate the risk of reverse causality, we lagged all our explanatory covariates, except for
environmental variables and auditor status, for one year. Table 1 presents descriptive statistics and
correlations among the study variables.
---Insert Table 1 about Here---
Model Specification
We adopt survival analysis (Allison 2010) as our primary estimation method. In our research
context, when the SOX Act turned effective in 2004, big public firms in the U.S. entered a “risk
set” such that they started to face the hazard of having their IT-GRC MWs, if exist, disclosed to
the public. Survival analysis techniques allow us to directly estimate the influence of various
factors on the hazards of a firm reporting MWs in its internal control systems in general or in its
IT or non-IT controls in specific.
One of the major advantages of using survival analysis in this research context is to account
for the issue of right censoring in our observations. Right censoring happens when the event of
interest (i.e., reporting IT GRC MWs) had not occurred for some firms in our sample at the end of
our study time window. Instead of disregarding these observations, we adopted survival analyses
29
that can leverage the information of all the firms in our sample despite of whether or not the event
of interest had happened to them. Another advantage of using survival analyses is to minimize the
assumption we need to make when specifying statistical models. To achieve this, we employ Cox
proportional hazards (PH) models (Cox 1972) that are semi-parametric and do not require us to
specify the exact form of the link function between our independent variables and the dependent
variable. Instead, Cox models allow us to model an individual firm’s hazard function as
proportional to an unknown baseline hazard function. Because we do not have a priori theory or
previous empirical studies to specify the exact distribution of the hazards of a firm reporting IT-
GRC material weakness, using semi-parametric models such as Cox models help reduce the
potential biases associated with the misspecification of statistical models. Lastly, we adopted
discrete-time Cox models by treating each year as one spell, or one unit of time, in our analyses.
Discrete-time models allow the inclusion of time-varying factors in hazard functions and hence
they accommodate the time-varying nature of our independent and control variables.
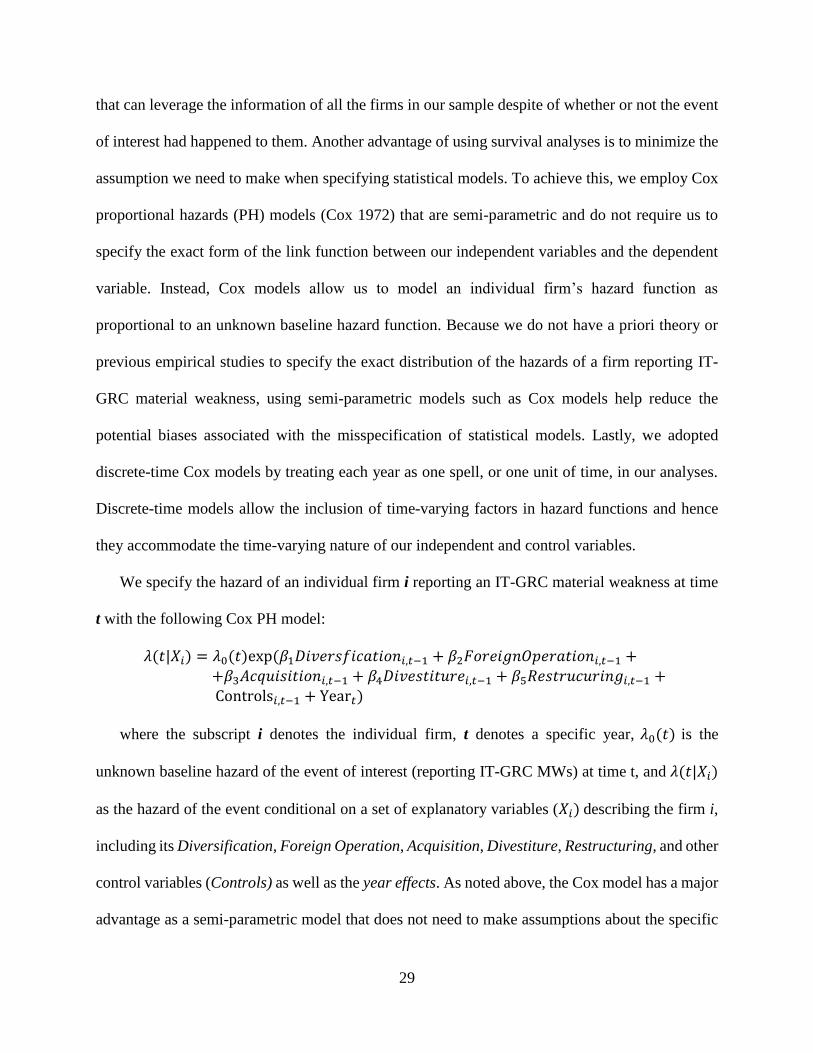
We specify the hazard of an individual firm i reporting an IT-GRC material weakness at time
t with the following Cox PH model:
𝜆(𝑡|𝑋𝑖) = 𝜆0(𝑡)exp(𝛽1𝐷𝑖𝑣𝑒𝑟𝑠𝑓𝑖𝑐𝑎𝑡𝑖𝑜𝑛𝑖,𝑡−1 + 𝛽2𝐹𝑜𝑟𝑒𝑖𝑔𝑛𝑂𝑝𝑒𝑟𝑎𝑡𝑖𝑜𝑛𝑖,𝑡−1 ++𝛽3𝐴𝑐𝑞𝑢𝑖𝑠𝑖𝑡𝑖𝑜𝑛𝑖,𝑡−1 + 𝛽4𝐷𝑖𝑣𝑒𝑠𝑡𝑖𝑡𝑢𝑟𝑒𝑖,𝑡−1 + 𝛽5𝑅𝑒𝑠𝑡𝑟𝑢𝑐𝑢𝑟𝑖𝑛𝑔𝑖,𝑡−1 +Controls𝑖,𝑡−1 + Year𝑡)
where the subscript i denotes the individual firm, t denotes a specific year, 𝜆0(𝑡) is the
unknown baseline hazard of the event of interest (reporting IT-GRC MWs) at time t, and 𝜆(𝑡|𝑋𝑖)
as the hazard of the event conditional on a set of explanatory variables (𝑋𝑖)describing the firm i,
including its Diversification, Foreign Operation, Acquisition, Divestiture, Restructuring, and other
control variables (Controls) as well as the year effects. As noted above, the Cox model has a major
advantage as a semi-parametric model that does not need to make assumptions about the specific

30
form of the baseline hazard function 𝜆0(𝑡). Instead, it assumes only that the hazard of an event for
firm i at time t is proportional to the baseline hazard, and then it directly models how the hazard
of the event per time unit varies in response to a set of time varying explanatory covariates (Cox
1972; Hosmer et al. 2008).
About 26% of the firms in our sample repeatedly reports IT GRC MWs in multiple years.
However, MWs in a firm sometimes persist for a couple of years, or one MW in a previous year
may morph into or trigger a different one in the consequent year (Klamm et al. 2012). Thus, a firm
that repeatedly reports MWs in multiple years does not necessarily have new MWs in each of those
years. By checking the original disclosure documents, we concluded that the majority of the firms
with multiple-year IT-GRC MW disclosures in our sample actually experienced the same MWs
that persisted for multiple years.10 Thus, we removed a firm from the risk set after it reports an IT-
GRC material weakness for the first time to avoid modeling multiple MW disclosures as new
events.
Diagnostic Analyses
The proportionality of hazards is the key assumption underlying Cox models. We followed
the recommendations of Cleves et al. (2010, ch.11) and conducted three diagnostic tests on this
proportionality assumption. First, we conducted the link test as a general specification test. After
estimating our primary Cox model and obtaining the estimated vector of coefficients �̂�, the link
test re-estimates the hazard model by using the linear predictor 𝑋�̂� and its squared term (𝑋�̂�)2 as
independent variables. Under the assumption that 𝑋𝛽 is the correct specification, the estimated
10 We manually checked all the IT GRC MW disclosure documents of the firms with multiple-year disclosures. In our
study time window (2004 – 2009), out of the 317 pubic firms that had ever reported IT GRC weaknesses in at least
one year, 83 (26%) reported IT GRC weaknesses in multiple years. Among them, in only 13 firms, IT GRC MWs
originally reported in an earlier year were fully remedied but new IT GRC weaknesses were found in subsequent
years. Dropping these 13 firms with multiple IT GRC MW occurrences, or dropping all the 83 firms with IT GRC
MW disclosures, will not qualitatively change our conclusions.
31
coefficient of 𝑋�̂� should be significant while the estimated coefficient of (𝑋�̂�)2 should be
insignificant, which we confirmed in our diagnostic test.
The second test is to directly check the proportional-hazard assumption of Cox models by
including interactions between all the time-varying independent variables and the logarithm of
survival time (Hosmer et al. 2008). Under the proportional-hazard assumption, the estimated
coefficient of these interaction items should not be significant. Following the recommendations of
Cleves et al. (2010) and Hosmer et al. (2008), we interact our five primary independent variables
with ln(t) and re-estimate the Cox models after including the interaction items. None of the
estimated coefficients of the interaction items are significant, thus supporting the use of Cox Model.
The third test is to check proportional-hazard assumption based on the analyses of residuals,
as discussed by Therneau and Grambsch (2000) and Cleves et al. (2010). We conducted the
proportionality test, and the results again failed to reject the proportionality assumption, and
provided support for the use of Cox model.
Alternative Statistical Methods
We also considered panel data models as alternative statistical methods to check the
robustness of our results. In selecting the most appropriate panel data model, we need to address
the same issue as discussed above that IT GRC weaknesses reported in different years are most
likely the same, persisting weaknesses instead of new ones. Thus, when organizing our data as a
cross-sectional, time-series data set, there would be high serial correlations among observations
from the same subject across years. We ran the serial correlation test, as discussed by Wooldridge
(2010) and implemented by Drukker (2003). The test result confirmed the existence of significant
serial correlation (F-value = 39.727, p-value < .001).
We then chose to use Generalized Estimating Equation (GEE) models, which allow us to

32
directly model the possible serial correlation among the outcomes from the same subject in
multiple years. GEE is a specific type of generalized linear models that apply to longitudinal data
analyses (Hardin and Hilbe 2003). It utilizes both cross-sectional and time-series information of a
panel data and directly accounts for the correlation structure of observations from the same subject
by estimating a parameterized correlation matrix (Zeger and Liang 1986). Our primary conclusions
are qualitatively unchanged based on GEE models.
RESULTS
We report our primary results in Table 2 below. In Model 1 of Table 2, we used the presence
[1] or absence [0] of overall internal control MWs as the dependent variable and estimated the
hazard of its presence based on a firm’s audit report. In Model 2, we used the presence [1] or
absence [0] of only non-IT control MWs as the dependent variable. In Model 3, we used the
presence [1] or absence [0] of IT-GRC MWs as the dependent variable. Then, we moved further
to investigate the different types of IT-GRC MWs. In Model 4 and Model 5, we estimated the
hazards of reporting CoIT MWs and APC MWs respectively. In Model 6 and Model 7, we
estimated the hazards of reporting IT-GRC design MWs and IT-GRC operation MWs. All the
models were estimated based on Cox models as specified above.
--Insert Table 2 about Here--
The Impact of Strategic Repositioning Moves on Overall and Non-IT Controls
The results of Model 1 in Table 2 show that foreign operation, intensive acquisition and
divestiture, and restructuring all increase the hazard that a firm experiences MWs in its overall
internal control system. For the roles of foreign operation, acquisition, and restructuring, previous
studies in the accounting literature have reported largely similar results (e.g., Ashbaugh-Skaife et
al. 2007; Doyle et al. 2007; Ge and McVay 2005; Krishnan and Visvanathan 2007; Zhang et al.

33
2007). They have reported mixed results in the role of diversification, while in our analyses,
diversification has no significant impact. Most of these previous studies used cross-sectional data,
relatively simplified measures, and logistic regression techniques. Thus, first, our study provided
further confirmation to the previous findings in the accounting literature by using different dataset,
measurements, and statistical methods. We also added to the literature by introducing the
disruptive role of divestiture to overall internal controls.
When we separated the disruption to an internal control system into non-IT and IT-related
areas, as in Model 2 and Model 3, it becomes evident that IT-GRC mechanisms are more prone to
be disrupted during strategic repositioning moves. According to the results of Model 2, non-IT
control mechanisms are significantly disrupted by divestiture and marginally so by foreign
operation and restructuring, but IT-GRC mechanisms are disrupted by all the five types of moves.
The Impact of Strategic Repositioning Moves on IT-GRC
Our hypotheses were validated based primarily on the results of Model 3. According to them,
the hazard of experiencing a material weakness in IT-GRC mechanisms increases significantly
with: (H1): diversification level (β = .377, p-value <.05); (H2): presence in foreign operations (β
= .374, p-value < .05); (H3): acquisition intensity (β = 1.884, p-value <.05); (H4): divestiture
intensity (β = 2.593, p-value < .01; and (H5): engagement in corporate restructuring (β = .507, p-
value < .01). These results provide empirical support for our theory that corporate strategy
repositioning moves of firms significantly disrupt and reduce the effectiveness of the IT-GRC
mechanisms, over and beyond the effects of alternative explanations discussed in the prior
literature and in practice.
The Impact of Strategic Repositioning Moves on ITGC and APC
As discussed earlier, we categorized whether the IT-GRC MWs were in the IT general controls

34
(ITGC) and or in the automated process controls (APC). Models 4 and 5 of Table 2 respectively
report how the hypothesized strategic repositioning moves affect the ITGC and APC.
The results indicate that the diversification level significantly increases the hazard of MW in
ITGC, but not in APC. Foreign operation increases the hazard of MW in APC marginally, but not
in ITGC. Corporate restructuring, acquisition, and divestiture all increase the hazard of MW in
both ITGC and APC in similar ways. Overall, we noticed some but not dramatic differences in the
disruptive effects of strategic moves on ITGC and APC.
The Impact of Strategic Repositioning Moves on IT-GRC Design and Operation
As discussed earlier, we also categorized whether the IT-GRC MWs were related to the design
or the operation of IT-GRC mechanisms. Models 6 and 7 of Table 2 respectively report how the
hypothesized strategic repositioning moves affect the design and operation of IT-GRC
mechanisms.
The results indicate that all the five types of strategic repositioning moves increases the hazard
of MW in the design of IT-GRC mechanisms, but only acquisition marginally increases the hazard
of MW in their operation. The contrast suggests show evidence that IT-GRC mechanisms appear
disrupted during strategic repositioning moves mostly because they become at least temporarily
obsolete. The design of IT-GRC mechanism, which were likely optimized based on the old
business environments, cannot be updated timely during the turmoil periods of strategic
repositioning moves.
The Impact of Strategic Repositioning Moves on Detailed Categories of IT-GRC
When categorizing IT-GRC mechanisms into ITGC and APC, we used a finer-grained coding
scheme that includes eight subcategories of ITGC and four subcategories of APC. We further
explored how the hypothesized strategic repositioning moves affect these twelve subcategories of

35
IT-GRC mechanisms. The results are reported in Table 3 below.
--Insert Table 3 about Here--
The results indicate that access controls, or the controls that ensure authorized access to
various IT resources such as hardware, network, databases and applications, are most prone to be
disrupted during all types of strategic repositioning moves. One commonality among the five
hypothesized strategic moves in our study is the implication on personnel turnover and
organizational redesign. Layoffs and reorganization are common during these strategic moves, but
updating user profiles and access privileges in a complex IT environment is often a daunting task
and may not be done timely or completely.
Probably due to the same effects of personnel turnover and organizational redesign, MWs
associated with IT human resources and the input controls to various IT applications also appear
to be associated with more types of strategic moves according to Table 3. After a major strategic
move, the IT department of the firm often also experiences major changes, including personnel
turnover. Even The retained IT employees are also likely to experience the “survivor’s syndrome”
(Cascio 1993) under which employees exhibit low morale, resist change, withdraw, and become
paralyzed after their peers are eliminated and their workloads increase (Ranganathan and Outlay
2009). Similarly, because of the organizational redesign, many previously integrated IT systems
need to be rewired, and the interfaces among them need to be updated or replaced. The input
controls embedded in these systems need to reflect the new business rules, processing logic, and
the roles of end users, which themselves are often in flux during a strategic move (Du and
Tanriverdi 2014).
DISCUSSION AND CONCLUSION
In an increasingly digital world, IT-related risks of firms are on the rise. The main defense

36
mechanism against the IT-related risks has been IT governance, risk, and control (IT-GRC)
mechanisms. IT-related risks impact not only firms but also investors and customers. Thus, a
multitude of laws, regulations, and industry standards are instituted to require firms to design and
effectively operate IT-GRC mechanisms to minimize the probability of loss and magnitude of loss
associated with the IT-related risks. Despite these efforts, the frequency and pervasiveness of data
privacy and security breaches, operational IT glitches, and digital fraud and theft incidents indicate
that even well governed firms that institute state-of-the-art IT-GRC mechanisms struggle to main
the effectiveness of their IT-GRC mechanisms over time and become vulnerable to IT-related risks.
This study contributes to IS research and practice by explaining how and why a firm’s own
strategic repositioning moves play a significant role in this problem.
Contributions to IS research
One potential contribution of this research is to the IS research stream on IT risks and the
management control theory. The findings indicate that the current theory is too static to address
the dynamically changing IT risks and IT-GRC needs of firms in an increasingly complex digital
world.
The predominant theory that informs the design of IT-GRC mechanisms for mitigating IT-
related risks of the firm is the management control theory. This theory assumes that business
objectives and risks of firms are understood well and that they remain relatively stable during the
planning cycle of firms, typically an annual cycle. Accordingly, the theory also assumes that the
IT-GRC mechanisms that are designed based on the business objectives and risk profiles of firms
can also remain effective during the planning cycle. This research challenges these assumptions
on the grounds that the business objectives, risk profiles, and hence, IT-GRC needs of firms change
dynamically. The external environment is a complex adaptive system (CAS) that continuously

37
produces new opportunities and threats. In response, firms adjust their internal CAS, through
strategic repositioning moves, to match the external CAS in ways to seize the emerging
opportunities and cope with the emerging threats. The repositioning moves change the business
objectives of firms, which in turn change the risk profiles of firms, which in turn render the existing
IT-GRC mechanisms of firms less relevant. Accordingly, IT-GRC mechanisms become less
effective or ineffective. The findings imply the need for a more dynamic management control
theory that can enable firms to realign their IT-GRC mechanisms dynamically with changing IT-
related risks of their businesses.
Complexity science provides some guidance for the development of more dynamic IT-GRC
mechanisms in the firm. First, complexity science cautions that the wicked problems produced by
complex adaptive systems such as the dynamically changing IT risks of firms cannot be “solved”
fully, but that they can be “tamed.” Second, complexity science recommends four interrelated
capabilities for “taming” the wicked problems (McDaniel 2007): (a) sensing, (b) sense making, (c)
improvising, and (d) learning on the fly. Sensing capability can spot the changes in business
objectives and risk profiles created by strategic repositioning moves of the firm. Sense making
capability can focus on human cognitions and social interactions of IT and business managers for
interpreting the changes, giving meaning to them, and understanding what they might imply for
the IT-GRC mechanisms of the firm. Improvising capability focuses on inventing novel actions in
response to the changes: e.g., novel IT-GRC mechanisms that could align well with the new risk
profile of the firm. Learning capability focuses on understanding how and why the improvisational
actions perform. It can enable IT managers to learn how the new IT-GRC mechanisms perform
after the implementation of the strategic repositioning moves.
Another potential contribution of this research is to IS research stream on IT strategy, IT

38
capabilities, and business value. The findings of this study imply that the very IS strategies and
capabilities that are proposed to address the return and performance challenges of a complex,
dynamically changing environment could also be reducing the effectiveness of IT-GRC
mechanisms and exposing firms to more IT-related risks.
To address the return and performance challenges of the dynamically changing external CAS,
IS research proposes dynamic alignment of business and IT strategies (Benbya and McKelvey
2006; Sabherwal and Chan 2001; Tanriverdi et al. 2010; Vessey and Ward 2013). It recommends
the creation of digital platforms and the digitization of resources to create digital options that can
confer firms with business agility and flexibility (Sambamurthy et al. 2003), and the ability to
generatively develop new innovations (Yoo et al. 2012; Yoo et al. 2010). IS research also explains
how information systems can provide firms with dynamic sensing and responding capabilities
(Houghton et al. 2004). Further, IS research proposes reconfigurational IS capabilities (Tanriverdi
et al. 2010), improvisational IS capabilities (Pavlou and El Sawy 2010), and IS-enabled strategic
improvisation (Levallet and Chan 2015) that could enable firms to spontaneously reconfigure their
resources to build brand new capabilities and respond to dynamically emerging, unpredictable,
and novel situations in the external CAS. Clearly, these IT strategies and capabilities increase
firm’s ability to dynamically make strategic repositioning moves to seize the emerging return
opportunities and increase its performance in the external CAS. However, they also dynamically
change the business objectives and risk profiles of firms. Thus, they are also likely to render the
existing IT-GRC mechanisms of firms less effective or ineffective, and expose firms to more IT-
related risks as evidenced by increasing frequency and prevalence of IT-related risks. The findings
of this research imply that IS research on IS strategy and capabilities may need to address not only
the return implications but also the risk implications of the external CAS simultaneously.

39
Contributions to IS practice
This study informs managers that, as their firms diversify into different businesses, enter
international markets, acquire and divest businesses, and internally restructure their business units,
they significantly redefine the business objectives, risk profiles, and IT-GRC needs of their firms.
Thus, each of these strategic repositioning moves should alert IS managers that the IT-GRC
mechanisms are at risk of becoming less relevant and less effective. Thus, IS managers should
work closely with business managers to understand how IT-GRC mechanisms should be revised
or redesigned to realign with the changing business objectives and risk profile of the firm.
The key challenge for IS managers is to become involved in the early stages of the firm’s
strategic repositioning decisions so that they can inform business managers about the IT-GRC and
IT-risk implications of these decisions. Typically, strategic repositioning decisions such as mergers,
acquisitions, divestitures, etc. are made by the top executives of the firm (e.g., CEO and CFO)
under the veil of secrecy (Tanriverdi and Uysal 2011). Thus, many of the changes in the business
side may unfold over time without the knowledge and involvement of the IT unit. IT managers
may not even notice that the business objectives and risks of the firm have changed and deviated
from the original objectives and risks that were assumed during the design of the existing IT-GRC
mechanisms. The misalignment between the new risks and the existing risk mitigation mechanisms
of the IT-GRC is unlikely to be noticed until a risk realizes and causes losses. If IT managers are
involved in the early stages of the firm’s strategic repositioning moves, they can potentially see
how the moves change the business objectives and risks, and accordingly, proactively revise the
IT-GRC mechanisms to realign with them with the new risks, and hence, better mitigate the new
risks of the firm. Recent IS research indicates that the finding of MW in IT-GRC mechanisms of
a firm significantly increases the CEO and CFO turnover in the firm (Masli et al. 2016). By citing

40
this evidence along with the evidence of this study, IT managers might be able to convince their
CEOs and CFOs that the early involvement of IT executives in strategic repositioning moves of
the firm could minimize the MW in IT-GRC, and minimize the risks of not the firm, its investors
and customers, but also the job and career risks of the CEO and CFO.
Limitations and future work
As noted, one limitation of the study is that firms are not mandated to disclose data on IT
control deficiencies that are deemed to be low (D) or moderate (SD) in severity. They disclose if
there is MW in IT-GRC, i.e., the most severe type of IT control deficiency. This limitation meant
that we could only test if the hypothesized strategic repositioning moves increase the hazard of
experiencing MW in IT controls. The findings indicate that the strategic repositioning moves
disrupt the existing IT-GRC mechanisms so much that they significantly increase the probability
of MW in the firm’s IT-GRC. This data limitation enabled us to conduct the strongest test of the
proposed theory. We infer from the findings that if strategic repositioning moves are causing MW,
they might also be causing D and SD types of IT control deficiencies. Thus, the negative effects
of strategic repositioning moves on IT-related risks of firms could be broader in scope. Future
research can collect new data on the entire spectrum of IT-GRC deficiencies from low through
moderate to severe to test and validate this inference.
REFERENCE
AICPA. 2004. A Framework for Evaluating Control Exceptions and Deficiencies. American Institute of Certified Public Accountants.
Allen, P., Ramlogan, R., and Randles, S. 2002. "Complex Systems and the Merger Process," Technology Analysis & Strategic Management (14:3), pp. 315-329.
Allison, P.D. 2010. Survival Analysis Using SAS: A Practical Guide, (Second ed.). Cary, NC: SAS Institute. Ashbaugh-Skaife, H., Collins, D.W., and Kinney Jr, W.R. 2007. "The Discovery and Reporting of Internal
Control Deficiencies Prior to SOX-Mandated Audits," Journal of Accounting and Economics (44:1-2), pp. 166-192.
Ashbaugh-Skaife, H., Collins, D.W., Kinney Jr, W.R., and Lafond, R. 2009. "The Effect of SOX Internal Control Deficiencies on Firm Risk and Cost of Equity," Journal of Accounting Research (47:1), pp. 1-43.
Ashbaugh-Skaife, H., Daniel, W.C., Kineney, W.R., and Lafond, R. 2008. "The Effect of SOX Internal Control

41
Deficiencies and Their Remediation on Accrual Quality," The Accounting Review (83:1), pp. 217-250.
Ashby, R.W. 1956. An Introduction to Cybernetics. London: Methuen. Barki, H., Rivard, S., and Talbot, J. 2001. "An Integrative Contingency Model of Software Project Risk
Management," Journal of Management Information Systems (17:4), pp. 37-69. Benbya, H., and McKelvey, B. 2006. "Using Coevolutionary and Complexity Theories to Improve IS
Alignment: A Multi-Level Approach," Journal of Information Technology (21:4), pp. 284-298. Beneish, M.D., Billings, M.B., and Hodder, L.D. 2008. "Internal Control Weeknesses and Information
Uncertainty," The Accounting Review (83:3), pp. 665-703. Bharadwaj, A.S. 2000. "A Resource-Based Perspective on Information Technology Capability and Firm
Performance: An Empirical Investigation.," MIS Quarterly (24:1), pp. 169-196. Boisot, M., and McKelvey, B. 2011. "Complexity and Organization – Environment Relations: Revisiting
Ashby's Law of Requisite Variety," in The Sage Handbook of Complexity and Management, P. Allen, S. Maguire and B. McKelvey (eds.). Thousand Oaks, CA: SAGE Publications.
Brauer, M. 2006. "What Have We Acquired and What Should We Acquire in Divestiture Research? A Review and Research Agenda," Journal of Management (32:6), pp. 751-785.
Campbell, A., Goold, M., Alexander, M., and Whitehead, J. 2014. Strategy for the Corporate Level: Where to Invest, What to Cut Back, and How to Grow Organisations with Multiple Divisions. San Francisco, CA: John Wiley & Sons.
Canada, J., Sutton, S.G., and Kuhn, R. 2009. "The Pervasive Nature of IT Controls: An Examination of Material Weaknesses in IT Controls and Audit Fees," International Journal of Accounting and Information Management (17:1), pp. 106-119.
Carpenter, M.A., and Fredrickson, J.W. 2001. "Top Management Teams, Global Strategic Posture, and the Moderating Role of Uncertainty," Academy of Management Journal (44:3), pp. 533-545.
Cascio, W.F. 1993. "Downsizing: What Do We Know? What Have We Learned?," Academy of Management Executive (7:1), pp. 95-104.
Casti, J.L. 1997. "Would-Be Worlds: Toward a Theory of Complex Systems," Artificial Life and Robotics (1:1), pp. 11–13.
Chandler, A.D. 1962. Strategy and Structure. Cambridge, MA: MIT Press. Chapman, C.S., and Kihn, L.-A. 2009. "Information System Integration, Enabling Control and Performance,"
Accounting, Organizations and Society (34:2), pp. 151-169. Cleves, M., Gould, W.W., and Marchenko, Y.V. 2010. An Introduction to Survival Analysis Using Stata, (3rd
ed.). College Station, TX: Stata Press. Cohen, J.A. 1960. "A Coefficient of Agreement for Nominal Scales," Educational and Psychological
Measurement (20), pp. 37-46. COSO. 1992. Internal Control - Integrated Framework. New York, NY: AICPA. Cox, D.R. 1972. "Regression Models and Life-Tables," Journal of the Royal Statistical Society. Series B
(Methodological) (34:2), pp. 187-220. D'Arcy, J., Hovav, A., and Galletta, D. 2009. "User Awareness of Security Countermeasures and Its Impact
on Information Systems Misuse: A Deterrence Approach," Information Systems Research (20:1), pp. 79-98.
Davis, J.P., Eisenhardt, K.M., and Bingham, C.B. 2009. "Optimal Structure, Market Dynamism, and the Strategy of Simple Rules," Administrative Science Quarterly (54:3), pp. 413-452.
Dess, G.G., and Beard, D.W. 1984. "Dimensions of Organizational Task Evnironments," Administrative Science Quarterly (29:1), pp. 52-73.
Doyle, J., Ge, W., and McVay, S. 2007. "Determinants of Weaknesses in Internal Control over Financial Reporting," Journal of Accounting and Economics (44:1-2), pp. 193-223.
Drukker, D.M. 2003. "Testing for Serial Correlation in Linear Panel-Data Models," Stata Journal (3:2), pp.

42
168-177. Du, K., and Tanriverdi, H. 2014. "Managing Information Technology under Extreme Organizational
Disequilibrium: The Case of Corporate Spinoffs," the Proceedings of the 35th International Conference on Information Systems, Auckland, New Zealand.
Eisenhardt, K., and Piezunka, H. 2011. "Complexity Theory and Corporate Strategy," in The Sage Handbook of Complexity and Management, P. Allen, S. Maguire and B. McKelvey (eds.). Thousand Oaks, CA: Sage Publications.
Eisenhardt, K.M. 1985. "Control: Organizational and Economic Approaches," Management Science (31:2), pp. 134-149.
Eisenhardt, K.M., and Brown, S.L. 1999. "Patching: Restitching Business Portfolios in Dynamic Markets," Harvard Business Review (77:3), pp. 72-82.
Feng, M., Li, C., and McVay, S. 2009. "Internal Control and Management Guidance," Journal of Accounting and Economics (48:2–3), pp. 190-209.
Feng, M., Li, C., McVay, S.E., and Skaife, H. 2015. "Does Ineffective Internal Control over Financial Reporting Affect a Firm's Operations? Evidence from Firms' Inventory Management," The Accounting Review (90:2), pp. 529-557.
Ge, W., and McVay, S. 2005. "The Disclosure of Material Weaknesses in Internal Control after the Sarbanes-Oxley Act," Accounting Horizons (19:3), pp. 137-158.
Goold, M., and Quinn, J.J. 1990. "The Paradox of Strategic Controls," Strategic Management Journal (11:1), pp. 43-57.
Gosain, S. 2004. "Enterprise Information Systems as Objects and Carriers of Institutional Forces: The New Iron Cage?," Journal of the Association for Information Systems (5:4), pp. 151-182.
Haislip, J.Z., Masli, A., Richardson, V.J., and Watson, M.W. 2015. "External Reputational Penalties for CEOs and CFOs Following Information Technology Material Weaknesses," International Journal of Accounting Information Systems (17), pp. 1-15.
Hammersley, J., Myers, L., and Shakespeare, C. 2008. "Market Reactions to the Disclosure of Internal Control Weaknesses and to the Characteristics of Those Weaknesses under Section 302 of the Sarbanes Oxley Act of 2002," Review of Accounting Studies (13:1), pp. 141-165.
Hansen, J.V., and Hill, N.C. 1989. "Control and Audit of Electronic Data Interchange.," MIS Quarterly (13:4), pp. 403-413.
Hardin, J., and Hilbe, J. 2003. Generalized Estimating Equations, (1st ed.). London, UK: Chapman and Hall. Henderson, J.C., and Venkatraman, N. 1993. "Strategic Alignment: Leveraging Information Technology for
Transforming Organizations," IBM Systems Journal (32:1), pp. 472-484. Hitchner, J.R. 2006. Financial Valuation: Applications and Models, (2nd ed.). Hoboken, NJ: John Wiley &
Sons, Inc. Hogan, C.E., and Wilkins, M.S. 2008. "Evidence on the Audit Risk Model: Do Auditors Increase Audit Fees
in the Presence of Internal Control Deficiencies?*," Contemporary Accounting Research (25:1), pp. 219-242.
Hoitash, U., Hoitash, R., and Bedard, J.C. 2009. "Corporate Governance and Internal Control over Financial Reporting: A Comparison of Regulatory Regimes," The Accounting Review (84:3), pp. 839-867.
Holland, J.H. 1995. Emergence: From Chaos to Order. Reading, MA: Addison-Wesley. Hosmer, D.W., Lemeshow, S., and May, S. 2008. Applied Survival Analysis: Regression Modeling of Time to
Event Data, (2nd ed.). Hoboken, NJ: Wiley. Houghton, R., El Sawy, O.A., Gray, P., Donegan, C., and Joshi, A. 2004. "Vigilant Information Systems for
Managing Enterprises in Dynamic Supply Chains: Real-Time Dashboards at Western Digital," MIS Quarterly Executive (3:1), pp. 19–35.
IIA. 2008. GAIT for IT General Control Deficiency Assessment: An Approach for Evaluating ITGC Deficiencies in Sarbanes-Oxley Section 404 Assessments of Internal Controls over Financial Reporting.

43
Altamonte Spring, FL.: The Institute of Internal Auditors. IIA. 2009. Global Technology Audit Guide (GTAG) 8: Auditing Application Controls. Altamonte Spring, FL:
The Institute of Internal Auditors. IIA. 2012. Global Technology Audit Guide (GTAG) 1: Information Technology Controls, (2nd ed.). Altamonte
Spring, FL: The Institute of Internal Auditors. Iliev, P. 2010. "The Effect of SOX Section 404: Costs, Earnings Quality, and Stock Prices," The Journal of
Finance (65:3), pp. 1163-1196. ITGI. 2006. IT Control Objectives for Sarbanes-Oxley: The Role of IT in the Design and Implementation of
Internal Control over Financial Reporting, (2nd ed.). Rolling Meadows, IL: IT Governance Institute. ITGI. 2007. COBIT 4.1. Rolling Meadows, IL: IT Governance Institute. Johnstone, K., Li, C., and Rupley, K.H. 2011. "Changes in Corporate Governance Associated with the
Revelation of Internal Control Material Weaknesses and Their Subsequent Remediation," Contemporary Accounting Research (28:1), pp. 331–383.
Keil, M., Cule, P.E., Lyytinen, K., and Schmidt, R.C. 1998. "A Framework for Identifying Software Project Risks," Communications of the ACM (41:11), pp. 76-83.
Kirsch, L.J. 1996. "The Management of Complex Tasks in Organizations: Controlling the Systems Development Process," Organization Science (7:1), pp. 1-21.
Kirsch, L.J. 1997. "Portfolios of Control Modes and IS Project Management," Information Systems Research (8:3), pp. 215-239.
Klamm, B.K., Kobelsky, K.W., and Watson, M.W. 2012. "Determinants of the Persistence of Internal Control Weaknesses," Accounting Horizons (26:2), pp. 307-333.
Klamm, B.K., and Watson, M.W. 2009. "SOX 404 Reported Internal Control Weaknesses: A Test of COSO Framework Components and Information Technology," Journal of Information Systems (23:2), pp. 1-23.
Klein, A. 1986. "The Timing and Substance of Divestiture Announcements: Individual, Simultaneous and Cumulative Effects," Journal of Finance (41:3), pp. 685-696.
Krishnan, G.V., and Visvanathan, G. 2007. "Reporting Internal Control Deficiencies in the Post-Sarbanes-Oxley Era: The Role of Auditors and Corporate Governance," International Journal of Auditing (11:2), pp. 73-90.
Krishnan, J. 2005. "Audit Committee Quality and Internal Control: An Empirical Analysis," The Accounting Review (80:2), pp. 649-675.
Krishnan, J., Rama, D.V., and Zhang, Y.Y. 2008. "Costs to Comply with SOX Section 404," Auditing: A Journal of Practice & Theory (27:1), pp. 169-186.
Krishnan, M.S., Rai, A., and Zmud, R.W. 2007. "The Digitally Enabled Extended Enterprise in a Global Economy," Information Systems Research (18:3), pp. 233 –236.
Kuhn, J.R., Ahuja, M., and Mueller, J. 2013. "An Examination of the Relationship of IT Control Weakness to Company Financial Performance and Health," International Journal of Accounting & Information Management (21:3), pp. 227-240.
Levallet, N., and Chan, Y. 2015. "Using IT to Unleash the Power of Strategic Improvisation," the Proceedings of the Thirty Sixth International Conference on Information Systems (ICIS) Fort Worth, TX.
Li, C., Lim, J.-H., and Wang, Q. 2007. "Internal and External Influences on IT Control Governance," International Journal of Accounting Information Systems (8:4), pp. 225-239.
Li, C., Peters, G.F., Richardson, V.J., and Watson, M.W. 2012. "The Consequences of Information Technology Control Weaknesses on Management Information Systems: The Case of Sarbanes-Oxley Internal Control Reports," MIS Quarterly (36:1), pp. 179-203.
Li, C., Sun, L., and Ettredge, M. 2010. "Financial Executive Qualifications, Financial Executive Turnover, and Adverse SOX 404 Opinions," Journal of Accounting and Economics (50:1), pp. 93-110.
Lyytinen, K., Mathiassen, L., and Ropponen, J. 1998. "Attention Shaping and Software Risk - a Categorical

44
Analysis of Four Classical Risk Management Approaches," Information Systems Research (9:3), pp. 233-255.
Macintosh, N.B. 1994. Management Accounting and Control Systems: An Organizational and Behavioral Approach. New York, NY: John Wiley.
Maguire, S. 2011. "Constructing and Appreciating Complexity," in The Sage Handbook of Complexity and Management, P. Allen, S. Maguire and B. McKelvey (eds.). Thousand Oaks, CA: Sage Publications.
Masli, A., Peters, G.F., Richardson, V.J., and Sanchez, J.M. 2010. "Examining the Potential Benefits of Internal Control Monitoring Technology," The Accounting Review (85:3), pp. 1001-1034.
Masli, A., Richardson, V.J., Watson, M.W., and Zmud, R.W. 2016. "Senior Executives’ IT Management Responsibilities: Serious IT-Related Deficiencies and CEO/CFO Turnover," MIS Quarterly (40:3), pp. 687-708.
McAfee, A., and Brynjolfsson, E. 2008. "Investing in the IT That Makes a Competitive Difference," Harvard Business Review (86:7/8), pp. 98-107.
McDaniel, R.R. 2007. "Management Strategies for Complex Adaptive Systems: Sensemaking, Learning, and Improvisation," Performance Improvement Quarterly (20:2), pp. 21-42.
McKinley, W., and Scherer, A.G. 2000. "Some Unanticipated Consequences of Organizational Restructuring," The Academy of Management Review (25:4), pp. 735-752.
Mehta, M., and Hirschheim, R. 2007. "Strategic Alignment in Mergers and Acquisitions: Theorizing IS Integration Decision Making," Journal of the Association for Information Systems (8:3), pp. 143-174.
Moeller, S.B., Schlingemann, F.P., and Stulz, R.M. 2004. "Firm Size and the Gains from Acquisitions," Journal of Financial Economics (73:2), pp. 201-228.
Ouchi, W.G., and Maguire, M.A. 1975. "Organizational Control: Two Functions," Administrative Science Quarterly (20:4), pp. 559-569.
Pavlou, P.A., and El Sawy, O.A. 2010. "The "Third Hand": IT-Enabled Competitive Advantage in Turbulence through Improvisational Capabilities," Information Systems Research (21:3), pp. 443-471.
Piotroski, J.D., and Srinivasan, S. 2008. "Regulation and Bonding: The Sarbanes-Oxley Act and the Flow of International Listings," Journal of Accounting Research (46:2), pp. 383-425.
Raghunandan, K., and Rama, D.V. 2006. "SOX Section 404 Material Weakness Disclosures and Audit Fees," Auditing: A Journal of Practice & Theory (25:1), pp. 99-114.
Ramanujam, V., and Varadarajan, P. 1989. "Research on Corporate Diversification - a Synthesis," Strategic Management Journal (10:6), pp. 523-551.
Ranganathan, C., and Outlay, C.N. 2009. "Life after IT Outsourcing: Lessons Learned from Resizing the IT Workforce," MIS Quarterly Executive (8:4), pp. 161-173.
Ransbotham, S., and Mitra, S. 2009. "Choice and Chance: A Conceptual Model of Paths to Information Security Compromise," Information Systems Research (20:1), pp. 121-139.
Sabherwal, R., and Chan, Y.E. 2001. "Alignment between Business and IS Strategies: A Study of Prospectors," Information Systems Research (12:1), pp. 11–33.
Sambamurthy, V., Bharadwaj, A., and Grover, V. 2003. "Shaping Agility through Digital Options: Reconceptualizing the Role of Information Technology in Contemporary Firms," MIS Quarterly (27:2), pp. 237-263.
Sambamurthy, V., and Zmud, R.W. 1999. "Arrangements for Information Technology Governance: A Theory of Multiple Contingencies," MIS Quarterly (23:2), pp. 261-290.
Simons, R. 1991. "Strategic Orientation and Top Management Attention to Control Systems," Strategic Management Journal (12:1), pp. 49-62.
Stoel, M.D., and Muhanna, W.A. 2011. "IT Internal Control Weaknesses and Firm Performance: An Organizational Liability Lens," International Journal of Accounting Information Systems (12:4), pp. 280-304.

45
Straub, D.W. 1990. "Effective IS Security: An Empirical Study," Information Systems Research (1:3), pp. 255-276.
Tanriverdi, H. 2005. "Information Technology Relatedness, Knowledge Management Capability, and Performance of Multibusiness Firms.," MIS Quarterly (29:2), pp. 311-334.
Tanriverdi, H. 2006. "Performance Effects of Information Technology Synergies in Multibusiness Firms," MIS Quarterly (30:1), pp. 57-77.
Tanriverdi, H., and Du, K. 2009. "Disintegrating Information Technology in Corporate Divestures: Implications for Regulatory Compliance Risks and Costs," the Proceedings of the 30th International Conference on Information Systems (ICIS), Phoenix, AZ.
Tanriverdi, H., Rai, A., and Venkatraman, N. 2010. "Reframing the Dominant Quests of Information Systems Strategy Research for Complex Adaptive Business Systems," Information Systems Research (21:4), pp. 822-834.
Tanriverdi, H., and Ruefli, T.W. 2004. "The Role of Information Technology in Risk/Return Relations of Firms," Journal of the Association for Information Systems (5), pp. 421-447.
Tanriverdi, H., and Uysal, V. 2011. "Cross-Business Information Technology Integration and Acquirer Value Creation in Corporate Mergers and Acquisitions," Information Systems Research (22:4), pp. 703-720.
Tanriverdi, H., and Uysal, V. 2015. "When IT Capabilities Are Not Scale-Free in Merger and Acquisition Integrations: How Do Capital Markets React to IT Capability Asymmetries between Acquirer and Target?," European Journal of Information Systems (24:2), pp. 145–158.
Therneau, T.M., and Grambsch, P.M. 2000. Modeling Survival Data: Extending the Cox Model. New York: Springer.
Vessey, I., and Ward, K. 2013. "The Dynamics of Sustainable IS Alignment: The Case for IS Adaptivity," Journal of the Association for Information Systems (14:6), pp. 283-311,.
Weber, R. 1982. "Audit Trail System Support in Advanced Computer-Based Accounting Systems," The Accounting Review (57:2), pp. 311-325.
Weidenmier, M.L., and Ramamoorti, S. 2006. "Research Opportunities in Information Technology and Internal Auditing," Journal of Information Systems (20:1), pp. 205-219.
Weill, P., and Broadbent, M. 1998. Leveraging the New Infrastructure: How Market Leaders Capitalize on Information Technology. Boston MA: Harvard Business School Press.
Weill, P., and Ross, J. 2005. "A Matrixed Approach to Designing IT Governance," MIT Sloan Management Review (46:2), pp. 26-34.
Wooldridge, J.M. 2010. Econometric Analysis of Cross Section and Panel Data, (2nd ed.). Cambridge, Massachusetts: The MIT Press.
Yoo, Y., Boland, R.J., Lyytinen, K., and Majchrzak, A. 2012. "Organizing for Innovation in the Digitized World," Organization Science (23:5), pp. 1398-1408.
Yoo, Y., Henfridsson, O., and Lyytinen, K. 2010. "The New Organizing Logic of Digital Innovation: An Agenda for Information Systems Research," Information Systems Research (21:4), pp. 724–735.
Zeger, S.L., and Liang, K.-Y. 1986. "Longitudinal Data Analysis for Discrete and Continuous Outcomes," Biometrics (42:1), pp. 121-130.
Zhang, Y., Zhou, J., and Zhou, N. 2007. "Audit Committee Quality, Auditor Independence, and Internal Control Weaknesses," Journal of Accounting and Public Policy (26:3), pp. 300-327.

46
Table 1 Descriptive Statistics and Pair-wise Pearson Correlations
Variables 1 2 3 4 5 6 7 8 9
1 Overall Internal Control Weakness
2 Only non-IT Control Weakness 0.865 ***
3 IT GRC Weakness 0.472 *** -0.034 ***
4 Environmental Turbulence -0.064 *** -0.055 *** -0.03 **
5 Environmental Munificence 0.023 * 0.019 * 0.012 -0.328 ***
6 Firm size (Total assets, log transformed) -0.114 *** -0.082 *** -0.083 *** 0.065 *** -0.069 ***
7 Return on Equity (ROE) -0.009 -0.008 -0.004 0.019 * -0.002 -0.049 ***
8 Financial Leverage Ratio 0.012 -0.000 0.024 ** 0.073 *** -0.048 *** 0.115 *** 0.013
9 Corporate Governance Weaknesses 0.293 *** 0.131 *** 0.353 *** -0.015 -0.002 -0.042 *** -0.004 0.03 ***
10 Auditor Status -0.065 *** -0.016 * -0.102 *** -0.034 *** 0.005 0.289 *** -0.030 *** 0.001 -0.039 ***
11 Environmental IT Intensity 0.031 *** 0.021 * 0.024 ** 0.206 *** -0.057 *** -0.056 *** 0.013 -0.019 * 0.028 **
12 IT Capability -0.038 *** -0.027 *** -0.027 ** 0.002 0.007 0.350 *** -0.006 0.032 *** -0.009
13 Diversification Level -0.011 -0.009 -0.006 0.015 -0.013 0.354 *** -0.017 + 0.042 *** -0.008
14 Foreign Operation 0.031 *** 0.025 ** 0.017 * 0.002 0.058 *** 0.036 *** -0.011 -0.035 *** 0.002
15 Acquisition Intensity -0.001 -0.010 0.015 + 0.006 0.023 * 0.032 *** -0.006 -0.004 0.002
16 Divestiture Intensity 0.022 ** 0.011 0.024 ** -0.001 0.009 0.048 *** -0.003 0.014 + -0.001
17 Restructuring 0.028 *** 0.021 * 0.019 * -0.036 *** 0.03 ** 0.132 *** -0.017 * 0.012 0.006
Observations 14,427 14,427 14,427 11,460 11,460 14,427 14,364 14,427 14,427
Mean 0.08 0.06 0.02 0.02 0.09 7.08 0.45 0.56 0.01
Standard Deviation — — — 0.01 0.03 1.84 12.81 0.73 0.11
Min 0 0 0 0.00 -0.03 0.36 -177.52 0.00 0
Max 1 1 1 0.05 0.17 14.60 855.87 74.93 3
Variables 10 11 12 13 14 15 16 17
10 Auditor Status
11 IT Intensity -0.045 ***
12 IT Capability 0.118 *** -0.018 +
13 Diversification Level 0.112 *** 0.016 + 0.203 ***
14 Foreign Operation 0.083 *** 0.03 ** 0.039 *** 0.106 ***
15 Acquisition Intensity 0.022 ** 0.015 -0.012 0.011 0.017 *
16 Divestiture Intensity 0.023 ** -0.016 + 0.023 ** 0.033 *** 0.012 0.069 ***
17 Restructuring 0.124 *** 0.009 0.162 *** 0.154 *** 0.21 *** 0.05 *** 0.067 ***
Observations 14,427 11,693 14,427 11,694 14,427 14,427 14,427 14,427
Mean 0.84 0.12 0.09 0.39 0.24 0.02 0.01 0.26
Standard Deviation — 0.09 — 0.47 — 0.08 0.04 —
Min 0 0.0 0 0 0 0 0 0
Max 1 0.5 1 2.14 1 0.99 0.84 1
Note: +: p<0.1; *: p<0.05; **: p<0.01; ***: p<0.001; two-tailed t-test; Standard deviations of binary variables are omitted.
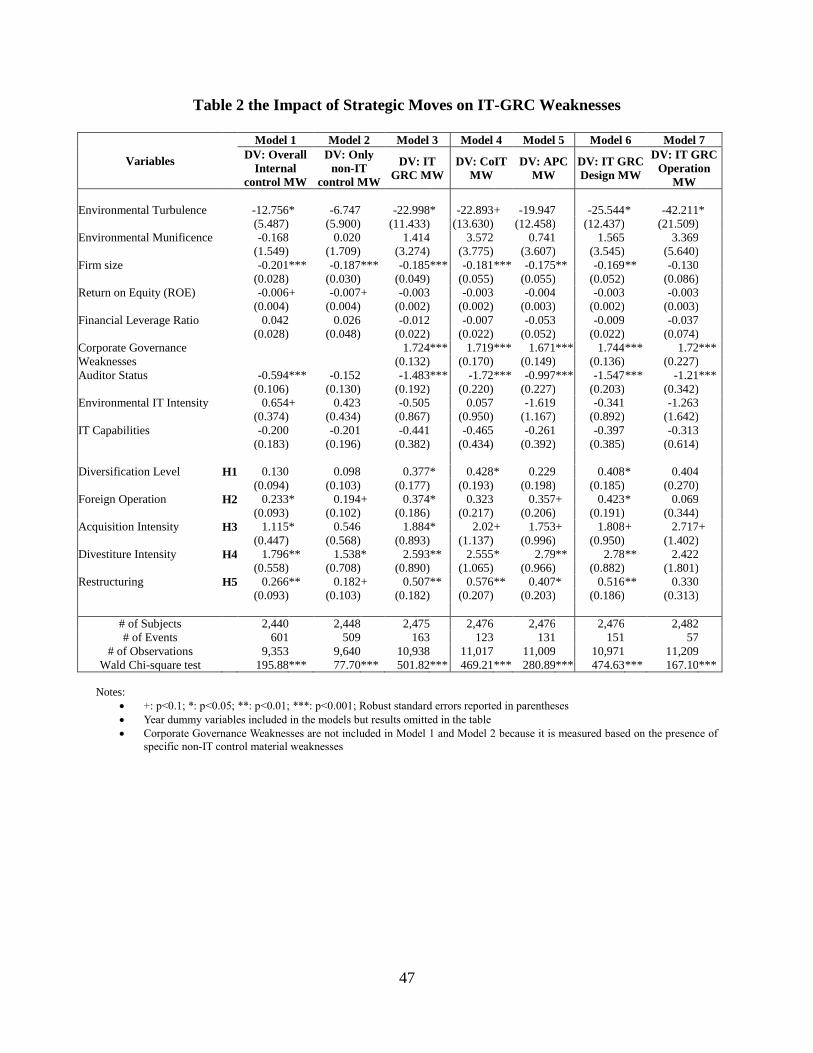
47
Table 2 the Impact of Strategic Moves on IT-GRC Weaknesses
Variables
Model 1 Model 2 Model 3 Model 4 Model 5 Model 6 Model 7
DV: Overall
Internal
control MW
DV: Only
non-IT
control MW
DV: IT
GRC MW
DV: CoIT
MW
DV: APC
MW
DV: IT GRC
Design MW
DV: IT GRC
Operation
MW
Environmental Turbulence -12.756 * -6.747 -22.998 * -22.893 + -19.947 -25.544 * -42.211 * (5.487) (5.900) (11.433) (13.630) (12.458) (12.437) (21.509)
Environmental Munificence -0.168 0.020 1.414 3.572 0.741 1.565 3.369 (1.549) (1.709) (3.274) (3.775) (3.607) (3.545) (5.640)
Firm size -0.201 *** -0.187 *** -0.185 *** -0.181 *** -0.175 ** -0.169 ** -0.130 (0.028) (0.030) (0.049) (0.055) (0.055) (0.052) (0.086)
Return on Equity (ROE) -0.006 + -0.007 + -0.003 -0.003 -0.004 -0.003 -0.003 (0.004) (0.004) (0.002) (0.002) (0.003) (0.002) (0.003)
Financial Leverage Ratio 0.042 0.026 -0.012 -0.007 -0.053 -0.009 -0.037 (0.028) (0.048) (0.022) (0.022) (0.052) (0.022) (0.074)
Corporate Governance
Weaknesses
1.724 *** 1.719 *** 1.671 *** 1.744 *** 1.72 ***
(0.132) (0.170) (0.149) (0.136) (0.227)
Auditor Status -0.594 *** -0.152 -1.483 *** -1.72 *** -0.997 *** -1.547 *** -1.21 *** (0.106) (0.130) (0.192) (0.220) (0.227) (0.203) (0.342)
Environmental IT Intensity 0.654 + 0.423 -0.505 0.057 -1.619 -0.341 -1.263 (0.374) (0.434) (0.867) (0.950) (1.167) (0.892) (1.642)
IT Capabilities -0.200 -0.201 -0.441 -0.465 -0.261 -0.397 -0.313 (0.183) (0.196) (0.382) (0.434) (0.392) (0.385) (0.614)
Diversification Level H1 0.130 0.098 0.377 * 0.428 * 0.229 0.408 * 0.404 (0.094) (0.103) (0.177) (0.193) (0.198) (0.185) (0.270)
Foreign Operation H2 0.233 * 0.194 + 0.374 * 0.323 0.357 + 0.423 * 0.069 (0.093) (0.102) (0.186) (0.217) (0.206) (0.191) (0.344)
Acquisition Intensity H3 1.115 * 0.546 1.884 * 2.02 + 1.753 + 1.808 + 2.717 + (0.447) (0.568) (0.893) (1.137) (0.996) (0.950) (1.402)
Divestiture Intensity H4 1.796 ** 1.538 * 2.593 ** 2.555 * 2.79 ** 2.78 ** 2.422 (0.558) (0.708) (0.890) (1.065) (0.966) (0.882) (1.801)
Restructuring H5 0.266 ** 0.182 + 0.507 ** 0.576 ** 0.407 * 0.516 ** 0.330 (0.093) (0.103) (0.182) (0.207) (0.203) (0.186) (0.313)
# of Subjects 2,440 2,448 2,475 2,476 2,476 2,476 2,482
# of Events 601 509 163 123 131 151 57
# of Observations 9,353 9,640 10,938 11,017 11,009 10,971 11,209
Wald Chi-square test 195.88 *** 77.70 *** 501.82 *** 469.21 *** 280.89 *** 474.63 *** 167.10 ***
Notes:
+: p<0.1; *: p<0.05; **: p<0.01; ***: p<0.001; Robust standard errors reported in parentheses
Year dummy variables included in the models but results omitted in the table Corporate Governance Weaknesses are not included in Model 1 and Model 2 because it is measured based on the presence of
specific non-IT control material weaknesses

48
Table 3 the Impact of Strategic Moves on the Detailed Subtypes of IT-GRC Weaknesses
Variables
Model 1 Model 2 Model 3 Model 4 Model 5 Model 6 Model 7 Model 8 Model 9 Model 10 Model 11 Model 12
CoIT:
IT
Governance
MW
CoIT:
IT Human
Resource
MW
CoIT:
Documentation
MW
CoIT:
Computer
Operation
MW
CoIT:
Access
Control MW
CoIT:
Program
Development
MW
CoIT:
Change
Management
MW
CoIT:
Segregation
of IT Duty
MW
APC:
Input
Control MW
APC:
Processing
Control
MW
APC:
Output
Control MW
APC:
Segregation
of Duty MW
Environmental Turbulence -35.720 -18.775 -38.219 -4.180 -27.746 -35.232 -36.844 + -50.043 -14.824 -10.694 -39.815 -3.825
(32.927) (70.232) (28.579) (26.178) (17.577) (36.408) (19.577) (39.263) (20.180) (16.738) (31.334) (17.450)
Environmental Munificence 10.979 -3.178 15.824 2.829 7.356 10.538 * 13.744 ** -10.026 5.602 2.465 8.639 2.977
(9.926) (10.439) (9.662) (5.880) (4.632) (5.325) (4.626) (12.167) (6.545) (5.062) (7.541) (4.788)
Firm size -0.322 * -0.434 ** -0.311 ** -0.285 * -0.142 * -0.072 -0.233 ** -0.189 -0.168 * -0.302 *** -0.304 ** -0.119
(0.128) (0.157) (0.102) (0.111) (0.067) (0.124) (0.088) (0.139) (0.083) (0.079) (0.104) (0.077)
Return on Equity (ROE) -0.002 -0.003 -0.003 -0.007 -0.002 -0.000 -0.003 -0.011 -0.002 -0.004 -0.002 -0.003
(0.002) (0.004) (0.003) (0.004) (0.002) (0.002) (0.003) (0.007) (0.002) (0.003) (0.002) (0.003)
Financial Leverage Ratio -0.471 -0.106 -0.190 -0.004 -0.081 -0.070 -0.202 0.003 -0.012 -0.194 -0.053 -0.100
(0.383) (0.144) (0.198) (0.034) (0.057) (0.118) (0.172) (0.039) (0.058) (0.164) (0.063) (0.076)
Corporate Governance
Weaknesses
1.688 *** 1.828 * 1.16 *** 1.489 *** 1.874 *** 1.712 *** 1.34 *** 1.419 *** 1.911 *** 1.608 *** 1.999 *** 1.823 ***
(0.326) (0.738) (0.341) (0.335) (0.195) (0.475) (0.300) (0.363) (0.157) (0.229) (0.191) (0.208)
Auditor Status -1.449 ** -1.131 -2.262 *** -2.143 *** -2.032 *** -2.359 *** -2.01 *** -2.411 *** -0.949 ** -0.605 + -0.932 * -1.23 ***
(0.447) (0.843) (0.431) (0.411) (0.270) (0.564) (0.316) (0.647) (0.338) (0.313) (0.384) (0.348)
Environmental IT Intensity 0.653 0.152 -0.335 0.335 0.574 -2.664 -1.038 -1.392 -1.677 -2.144 -7.319 ** -0.501
(1.671) (4.416) (1.779) (1.403) (1.125) (3.521) (1.636) (1.647) (1.716) (1.431) (2.695) (1.490)
IT Capabilities -0.284 -40.419 *** — -0.195 -0.665 0.644 -0.355 0.283 -0.163 0.051 — -0.368
(0.948) (0.600) — (0.969) (0.531) (0.803) (0.737) (0.961) (0.501) (0.569) — (0.549)
Diversification Level 0.417 1.289 * -0.286 0.306 0.713 ** 0.470 0.487 0.235 0.579 + 0.338 0.432 0.322
(0.441) (0.585) (0.463) (0.367) (0.228) (0.484) (0.310) (0.484) (0.300) (0.303) (0.430) (0.262)
Foreign Operation -0.221 1.258 + -0.670 0.916 * 0.445 + 0.405 0.033 1.151 * 0.138 0.105 0.221 0.477
(0.514) (0.663) (0.632) (0.406) (0.269) (0.559) (0.347) (0.477) (0.311) (0.301) (0.419) (0.310)
Acquisition Intensity 2.933 * 4.595 * 1.144 2.480 3.204 ** 3.545 ** -0.207 -6.592 2.739 * 1.844 4.641 *** 3.436 **
(1.295) (1.869) (2.191) (1.784) (1.150) (1.260) (1.883) (5.831) (1.230) (1.463) (1.090) (1.083)
Divestiture Intensity 4.416 ** 1.549 -1.649 4.074 ** 3.426 ** -1.449 2.397 — 3.325 ** 3.174 * 2.825 2.344
(1.692) (2.669) (4.125) (1.415) (1.124) (3.876) (1.925) — (1.249) (1.262) (1.789) (1.557)
Restructuring 0.548 0.054 0.9 * 0.372 0.558 * 0.030 0.734 * 0.157 0.118 0.398 -0.286 0.309
(0.393) (0.755) (0.438) (0.390) (0.252) (0.531) (0.319) (0.558) (0.293) (0.295) (0.380) (0.293)
# of Subjects 2,483 2,483 2,483 2,482 2,476 2,484 2,481 2,483 2,482 2,481 2,482 2,478
# of Events 31 11 28 35 79 22 56 20 63 69 36 57
# of Observations 11,271 11,315 11,280 11,263 11,111 11,286 11,205 11,284 11,205 11,206 11,249 11,164
Wald Chi-square test 192.37 *** 15665.8 *** 136.47 *** 254.99 *** 261.19 *** 87.73 *** 137.54 *** 379.28 *** 282.12 *** 109.15 *** 216.38 *** 149.13 ***
Notes: *** p<0.001, ** p<0.01, * p<0.05, + p<0.1; robust standard errors reported in parentheses;
Year dummy variables included in the estimation models but results omitted;
IT Capabilities in Model 3 and Model 11 and Divestiture Intensity in Model 8 were dropped during model estimation iterations due to the lack of covariance with the dependent variable;

49
Appendix A: Coding Scheme for Categorizing IT-GRC weaknesses
Coding Scheme for Automated Process
Controls (APC) Weakness
Coding Scheme for IT General Control (ITGC) Weakness
APC-1: Input control
1. Firms do not have effective controls to
ensure that source data are correct,
complete, and collected timely.
2. Input is not performed in a timely manner
by authorized and qualified staff
3. Input form design is not effective to
prevent errors and omissions
4. Transaction data entered for processing
are not adequately checked for accuracy,
completeness and validity
ITGC-1: IT governance
1. Firms lack IT policies, procedures, standards, strategic plans and other governance
processes
2. IT governance structure of a firm is ineffective
3. Management of a firm does not effectively monitor IT activities, review IT
performance, or communicate IT risks
ITGC-2: IT human resource
1. Firms do not have adequate IT personnel to support effective IT controls
2. Firms experience significant, disruptive turnover of IT personnel
3. Firms lack knowledge to operate and maintain the IT systems
4. Employees of a firm lack sufficient IT training
5. Employees of a firm are unfamiliar with IT systems or they are incapable of
operating the IT applications effectively
ITGC-3: IT documentation
Firms lack documentation about:
1. Financially significant processes supported by IT, risks associated with them,
analyses of the probability of occurrence and impact of the risks
2. IT controls designed to reduce the risks
3. Testing of the existence and operational effectiveness of the IT controls
4. Conclusions reached about the design and operating effectiveness of the IT controls
5. Management’s responses and opinions about the conclusions
ITGC-4: Access control
1. Firms are under uncontrolled risks of unethical hackers, malicious software and
other intrusion threats
2. Employees’ access to network, operating system, databases, and applications are not
properly restricted
3. User profiles and access permits are not timely and frequently reviewed.
4. User ID and passwords of terminated employee are not immediately revoked
ITGC-5: Computer operations
1. Firms do not have effective physical and environmental security controls of IT
equipment and facilities
2. Firms do not have effective network security
3. Firms do not have effective data backup, recovery, storage, and other disaster
management functions
4. Firms do not have effective controls over IT routines regarding to operating systems,
databases, middleware, communication software, and other software components
which are not directly related to specific business processes
ITGC-6: Program development
1. Firms do not have an effective system development life cycle methodology of
requirements documentation, design, programming, testing, and approvals
2. System development is not conducted in a structured manner that users requirements
and design features are incorporated
3. Firms do not effectively assess, review, and control IT development project risks
4. Firms do not have effective quality control procedures over the finished IT systems
ITGC-7: Program change management
1. Firms are lack of structured change management policies and procedures
2. Change request is not properly documented, approved, and filed
3. Changes to IT systems are not properly authorized and reviewed
4. Changes to IT systems are not adequately tested, validated and approved
5. Migration of changes to production is not properly restricted and supervised
ITGC-8: Segregation of IT function
1. Firms’ IT department does not have sufficient separation of key IT functions such
as designing, developing, testing, implementing, and maintaining IT infrastructure and
applications;
2. IT employees have unrestricted access to business applications or data beyond their
job responsibility
APC-2: Processing control
1. Applications have deficiencies in
maintaining the integrity and validity of
data throughout the processing cycle
2. Applications do not process information
as designed; Formulas used in calculation
are incorrect; Exceptions are not adequately
addressed
3. Applications do not have processing
history which management can use to track
transactions from their source to their
output or backward
APC-3: Output control
1. Outputs from applications are not
completely or accurately presented
2. Outputs are not properly checked against
inputs or reconciled with other sources
3. Unreasonable, unusual, or unexpected
outputs are not properly highlighted for
investigation
4. Outputs delivery are not properly
constrained to only intended person
APC-4: Segregation of duty in
applications
1. The electronic identities of application
users are authorized to perform
incompatible and conflicting duties
2. Firms are lack of control policies,
procedures, and tools to monitor, prevent or
identify duty conflicts in IT applications
Coding Scheme for IT CRC Design
Weakness
1. Necessary IT controls are absent
2. Necessary IT controls are inadequate or
insufficient
3. IT controls are flawed such that
operational, financial, or regulatory risks
are not mitigated as desired
Coding Scheme for IT GRC Operation
Weakness
1. IT controls are not implemented as
designed
2. IT controls are not operating effectively
3. Misstatements, errors, or undesirable
behaviors are identified regardless the
preventive IT control design in place