how do the asian economies compete with japan in the us
TRANSCRIPT

Revised
How do the Asian Economies Compete with Japan in the US Market? Is China Exceptional?
A Triangular Trade Approach*
February 2005
Hiro Ito Department of Economics Portland State University
and
Yushi Yoshida**
Faculty of Economics Kyushu Sangyo University
* The earlier version of this paper was circulated under the title “How Does China Compete with Japan in the US Market?: A Triangular Approach.” This research was conducted in part while Yushi Yoshida was a visiting research associate at the University of California, Santa Cruz and Hiro Ito was at UCSC. We would like to thank participants of the APEC Study Center Conference at City University of Hong Kong, the Japan Economic Association Conference at Meiji Gakuin University, the “WTO, China and the Asian Economies II” Conference at Renmin University of China, and the 6th ETSG Conference at the University of Nottingham, Eiji Fujii, and an anonymous referee of this journal for their comments. ** Corresponding author: Yushi Yoshida, [email protected].

1
How do the Asian Economies Compete with Japan in the US Market? Is China Exceptional?
A Triangular Trade Approach
February 2005
Hiro Ito Department of Economics Portland State University
and
Yushi Yoshida
Faculty of Economics Kyushu Sangyo University
[Abstract]
In this study, we investigate the dynamics of the trilateral trade relationship among China, Japan and the US. In what we call the “triangular trade approach,” we explore how Japanese trade with and foreign direct investment to China affect Chinese exports to the US market. Moreover, in order to shed light on the possible peculiarity of Chinese trade, we apply the trilateral trade approach to seven other Asian countries and examine the effect of Japanese trade and FDI on these countries’ exports to the US. In this approach, we regress the exports of China and seven Asian countries (the “third countries”) to the US on the Japanese exports to the US as well as those to the third countries in a panel data specification while controlling for Japanese FDI and other macro economic variables. Our empirical results suggest that the exports of China and those of Japan are directly competitive in US markets while the exports of China to the US also appears to be promoted partly by Japanese exports to China. However, after controlling for Japan’s FDI to China on each commodity category, the trade enhancing effect of Japanese exports disappears, leading us to conclude that Japanese exports to China are positively correlated with Chinese exports to the US through an increase in vertical trade between Japanese multinationals and their affiliates in China. Our results for other Asian countries show that Indonesian and Philippine exports are also competing with Japanese exports in US markets. However, the degree of the competition with Japanese exports is found to be much higher for China. Key Words: China, Foreign Direct Investment, Japan, Trade, Triangular Trade Approach. JEL Classification: F14, F23
2
1. Introduction
In the last two decades, international trade with China has expanded most rapidly while the Chinese economy experienced an unprecedented high growth. Between 1992 and 2000, Chinese exports almost tripled from $84.9 billion to $249 billion. During the same period, Chinese imports also grew from $80.6 billion to $225 billion. With the accession to the WTO in 2001, China’s trade is expected to experience an even higher growth in the years to come. China’s significant presence in the world trade, however, has also given a rise to new trade disputes with trading partners. China is not only condemned for its sluggish response to foreign partners’ requests to open up its domestic markets, but also for its pervasive violations in intellectual property rights such as computer software licenses. A recent active debate between Alan Greenspan, Chairman of the Federal Reserve Board, and the US Congress about the restrictions on textile imports from China also exemplifies political concerns over a loss of manufacturing jobs in US industries competing directly with Chinese manufacturers. 1 A list of other manufacturing products under debates between these two countries includes bedroom furniture, television sets, handbags, and handcarts among many others. To many, these trade issues between the US and China are reminiscent of the trade conflicts between the US and Japan that lasted for decades until recently. While both academic and business circles intensely debated on foreign access to Japanese domestic markets, Japanese exporters in textile, automobile, and semiconductors among many others received fierce allegations of unfair trade practices that were claimed to have hurt US industries.2 The intensity of the bilateral trade disputes waned in the last decade, partly due to the decade-long recession in Japan, and more importantly, to the emergence of China as the world exporter.3 Generally speaking, political conflicts between trading countries could change their forms and players as the tide in foreign direct investment changes its direction. For example, a decrease in the exports of a country might merely be a reflection of global production shift by the country’s multinational corporations. Although we
1 See New York Times’ articles, “US moves to limit textile imports from China,” Nov 19, 2003, and “Greenspan warns Congress not to create trade barriers,” Mar 12, 2004. 2 For example, papers in Krugman (1991) discuss the degree of openness of Japanese domestic markets. Lawrence (1991) argues the “keiretsu” system was one of the sources of trade barriers in Japan, whereas Saxonhouse (1993) takes a view that Japan was no different from other industrial countries in terms of market access for foreign competitors. 3 For example, between 1999 and 2003, there is only one trade dispute case against Japan brought to the WTO dispute settlement mechanism. This case was brought by the US.

3
witness the “threat” of Japanese exports waning and US-Japan trade conflicts diminishing, that change may be because of strategic moves by Japanese multinational corporations to shift their production bases from Japan to other countries, especially China. In other words, some part of the surge in the exports from China to the US may include a large deal of products by Japanese companies or their affiliates in China for which the labels have merely changed from “made in Japan” to “made in China.” Japan’s Ministry of Finance reported that the number of new outflow FDI cases by Japanese firms to China exceeded those to the US in 1994, 1995 and 2002. For China, unquestionably, the US and Japan are the most important trading partners besides Hong Kong. Trading with these major economic powers is increasing its importance especially for the recent years. Before China started liberalizing its economy, Hong Kong played the most important role as a middleman between China and the rest of the world; Table 1 shows that in 1992, Hong Kong was China’s biggest trading partner in both exports and imports (in terms of traded values).4 For the recent years, with its economic liberalization efforts, China started trading more directly with the rest of the world while Hong Kong’s role as a middleman dwindled. Nonetheless, if we assume the indirect trade flows via Hong Kong to China are proportional to the direct trade flows to China, we could say that the US and Japan have been the two largest trading partners in both exports and imports during the last decade. Between 1992 and 2000, China’s imports from Japan tripled from $13.7 billion to $41.5 billion while the imports from the US more than doubled from $8.9 billion to $22.4 billion (see Table 1). During the same period, while China’s exports to Japan dramatically increased almost four-folds from $11.7 billion to $41.6 billion, its exports to the US, surpassing the growth of exports to Japan, rose from $8.6 billion to $52.1 billion. In this study, we investigate the dynamics of the trilateral trade relationship among China, Japan and the US. In what we call the “triangular trade approach,” we explore how Japanese trade with and foreign direct investment to China affect Chinese exports to the US market. Moreover, in order to shed light on the possible peculiarity of Chinese trade, we apply the trilateral trade approach to seven other Asian countries and examine the effect of Japanese trade and FDI on these countries’ exports to the US.5
For the reminder of the paper, we refer to these countries and China as “third countries” for convenience. In the triangular trade approach, we regress the exports of the third countries to
4 See Fung and Iizaka (1998) for a detailed description on Hong Kong’s role as a middleman of US and Japanese exports to China. 5 These countries are Hong Kong, Indonesia, Korea, Malaysia, Philippine, Singapore, and Thailand.
4
the US on the Japanese exports to the US as well as those to the third countries in a panel data specification while controlling for Japanese FDI and other macro economic variables. With this approach, we can reveal whether Japanese exports to the US and those to China (or other third countries) are substitutes. By incorporating Japanese firms’ FDI activities, we can also examine if Japanese multinational corporations are shifting their production bases to China (or other third countries in East Asia) and how that affects the exports from China (or other third countries) to the US. One of our important contributions in this study is that we attempt to examine bilateral trade flows in a three-country framework. Most of the past empirical works on international trade consider bilateral trade in a two-country framework. However, we think that empirical studies on international trade flows using two-country frameworks, such as gravity models, ignore an important trade determinant, that is, the influence of a third country’s trade flows. Our main empirical results are as follows. First, we find that Japanese exports to China seems to promote Chinese exports to the US. However, after controlling for Japan’s FDI to China, the trade enhancing effect of Japanese exports to China disappears, which indicates that Chinese exports to the US are promoted partly by Japanese firms which shift their production bases to China through FDI. We do not find this relationship in the triangle relationship with other Asian countries. Second, when controlling for the US market size for each commodity, we find that the exports from some of our sample Asian countries and Japanese exports are competing in the US market. However, the degree of the competition is higher for China than other Asian countries. The rest of the paper is organized as follows. Section 2 reviews the trade/FDI nexus linking Asian countries, Japan, and the US, and related literature. Section 3 presents theoretical backgrounds for our triangular trade approach. In section 4, we describe our data set. In section 5, we discuss the estimation results with the basic empirical model for the triangular trade framework. Section 6 reports the estimation results with a model that controls for foreign direct investment at the industry level as well as US total imports at the commodity level. We conclude in section 7. 2. The economic linkage among the Asian economies: the trade-FDI nexus As has been well-documented, the US and Japan have been the most important trading partners for the Asian economies for decades. Table 2 presents the shares of Japan and the US in the trade of the Asian countries between 1990 and 2000. The table shows that the US has been an important destination for Asian exports while Japan

5
is an important exporter to these countries. The share of the US as the export destination ranges from 14 percent (Indonesia) to 30 percent (the Philippines), while that of Japan as the import source country varies from 16 percent (Indonesia) to 25 percent (Thailand). From these data, we can generalize about the characteristics of the trilateral trade among Asian countries, Japan, and the US as that Japan exports to Asia while the latter exports to the US. Between 1985 and 1997, the exports from East Asia marked a steady almost five-fold increase (before declining in 1998 due to the Asian financial crisis), raising the share of exports in world total from 9 percent in 1980-85 to 18 percent in 1997 (see Kawai, 2004). At the same time, FDI inflows are expanding in East Asia hand-in-hand with trade. The share of FDI inflows to East Asia in world total increased from eight percent in 1985 to 22 percent in the mid-1990s, thought it declined to nine percent in 2002. Foreign direct investments to the Asian economies not only enlarged the exporting capacity, also changed the trade structure of the region. As Fukao, et al. (2003) document, intra-industry trade increased for the past decades, following an increase in vertical FDI by multinational corporations from the US and Japan. These multinationals relocated segments of production rather than entire industries, depending on each country’s comparative advantage (Hill and Athukorala, 1998). Hence, the trade expansion in East Asia inevitably involved a rise in intra-industry trade. Athukorala (2003) documents that the expansion in fragmented trade is the most evident in the East Asian region, more than in Europe or North America. Japan’s role as an FDI provider has been also increasing its importance in the region. Table 3 reports Japanese FDI (in terms of both its value and number of cases) in East Asia for the period between 1989 and 2002. We can see that Japanese FDI toward China is increasing enormously. The total value of Japanese direct investment flows to China, starting from a level slightly above the Philippines in 1989, hit its peak in 1995, exceeding far beyond twofold of those of other Asian countries. In terms of FDI cases, the growth of Japan’s FDI to China is even more striking; 27 percent of Japanese total FDI is directed to China in 1995. Unquestionably, China is the major recipient of Japanese FDI in the Asian region during the last decade. Given these trends in trade and FDI in the Asian region, many researchers have investigated the strength of interdependencies of trade and investment, often dubbed as the trade-FDI nexus, in the region. Many of them also claimed that the relationship between trade and FDI in the Asian economies has been bidirectional. That is, the Asian economies that implemented policies to create a friendly environment for foreign

6
direct investment have been able to transform their industrial structures toward more export-oriented ones. Export expansion, in return, has had positive feedback effects that facilitated further liberalization of goods and financial trade. Then, financial liberalization has enabled countries to receive more FDI inflows. Petri (1995) presents empirical evidence in both the macro and the firm level for this bidirectional relationship. Petri (1992) finds Japanese firms’ FDI to Thailand enhanced both trade between the two countries and trade between these two countries and the rest of the world, while Lee (1994) and Lin (1996) present evidence that the FDI from the home countries, Korea and Taiwan, respectively, promote only the bilateral trade volumes. Moreover, Kawai and Urata (1998) find a complementary relationship between Japan’s exports and FDI to East Asia in food, textiles, chemical products, general machinery, and electronic machinery industries. However, they also find that exports and FDI exhibit a strong negative relationship in wood and pulp industries. Dobson and Chia (1997), investigating intra-firm trade in East Asia, conclude that intra-firm trade tends to diminish as the host country’s economy matures, because the direction of FDI shifts toward more sophisticated, or more end-user type of products such as consumer durables, as the host country develops and its domestic purchasing power rises. We must make one important note, however, that most of the empirical studies on the trade-FDI nexus are focusing on bilateral trade and FDI flows and also tend to base their empirical models on the bilateral gravity model. As our most significant contribution to the literature, we look at the dynamics of the trade-FDI nexus among the US, Japan, and Asian countries in a three country frame work. 3. Triangular Trade Approach and Related Literature
3-1. FDI and Trade in a Three-Country Framework: Intra-firm Trade
When considering to sell products in a foreign market, a multinational firm can choose whether it exports the products directly from its home country, or produces them in the foreign market through its foreign subsidiaries. In the empirical trade literature, many researchers have attempted to answer the question of whether foreign production (i.e., FDI) and exports are substitutes or complements.6 Yamawaki (1991), Clausing (2000), and Head and Ries (2001) find that a complimentary relationship exists between foreign production and exports, whereas Belderbos and Sleuwaegen (1998) find that
6 More recent development in the literature can be also found in Helpman, et al. (2004) who find that the heterogeneity of firms in the industry is also an important determinant for the choice between exporting and foreign production through FDI.

7
Japanese FDI and exports are substitutes only when the intention of FDI is to avoid antidumping tariffs in Europe. Blonigen (2001), using product-level data, finds FDI and exports are substitutes when FDI is horizontal. However, these studies only focus on the relationship between outward FDI flows and exports. Our framework is closer to Zhang and Felmingham (2001) who investigate the causal relationship between inward FDI to China and Chinese exports. Using data from both national and provincial levels, they confirm that the causal relationship is bidirectional. Especially for the causality from inward FDI flows to exports, they argue that foreign investors who have superior knowledge on world market conditions tend to be successful in exporting their products from the host country. In any case, these previous researches only looked at trade-FDI relationships between two countries, depicted as figure 1.a and figure1.b.
Figure 1.a: trade flows prior to FDI Figure 1.b: trade flows after FDI In this paper we extend the investigation on the FDI-trade relationship to a three-country framework. Given the recent trends in international trade which involve a quite deal of intra-firm or intra-industry trade and FDI flows, that expand hand-in-hand with global trade, we think that investigating the dynamics of trade in the conventional bilateral framework is not sufficient. In order to examine the dynamics of trade between China and the US, for example, we cannot ignore the effects of trade flows between China and other countries (besides the US), and FDI flows from other countries (besides the US) into China. In what follows, we attempt to generalize the complex trilateral trade and FDI relationship in a simplest manner.
Country A
Country B
X
Y
Country A
Country B
X

8
A. Vertical Foreign Direct Investment Let us consider the trade-FDI dynamics of one commodity among three
countries: the US, Japan, and a third country which we call China for now. For the sake of brevity, we assume that the US provides a market for the commodity, and that Japan has a multinational firm that produces the commodity. The multinational firm may involve two firms for the production of the commodity: an upstream firm, U, and a downstream firm, D, while the former supplies intermediate goods to the latter which sells the final product to the US market. If both downstream and upstream firms are established in Japan, the product will be exported directly from Japan to the US. The trade dynamics of this first, base case are shown in Figure 2.a. Arrows in the figure represent flows of goods. In this case international trade flows are purely bilateral between the US and Japan, and involve no foreign production or FDI by the Japanese multinational.
Now, we consider a next case where the Japanese multinational makes vertical FDI.7 The Japanese multinational firm fragments its production by establishing a downstream firm D’ in China as a vertical FDI, and exports the product from there. This case is depicted in Figure 2.b. We assume for simplicity that the domestic downstream plant D is shut down once the Japanese-affiliated plant D’ is established in China, and therefore that all of the exports come from D’. This case leads to three changes in the trade flows among the three countries. First, Japanese exports to the US stop because of the shut-down of the domestic plant D. Second, Japanese exports to
7 We can also consider the case in which the multinational firm shifts its upstream firm to the local market. However, this case still does not alter the nature of the existing trade flows.
US
China Japan
D’
U
US
China Japan
D
U
Figure 2.a : trade flows prior toFDI
Figure 2.b: trade flows aftervertical FDI for down stream

9
China, instead, arise involving intra-firm trade between the parent firm U and its foreign affiliate D’. Third, Chinese exports to the US emerge because the Japanese downstream plant in China starts shipping the product to the US. In reality, a trilateral relationship is not as clear-cut as is shown above. However, we can generally predict that if Japanese firms are shifting their production to China through vertical FDI, Japanese exports to the US would decrease while both Japanese exports to China and Chinese exports to the US would increase. Thus, when vertical FDI is made, while Japanese exports of a certain product are observed to be decreasing, Japanese producers may be still exporting the same product to the US, but by bypassing through China.
B. Horizontal Foreign Direct Investment Next, we turn to a case where the Japanese multinational makes horizontal FDI. 8 Figure 3.a depicts the base model for this case in which the Japanese multinational, M, exports its product directly to the US. However, unlike the case in Figure 2.a, we assume that the multinational does not possess a vertical chain of production – the firm’s production is vertically internalized. Figure 3.b shows the case where horizontal FDI occurs, so that the product is now being exported directly from China instead of Japan. In reality, as in Figure 2.b, the trade flows based on horizontal FDI would entail a decrease in Japanese direct exports to the US, but an increase in Chinese exports to the US. However, unlike in the previous case with vertical FDI, the shift in the trade flows in this case does not lead to any intra-firm trade between Japan
8 For the analysis on the determinants of vertical and horizontal trade, refer to Aizenman and Marion (2001).
US
China Japan
M
US
China Japan
M
Figure 3.a: trade flows priorto FDI
Figure 3.b: trade flows afterhorizontal FDI
10
and China.9
3-3. Do Imports Promote Export?
Besides FDI flows, other factors can affect the trilateral trade relationship. Some studies find that the imports of foreign products with higher quality can force domestic competitors to become more efficient through international competition. MacDonald (1994) finds that US industries’ productivity level rose as the import penetration ratio increased.10 An overwhelming amount of studies, on the other hand, find that more efficient firms tend to export. Bernard and Jensen (1999) find that both the growth rates and the levels of success measures are higher for exporters in ex-ante, i.e., “good firms become exporters.” Combining these two findings and applying to our trilateral trade analysis, we can hypothesize that an increase in the exports from a Japanese firm (JPN) to China may lead a Chinese domestic firm (CHN) to become more efficient and start exporting. This case is shown in Figure 4. Although the trade flows look alike to the case in Figure 2.b, this case does not involve any FDI flows. 3-4. Competition or Complements
Lastly, not the least, we can think of a case where Japanese exports to the US and Chinese exports to the US are substitutes. This is highly probable for an industry in which the exports of the two countries are similar in quality (see Figure 5). In this case, head-to-head competition may arise between Japanese and Chinese firms, which can be observed as a negative correlation between Japanese and Chinese exports to the US. On the other hand, Japanese and Chinese exports to the US could have a complementary relationship if both countries produce intermediate products, but each for different production stages, and export them to the US market where a firm in the US produces the final goods using these intermediate products. In this case, we should observe a positive correlation between Japanese and Chinese exports to the US. It is, however, unlikely to find products from two countries to be complements if we use data based on the industry classification as disaggregated as the HS 4-digit level, which we
9 The presence of foreign affiliates can also create spillover effects on local exporters. Javorcik (2004) finds evidence for positive spillover effects of foreign affiliates on their local suppliers. Spillovers from foreign affiliates can help local firms not only to improve their productivity level, but also to become competitive exporters in the international markets. In such a case, we can expect an increase in the exports of the FDI-receiving country. 10 In a more generalized sense, we can also think that competitive pressure can increase the productivity of firms or industries. Galdon-Sanchez and Schmitz (2002) find that competitive pressure in iron-ore markets led to an increase in US labor productivity.

11
use in our study. Therefore, we should expect to find a negative correlation between Japanese and Chinese exports to the US with an assumption that the competitive effect outweighs the complimentary effect.
3-5. The “Triangular Trade Approach”
The above discussions have shown the complexity of the trade-FDI dynamics, but also demonstrated that we can unravel the complex dynamics by examining the relationships between different flows of trade among the three countries. Figure 5 presents a generic export flow chart among the three countries. The Japanese exports to the US and those to China are denoted as JPNUS and JPNCHN, respectively, while the Chinese exports to the US is denoted as CHNUS.11
11 For the sake of brevity, we continue to use China as the third country. However, in the empirical analysis section, we will test seven other Asian countries as the third countries.
US
China Japan
CHN JPN
US
China Japan
CHN JPN
US
China Japan
CHNUS JPNUS
JPNCHN
Figure 4: positive spillover effect from imports
Figure 5: competition (substitutiverelationship): negative correlation
Figure 6: the Triangular Trade Approach

12
Table 4 summarizes all the scenarios we discussed and expected signs for the correlations between two of the three trade flows. As for the relationship between JPNCHN and CHNUS, we should expect a positive correlation if vertical FDI is made by Japanese firms to China or if Japanese exports to China create spillover effects on Chinese firms and lead them to export to the US. As for the relationship between JPNUS and CHNUS, we should expect a negative correlation if vertical or horizontal FDI is made by Japanese firms to China or if the products from China and Japan are in direct competition in the US market.12
Table 4: Expected Signs for the Correlation between Trade Flows
JPNCHN and CHNUS JPNUS and CHNUS
Vertical FDI positive negative
Horizontal FDI – negative
Imports-Exports positive –
Competition – positive
In this study, we will employ what we call the “triangular trade approach,” in which we will examine the type of trade-FDI dynamics by empirically looking at the correlations between the two types of trade flows as shown in Table 4 in the trilateral trade relationship among Japan, the US, and China (or other “third countries”). More specifically, we will use the export flow from China, or third countries, to the US (CHNUS or THDUS) as the dependent variable in the empirical model while including Japan’s exports to China, or the third countries (JPNCHN or JPNTHD) as well as Japan’s exports to the US (JPNUS) as explanatory variables. 4. The Data
The exports data used in this study are extracted at the HS 4-digit level from International Trade by Commodity Statistics, Harmonized System Rev.1, OECD. At this level of disaggregation, there are 1,367 commodity classifications. From this set of data, we select our sample in the following two steps. First, we remove the commodities which are either not traded between a pair of countries or missing in any
12 The cells with “–” indicate that there is no specific theoretical prediction for the sign of the correlation.

13
of the years in our sample period of 1990 through 2000. We also restrict our sample to comprise the commodities for which a complete set of observations exists with a strictly positive amount of trade for the entire sample period. Second, since we need three flows of exports for each of the “third countries” (seven Asian countries and China): Japanese exports to the third country; Japanese exports to the US; and the third country’s exports to the US, we restrict our data to only those commodities for which all of the three export flows exist. This selection process reduces the number of observations considerably, and also causes it to vary (even for the same HS 4-digit classification codes) depending on the third countries due to data availability. For example, there are 576 commodities for China while there are only 162 commodities for Indonesia.13 Annual observations of exchange rate volatility are constructed from monthly exchange rates from IMF’s International Financial Statistics. Other macroeconomic variables, such as inflation rates, real GDP per capita, nominal GDP, and aggregate trade flows, are retrieved from IMF’s IFS and Direction of Trade. We also include the trade intensity indices for each pair of trading countries using the method in Frankel and Rose (1997) and the data from DOT and IFS. More details on the data definitions are given in Appendix 1. 5. Empirical Results with the Base Model
5-1. Model Specification and Empirical Results First, we specify a general error component regression model for the panel dataset using the first-differenced trade flows among the three countries as shown in equation (1).
, , , , , , , , , ,1 1 1
1,..., ; ( ) 1,..., ( ); 1,...,
I I KTHDUS i JPNTHD i JPNUS k
i j t i i j t i i j t k i t i j i j ti i k
T D T D T Z
i I j i J i t T
α β φ λ ε= = =
∆ = ∆ + ∆ + + +
= = =
∑ ∑ ∑ . (1)
, ,THDUS
i j tT∆ is the first-differenced exports of third country i to the US for commodity j at
13 The number of commodities for the third countries are 576 for China, 572 for Korea, 487 for Hong Kong, 288 for Singapore, 310 for Thailand, 162 for Indonesia, 180 for the Philippines, and 218 for Malaysia.

14
year t, while , ,JPNTHD
i j tT∆ and , ,JPNUS
i j tT∆ are the first-differenced Japanese exports to the
third country and to the US, respectively. The dummy variable iD takes a value of unity for country i and zero otherwise, and is also included to allow for heterogeneous
coefficients for the export variables. ,ki tZ represents a k-th exogenous variable for
country i at year t. ,i jλ is the individual effect while , ,i j tε is the disturbance term.
We should note that the number of commodities, J(i), varies for each third country i, and that we suppress (i) for the subscript j in the notation. For the specification test on the random effects, many researcher use Hausman (1978) which employs both GLS and Within estimators. Hausman and Taylor (1981) show that alternative test statistics incorporating the Between estimators are also numerically identical. However, these tests are no longer valid if the disturbances are heteroskedastic and/or serially correlated. Arellano (1993) suggests an alternative Wald test which is robust to heteroskedasticity and autocorrelation of the disturbances. In this study, we use this robust test statistic to select our model specification and choose between random effect and fixed effect models.14 If the null hypothesis that the conditional expectation of the unobserved individual effects is zero is rejected, we will use the fixed effect model in the following analysis. If the LM heteroskedasticity test statistics or Bhargava-DW statistics from the within estimation indicate that the disturbances possess heteroskedasticity or serial autocorrelation, we will use the White heterosckedasticity-consistent standard deviations. If the null is not rejected, we will use the random effect model specification.
5-2. Preliminary Analysis with only Export Variables
First, as a preliminary analysis, we include only the export variables in our panel data estimation as shown in equation (2). The robust Arellano statistic is found to be 75.2, rejecting the null hypothesis at the one percent significance level. Therefore, we use the fixed effect specification for the regression model. Since test statistics also indicate that the model specification entails heteroskedasticity and autocorrelation in the disturbances, we use the White standard deviations.
14 For the summary of Hausman’s specification test, see Baltagi (2001). Also, see Ahn and Low (1996) and Baltagi et al. (2003) for recent developments of the specification tests.

15
8 8
, , , , , , , , ,1 1
1,...,8; ( ) 1,..., ( ); 1,...,10
THDUS i JPNTHD i JPNUSi j t i i j t i i j t i j i j t
i iT D T D T
i j i J i t
α β λ ε= =
∆ = ∆ + ∆ + +
= = =
∑ ∑ (2)
Table 5 reports the estimation results. The estimated coefficients for JPNTHD, Japanese exports to a third country, are found to be always positive. While the magnitude of the coefficients varies among countries, it is especially higher for Korea, Singapore, and Malaysia, 0.30, 0.32, and 0.73, respectively, more than tenfold of the coefficients for Hong Kong, Thailand, and Indonesia. However, we obtained statistically significant coefficients only for China, Korea, and Malaysia. In this preliminary analysis, we observe that Japan’s exports to some of the Asian countries are positively correlated with their countries’ exports to the US. In section 3, we discussed a possibility for the channel of technology transfer through trade from an exporting country, Japan in our case, to an importing country. Given that some multinational corporations from Korea and Japan are competing directly with each other in the global markets, such as Samsung vs. Sony and Hyundai vs. Toyota, the significant result for Korea is not surprising. However, we should not exclude a possibility of FDI affecting the correlations as we discussed in section 3. Our previous discussion suggests that the expected sign for the coefficient of JPNUS (Japanese exports to the US) variables can be negative when 1) the exports to the US from Japan and those from a third country are competing head-to-head or 2) Japanese companies are shifting their production bases from Japan to their subsidiaries in the third country while reducing their direct exports to the US from Japan and increasing those from a third country. However, we must keep in mind that the sign can also be positive when some common factors, such as high US economic growth, are causing the world exports to increase. Interestingly, the estimated coefficient of JPNUS is significantly negative only for China (–0.05). We can interpret this result as evidence for two possible hypotheses: one, Japanese multinational corporations are shifting their production bases to China through FDI, thereby reducing direct exports from Japan while contributing the increase in Chinese exports of the related commodity to US markets; and two, direct exports from companies in Japan to US markets are being replaced by the exports from China without involving any FDI efforts by Japanese companies. However, at this stage, we cannot tell which hypothesis is applicable here. The coefficient for Korea, on the other hand, is significantly positive (0.22) at the one percent significant level,

16
implying that a ten million dollar increase in Japanese exports to the US leads to a two million dollar increase in Korean exports to US markets.
5-3. Analysis with Country Characteristics as Explanatory Variables
As is often done in the gravity model literature, in this section, we include macroeconomic variables in addition to the JPNTHD and JPNUS variables. After dropping some of the macroeconomic variables that appeared to cause multicollinearity,
we now have 10 macro variables in tiZ , in equation (1).15
In order to predict the effects of explanatory variables on the exports of the third countries to the US in our model, we should still be able to draw inferences from past empirical studies on bilateral trade relationships. For example, the inflation rate in a third country is expected to be negatively correlated to the country’s exports to the US because a rise in the general price level should reflect an increase in the overall costs in the third country. US nominal GDP should be positively correlated with third countries’ exports to the US. However, it is not obvious how Japanese macroeconomic variables can interact with third countries’ exports to the US. An increase in Japan’s nominal GDP can increase Japanese exports to the US and indirectly lead to an increase in a third country’s exports to the US if the exports of the third country and Japanese products are complements whereas it can work the other way around if the exports of the third country and Japanese products are substitutes. Some of the macroeconomic variables related to Japan are difficult to make a priori assumptions in the context of our model specification. We will come back to this issue when we examine the empirical results.
Table 6 shows the estimation results from the analysis with macroeconomic variables. Unlike past findings in the literature, most of the macroeconomic variables are insignificant. Moreover, the estimated coefficients for JPNTHD and JPNUS do not change considerably compared to the previous estimates while the adjusted R-squared barely improved. We suspect that the reason why most of the macroeconomic variables do not improve the estimation is because some of the macroeconomic variables take only a small number of different values, while trade-related data can vary
15 These variables are exchange rate volatility (EXVOL_US), inflation rate of the third countries (INF_THD), US inflation rate (INF_US), nominal GDP of the third countries (NY_THD), US nominal GDP (NY_US), Japanese nominal GDP (NY_JPN), third countries’ imports from the world (W_IMP_THD), Japanese imports from the world (W_IMP_JPN), third countries’ exports to the world (W_EXP_THD), and US exports to the world (W_EXP_US).

17
depending on the third country (i) and the commodity (j). For example, there are only 10 different (i.e., annual) values for US nominal GDP (NY_US) in a sample of 27,930 observations.16 As such, we need to employ some other data that entail more variation. 6. Empirical Results with More Disaggregated Explanatory Variables
Given the above discussion, we reestimate our estimation model using more disaggregated data for the control variables. Instead of the macroeconomic variables we used above, we include US total imports (disaggregated at the HS 4-digit level) to control for changes in US demand for each commodity, and Japanese FDI (at the HS 2-digit level) to capture a possible production shift by Japanese multinational corporations. 6-1. Data Construction
As the income level of a country can be an appropriate explanatory variable in conventional bilateral trade models with aggregate trade data, we can expect the amount of income allocated for a particular commodity to be an explanatory variable for our model with disaggregated trade data. From this perspective, we then choose an actual expenditure allocated for each imported commodity, i.e., total import for each HS 4-digit commodity, as a proxy variable, hoping that this variable will circumvent the simultaneity problem for the JPNUS variable. For this variable, we use the same data set from OECD’s International Trade by Commodity Statistics, Harmonized System Rev.1, and call this variable USMAR.17 Unlike the macroeconomic variables, this variable takes as many different values as the dependent variable. In section 3, we discussed that Japanese FDI to the third countries may lead to an increase in the third countries’ exports to the US while the Japanese FDI brings about vertical intra-firm trade between parent multinationals and their subsidiaries overseas (see Figure 2.b). Hence, the estimation for the effect of Japanese exports to the third countries on the latter’s exports to the US in the previous analysis may have reflected the effect of Japanese FDI flows to the third countries. In this section, we include in our estimation a variable that specifically refers to Japanese FDI to the third countries, so that the effect of Japanese FDI can be separated from that of Japanese exports to the
16 The explanatory power of macroeconomic variables in past bilateral trade studies hinges on the use of aggregated trade data. 17 Like other trade-related variables, we include USMAR as the first differenced variable.

18
third countries. For that variable, we use the data from the Overseas Japanese Companies Data (OJCD) from Toyo Keizai. OJCD contains the information for approximately 19,000 Japanese overseas subsidiaries, categorized in 68 industry classifications (which do not correspond to HS industry classifications), including each subsidiary’s established year, location, business objectives, industry classification, and other relevant information. Among the 68 industries, we exclude those industries which do not actively engage in goods trade such as real estate and banking sectors. Then, we reallocate OJCD’s codes to corresponding HS 2-digit codes and reclassify the data to create the FDI data based on the HS classifications.18 The new variable refers to Japanese FDI in the Asian third countries in terms of the number of the subsidiaries established by Japanese firms for each host country, year, and HS 2-digit industry code.19 6-2. Estimation Results
With the two additional variables, our estimation model becomes:
8 8
, , , , , ,1 1
8 8
, , , , , , ,1 1
1,...,8; ( ) 1,..., ( );
THDUS i JPNTHD i JPNUSi j t i i j t i i j t
i i
i ii i j t i i j t i j i j t
i i
T D T D T
D FDI D USMAR
i j i J i
α β
δ γ λ ε
= =
= =
∆ = ∆ + ∆
+ + +
= =
∑ ∑
∑ ∑ 1,...,10t =
(3)
The estimation results are shown in Table 7. For the US market size variables, USMAR, many of the coefficients are significantly positive. Among the Japanese FDI variables, the coefficient is significantly positive only for China, indicating that Japanese multinationals’ FDI to China complements Chinese exports to the US. Interestingly, with this model specification, the estimated coefficient for the Japanese exports to China is no longer significant. Previously, we interpreted the results in Table 5 that Japanese exports to China are promoting Chinese exports to the US. However, in the estimation based on equation (3), this relationship disappears. Given this and the previous results, we can surmise that Chinese exports to the US grow only
18 The concordance table is shown in Appendix 2. When a particular OJCD code covers more than two HS 2-digit codes, the FDI data for this OJCD code is counted in all corresponding HS 2-digit codes. 19 Therefore, two different HS 4-digit codes with the same first two digits share the same number of accumulated Japanese affiliated firms. This may not be problematic as long as there is cross-industry effect within the HS 2-digit level since we are trying to capture the trade-promoting effect of FDI.

19
through a shift of Japanese production plants to China (implemented through FDI), not from indirect technology transfer through Japanese exports to the country. (See section 3-3.) The triangular trade relationships involving Korea and Indonesia cast an interesting contrast to the case with China. The coefficients of the Japanese exports variables to these two countries remain significant at the five percent significance level while the coefficients of the FDI variables are not significant. This means that for Korea and Indonesia, Japanese exports to these countries are positively correlated with their exports to the US while Japanese FDI does not seem to play any important role in promoting these countries’ exports to the US. The positive coefficients for the Japanese exports to Korea and Indonesia can be indirectly attributed to technological-transfer or competitive pressure effects through Japanese exports to these countries.
In contrast to the previous results shown in Table 5, the coefficients of JPNUS are also significantly negative for Indonesia and the Philippines in addition to China. Moreover, the Korean coefficient for JPNUS, which was significantly positive in the previous estimation, is no longer significant. We believe that including the USMAR variable, a proxy for the expenditure level in each commodity market, eliminated the positive income effect of US market growth from JPNUS. It is noteworthy that the absolute value of the coefficient of JPNUS for China is much larger than that of Indonesia or the Philippines. Therefore, we can conclude that the degree of competition between Chinese and Japanese exports to US markets is much higher than the other countries.20 7. Conclusions In our empirical exploration, we found that the exports of China and those of Japan are directly competiting in US markets while the exports of China to the US also appears to be promoted partly by Japanese exports to China. However, after controlling for Japan’s FDI to China on industry category, the trade enhancing effect of Japanese exports disappears. With a statistically significant coefficient for Japanese FDI to China, we can conclude that Japanese exports to China seem to promote Chinese exports to the US because of increasing vertical trades between Japanese multinationals and their corresponding affiliates in China. The combined evidence of the substitutive 20 We also investigated equation (3) with the macroeconomic variables and found the results qualitatively unchanged. However, the Chinese coefficient for the FDI variable becomes statistically insignificant, though its p-value is as high as 14.8%. The estimation results can be obtained from the corresponding author upon request.

20
relationship between Chinese and Japanese exports to the US and the export-promoting effect of Japanese FDI to China confirms a view that while Chinese exports compete vigorously with Japanese exports in US markets, Japanese multinationals are shifting their production bases to China and forming a global production network. Our results for other Asian countries show that Indonesian and Philippine exports are also competing with Japanese exports in US markets. However, the degree of the competition with Japanese exports is found to be much higher for China. Our study shed light on the current debate about the trade disputes between China and the US from a different angle and presented results that may involve political ramifications. The main finding from our empirical analysis indicates that a surge in Chinese exports to the US may involve a quite deal of products manufactured by Japanese affiliates in China and therefore may simply reflect change in Japanese multinational corporations’ strategy in global production. Of course, for industries in which Chinese exports are currently under allegations, these particular products individually may not be strongly related to Japanese multinational operations. With the general perception of Chinese exports “threatening” US industry, however, we will probably continue to see more cases against China brought into the WTO trade dispute settlement mechanism. Eventually, we may also see cases against China, but the ones that actually involves products of Japanese multinational corporations.

21
References:
Ahn, Seung C. and Stuart Low, 1996, A reformulation of the Hausman test for regression models
with pooled cross-section-time-series data, Journal of Econometrics 71, 309-319.
Arellano, Manuel, 1993, On the testing of correlated effects with panel data, Journal of
Econometrics 59, 87-97.
Athukorala, Prema-chandra (2003). “Product Fragmentation and Trade Patterns in East Asia.”
Australia National University, Working Paper 2003/21.
Baltagi, Badi H., 2001, Econometric Analysis of Panel Data, Wiley, Chichester.
Baltagi, Badi H., Georges Bresson and Alain Pirotte, 2003, Fixed effects, random effects or
Hausman-Taylor? A pretest estimator, Economics Letters 79, 361-369.
Bernard, Andrew B. and J. Bradford Jensen, 1999. Exceptional exporter performance: Cause,
effect, or both?, Journal of International Economics 47, 1-25.
Belderbos, Rene and Leo Sleuwaegen, 1998. Tariff jumping DFI and export substitution: Japanese
electronics firms in Europe, International Journal of Industrial Organization 16, 601-638.
Blonigen, Bruce A., 2001. In search of substitution between foreign production and exports,
Journal of International Economics 53, 81-104.
Clausing, Kimberly A., 2000. Does multinational activity displace trade?, Economic Inquiry 38,
No. 2, 190-205.
Dobson, Wendy and Chia, Siow Yue (1997). Multinationals and East Asian integration, Institute of
Southeast Asian Studies, Singapore.
Frankel, Jeffrey and Andrew K. Rose, 1997. The endogeneity of the optimum currency area criteria,
mimeo.
Fukao, Kyoji, Hikari Ishido, and Keiko Ito (2003). “Vertical Intra-industry Trade and Foreign Direct
Investment in East Asia.” Journal of the Japanese and International Economies, vol. 17, no. 4, p.
468 – 506.
Fung, K.C. and Hitomi Iizaka, 1998. Japanese and US trade with China: A comparative Analysis,
Review of Development Economics 2(2), 181-190.
Galdon-Sanchez, Jose E. and James A. Schmitz, Jr., 2002. Competitive pressure and labor
productivity: World iron-ore markets in the 1980’s, American Economic Review 92(4),
1222-1235.
Hausman, Jerry A., 1978, Specification tests in econometrics, Econometrica 46, 1251-1271.
Hausman, Jerry A. and William E. Taylor, 1981, Panel data and unobservable individual effects,
Econometrica 49, 1377-1398.
Head, Keith and John Ries, 2001. Overseas investment and firm exports, Review of International
Economics 9, 108-122.
Helpman, Elhanan, Marc J. Melitz and Stephen R. Yeaple, 2004. Export versus FDI with

22
heterogeneous firms, American Economic Review 94(1), 300-316.
Hill, Hal and Prema-chandra Athukorala (1998). “Foreign Investment in East Asia: A Survey.”
Asia-Pacific Literature, 12(2): p. 23 – 50.
Javorcik, Beata S., 2004, Does foreign direct investment increase the productivity of domestic firms?
In search of spillovers through backward linkages, American Economic Review 94(3), 605-627.
Kawai, Masahiro (2004). “Trade and Investment Integration for Development in East Asia: A Case
for the Trade-FDI Nexus.” Mimeo, University of Tokyo.
Kawai, M. And Shujiro Urata (1998). “Are Trade and Direct Foreign Investment Substitutes or
Complements? An Empirical Analysis of Japanese Manufacturing Industries.” Lee, Hiro and
Roland-Holst, David W. eds., Economic Development and Cooperation in the Pacific Basin:
Trade Investment, and Environmental Issues. Cambridge, UK: Cambridge University Press). p.
251 – 293.
Krugman, Paul, 1991, Trade with Japan: Has the door opened wider?, University of Chicago Press
for the NBER.
Lawrence, Robert Z., 1991. Efficient or exclusionist? The import behavior of Japanese corporate
groups, Brookings Papers on Economic Acitvity 1, 311-341.
Leamer, Edward and James Levinsohn, International trade theory: the evidence, in Handbook of
International Economics, Vol III, edited by G. Grossman and K. Rogoff, 1995.
Lee, C. H. (1994). “Korea’s Direct Foreign Investment in Southeast Asia.” ASEAN Economic
Bulletin, 10(3): 286 – 96.
Lin, A. L. (1996). “Trade Effects of Foreign Direct Investment: Evidence for Taiwan with Four
ASEAN Countries.” Weltwirtschaftliches Archiv, 132 (4): p. 737 – 47.
Lispsey, Robert E. (1999). “Affiliates of US and Japanese Multinationals in East Asian Production
and Trade.” NBER Working Paper #7292.
Petri, P. A. (1992). “Platforms in the Pacific: the Trade Effects of Direct Investment in Thailand.”
Journal of Asian Economics, 3(2): p. 173 – 96.
____________ (1995). “The interdependencies of trade and investment in the Pacific,” in Chen,
Edward K. Y. and Peter Drysdale, eds., Corporate and foreign direct investment in Asia and the
Pacific.
Saxonhouse, Gary R., 1993, What does Japanese trade structure tell us about Japanese trade policy?,
Journal of Economic Perspectives 7 (3), 21-43.
Yamawaki, Hideki, 1991. Exports and foreign distributional activities: Evidence on Japanese firms
in the United States, The Review of Economics and Statistics 73 (2), 294-300.
Zhang, Qing and Bruce Felmingham, 2001. The relationship between inward direct foreign
investment and China’s provincial export trade, China Economic Review 12, 82-89.

23
Appendix 1: exvol_US = exchange volatility between THD’s currency and the U.S. dollars
exvol_JPN = exchange volatility between THD’s currency and Japanese yen
inf_THD = THD’s inflation rate
inf_US = US inflation rate
inf_JPN = Japanese inflation rate
rypc_THD = real GDP per capita of THD
rypc_US = real GDP per capita of US
rypc_JPN = real GDP per capita of Japan
ny_THD = nominal GDP of THD
ny_US = nominal GDP of US
ny_JPN == nominal GDP of Japan
W_IMP_THD = THD’s imports from the world
W_IMP_US = US imports from the world
W_IMP_JPN = Japanese imports from the world
W_EXP_THD = THD’s exports to the world
W_EXP_US = US exports to the world
W_EXP_JPN = Japanese exports to the world

Appendix 2: Concordance Table for FDI and Trade Classification
HS Code Toyo Keizai Code HS Code Toyo Keizai Code 1st 2nd 3rd 4th 1st 2nd 3rd 4th 1 53 700 2700 3 200 600 2600 54 700 2700 5 200 600 2600 55 700 2700 6 200 2600 56 700 2700 7 200 600 2600 57 700 2700 9 200 600 2600 58 700 2700 10 200 600 2600 59 700 2700 11 200 600 2600 60 700 2700 12 200 600 2600 61 700 2700 13 200 600 2600 62 700 2700 14 200 600 2600 63 700 2700 15 200 600 2600 64 16 600 65 17 600 66 18 600 67 19 600 68 1400 3200 20 600 69 1400 3200 21 600 70 1400 3200 22 600 71 23 600 72 1500 3300 24 73 1500 3300 25 300 74 1600 1700 3400 3500 26 300 75 1600 1700 3400 3500 27 300 1200 3000 76 1600 1700 3400 3500 28 1100 2900 78 1600 1700 3400 3500 29 1100 2900 79 1600 1700 3400 3500 30 1100 2900 80 1600 1700 3400 3500 31 1100 2900 81 1600 1700 3400 3500 32 1100 2900 82 1600 1700 3400 3500 33 1100 2900 83 1600 1700 3400 3500 34 1100 2900 84 1800 3600 35 1100 2900 85 1900 3700 36 1100 2900 86 2000 3800 37 1100 2900 87 2100 3900 38 1100 2900 88 2000 3800 39 1100 2900 89 2000 3800 40 1300 3100 90 2200 4000 41 1300 3100 91 2200 4000 42 1300 3100 92 2300 44 800 2800 93 46 800 2800 94 48 900 2800 95 49 1000 96 50 700 2700 97 51 700 2700 52 700 2700

Table 1: China’s Trade with Major Trading Partners (thousands of dollars)
Imports
1992 1995 1998 2000
1 Hong Kong 20,533,589 Japan 29,004,529 Japan 28,275,074 Japan 41,509,675
2 Japan 13,682,461 United States 16,118,291 United States 16,883,171 Taiwan 25,493,561
3 United States 8,900,735 Taiwan 14,783,944 Taiwan 16,631,051 Korea 23,207,406
4 Taiwan 5,865,971 Korea 10,293,234 Korea 15,014,348 United States 22,363,148
5 Germany 4,015,042 Hong Kong 8,590,713 Germany 7,020,657 Germany 10,408,731
World 80,585,333 World 132,083,539 World 140,236,807 World 225,093,731
Exports
1992 1995 1998 2000
1 Hong Kong 37,512,229 Hong Kong 35,983,427 Hong Kong 38,741,792 United States 52,099,220
2 Japan 11,678,713 Japan 28,466,685 United States 37,947,666 Hong Kong 44,518,285
3 United States 8,593,800 United States 24,713,498 Japan 29,660,114 Japan 41,654,314
4 Germany 2,447,990 Korea 6,687,805 Germany 7,354,309 Korea 11,292,364
5 Korea 2,404,912 Germany 5,671,451 Korea 6,251,516 Germany 9,277,790
World 84,940,062 World 148,779,565 World 183,809,065 World 249,202,551
Source: ITCS,OECD
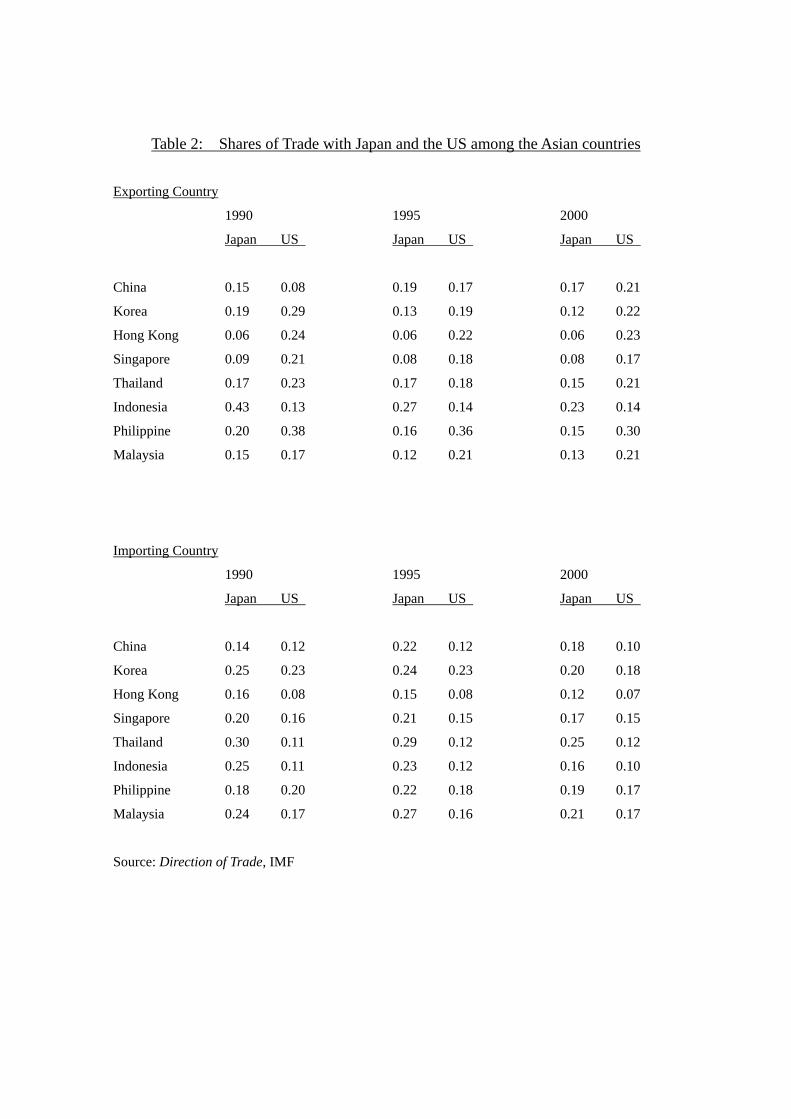
Table 2: Shares of Trade with Japan and the US among the Asian countries
Exporting Country
1990 1995 2000
Japan US Japan US Japan US
China 0.15 0.08 0.19 0.17 0.17 0.21
Korea 0.19 0.29 0.13 0.19 0.12 0.22
Hong Kong 0.06 0.24 0.06 0.22 0.06 0.23
Singapore 0.09 0.21 0.08 0.18 0.08 0.17
Thailand 0.17 0.23 0.17 0.18 0.15 0.21
Indonesia 0.43 0.13 0.27 0.14 0.23 0.14
Philippine 0.20 0.38 0.16 0.36 0.15 0.30
Malaysia 0.15 0.17 0.12 0.21 0.13 0.21
Importing Country
1990 1995 2000
Japan US Japan US Japan US
China 0.14 0.12 0.22 0.12 0.18 0.10
Korea 0.25 0.23 0.24 0.23 0.20 0.18
Hong Kong 0.16 0.08 0.15 0.08 0.12 0.07
Singapore 0.20 0.16 0.21 0.15 0.17 0.15
Thailand 0.30 0.11 0.29 0.12 0.25 0.12
Indonesia 0.25 0.11 0.23 0.12 0.16 0.10
Philippine 0.18 0.20 0.22 0.18 0.19 0.17
Malaysia 0.24 0.17 0.27 0.16 0.21 0.17
Source: Direction of Trade, IMF

Table3 : Japanese Foreign Direct Investment to the Asia countries (1989 - 2002) (100 million Yen)
1989 1990 1991 1992 1993 1994 1995 1996 1997 1998 1999 2000 2001 2002 China 587 511 787 1,381 1,954 2,683 4,319 2,828 2,438 1,377 849 1,112 1,808 2,152 (126) (165) (246) (490) (700) (636) (770) (365) (258) (114) (78) (105) (189) (263) Korea 799 419 357 291 289 420 433 468 543 389 1,094 899 704 763 (81) (54) (48) (28) (34) (27) (25) (33) (53) (48) (62) (52) (47) (44) Hong Kong 2,502 2,610 1,260 966 1,447 1,179 1,106 1,675 860 789 1,088 1,039 374 248 (335) (244) (178) (154) (184) (112) (119) (89) (121) (51) (76) (52) (37) (31) Singapore 2,573 1,232 837 875 735 1,101 1,143 1,256 2,238 832 1,102 505 1,433 915 (181) (139) (103) (100) (97) (69) (94) (102) (96) (58) (51) (25) (31) (34) Thailand 1,703 1,696 1,107 849 680 749 1,196 1,581 2,291 1,760 924 1,030 1,105 614 (403) (377) (258) (130) (127) (126) (147) (196) (154) (72) (72) (62) (51) (52) Indonesia 840 1,615 1,628 2,142 952 1,808 1,548 2,720 3,085 1,398 1,024 464 622 509 (140) (155) (148) (122) (115) (116) (168) (160) (170) (64) (57) (26) (56) (41) Philippine 269 383 277 210 236 683 692 630 642 488 689 514 951 500 (87) (58) (42) (45) (56) (75) (100) (75) (64) (46) (32) (44) (25) (20) Malaysia 902 1,067 1,202 919 892 772 555 644 971 668 588 256 320 98 (159) (169) (136) (111) (92) (51) (57) (69) (82) (34) (44) (23) (18) (11) World 90,339 83,527 56,862 44,313 41,514 42,808 49,568 54,095 66,236 52,413 74,703 53,854 39,922 44,175 (6589) (5863) (4564) (3741) (3488) (2478) (2863) (2501) (2495) (1616) (1729) (1701) (1768) (2144) Source: Outward Direct Investment, Ministry of Finance, Japan. Figures in parentheses indicates the number of FDI cases.

Table 5: Within Estimates from the Triangular Trade Regression
Dependent variable: (first-differenced) exports of third countries to the US
Variable Coefficient Variable Coefficient
JPNCHN 0.125** JPNUS(CHN) -0.048*
(0.063) (0.028)
JPNKOR 0.301** JPNUS(KOR) 0.215***
(0.122) (0.069)
JPNHKG 0.071 JPNUS(HKG) 0.022
(0.068) (0.016)
JPNSGP 0.319 JPNUS(SGP) 0.082
(0.246) (0.098)
JPNTHA 0.006 JPNUS(THA) 0.024
(0.035) (0.015)
JPNIDN 0.024 JPNUS(IDN) -0.004
(0.017) (0.006)
JPNPHL 0.161 JPNUS(PHL) -0.024
(0.369) (0.023)
JPNMAL 0.732*** JPNUS(MAL) 0.053
(0.245) (0.040)
NOB= 27930 Adj. R2 = 0.350
Note: All trade-related variables are included as first-differenced variables. White heteroskedasticity consistent standard deviations are in parentheses. ***, **, and * denote significance at 1, 5, and 10 percent levels, respectively. The number of commodities for each country differs due to screening process by our own selection criteria, see section 4 for further details; 576 for China, 572 for Korea, 487 for Hong Kong, 288 for Singapore, 310 for Thailand, 162 for Indonesia, 180 for Philippine, and 218 for Malaysia.

Table 6: Within Estimates for the Triangular Trade Regression with Macro Variables Dependent variable: (first-differenced) exports of third countries to the US
Variable Coefficient Variable Coefficient Variable Coefficient JPNCHN 0.109* JPNUS(CHN) -0.049* EXVOL_US -6,347 (0.063) (0.028) (9,781) JPNKOR 0.299** JPNUS(KOR) 0.215*** INF_THD -0.631 (0.124) (0.069) (52) JPNHKG 0.074 JPNUS(HKG) 0.023 INF_US 457 (0.069) (0.016) (1,118) JPNSGP 0.319 JPNUS(SGP) 0.082 NY_THD -0.016 (0.246) (0.098) (0.012) JPNTHA 0.018 JPNUS(THA) 0.024 NY_US 0.007 (0.036) (0.015) (0.005) JPNIDN 0.031* JPNUS(IDN) -0.003 NY_JPN -0.002 (0.018) (0.006) (0.002) JPNPHL 0.171 JPNUS(PHL) -0.022 W_IMP_THD 0.069** (0.367) (0.022) (0.032) JPNMAL 0.733*** JPNUS(MAL) 0.052 W_IMP_JPN -0.055 (0.245) (0.040) (0.044) W_EXP_THD 0.251*** (0.061) W_EXP_US -0.011 (0.030) NOB = 27930 Adj. R2 = 0.351 Note: All trade-related variables are included as first-differenced variables. White heteroskedasticity consistent standard deviations are in parentheses. ***, **, and * denote significance at 1, 5, and 10 percent level, respectively. The number of commodities for each country differs due to screening process by our own selection criteria, see section 4 for further details; 576 for China, 572 for Korea, 487 for Hong Kong, 288 for Singapore, 310 for Thailand, 162 for Indonesia, 180 for Philippine, and 218 for Malaysia.
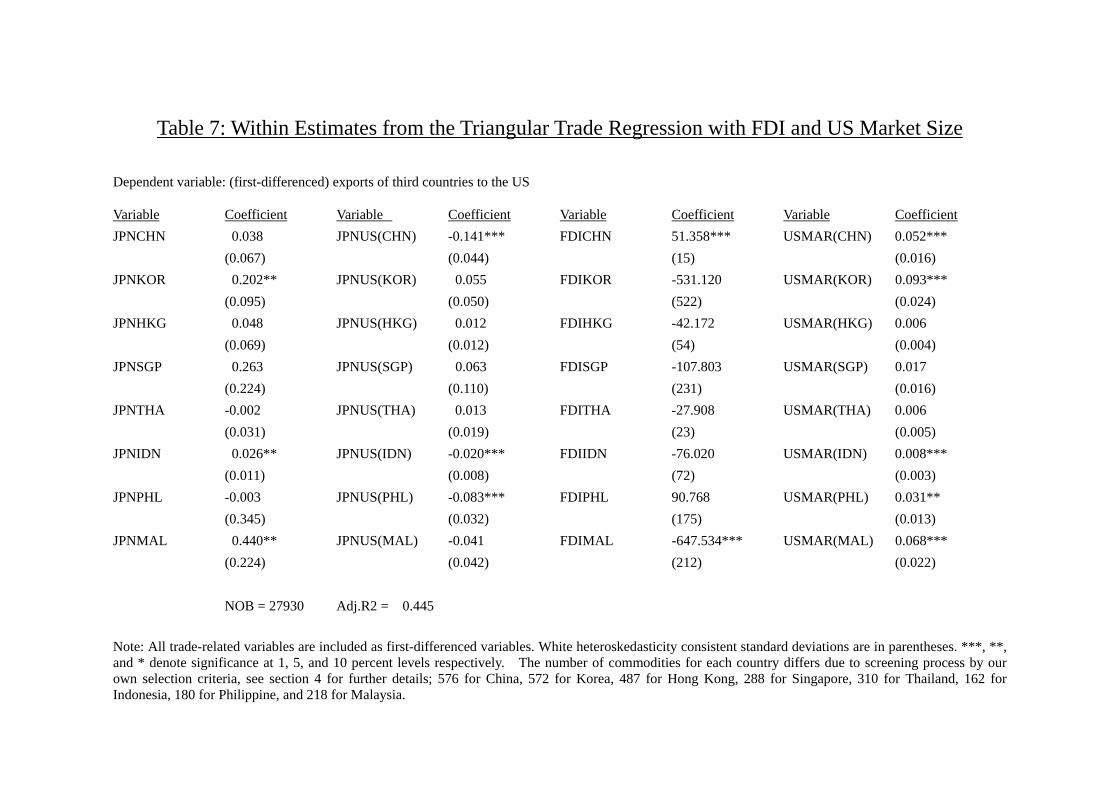
Table 7: Within Estimates from the Triangular Trade Regression with FDI and US Market Size Dependent variable: (first-differenced) exports of third countries to the US
Variable Coefficient Variable Coefficient Variable Coefficient Variable Coefficient JPNCHN 0.038 JPNUS(CHN) -0.141*** FDICHN 51.358*** USMAR(CHN) 0.052*** (0.067) (0.044) (15) (0.016) JPNKOR 0.202** JPNUS(KOR) 0.055 FDIKOR -531.120 USMAR(KOR) 0.093*** (0.095) (0.050) (522) (0.024) JPNHKG 0.048 JPNUS(HKG) 0.012 FDIHKG -42.172 USMAR(HKG) 0.006 (0.069) (0.012) (54) (0.004) JPNSGP 0.263 JPNUS(SGP) 0.063 FDISGP -107.803 USMAR(SGP) 0.017 (0.224) (0.110) (231) (0.016) JPNTHA -0.002 JPNUS(THA) 0.013 FDITHA -27.908 USMAR(THA) 0.006 (0.031) (0.019) (23) (0.005) JPNIDN 0.026** JPNUS(IDN) -0.020*** FDIIDN -76.020 USMAR(IDN) 0.008*** (0.011) (0.008) (72) (0.003) JPNPHL -0.003 JPNUS(PHL) -0.083*** FDIPHL 90.768 USMAR(PHL) 0.031** (0.345) (0.032) (175) (0.013) JPNMAL 0.440** JPNUS(MAL) -0.041 FDIMAL -647.534*** USMAR(MAL) 0.068*** (0.224) (0.042) (212) (0.022) NOB = 27930 Adj.R2 = 0.445 Note: All trade-related variables are included as first-differenced variables. White heteroskedasticity consistent standard deviations are in parentheses. ***, **, and * denote significance at 1, 5, and 10 percent levels respectively. The number of commodities for each country differs due to screening process by our own selection criteria, see section 4 for further details; 576 for China, 572 for Korea, 487 for Hong Kong, 288 for Singapore, 310 for Thailand, 162 for Indonesia, 180 for Philippine, and 218 for Malaysia.