how do you pay? the role of incentives at the point-of-sale · how do you pay? the role of...
TRANSCRIPT

How Do You Pay?The Role of Incentives at the
Point-of-Sale
Carlos Arango, Kim P. Huynh and Leonard M. Sabetti
2011 Bank of Canada Annual ConferenceNovember 17, 2011
The views expressed are those of the authors. No responsibility for them
should be attributed to the Bank of Canada.
1/26

IntroductionThe Bank of Canada needs to anticipate changes in the demandfor cash relative to alternative means of payment:
Where and how is cash used in the economy?Shifts in how consumers pay?
Empirical investigation on choice of cash, debit and credit cardusage at the point-of-sale (POS).
Motivation 2/26
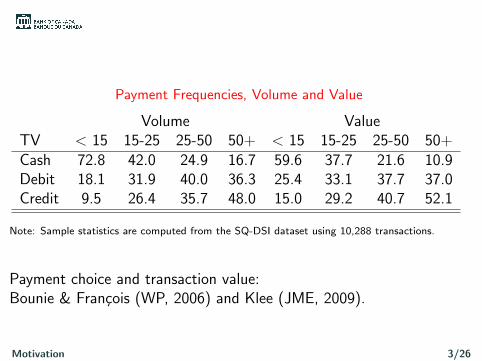
Payment Frequencies, Volume and Value
Volume ValueTV < 15 15-25 25-50 50+ < 15 15-25 25-50 50+Cash 72.8 42.0 24.9 16.7 59.6 37.7 21.6 10.9Debit 18.1 31.9 40.0 36.3 25.4 33.1 37.7 37.0Credit 9.5 26.4 35.7 48.0 15.0 29.2 40.7 52.1
Note: Sample statistics are computed from the SQ-DSI dataset using 10,288 transactions.
Payment choice and transaction value:Bounie & Francois (WP, 2006) and Klee (JME, 2009).
Motivation 3/26
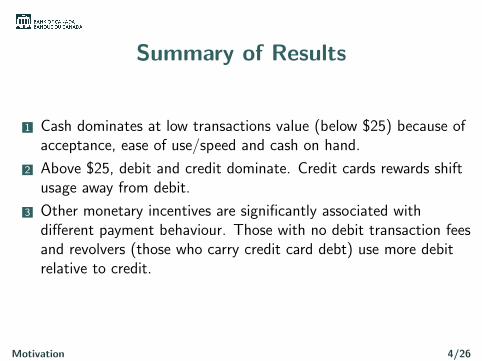
Summary of Results
1 Cash dominates at low transactions value (below $25) because ofacceptance, ease of use/speed and cash on hand.
2 Above $25, debit and credit dominate. Credit cards rewards shiftusage away from debit.
3 Other monetary incentives are significantly associated withdifferent payment behaviour. Those with no debit transaction feesand revolvers (those who carry credit card debt) use more debitrelative to credit.
Motivation 4/26
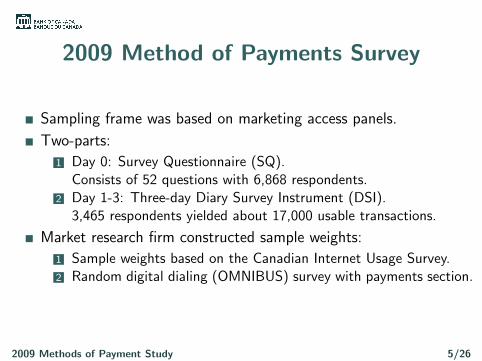
2009 Method of Payments Survey
Sampling frame was based on marketing access panels.
Two-parts:
1 Day 0: Survey Questionnaire (SQ).Consists of 52 questions with 6,868 respondents.
2 Day 1-3: Three-day Diary Survey Instrument (DSI).3,465 respondents yielded about 17,000 usable transactions.
Market research firm constructed sample weights:
1 Sample weights based on the Canadian Internet Usage Survey.2 Random digital dialing (OMNIBUS) survey with payments section.
2009 Methods of Payment Study 5/26

Survey Questionaire (SQ)
Demographics:gender, age, income, education, employment,marital status, home ownership, family size, ethnicity andonline/offline status.
Payment Features:
Debit card features: monthly fees, free transactions.Credit card features: rewards, revolver, interest rates.
Payment Perceptions:
Ease of use, cost, risk/fraud, acceptance and record keeping.
Cash holding.
Cash inventory practices (ATM withdrawals).
2009 Methods of Payment Study 6/26
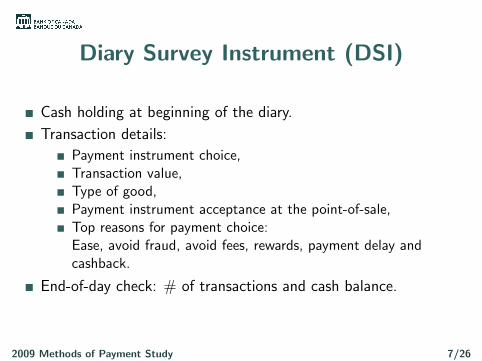
Diary Survey Instrument (DSI)
Cash holding at beginning of the diary.
Transaction details:
Payment instrument choice,Transaction value,Type of good,Payment instrument acceptance at the point-of-sale,Top reasons for payment choice:Ease, avoid fraud, avoid fees, rewards, payment delay andcashback.
End-of-day check: # of transactions and cash balance.
2009 Methods of Payment Study 7/26
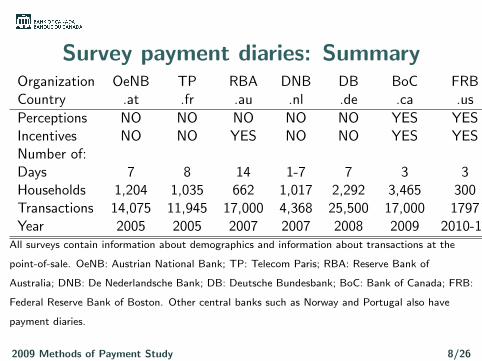
Survey payment diaries: SummaryOrganization OeNB TP RBA DNB DB BoC FRBCountry .at .fr .au .nl .de .ca .us
Perceptions NO NO NO NO NO YES YESIncentives NO NO YES NO NO YES YESNumber of:Days 7 8 14 1-7 7 3 3Households 1,204 1,035 662 1,017 2,292 3,465 300Transactions 14,075 11,945 17,000 4,368 25,500 17,000 1797Year 2005 2005 2007 2007 2008 2009 2010-11
All surveys contain information about demographics and information about transactions at the
point-of-sale. OeNB: Austrian National Bank; TP: Telecom Paris; RBA: Reserve Bank of
Australia; DNB: De Nederlandsche Bank; DB: Deutsche Bundesbank; BoC: Bank of Canada; FRB:
Federal Reserve Bank of Boston. Other central banks such as Norway and Portugal also have
payment diaries.
2009 Methods of Payment Study 8/26
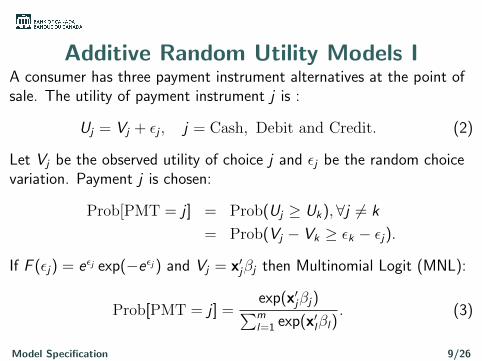
Additive Random Utility Models IA consumer has three payment instrument alternatives at the point ofsale. The utility of payment instrument j is :
Uj = Vj + εj , j = Cash, Debit and Credit. (2)
Let Vj be the observed utility of choice j and εj be the random choicevariation. Payment j is chosen:
Prob[PMT = j ] = Prob(Uj ≥ Uk),∀j 6= k
= Prob(Vj − Vk ≥ εk − εj).
If F (εj) = eεj exp(−eεj ) and Vj = x′jβj then Multinomial Logit (MNL):
Prob[PMT = j ] =exp(x′jβj)∑ml=1 exp(x′lβl)
. (3)
Model Specification 9/26
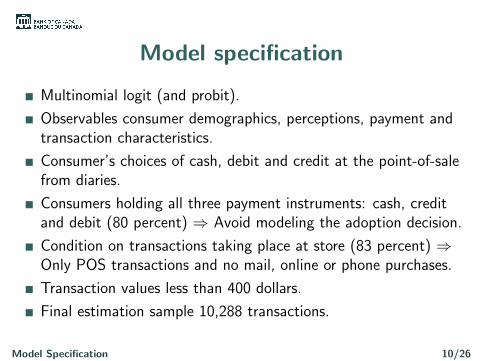
Model specification
Multinomial logit (and probit).
Observables consumer demographics, perceptions, payment andtransaction characteristics.
Consumer’s choices of cash, debit and credit at the point-of-salefrom diaries.
Consumers holding all three payment instruments: cash, creditand debit (80 percent) ⇒ Avoid modeling the adoption decision.
Condition on transactions taking place at store (83 percent) ⇒Only POS transactions and no mail, online or phone purchases.
Transaction values less than 400 dollars.
Final estimation sample 10,288 transactions.
Model Specification 10/26
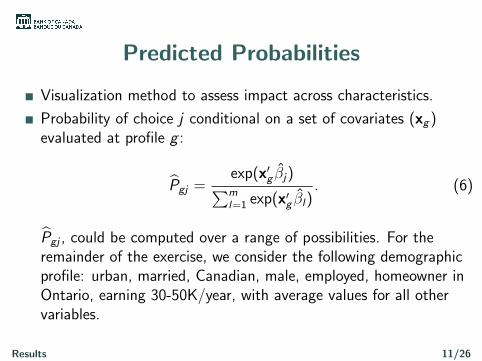
Predicted Probabilities
Visualization method to assess impact across characteristics.
Probability of choice j conditional on a set of covariates (xg )evaluated at profile g :
Pgj =exp(x′g βj)∑ml=1 exp(x′g βl)
. (6)
Pgj , could be computed over a range of possibilities. For theremainder of the exercise, we consider the following demographicprofile: urban, married, Canadian, male, employed, homeowner inOntario, earning 30-50K/year, with average values for all othervariables.
Results 11/26

Ease of use/speed: Top reason for cash
Note: The perception of Ease of use/speed is evaluated at the observed level versus credit card
speed importance. Shaded areas represent 95 percent confidence intervals.
Results 12/26
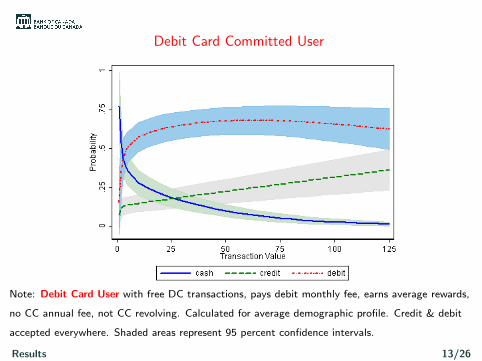
Debit Card Committed User
Note: Debit Card User with free DC transactions, pays debit monthly fee, earns average rewards,
no CC annual fee, not CC revolving. Calculated for average demographic profile. Credit & debit
accepted everywhere. Shaded areas represent 95 percent confidence intervals.
Results 13/26
Credit Card Reward Packages
178 different credit card types among DSI respondents.
Roughly 60% of credit card respondents have rewards.
Convert reward points/miles to ad-valorem cash rewards usingvarious sources (Banks, FCAC, etc.).
Carbo & Linares-Zegarra (JBF, 2011) and Agarwal, Chakravorti,and Lunn (2010) use RP = 1.00%.
MOP, the average rewards is RP = 0.78%.
Exploit this heterogeneity to measure the effect of rewards.
Results 14/26
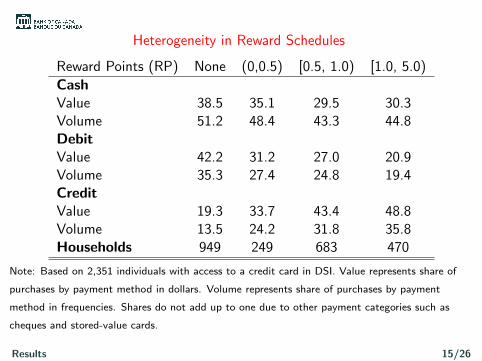
Heterogeneity in Reward Schedules
Reward Points (RP) None (0,0.5) [0.5, 1.0) [1.0, 5.0)
CashValue 38.5 35.1 29.5 30.3Volume 51.2 48.4 43.3 44.8DebitValue 42.2 31.2 27.0 20.9Volume 35.3 27.4 24.8 19.4CreditValue 19.3 33.7 43.4 48.8Volume 13.5 24.2 31.8 35.8Households 949 249 683 470
Note: Based on 2,351 individuals with access to a credit card in DSI. Value represents share of
purchases by payment method in dollars. Volume represents share of purchases by payment
method in frequencies. Shares do not add up to one due to other payment categories such as
cheques and stored-value cards.
Results 15/26
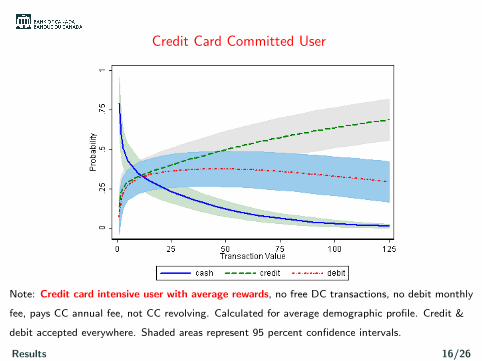
Credit Card Committed User
Note: Credit card intensive user with average rewards, no free DC transactions, no debit monthly
fee, pays CC annual fee, not CC revolving. Calculated for average demographic profile. Credit &
debit accepted everywhere. Shaded areas represent 95 percent confidence intervals.
Results 16/26

Credit Card Committed User & Revolving
Note: Credit card intensive user with average rewards, no free DC transactions, no debit monthly
fee, pays CC annual fee, and CC revolving. Calculated for average demographic profile. Credit &
debit accepted everywhere. Shaded areas represent 95 percent confidence intervals.
Results 17/26
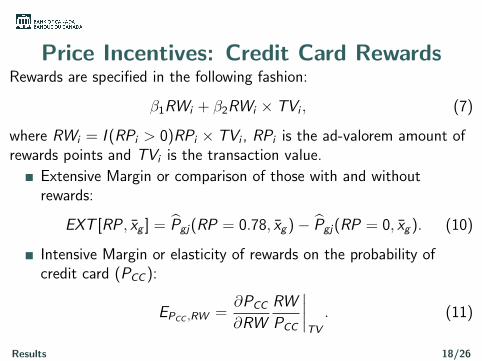
Price Incentives: Credit Card RewardsRewards are specified in the following fashion:
β1RWi + β2RWi × TVi , (7)
where RWi = I (RPi > 0)RPi × TVi , RPi is the ad-valorem amount ofrewards points and TVi is the transaction value.
Extensive Margin or comparison of those with and withoutrewards:
EXT [RP , xg ] = Pgj(RP = 0.78, xg )− Pgj(RP = 0, xg ). (10)
Intensive Margin or elasticity of rewards on the probability ofcredit card (PCC ):
EPCC ,RW =∂PCC
∂RW
RW
PCC
∣∣∣∣TV
. (11)
Results 18/26

Rewards versus No Rewards: Extensive Margin
TV Cash DC CC5 -0.37 -0.21 0.5825 -1.82 -1.78 3.6150 -2.76 -5.12 7.87100 -2.10 -10.71 12.81
Note: Difference in predicted probabilities for those with Rewards (evaluated at RP=0.78%) and
those without rewards.
Results 19/26
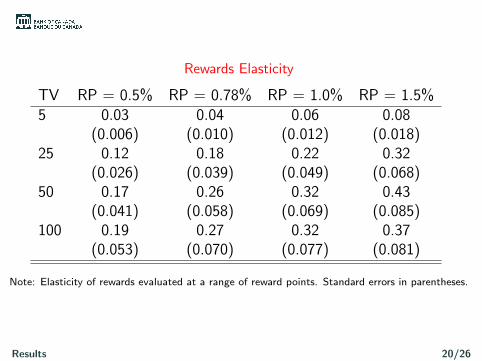
Rewards Elasticity
TV RP = 0.5% RP = 0.78% RP = 1.0% RP = 1.5%5 0.03 0.04 0.06 0.08
(0.006) (0.010) (0.012) (0.018)25 0.12 0.18 0.22 0.32
(0.026) (0.039) (0.049) (0.068)50 0.17 0.26 0.32 0.43
(0.041) (0.058) (0.069) (0.085)100 0.19 0.27 0.32 0.37
(0.053) (0.070) (0.077) (0.081)
Note: Elasticity of rewards evaluated at a range of reward points. Standard errors in parentheses.
Results 20/26

Extension: A work-in-progress
Rewards are correlated with unobserved preferences for credit cards:
1 Respondent use credit cards more often due to rewards.
2 Rewards induce switching and learning about credit cards.
3 Card-issuers send pre-approvals to consumers who are credit-cardintensive.
U∗j = Xjβj + f
(RP∗i × TVi
)+ εj ,
RP∗i = Xjβj + δZ + νj .
Payment choice is a Multinomial Probit (MNP) while the reward pointsis a Tobit. Estimated via Simulated Maximum Likelihood.
Extensions 21/26
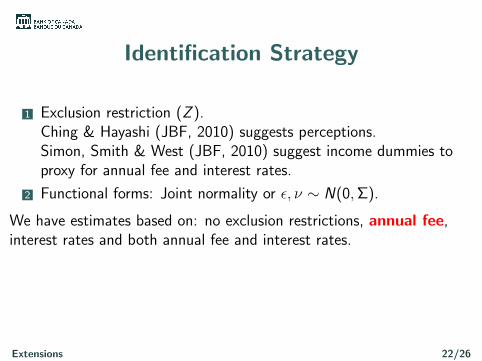
Identification Strategy
1 Exclusion restriction (Z ).Ching & Hayashi (JBF, 2010) suggests perceptions.Simon, Smith & West (JBF, 2010) suggest income dummies toproxy for annual fee and interest rates.
2 Functional forms: Joint normality or ε, ν ∼ N(0,Σ).
We have estimates based on: no exclusion restrictions, annual fee,interest rates and both annual fee and interest rates.
Extensions 22/26

Accounting for Selection: Extensive Margin of Rewards
MNP MNP-STV Cash DC CC Cash DC CC5 -0.36 -0.22 0.58 -0.24 -0.22 0.4625 -1.70 -1.69 3.40 -1.67 -1.58 3.2550 -2.50 -4.43 6.92 -3.45 -3.77 7.21100 -1.65 -8.94 10.59 -2.31 -4.44 6.74
Note: Difference in predicted probabilities evaluated at the average reward level (RP=0.78%) and
those without rewards. Multinomial Probit (MNP) and Multinomial Probit with Selection: Annual
Fee (MNP-S).
Extensions 23/26
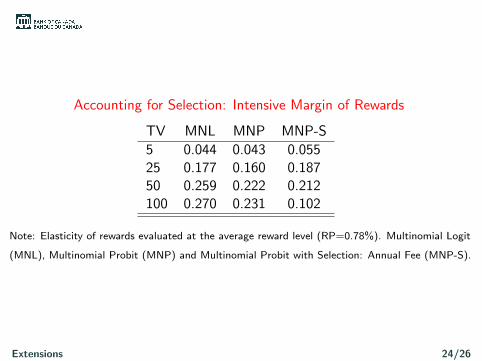
Accounting for Selection: Intensive Margin of Rewards
TV MNL MNP MNP-S
5 0.044 0.043 0.05525 0.177 0.160 0.18750 0.259 0.222 0.212100 0.270 0.231 0.102
Note: Elasticity of rewards evaluated at the average reward level (RP=0.78%). Multinomial Logit
(MNL), Multinomial Probit (MNP) and Multinomial Probit with Selection: Annual Fee (MNP-S).
Extensions 24/26
ConclusionCash is used mostly in low value transactions (below $25).
⇒ Acceptance and Ease of Use.
Increase debit and credit usage as transaction value increases.
i.e. low value note denominations.
Portfolio features play an important role in substitution patterns.
Rewards: consumers shift towards credit at the expense of debit.
Low and varying reward/fees elasticities imply the impact of priceregulation on payment behaviour and potential efficiency of pricediscrimination is not clear cut.
Later this afternoon: Chiu, Dong, & Shao “Societal Benefits ofCredit as a Means of Payments.”
Conclusion 25/26

Merci a tous!
Thanks for your time!
Conclusion 26/26