how does job-protected maternity leave affect mothers...
TRANSCRIPT
How does job-protected maternity leave affect mothers’ employment?
Michael Baker
University of Toronto and NBER Kevin Milligan
University of British Columbia and NBER
February 2008
JEL Codes: J13, J21 ABSTRACT: We examine the impact of maternity leaves on the period mothers are away from work post–
birth, and the likelihood they return to their pre-birth employer. We use the introduction and
expansion of statutory maternity leaves in Canada to identify these effects. We find that modest
mandates of 17-18 weeks do not change the amount of time mothers spend out of the labor force.
In contrast, longer leaves do have a substantive impact on behavior, leading to more time spent at
home. We also find that all the mandates examined increase job continuity with the pre-birth
employer.
We thank Pierre Brochu, Ekaterina Chmatova, and Andrea Wenham for excellent research assistance and Louise Grogan and seminar participants at the Universities of British Columbia, California at Santa Barbara, Guelph, Maryland, Toronto and at the NBER Summer Institute and the Canadian Economics Association for comments. We also gratefully acknowledge the research support of SSHRC (Baker Grant #410-020-707, Milligan Grant #410-2002-0299). Milligan wishes to thank the NBER for hosting him while parts of the paper were written. Finally, we thank the staffs of the Toronto and B.C. Research Data Centres for their technical support. This paper represents the views of the authors and does not necessarily reflect the views of Statistics Canada.
1

1. Introduction
Job-protected maternity leave mandates exist in many countries, but vary widely in
scope. In Europe, they are typically universal, long, and paid, while in the United States they are
restricted, short, and unpaid. Internationally, the recent trend in most jurisdictions is to more
generous entitlements. In the United States, many states are considering income replacement for
the leaves provided under the 1993 Family and Medical Leave Act, led by California’s Paid
Family Leave Insurance Program which initiated paid leaves of up to six weeks in 2004.1
The primary motivation for maternity leaves is to provide a period for the mother to fully
recover from giving birth and to bond with her newborn. For example, based on available
evidence the World Health Organization (2000) concludes that “women need at least 16 weeks
of absence from work after delivery” to protect the health of both mother and child. Job
protection over the leave provides mothers an opportunity to return to the pre-birth employer
achieving career continuity over the birth event. The impact of maternity leave mandates on
mothers’ labor supply is therefore central to the arguments for policy in this area.
Many additional (longer term) benefits are attributed to maternity leave. These include
longer periods of breastfeeding and lower accident rates in the child’s first year, and for mothers
better postpartum physical and mental health and improved long run labor market outcomes
(e.g., Waldfogel 1998b). While an empirical relationship between maternity leaves and these
outcomes could have a variety of sources, many argue that the key mechanism is an impact of
maternity leave on mothers’ labor market decisions.
Existing evidence of the relationship between maternity leave and labor supply is mixed.
A central empirical problem has been finding exogenous variation in leave-taking by new
1 A summary of state initiatives up to 2005 can be found in National Partnership for Women and Families (2006). Federally, the Department of Labor had a ‘baby UI’ provision from 2000-03 which allowed states to compensate maternity leaves through UI plans, although no states took advantage of this policy.
2

mothers. Many studies use variation in leave availability across employers or leave-taking by
employees. If there are unobserved differences between women with access to leaves and those
with no access, then the credibility of inferences suffers. The use of more plausibly exogenous
policy variation has been limited by the extent of maternity leave policy in the US and has
proven difficult to exploit.
Our objective in this paper is to provide new evidence of the relationship between
maternity leave and labor supply using changes in statutory leave entitlements. Our focus is
Canada, where job-protected leave mandates are under provincial rather than federal jurisdiction
for most workers. Mothers’ leave eligibility varies by time and space rather than by their choices
to match with particular employers, and is therefore less likely correlated with their unobserved
characteristics. Over our sample period we observe the introduction of modest mandates (17-18
weeks) in several provinces, followed by widespread extensions of leaves to 29-70 weeks. These
policy episodes provide an attractive basis for inference. The wide range of mandates observed
provides perspective on both short leaves prevalent in the US and the longer leaves available in
Europe. Moreover, we are able to exploit the cross-jurisdiction and through-time variation both
for mothers with new children and for control groups unlikely to be affected by maternity leave
changes. We argue that this variation provides a credible, exogenous basis for inference.
Our analysis focuses on two key questions. First, do leave mandates increase the average
length of time mothers spend at home with their newborns? Second, do leaves increase the
proportion of mothers who return to employment with the pre-birth employer?
We have three primary conclusions. First, the introduction of modest mandates increases
the proportion of mothers employed and on leave but has little effect on the length of time they
are at home with their infants. Second, in contrast to the shorter leaves, mandate extensions
significantly increase the period mothers are at home post-birth. Third, we find that maternity
3

leave mandates of all lengths studied increase job continuity with the pre-birth employer.
2. Theory
The theoretical setting in which we interpret our empirical work comes from Klerman
and Leibowitz (1997), who explore the labor supply effects of maternity leaves in a static
framework. With no mandate, employers may voluntarily offer an unpaid (or paid) maternity
leave. This is a result of private incentives to preserve good employee matches and job-specific
human capital. Females choose between this leave and severing the employment relationship to
be at home with their child for a longer period. The cost of quitting is the difference between the
current wage and the alternative wage. Females make an optimal choice given a reservation
wage that declines with each month after giving birth.
A leave mandate that exceeds the employer’s voluntary offer will lead some females who
previously would have quit their jobs to remain employed and take the mandated leave. Also,
some females who had previously taken the shorter leave offered by the employer will now take
the additional weeks allowed under the mandate. Therefore the mandate will reduce the number
of women quitting their jobs pre-birth to spend time at home, and clearly increase the number of
women who are employed and on leave over the birth event. Importantly, the model has no
definitive prediction for the average amount of time women are at home with their child, as some
females take longer leaves but others take shorter leaves.
Because our analysis focuses on labor market decisions in specific months around the
month of birth, it is useful to parse this last prediction from a monthly perspective. Women not
at home with their child are employed and at work. In months covered both by the employer’s
voluntary offer and the leave mandate (e.g., the month of birth), there should be no change in the
proportion employed and at work, as the mandate simply duplicates the pre-existing private
arrangement. In the months the mandate exceeds the voluntary offer, the proportion employed
4
and at work should fall. For example, if the voluntary offer is two months and the mandate four
months, and assuming all leaves start at the point of birth, the proportion employed and at work
should fall in months three and four. Finally, in months beyond the mandate the proportion
employed and at work may rise if the mandate encourages those who previously quit their jobs,
to take leave and return to their pre-birth employer.
3. Previous Evidence on Maternity Leaves and Labor Supply
Most previous studies of maternity leaves and the labor market are based on U.S. data.
The message of this research is mixed, but the variation of leave entitlement across mothers in
the U.S. may not be ideal for identification. Historically the provision of leave by employers was
voluntary.2 Inference from this earlier period is potentially biased by unobserved differences
between mothers who had access to maternity leave and those that didn’t. More recently leaves
have been mandated by the Family and Medical Leave Act (FMLA), but only for employers with
50 or more employees. Waldfogel (1999) estimates more than one-half of private sector workers
are uncovered. This means the law affects those most likely to have access to leave through their
large employers, and presents the possibility that females sort across firms of different sizes
based on their preferences for work around birth. Finally, the leave provided by the FMLA is
quite short: 12 weeks. It’s possible that the law simply replicates private arrangements or firm
policies already in place.
Studies of the relationship between the FMLA (or state-specific initiatives that preceded
it) and the employment status of new mothers often report no effect or estimates that are
sensitive to specification (e.g., Baum 2003b, Klerman and Leibowitz 1997, Waldfogel 1999).
An exception is Waldfogel (1999) who finds that the FMLA did increase the proportion of
2 A qualification is the Pregnancy Discrimination Act of 1979 by which firms had to treat pregnancy like an illness in their health plans.
5

women with a child aged less than one who were employed and on leave, but had no effect on
overall employment. Studies of the effect of leave on job continuity are more optimistic.
Waldfogel (1998a) and Waldfogel et al. (1999) show that females who have access to maternity
leave are more likely to return to their pre-birth employer. Baum (2003a) finds that the FMLA
increased the proportion of mothers returning to their pre-birth job, but his samples are small and
the effects vary in statistical significance and are sensitive to model specification.
Klerman and Leibowitz provide perspective on the job continuity results. Klerman and
Leibowitz (1994) show that in the pre-FMLA era the vast majority of females who work within
their child’s first year of life remain employed (although on leave) over the birth event. Klerman
and Leibowitz (1999) provide direct evidence (from the NLSY) that, pre-FMLA, 60 percent of
females working full time before the birth of their child returned to the same employer post-birth.
This high percentage leaves limited scope for leave mandates to increase job retention unless
they lead to a substantial increase in the incidence of leave.3
Studies based on European data provide more decisive inference, although many do not
directly examine the relationship between leave mandates and mothers’ labor supply. There is
evidence that access to leave increases job continuity (Waldfogel et al. 1999). Also, that leave
mandates increase the employment of females in their childbearing years (Winegarden and Bracy
1995 and Ruhm 1998). Ruhm notes the employment effects could result from 1) higher
proportions of mothers remaining employed over the birth event, 2) greater labor market
participation of childless females to qualify for leave benefits when they have kids, and/or 3)
new mothers returning to work sooner. Determining which of these hypotheses holds is critical
for understanding the long term impact of leaves on children and mothers.
Phipps, Burton, and Lethbridge document the extent of the family gap in Canada, finding
3 Significantly, Baum (2003a) reports no effect of the FMLA and state specific mandates on the incidence of leave.
6

that work history cannot fully explain the gap in earnings between mothers and non-mothers. ten
Cate (2000 and 2003) studies the effect of the same Canadian leave mandates studied in our
paper, but focuses only on employment rates over a broad post-birth period. She reports the
mandates increased the relative employment rate of females with children aged 0-2, and
increased the probability of returning to work within two years of birth.4 Our data, in contrast,
allow us to focus on labor market attachment in the months around birth, providing deeper and
richer evidence on the link to maternity leave policy.
4. Maternity Leave Mandates in Canada
Maternity leave, defined as a right to return to a pre-birth job after a specified period, is
established by provincial labor standards legislation. British Columbia was the leader,
prohibiting the employment of women for 6 weeks following childbirth through the Maternity
Protection Act of 1921. New Brunswick was next to act in the 1960s, and the last province to
introduce a mandate was Prince Edward Island in 1982. There is also federal legislation,
covering those in industries regulated by the federal government. Importantly, the federal
standards do not represent a ‘floor’ for provincial standards, since federally and provincially
regulated industries are mutually exclusive.
The legislation has several common features across provinces. First, employees are
protected from dismissal due to pregnancy. Second, a maximum period for the leave is always
prescribed and the leave is specified as unpaid. Initially the laws of several provinces provided
guidance to how the period of leave should be split pre- and post-birth, but current practice is to
leave this to the discretion of the mother and employer. Third, the laws specify a minimum
period of employment for eligibility. This varies widely: initially 52 weeks of employment was
4 Phipps (2000) looks at the incentive effects of paid maternity leave through the unemployment insurance system on fertility and hours worked, finding no evidence of changed behavior. For this paper, we operate under the assumption that fertility is unchanged by the leave provisions.
7

common, although British Columbia effectively had no requirement. The recent trend is to
shorter qualification periods. Fourth, most laws specify which terms of employment are
preserved during the leave and any responsibility of the employer to maintain benefits. Finally,
the laws of some provinces establish rules for extending leaves due to medical complications or
pregnancies that continue after term.
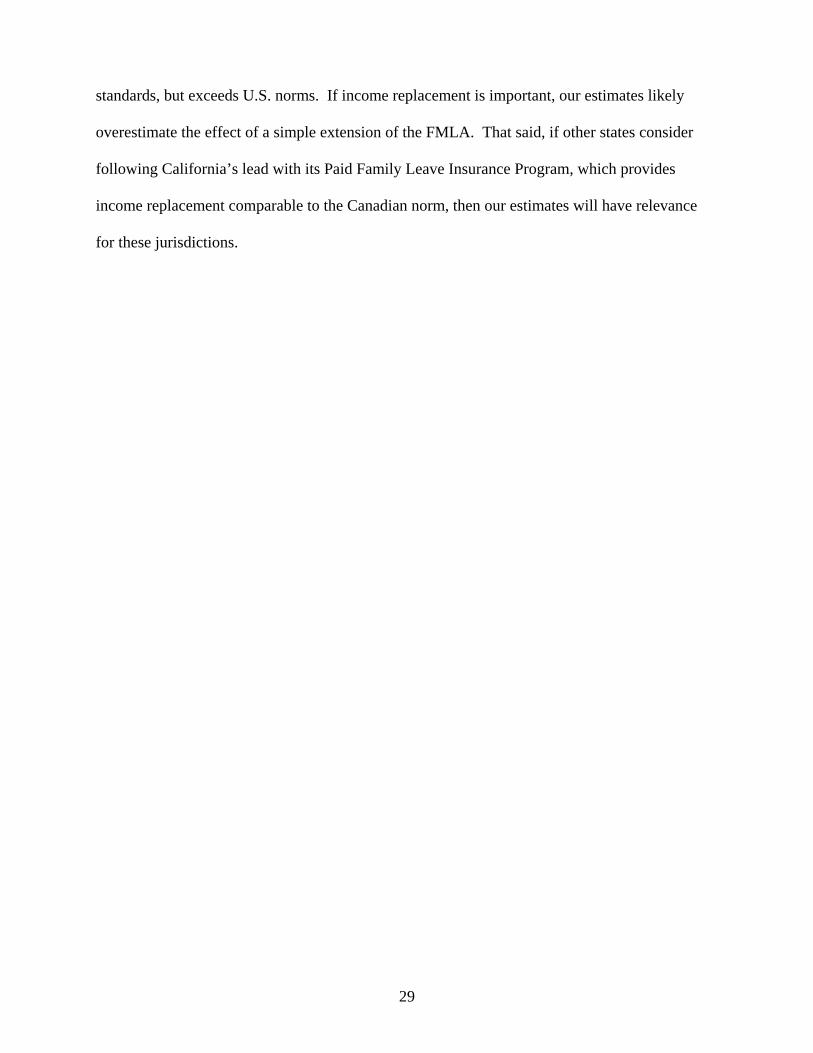
The maximum leave provisions of the federal jurisdiction and the provinces in the years
1963 through 2002 are listed in Table 1. In the 1960s, 1970s and early 1980s, the provinces
introduced mandates at different points in time. By the mid 1980s all provinces mandated 17 or
18 weeks of leave.5 The next major innovation was in 1990/91 following a change in the
treatment of maternity leave under the federal Unemployment Insurance Act. Eight of ten
provinces increased their mandates to between 29 and 52 weeks, six of them moving within a six
month period. This change was actually the introduction of a parental leave of between 12 and
34 weeks in addition to the existing maternity leave. In most provinces the additional leave
could be taken by either the father or mother, although in practice the vast majority of these
leaves are taken by the mother.6 The final reform is the extension of parental leave at the end of
2000, which brought the total amount of leave available in all provinces to at least 52 weeks.
Again this change was induced by a reform of the (now renamed) Employment Insurance (EI)
Act, and seven of ten provinces changed their mandates simultaneously. Quebec had already
extended its mandate in excess of one year in 1997, while British Columbia and Saskatchewan
did not change their mandates until early 2001. Note that the early reforms are staggered 5 It is possible that this policy variation followed the entry of women into the labor market in different provinces; that the policy change was endogenous. Many of our inferences depend on sharp, discontinuous changes in policies that are unlikely to be confounded by the more continuous changes in social trends. Beyond that, we have conducted analysis of the policy changes, finding that the female employment to population ratio does not systematically predict policy one to three years ahead. Furthermore, we have run our regressions with controls for other aspects of the work environment (unionization rates) and political environment (elections and party in power changes) and found that the inclusion of these regressors had little impact on our maternity leave variables. 6 Most provincial laws stipulate that the parental leave must be completed within a set period post-birth (e.g., 52 weeks) and must be taken immediately following any maternity leave.
8
through time, while the later reforms are clustered in short time-spans. We accommodate these
different patterns of variation in our analysis.
Maternity leave replacement income is available to some mothers through the EI system.
EI provides protection for “earnings interruptions” from a variety of sources. Starting in 1971,
the eligible sources were expanded to include interruptions due to birth. Women who qualified
and took the maximum leave entitlement could receive benefits replacing 50 to 55 percent of
weekly wages up to a cap set roughly at the average wage.7 Unlike the provincial leave
mandates, the EI provisions do not provide (or require) a right of return to pre-leave
employment, or base eligibility on a qualifying period of employment with a single employer.
Therefore, females planning to leave the labor force can collect EI benefits, and it is possible to
qualify for leave under provincial standards but fail to qualify for EI benefits, and vice versa. In
National Longitudinal Survey of Children and Youth data for 1994-2002, roughly 40 percent of
mothers with children aged 3-11 months reported EI income in the previous calendar year.8
5. The Data
Our analysis of mothers’ labor supply is based on data from the master files of the Labour
Force Survey (LFS). The LFS is a monthly survey designed to provide timely information on
Canadians’ labor market activity. The data are collected at the individual level, but it is possible
to aggregate individuals into families, and associate families with physical dwellings. The survey
has a rotating panel design. Individuals belong to a rotation group that is interviewed for six
consecutive months. The entrance of rotation groups is staggered so that in any month six
7 Initially, qualification for benefits required 20 weeks employment in the previous year with earnings greater than 20 percent of maximum weekly insurable earnings in each week, but since 1996 qualification has been based on hours of work. Also, in the 1970s the “magic 10” rule restricted benefits to individuals who could show that 10 of the 20 insurable weeks were from the 20 week period between the 31st and 50th weeks before the expected date of birth. This rule, eliminated in 1984, denied benefits to females who entered the labor force after conception. 8 The rate for children under 3 months is lower (25%) but this may be due to the fact that the birth occurred between the last calendar year and the survey date.
9
groups are interviewed, with one group entering and another group leaving. The survey covers
individuals living in the ten provinces, excluding those on Indian Reserves, full-time members of
the Armed Forces and inmates of institutions. Information is collected on current labor market
status, demographics, job search activities and job characteristics. The microdata are available
starting in January 1976. Compared to the NLSY commonly used to study maternity leave in the
US, our data offers the advantages of larger samples, longer time periods, more cohorts, and
more precise labor market data.
We create two samples from these data. The first sample takes advantage of the panel
structure of the survey to identify females who experience a birth and to examine their labor
market activity in the surrounding period. All adult records include variables reporting the
number of own children living at home by the single ages 0 through 24. We identify births
through increments in the number of own children less than one year of age between the first and
second, second and third,…, fifth and sixth months of a rotation.9 The month this variable
changes is denoted the “month of birth” (MOB). Assuming a uniform distribution of births
within a given month, the survey information for the month of birth is collected when the
newborn is two weeks old on average. Depending on when the birth occurs we can observe
labor market status up to four months preceding or following the birth. For example, if the birth
occurs between the first and second month of the rotation, we observe labor market activity in
the month before the MOB and in the four months following. If the birth occurs between the
fifth and sixth months, we observe up to four months before the MOB, but no months following.
With the relationship between the current month and the MOB now identified for each
9 Prior to 1996, the ages of children in the family were recorded only once, in the first month of the rotation. Starting in 1996, the ages of all children were updated every month. So, the number of children under age one could change either because a new child was born or because an existing child had his or her first birthday and was no longer under age one. We take care to distinguish the positive and negative increments in children age one so that we can accurately identify births.
10
female giving birth, we form sub-samples with monthly observations on labor supply for
particular months over the birth event. For example, one sub-sample contains monthly
observations for the MOB, while another contains the observations for one month after birth.
Because births occurring in a given calendar month will come from different rotation groups,
women observed in a given calendar month will be captured at different points in the rotation.
This means we capture pre- and post-birth labor supply for subsets of the mothers having births
in any given calendar month. For example, we observe labor market status three months prior to
birth for only a subset of the women who give birth in, say, March 1985. This is because some
of these mothers entered the survey in February (or January), one (two) month(s) prior to birth.
The second sample we create is a time series of cross sections (TSCS). We draw
observations from the April and October surveys of each year.10 Our target group is females
with a child aged less than one. The advantages of this sample are that we have much larger
sample sizes and that we capture women up to 12 months past the birth month, providing a
broader view of any changes in leave incidence and time spent at home.
We focus on “married” (married or cohabitating) adult (aged 20-39) females. This choice
is made to isolate the group of mothers who are economically independent of their parents and
more likely to reside in a household with sufficient economic resources to respond to changes in
leave mandates. Some partial results indicate unmarried mothers respond differently to leave
mandates, but the number of these women is too small in our data to conduct a full analysis. The
restriction to married women is less important for Canada than it might be for the US, as single
motherhood is rarer. The exclusion of births to teenage mothers is based on the fact that this
group often has stronger family ties, and so may make different decisions than older females
10 The choice of months 6 months apart ensures no rotation group appears twice in the data. The results are not sensitive to the choice of these particular months.
11
whom we expect are more independent.11 Again sample sizes are too small to allow a separate
analysis of teenagers. Still, we are able to capture a substantial proportion of births—births to
women aged 20-39 rose from 87% to 93% of all births (Statistics Canada 2006). Overall, we
estimate that our sample selection captures over 85% of births throughout much of the sample
period.12
6. Empirical Framework
We use a variety of empirical strategies to accommodate the different types of mandate
variation we observe over the sample period (see Table 1). We begin with the introduction of the
short mandates using data from January 1976 through to October 1990.13 The base estimating
equation, for either our panel-based or TSCS samples, is
iptiptptipt XWKSLVy εβα ++⋅= (1)
where i indexes individuals, p provinces and t months. WKSLV is weeks of mandated job-
protected maternity leave. This equation is estimated by ordinary least-squares (OLS). Standard
errors are corrected for heteroskedasticity and clustered on province. Bertrand, Duflo, and
Mullainathan (2004) show that clustering on the cross sectional unit improves inferences in the
presence of serial correlation within-unit (i.e., province) that may arise on our context.14
For the panel-based sample we code the WKSLV variable using the statute in effect in the
month preceding the MOB. For the TSCS sample we experiment coding WKSLV either using
11 Both teen pregnancy and live births to teens in Canada are less than half the corresponding US levels (Dryburgh 2000). 12 Direct estimates from the National Longitudinal Study of Children and Youth indicate married females aged 20-39 represented 86.3 percent of all births in the years 1994-2002. 13 This captures the introduction of 17-18 week mandates in Alberta, Newfoundland, Prince Edward Island and Quebec and the mandate extensions from 12 to 18 weeks in British Columbia and New Brunswick. 14 Hansen (2007) treats the same problem. He reports that this method produces tests of approximately correct size, but of less power than tests based on feasible GLS. The standard errors calculated with province clustering are mostly marginally larger than the estimates calculated clustering on province/year. This might be expected, as estimates of the 1st, 2nd and 3rd order autocorrelations, making approximate adjustment for the fixed effects bias (Solon 1984), are generally quite small. Cases in which the estimated standard errors are smaller than those clustering on province/year are noted as they arise in the text.
12

the statute effective in the current month or a lagged statute. Since our sample is mothers with
children aged less than one, the current statute will only be “correct” for those who gave birth
very recently.15 By lagging the statute we ensure correct coding for mothers with less recent
births to discover if our results are sensitive on this margin.
Our dependent variables are 0/1 indicators that the individual is “employed and at work”
or “employed and on leave”. For our panel-based data we define these variables for the MOB
and for the first and second months preceding, and first through third months following, the
MOB.16 In our TSCS data they are defined for the month of observation, and record labor
market status over the one year period following the date of birth.
For the panel-based data we also create indicators of pre/post-birth job continuity. First are
0/1 indicators that the individual left a job, or left a job for personal reasons, in the 12 months
preceding the MOB. Second is a 0/1 indicator that the individual is employed in the third month
following the MOB and has job tenure of three months or longer. This variable is intended to
capture the proportion of mothers who are employed post-birth with their pre-birth employer.
This interpretation is problematic if individuals who quit their jobs pre-birth, but eventually
return to their pre-birth employer, report their tenure post-birth as starting at the time of return to
their job. In the appendix we investigate this issue and present evidence that individuals interpret
the tenure question to ask when they initially started work with their current employer, not when
the current employment period with the employer started. More detail on dependent and
explanatory variables is also provided in the appendix.
We also investigate the introduction of parental leave in 1990-92, and the extension of
parental leave in 2000-2001. In Table 2 we present the dates of these reforms by province.
15 If the mandate has not changed recently, the coding will also be correct for mothers with less recent births. 16 While we can also construct a measure of employment for the fourth month following birth, many of the province/year cells for this variable are empty over the period that the mandates were introduced (1976-1982).
13
Because in both cases many provinces moved almost simultaneously, a conventional cross-
section time-series identification strategy is not effective. We therefore use a framework that
compares variables of interest immediately before and after the reforms were implemented, using
a variety of strategies to control for secular trends.
The estimating equation is
iptiptptipt XPOSTy εβα ++⋅= (2)
where POST is a 0/1 indicator that the province’s leave mandate has been extended. It captures
the average effect of these mandate extensions. The dependent variables are the same as in (1)
with the addition of employment status captured in the fourth month following the MOB. The
additional explanatory variables are the same as in (1) with the exception of the year effects.
Because there is little temporal variation in POST across provinces, year effects will absorb all
the variation in the dependent variable attributable to the mandate reforms. To address this
problem we exclude any controls for time but limit the data to the period immediately
surrounding the reforms. For the 1990 introduction of parental leave we use the samples January
1990 through December 1991 and July 1989 through December 1992. For the 2000 extension of
parental leave we use the samples January 2000 through December 2001 and July 1999 through
December 2002. We also estimate (2) adding married males or married childless females as
additional controls for secular trends.17
We have four different strategies to investigate the robustness of our results. First, for all
the reforms we compare results across samples alternatively removing workers regulated by the
federal government (and therefore not affected by provincial mandates) and removing women
who have not in paid employment over the previous 12 months (and therefore not eligible for
17 In this case we calculate the standard errors correcting for heteroskedasticity and random effects at the province/year level. Given we are using a very short period of data from immediately before and after the change in the mandate we do not expect serial correlation to be an issue.
14

maternity leave entitlement).18 In both cases, we expect the results in these restricted samples to
be stronger as measurement error in assigning the policy variable should be less.19 Second, we
also use control groups unlikely to be affected by the maternity leave reforms—married men and
married childless women. We include these two control groups (one at a time) through a triple-
difference model, which includes the full set of two-way interactions (province by year, province
by new mother, year by new mother). We then include the number of mandated weeks of leave
(which varies by province-year) as well as the interaction of this variable with an indicator for
being a new mother, and expect to see a differential impact on the interaction term. This
specification allows us to see if the main results are simply picking up general labor market
conditions that vary by province-year cell. Third, for the 1976-1990 reforms we include
province-specific linear trends in order to control for trend differences in the dependent variable
across provinces. Fourth, for the 1990-92 and 2000/01 reforms we try falsification regressions;
looking for policy effects at dates when there should be none in both the panel and time series
cross section data.
7. The Results
We now turn to the results. We begin in Figure 1 with a simple graphical analysis of the
proportions of married or cohabitating females with a child aged less than one who are
employed, employed and on leave and employed and at work over the three reform periods.
Overall employment displays the well known positive trend over the period. Its components,
18 The federal sector covers federal public administration and industries such as banking, and some parts of the transportation and communication industries. Workers in this sector represent four to five percent of employment at the aggregate level. Industrial codes in the LFS (4-digit NAICS) do not allow us to uniquely identify these workers. Therefore, we delete all individuals who, as of the MOB, had current or previous (last 12 months) employment in a 4-digit industry that contained federal workers. 19 This raises the question of why those potentially not affected by the reforms are included in our main sample at all. Including the broadest possible sample allows for and measures reactions to policy such as substitution between sectors and into and out of the work force. Furthermore, our methods of identifying federal workers or mothers not eligible for maternity leave are approximations.
15
however, display very different patterns. The vertical lines mark the times of the 1990-92 and
2000/01 reforms. Each is associated with an increase in the proportion of mothers on leave and
decrease in the proportion at work; most dramatically the reform in 2000. This provides some
prima facie evidence of a relationship between leaves and the time mothers stay at home after
birth.
In the rest of this section, we present some descriptive statistics on our labor supply
variables. We then analyze each of the three policy periods separately, beginning with the
introduction of short mandates from 1976-1990, moving to the expansion to long mandates
around 1990, and finally the further expansion to one year in 2001.
Because the “master files” of the LFS (which we use) are considered confidential by
Statistics Canada, we cannot provide exact sample counts until a ‘final’ version of the paper is
prepared.20 As a result observation counts are currently suppressed in all tables. As general
guidance, the panel data sets range from about 800 (for labor supply four months post-MOB for
the 1990-92 extension analysis) to 23,000 observations (for labor supply in the MOB for 1976-
1990 sample). On average we observe about 1650 births per year. Our time series cross section
samples range from about 6,000 to 60,000+ observations, the smallest for the 2000/01 extension
and the largest for the 1976-1990 period.
Descriptive Statistics for Dependent Variables
In Table 3 we present descriptive statistics of the labor supply variables from the panel-
based sample for the period 1976-2003. The proportion of mothers employed and on leave peaks
in the MOB at 42 percent, and then declines to 27 percent by the fourth month following. The
proportion employed and at work is very low in the MOB and two months following, at ten
20 Sample sizes can be released one time only, in order to guard against residual disclosure. Therefore, we have been advised not to report any exact sample sizes until all revisions are complete and a final version of the analysis is chosen.
16
percent or less. The complement of being employed and at work is being at home—whether it
be not in the labor force, unemployed or employed on leave. So, changes in the number of
women employed and at work are critical for the mandates to achieve more than mere re-labeling
of time away from work.
In the second panel we present some measures of job continuity. While in the regression
analysis we use unconditional measures, here we present the proportion of mothers working
three or four months after the MOB with tenure greater than three or four months conditional on
employment. Among those employed at 3 months, 93 percent have tenure greater than 3 months.
For four months, 89 percent have tenure greater than the time since birth. Viewed this way,
Klerman and Leibowitz’s (1994, 1999) point is clear—the vast majority of mothers working at
this time have returned to their pre-birth employer.
The Introduction of Mandated Leave: the 1976-1990 Sample
While equation (1) compares provinces changing their mandates to all other provinces, in
Figure 2 we present an Ontario/Quebec comparison to motivate our identification strategy. These
adjacent provinces are of similar size and economic structure. We focus on the month before
birth, because in the months other than the MOB the mandate is less likely to duplicate private
arrangements. The statistic reported is the (annual) proportion of mothers on leave. Ontario has
a mandate of 17 weeks throughout the sample period while Quebec introduces a mandate of 18
weeks in 1978 (indicated by the vertical line). Prior to the Quebec reform the proportions in the
two provinces are very similar. Starting the year of the reform, the proportion in Quebec begins
a steeper trajectory and a substantial Quebec/Ontario gap emerges.
We now turn to our regression results for the all-province 1976-1990 panel-based sample.
In the first panel of Table 4 we present estimates of the effect of WKSLV on the proportion
employed and on leave in the months surrounding birth. Each cell in the table reports the results
17

from a separate regression. Guided by the 1985 Maternity Leave Survey we focus on the period
two months before the MOB through three months following.21 Across the six columns of the
table are several different specifications investigating the robustness of the results.
The first column results indicate some statistically significant impacts in the months
preceding the MOB—although as the succeeding columns reveal the result for 2 months before
the MOB does not turn out to be robust. The estimates for the MOB and the three months
following are small and statistically insignificant. However, the second column shows that a
richer specification that allows for provincial trends reverses these results. There are strong
secular trends in mothers’ labor supply over the period (Figure 1), and some part of it likely has a
provincial characteristic. The estimate in the second month preceding the MOB is now small
and statistically insignificant, but we now see statistically significant effects in all the other
months surrounding birth.
To assess the economic significance of the estimates we compare them to averages of the
dependent variables in the provinces that introduced mandates, over the years there was no
mandate in place.22 In the MOB, the estimate of 0.0031 per week implies that an 18 week
mandate leads to a 5.5 percentage point increase (0.0031*18) in this proportion. That is, a
province moving from 0 weeks to 18 weeks could expect an increase in employed and on leave
of 5.5 percentage points; an increase of 31 percent compared to a pre-reform base of 18 percent.
For the third month following birth the effect is a very large nine percentage points off a base of
six percent.
In the third and fourth column we implement our robustness checks by deleting federal
21 In this survey, which was conducted after leave mandates were enacted in all provinces, maternity leaves started six weeks before birth on average; four weeks at the median. In addition, newborns in the month of birth will be two weeks old, on average. The Maternity Leave Survey was an addendum to the February 1985 LFS, investigating the circumstances of maternity leaves among females whose last absence from work or last two absences (of two weeks or more) from work included one due to pregnancy. 22 We use 1976-June 1978 data for Newfoundland, PEI and Quebec, and 1976 data for Alberta.
18
sector workers and those without recent work. The resulting estimates without the federal sector
in column three are marginally larger than in column 2, although the differences are not
statistically significant. For the results focusing only on those with paid employment previous to
the birth, the magnitudes of the estimated coefficients are uniformly larger. The coefficients for
the months following the MOB suggest that an 18 week mandate raises the proportion of these
mothers on leave between 10 and 14 percentage points, which is strongly economically
significant. As noted above this is what we would expect if those eligible for maternity leave
benefits are more accurately identified in these restricted samples.
As a final robustness check, we estimate triple-difference models, which include an
identifiable group in the same province-year cell as the new mothers, but who we expect to
experience little impact from the reforms. The reported coefficients are for the differential effect
of the leave mandates on new mothers, relative to the control group. If the mandates had no
independent effect on these control groups we would expect the results to be similar to those in
column 2. This is exactly what we find when adding married males (column 5) as the control
group, and to a lesser extent when adding childless married females as the control group in the
last column. Certainly these experiments do not overturn our original inference.
The second panel of Table 4 contains results for the proportion employed and at work.
Here, the full sample of mothers (that is, not conditional on work in the past 12 months) is of
particular interest, because we wish to discover whether the mandates increase time spent at
home. The specifications and samples vary across columns as in the upper panel. The estimates
provide little evidence that the mandates decreased work in the period surrounding birth, as most
are small and statistically insignificant. The exception is when we restrict the sample to mothers
with recent (paid) employment. Here, some of the estimates approach economic, although not
statistical, significance. There are also some positive and significant estimates in the second
19
month preceding the MOB, but statistical significance in this case is sensitive to the method for
calculating the standard errors.23
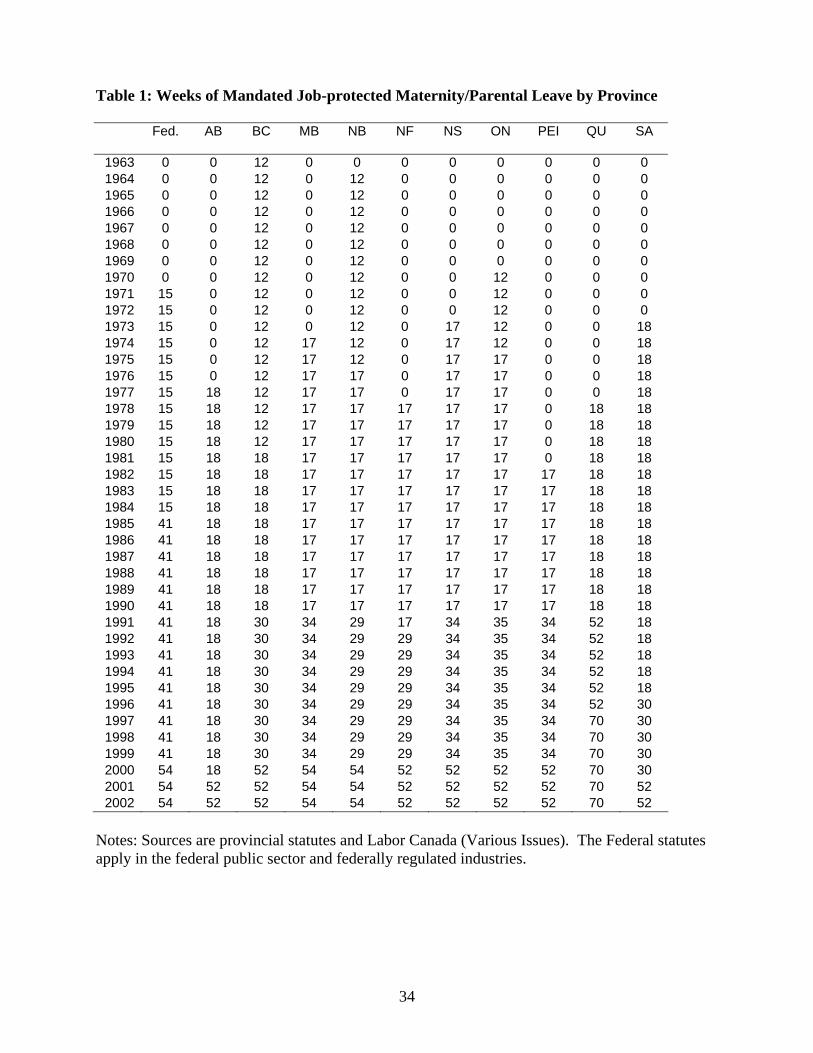
In Table 5 we present estimates of the effect of the mandates on job continuity. The
dependent variable in the first row is the proportion of females employed in the third month after
birth with current tenure greater than three months. This measures the women who are still
employed by their pre-birth employer. Conditional on province-specific trends, the estimates for
WKSLV are all positive and mostly statistically significant. In the second column, an 18 week
mandate is estimated to raise the proportion by about 6 percentage points off a pre-mandate base
of 21 percent. We note this is a second case where the inference is sensitive to the method of
calculating standard errors. For example, clustering on province/year yields estimates that are at
most marginally statistically significant.
There is a consistent statistically significant negative effect on the proportion leaving a
job within the 12 months preceding birth, and it is driven by exits for personal or family reasons.
This seems to correspond well with a maternity leave interpretation. In the second column, an 18
week mandate lowers the proportion by roughly 5.5 percentage points (off a pre-mandate base of
35 percent). This estimate roughly matches both the increase in the proportion of these women
employed at 3 months after the MOB with their pre-birth employer, and the increase in the
proportion employed and on leave for this specification from the first panel. The estimated
change is ten percentage points for the sample who worked in the 12 months preceding birth,
which is perhaps the more appropriate sample since those who were not working have no job to
leave.
In Table 6 we present estimates from the TSCS sample. This exercise cross-validates our
23 In this case, clustering on province produces substantially smaller standard errors than clustering on province/year.
20

panel inference and provides better perspective on the average amount of time mothers are at
home with their infants. Because the sample contains all mothers up to a year post-birth, it
captures both those who might take longer leaves as a result of the mandate, and those who
might take shorter leaves.
The results are consistent with the estimates from the panel data. First, there is evidence
of an effect on the proportion of mothers employed and on leave: the 0.0014 coefficient in
column 2 implies that an 18 week mandate raises the proportion 2.5 percentage points. Second,
estimates for the proportion employed and at work are mostly small and uniformly statistically
insignificant. This indicates no change on average in the period mothers are at home in the first
year. Third, we obtain larger estimates for employed on leave in the restricted sample of those
with recent work. We present results coding WKSLV to current and three month lagged
mandates, the latter matching the mandate to mothers with three month old children. The
estimates are not sensitive on this margin.
These results provide strong and robust evidence that the introduction and initial
expansions of leave mandates in the 1970s and 1980s led to increased leave taking. However,
we find no consistent evidence that women switched to leaves from being employed and at work.
Instead, the evidence suggests that women staying at home with their child switched from
leaving their jobs to taking leave. Importantly, this finding provides no basis to expect any
consequent change in the infants’ or the mothers’ health, since time at home does not change.
We also find a sharp decrease in job separations, which is accompanied by an increase in
retention of the pre-birth job. This indicates that the introduction of leave may help females
preserve job specific human capital over the birth event.
An Extension of Mandated Leave: the 1990 Introduction of Parental Leave
The introduction of parental leave starting in 1990 extended the amount of job-protected
21

leave available to new mothers from 17-18 weeks to 29-52 weeks. To motivate our results, in
Figures 3 and 4 we present semi-annual estimates of the proportion of mothers employed and on
leave in the provinces of British Columbia, New Brunswick, Prince Edward Island and Quebec
between 1985 and 1996. These four provinces introduced parental leave over the first six
months of 1991, which is indicated by a vertical line in each graph. While there is a definite
upward trend in the proportion employed and on leave in the MOB (Figure 3) over the period,
there is at best subtle evidence of a break in the first half of 1991. In contrast, the graph for the
fourth month following the MOB (Figure 4) displays an obvious upward shift starting in 1991.
To study the extension of leave, we employ equation (2) first using our panel-based
sample. We try different time windows to check the sensitivity of results. In the first two panels
of Table 7 we report estimates of POST for the proportions employed and on leave and at work.
Given the results in Table 4, we focus on months in which mandated leave was most likely
unavailable before the extension in order to save space: three and four months following the
MOB. (Estimates for months preceding the MOB, a time when an effect is also possible, are
uniformly statistically insignificant.) The results in the first column are from data for 1990 and
1991. There is strong evidence of an increase in leave and—in stark contrast to the results for
short leave mandates—an offsetting decrease in work at four months after birth. The estimates
indicate offsetting changes of more than ten percentage points. This suggests a substantive
change in behavior rather than a simple re-labeling of time off work from not employed to on
leave. The extension of the mandate increased the time spent away from work.
In the next column the sample is July 1989 through December 1992. This bigger time
window picks up the reform in Newfoundland and provides longer periods to establish the pre-
and post-reform levels. There are significant increases in leave in both the third and fourth
months following birth and offsetting decreases in work. There is also a very modest decrease in
22
work in the MOB.
Comparing the results to averages of the dependent variables in all provinces in the
period just before the reform (July 1989-October 1990), the 15.6 percentage point increase in
leave in the fourth month following birth (column 2) is off a pre-reform base of 21 percent. The
12.6 percentage point decrease in the proportion at work is off a base of 30 percent. These are
large effects, indicating a large increase in the proportion of women at home with their children.
In the third column we check for spurious inference using a falsification exercise. Using
data from July 1986 through 1989 we code the changes in the provincial mandates as if they
occurred three years earlier than the date of the true enactment. We therefore expect the
estimates of POST from this sample to be zero, and so this falsification exercise will provide
evidence of the sensitivity of the identification strategy to secular trends. As expected, the
estimates are almost uniformly small and statistically insignificant, the exception being some
effect in the second month before the MOB. The next two columns contain results for our
restricted samples deleting federal workers or women who have not worked in the past year.
Consistent with the analysis of the previous reforms the point estimates for the third and fourth
months following the MOB from the sample of mothers with recent works tends to be larger.
The final two columns contain the triple-difference results. Again the estimates support our
original inference although the effect is larger using childless females as a control group..
In the final panel of Table 7 are the results for job continuity. They indicate a significant
increase in the proportion of mothers employed with their pre-birth employer in the fourth month
following birth. The nine percentage point increase in column 2 for being employed at MOB+4
with the pre-birth employer can be compared to a pre-reform base of 41 percent. In contrast there
is little evidence of an increase in job continuity at the third month post-birth. This might be
expected because the mandates in place prior to the 1990 reforms provided up to 18 weeks of
23

leave. This would extend to three months post-birth for women who initiated leave just prior to
birth. Finally, there is a modest decrease in the proportion leaving a job in the 12 months
preceding the MOB for family reasons, which is marginally statistically significant in some
specifications. Note that the estimates from our falsification exercise (1986-1989) are
statistically insignificant (although not for job departures) and the estimates from the sample of
mothers with recent work are generally larger as expected. The triple difference estimates are
very similar to the base inference, with the exceptions that the estimate for employment with the
pre-birth employer in the fourth month and left last job are smaller and statistically insignificant
when using childless females.
According to the theory discussed earlier, the expected source of increased job continuity
is females taking the mandated leave and remaining with their pre-birth employers instead of
quitting their jobs and staying out of the labor market. However, the overall change in
employment (netting employed at work against employed and on leave) for MOB+4 in the
second column of Table 7 is only (15.6-12.6) 3 percentage points, while the increase in those
returning to the pre-birth employer after four months in the second column of Table 8 is over 9
percentage points, leaving a mysterious 6 point gap.
To investigate this, we created a binary indicator for the extension of leave and regressed
an employment indicator for the MOB+4 month on the leave indicator, along with control
variables. The coefficient on the leave indicator is reported in the first row of Table 8—it is
0.0299 for the full sample. We then run the same regression on subsamples defined by the
length of job tenure. First is for those with tenure greater than 4 months, which means the
mothers returned to the pre-birth employer. The estimate of 9.11 percentage points recreates the
6 point gap outlined above (9.11-2.99).
The remainder of the table resolves the mystery. The estimates indicate a strong shift
24

away from tenures 2 to 4 months, meaning that some women who previously were returning to
work with other employers now return to the pre-birth employer. Such a shift might occur if
these mothers preferred a gradual return to the labor market after birth to immediate full time
employment, but could not negotiate this arrangement with their old employer. The extension of
parental leave allows them to put off full time employment to a more acceptable time. To check
this story, in the last row of Table 8 we report that the change in part-time work at tenures less
than 5 months is -3.9 percentage points, or about two thirds of the total change in employment at
short tenures. So, a sizeable proportion of the increase in job continuity comes from women who
otherwise would have discarded their previous employment match to take part-time employment
when their child was quite young.
In Table 9 we turn to the results using the TSCS sample. In addition to confirming the
results seen in Table 7, these TSCS results provide a basis for comparison with the results below
from the 2000 extension for which only the TSCS sample can be used. We only present results
using the leave mandate in the current month, but the results using a six month lag are very
similar. There is consistent evidence of a three or four percentage point increase in the
proportion employed and on leave, and corresponding decline in the proportion employed and at
work. Note that the estimated impact on work is smaller in the triple difference specification.
Baker and Milligan (2005; Figure 5) argue this is due to larger impacts of the 1990 recession on
the employment of males and childless females that net out the reduction in work of the mothers.
Overall, if the mandate extension led some women to spend less time at home, this effect is more
than offset at the average by women who increased their time at home.24
24 As a further check on inference we have re-estimated our models for both the panel-based and TSCS samples using another identification strategy. We add a polynomial in time to equation (2) and expand the sample to 1988-1994. This is like a regression discontinuity design in which all effects of time, except the mandate reforms, are assumed to be smooth functions. For the panel-based data these estimated effects are very similar for the fourth month following the MOB, but generally smaller for other months. For the TSCS data the results indicate a two to
25

To summarize these results for the 1990 extension, we find a large response in being
employed and on leave in the 3rd and 4th months after birth, which is mostly offset by a
corresponding decrease in being employed and at work. This suggests that the extension of the
mandate led to more time available for new mothers to spend with their children, and therefore
provides a basis for an impact on children’s wellbeing. For job continuity, we find a moderate
increase in women returning to their pre-birth employer, split between women who pre-extension
would have exited the labor force and those who otherwise would have taken new, mostly part-
time employment when their child was young.
An Extension of Mandated Leave: the 2000 Extension of Parental Leave
Our final evidence comes from the extension of parental leave at the end of 2000 to one
year in all provinces except Quebec, where leave had been extended to 70 weeks in 1997. The
impact of this reform is clear in Figure 1. In 2001 we see a dramatic, discontinuous increase in
the proportion of mothers with a child aged less than one who are employed and on leave, and an
offsetting decrease in the proportion employed and at work.
The extension of leave from roughly six to twelve months in most provinces is outside
the span of observation of our panel-based data, which only extend to four months after the
MOB. We therefore focus on our TSCS sample. We code the policy variable in two ways: with
the current mandate from the month of the observation or with a 9 month lag. Since mothers
observed in early 2001 with a child less than 12 months old were not eligible for the full year of
leave, using the current mandate introduces measurement error. However, since in this sample
we do not always know the month of birth, it is not possible to assign the correct mandate with
complete accuracy for any 2001 observation. So, we show the results with two different
three percentage point increase in the proportion on leave, and a modestly smaller decrease in the proportion at work. In either case the results are very robust to specification of the time effects as linear, a quadratic or a cubic. These results are available from the authors on request.
26

assignments to check sensitivity.
The estimates appear in Table 10. The first panel are the results using the current
mandate. Using the narrow 2000-2001 window, we find a strongly significant 4.35 percentage
point increase in being employed and on leave. This is more than offset by the 5.38 point
decrease in being employed and at work. To gauge the magnitude of these changes, consider
that the mean rate of leave-taking in provinces outside Quebec between July 1999 and November
2000 was 31 percent. Using the wider 1999-2002 window we find coefficients roughly double
the first column. The second panel contains the results using the lagged mandates. These results
are more stable across the two time windows, showing similar magnitudes to the second column
of the first panel. The third column reports the falsification results, with a reform falsely coded in
1998. The near-zero estimates suggest that our strategy does not pick up spurious results in the
1997-1999 window, which lends confidence to our inferences. The estimates in the final four
columns are for our restricted samples and triple difference specifications. We see the now
common pattern of larger estimates for the mothers with recent work, and estimates similar to
our base results in the other cases.
Since the extension is to one year of leave and the TSCS sample is mothers with a child
aged less than one, these results cannot establish whether time spent at home post-birth went up
on average. Mothers who before the extension quit their jobs and stayed at home more than one
year may now take a shorter leave. We have re-estimated our models, however, for the sample
of women whose youngest child is aged one and find no effect of the extension on the labor
supply of this group.25 Therefore, it appears the number of mothers shortening their time at
home is negligible. This suggests that, like the 1990 reform, the 2000 mandate extension led to
more time for mothers at home with their young children.
25 The estimates are very small, statistically insignificant and available on request.
27

9. Conclusions
We investigate the relationship between mandated job-protected maternity leave and the
labor force behavior of mothers with newborns. The analysis reveals that mandates can increase
the time mothers spend at home with their infants and the likelihood they return to their pre-birth
employer. Importantly, the increase in the time at home post-birth is a result of the longer
mandates that we analyze. No effect is found for the shorter mandates (17-18 weeks) that most
likely duplicate existing private arrangements. However, this difference in our conclusions by
leave length must be qualified by the fact that the shorter and longer leave mandates date from
different time periods. The increase in job continuity over birth is found for mandates of all
lengths analyzed.
We also find that the increase in job continuity associated with longer mandated leaves
comes from two sources. Some women come back to the work force instead of permanently
quitting in order to care for their child. Another large share switches from taking new mostly
part-time jobs while their child is young to taking longer leaves before returning full-time to the
pre-birth employer.
As noted in the introduction an impact of maternity leave on labor supply is thought to be
the mechanism through which these leaves can have longer term benefits such as better labor
market outcomes for women and better health outcomes for children. Whether maternity leaves
have these impacts remains an important task for future research.
Our results also may explain the lack of consistent evidence of an impact of short
mandates, such as the FMLA, on labor supply. In our data these short mandates appear to
replicate the private arrangement females can make in the absence of legislation.
An issue left unresolved by our analysis is how the labor supply effect of leaves varies
with income replacement. The compensation of leaves in Canada is modest to European
28
standards, but exceeds U.S. norms. If income replacement is important, our estimates likely
overestimate the effect of a simple extension of the FMLA. That said, if other states consider
following California’s lead with its Paid Family Leave Insurance Program, which provides
income replacement comparable to the Canadian norm, then our estimates will have relevance
for these jurisdictions.
29

Appendix
On the Suitability of the Tenure Variable to Capture Job Continuity Pre/Post-Birth
The tenure question in the LFS asks “When did ... start working [at name of employer]?”.
The responses to this question indicate that individuals interpret this question to mean first start
working at this employer rather than the start of the current job or employment period.
Table A-1: Distribution of Tenure among Mothers Employed in the Third and Fourth Month Following the MOB Mothers Employed in the Third Month After the MOB Tenure 1 month 2 months 3 months 4+
months
All
4.2 4.5 2.2 89.1
Those Not Employed in MOB
19.4 19.4 10.2 51.0
Those Employed in MOB
1.1 1.4 0.5 97.0
Mothers Employed in the Fourth Month After the MOB Tenure 1 month 2 months 3 months 4 months 5+
months All
4.6 5.4 3.9 2.4 83.7
Those Not Employed in MOB
15.1 20.6 13.8 9.7 40.8
Those Employed in MOB
2.1 1.8 1.5 0.6 94.0
Notes: Source is the LFS. MOB=month of birth. The reported statistics are the proportion of mothers working in the indicated month following the MOB who report the indicated current job tenure.
30

Some evidence is provided in Table A-1. We report the distribution of current job tenure
for mothers employed in the indicated month following the MOB for our 1976-1990 panel-based
sample. For example, 4.2 percent of mothers working in the third month following the MOB
report current job tenure of one month.
There are at least two striking results here. First, the overwhelming majority of mothers
working in the third or fourth month following birth report a job tenure indicating they are with
their pre-birth employer. Second, a substantial fraction of those who were not employed in their
MOB also report a job tenure that indicates they are at their pre-birth employer: 51 percent of
those working in the third month following birth and 41 percent of those working in the fourth.
This suggests that these individuals interpret the tenure question to ask when they first started
work with their current employer, not when the current employment period with the employer
started.
Variable Definitions and Sources
Labor Supply Analysis
WKSLV: Weeks of mandated job-protected maternity/parental leave. Source is provincial statues and Labor Canada (Various Issues).
Education: 0/1 indicator that the individual has completed some post-
secondary education but not a degree; 0/1 indicator that the individual has completed a university degree. Source is LFS.
Other Child: 0/1 indicator of the presence of another child aged one or greater
living at home. Source is LFS.
31

References Baker, Michael and Kevin Milligan (2005), “How does job-protected maternity leave affect mothers’ employment and infant health?, NBER Working Paper 11135. Baum, Charles L. II (2003a), “The effect of maternity leave legislation on mothers’ labor supply after birth,” Southern Economic Journal, Vol. 69, No. 4, pp. 772-799. Baum, Charles L. II (2003b). “The effect of state maternity leave legislation and the 1993 Family and Medical Leave Act on employment and wages,” Labor Economics, Vol. 10, No. 5, pp. 573-596. Bertrand, Marianne, Esther Duflo, and Sendhil Mullainathan (2004), “How Much Should We Trust Difference in Difference Estimates?” Quarterly Journal of Economics, Vol. 119, No. 1, pp. 249-275. Dryburgh, Heather (2000), “Teenage Pregnancies”, Health Reports, Vol 12, No. 1, pp. 9-20. Statistics Canada Catalogue 82-003. Hansen, Christian B. (2007), “Generalized least squares inference in panel and multilevel models with serial correlation and fixed effects,” Journal of Econometrics, Vol. 140, No. 2, pp. 670-694. Klerman, Jacob Alex and Arleen Leibowitz (1994), “The work-employment distinction among new mothers.” Journal of Human Resources, Vol. 29, No. 2, pp. 277-303. Klerman, Jacob Alex and Arleen Leibowitz (1997), “Labor supply effects of state maternity leave legislation,” in Francine D. Blau and Ronald G. Ehrenberg (eds.) Gender and Family Issues in the Workplace. New York: Russell Sage Foundation. Klerman, Jacob Alex and Arleen Leibowitz (1999), “Job continuity among new mothers,” Demography, Vol. 36, No. 2, pp. 245-155. Labor Canada (Various Issues), “Employment Standards in Canada,” Ottawa: Government of Canada. National Partnership for Women and Families (2006), Where Families Matter: State Progress Toward Valuing America’s Families. Available at http://www.nationalpartnership.org/. Phipps, Shelley (2000), “Maternity and parental benefits in Canada: Are there behavioral implications?” Canadian Public Policy, Vol. 26, No. 4, pp. 415-436. Phipps, Shelley, Peter Burton, and Lynn Lethbridge (2001), “In and out of the labor market: long-term income consequences of child-related interruptions to women’s paid work,” Canadian Journal of Economics, Vol. 34, No. 2, pp. 411-429. Ruhm, Christopher J. (1998), “The economic consequences of parental leave mandates: Lessons from Europe,” Quarterly Journal of Economics, Vol. 112, No. 1, pp. 285-317.
32

Ruhm, Christopher J. (2000), “Parental Leave and Child Health”, Journal of Health Economics, 19, 931-960. Solon, Gary (1984), “Estimating Autocorrelations in Fixed-Effects Models,” Technical Working Paper No. 32, National Bureau of Economic Research. Statistics Canada (2006). Reproductive Health: Pregnancies and Rates, Canada, 1974-2002 (Catalogue 82-568-XPB) Ottawa: Statistics Canada. ten Cate, Adrienne (2000), “Labor Market Effects of Maternity and Parental Leave Policy in Canada (2)” , Mimeograph, McMaster University. ten Cate, Adrienne (2003), “The Impact of Maternity and Parental Leave Policies on Employment Rates of Women with Young Children in Canada”, Mimeograph, McMaster University. Waldfogel, Jane (1998a), “The family gap for young women in the United States and Britain: Can maternity leave make a difference?” Journal of Labor Economics, Vol. 16, No. 3, pp. 505-545. Waldfogel, Jane (1998b), “Understanding the `Family Gap’ pay for women with children,” Journal of Economic Perspectives, Vol. 12, No. 1, pp. 137-156. Waldfogel, Jane (1999), “The impact of the Family and Medical Leave Act,” Journal of Policy Analysis and Management, Vol. 18, No. 2, pp. 281-302. Waldfogel, Jane, Yoshio Higuchi, and Masahiro Abe (1999), “Family leave policies and women’s retention after childbirth: Evidence from the United States, Britain, and Japan,” Journal of Population Economics, Vol. 12, pp. 523-545. Winegarden, C.R. and Paula M. Bracy (1995), “Demographic Consequences of Maternal-Leave Programs in Industrial Countries: Evidence from Fixed-Effects Models”, Southern Economic Journal, Vol. 61, pp. 1020-1035. World Health Organization (2000), “Health Aspects of Maternity Leave and Maternity Protection,” Statement to the International Labor Conference, June 2, 2000.
33
34
Table 1: Weeks of Mandated Job-protected Maternity/Parental Leave by Province
Fed. AB BC
MB NB NF NS ON PEI QU SA
1963 0 0 12 0 0 0 0 0 0 0 0 1964 0 0 12 0 12 0 0 0 0 0 0 1965 0 0 12 0 12 0 0 0 0 0 0 1966 0 0 12 0 12 0 0 0 0 0 0 1967 0 0 12 0 12 0 0 0 0 0 0 1968 0 0 12 0 12 0 0 0 0 0 0 1969 0 0 12 0 12 0 0 0 0 0 0 1970 0 0 12 0 12 0 0 12 0 0 0 1971 15 0 12 0 12 0 0 12 0 0 0 1972 15 0 12 0 12 0 0 12 0 0 0 1973 15 0 12 0 12 0 17 12 0 0 18 1974 15 0 12 17 12 0 17 12 0 0 18 1975 15 0 12 17 12 0 17 17 0 0 18 1976 15 0 12 17 17 0 17 17 0 0 18 1977 15 18 12 17 17 0 17 17 0 0 18 1978 15 18 12 17 17 17 17 17 0 18 18 1979 15 18 12 17 17 17 17 17 0 18 18 1980 15 18 12 17 17 17 17 17 0 18 18 1981 15 18 18 17 17 17 17 17 0 18 18 1982 15 18 18 17 17 17 17 17 17 18 18 1983 15 18 18 17 17 17 17 17 17 18 18 1984 15 18 18 17 17 17 17 17 17 18 18 1985 41 18 18 17 17 17 17 17 17 18 18 1986 41 18 18 17 17 17 17 17 17 18 18 1987 41 18 18 17 17 17 17 17 17 18 18 1988 41 18 18 17 17 17 17 17 17 18 18 1989 41 18 18 17 17 17 17 17 17 18 18 1990 41 18 18 17 17 17 17 17 17 18 18 1991 41 18 30 34 29 17 34 35 34 52 18 1992 41 18 30 34 29 29 34 35 34 52 18 1993 41 18 30 34 29 29 34 35 34 52 18 1994 41 18 30 34 29 29 34 35 34 52 18 1995 41 18 30 34 29 29 34 35 34 52 18 1996 41 18 30 34 29 29 34 35 34 52 30 1997 41 18 30 34 29 29 34 35 34 70 30 1998 41 18 30 34 29 29 34 35 34 70 30 1999 41 18 30 34 29 29 34 35 34 70 30 2000 54 18 52 54 54 52 52 52 52 70 30 2001 54 52 52 54 54 52 52 52 52 70 52 2002 54 52 52 54 54 52 52 52 52 70 52
Notes: Sources are provincial statutes and Labor Canada (Various Issues). The Federal statutes apply in the federal public sector and federally regulated industries.

Table 2: Dates of the Introduction of Mandated Parental Leave by Province Introduction of Parental Leave Starting in 1990 Extension of Parental Leave Starting in 2000 Weeks of
Leave in 1989
Date of Introduction
Total Weeks of Mandated Leave Post-
Reform
Weeks of Leave in
2000
Date of Extension
Total Weeks of Mandated Leave Post-
Reform Alberta
18 N.A. 18 18 February 7, 2001.
52
British Columbia 18 March 22, 1991 30 30 December 31, 2000.
52
Manitoba
17 December 14, 1990.
34 34 December 31, 2000.
54
New Brunswick
17 May 9, 1991 29 29 December 31, 2000.
54
Newfoundland
17 June 11, 1992 29 29 December 31, 2000.
52
Nova Scotia
17 July 11, 1991 34 34 December 31, 2000.
52
Ontario
17 November 18, 1990
35 35 December 31, 2000.
52
Prince Edward Island 17 April 9, 1991 34 34 December 31, 2000.
52
Quebec
18 January 1, 1991 52 70 N.A. 70
Saskatchewan
18 February 3, 1995 30 30 June 14, 2001. 52
UI 15 November 18,
1990 25 25 December 31,
2000. 50
Notes: Sources are provincial statues and Labor Canada (Various Issues).
35

Table 3: Descriptive Statistics of the Labor Supply of Females Around the MOB 1976-2002 from the Panel-based Sample. Month Employed and on Leave Employed and At Work MOB-1 0.26
(0.44) 0.25
(0.43) MOB 0.42
(0.49) 0.05
(0.22) MOB+1 0.40
(0.49) 0.07
(0.25) MOB+2 0.37
(0.48) 0.10
(0.30) MOB+3 0.33
(0.47) 0.16
(0.36) MOB+4 0.27
(0.45) 0.22
(0.41) (Employed MOB+3 & Tenure>3) | Employed MOB+3 0.93
(0.26) (Employed MOB+4 & Tenure>4) | Employed MOB+4 0.89
(0.31) Left Job within 12 months of MOB 0.26
(0.44) Left Job within 12 months of MOB due to personal/family reasons
0.15 (0.15)
Notes: Source is the LFS. MOB is month of birth. Standard deviations in parentheses.
36

Table 4: Impact of the Introduction of Mandated Leave on Employed on Leave and Employed at Work from Panel-based Sample Employed and On Leave MOB-2 0.0015
(0.0006) 0.0006
(0.0006) 0.0008
(0.0006) 0.0010
(0.0013) -0.0002 (0.0009)
-0.0004 (0.0011)
MOB-1 0.0030 (0.0015)
0.0032 (0.0009)
0.0029 (0.0009)
0.0054 (0.0014)
0.0032 (0.0012)
0.0049 (0.0006)
MOB 0.0016 (0.0014)
0.0031 (0.0009)
0.0032 (0.0009)
0.0057 (0.0024)
0.0028 (0.0010)
0.0051 (0.0017)
MOB+1 0.0021 (0.0018)
0.0047 (0.0017)
0.0051 (0.0015)
0.0077 (0.0029)
0.0036 (0.0020)
0.0038 (0.0020)
MOB+2 -0.0002 (0.0016)
0.0037 (0.0013)
0.0046 (0.0012)
0.0068 (0.0028)
0.0026 (0.0018)
0.0032 (0.0018)
MOB+3 0.0024 (0.0020)
0.0050 (0.0015)
0.0059 (0.0014)
0.0071 (0.0029)
0.0045 (0.0016)
0.0035 (0.0024)
Employed and At Work MOB-2 0.0006
(0.0011) 0.0019
(0.0008) 0.0017
(0.0011) 0.0033
(0.0016) 0.0028
(0.0012) 0.0023
(0.0013)
MOB-1 -0.0014 (0.0011)
0.0001 (0.0007)
-0.0003 (0.0008)
0.0002 (0.0009)
0.0001 (0.0009)
-0.0012 (0.0014)
MOB -0.0001 (0.0002)
0.0002 (0.0005)
0.0002 (0.0006)
0.0003 (0.0005)
-0.0004 (0.0015)
-0.0014 (0.0014)
MOB+1 0.0001 (0.0006)
-0.0011 (0.0003)
-0.0012 (0.0004)
-0.0014 (0.0008)
0.0004 (0.0009)
-0.0007 (0.0011)
MOB+2 0.0009 (0.0016)
-0.0010 (0.0009)
-0.0013 (0.0010)
-0.0023 (0.0018)
0.0007 (0.0013)
-0.0004 (0.0014)
MOB+3 -0.0003 (0.0014)
-0.0008 (0.0010)
-0.0011 (0.0010)
-0.0030 (0.0022)
0.0004 (0.0013)
0.0010 (0.0019)
Provincial Trends No Yes Yes Yes Yes Yes Federal. Sector Deleted Recent Work Yes Control Group Males Childless
Females Notes: Reported statistics are the parameter on weeks of mandated leave from a regression of the indicated variable on weeks of leave, province, year and calendar month effects, a cubic in age, education (three categories) and a control for siblings aged 1-24. Robust standard errors, clustered on province, are reported in parentheses. Sample period is 1976 through October 1990. MOB is month of birth.
37
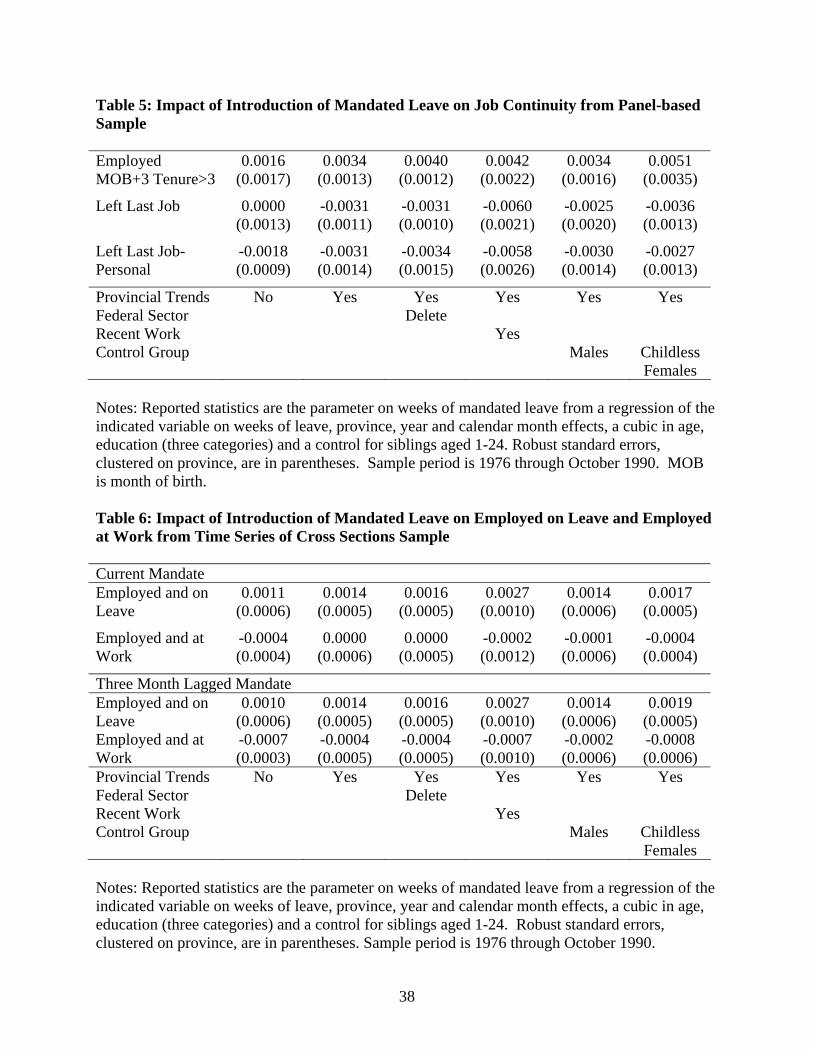
Table 5: Impact of Introduction of Mandated Leave on Job Continuity from Panel-based Sample Employed MOB+3 Tenure>3
0.0016 (0.0017)
0.0034 (0.0013)
0.0040 (0.0012)
0.0042 (0.0022)
0.0034 (0.0016)
0.0051 (0.0035)
Left Last Job 0.0000 (0.0013)
-0.0031 (0.0011)
-0.0031 (0.0010)
-0.0060 (0.0021)
-0.0025 (0.0020)
-0.0036 (0.0013)
Left Last Job-Personal
-0.0018 (0.0009)
-0.0031 (0.0014)
-0.0034 (0.0015)
-0.0058 (0.0026)
-0.0030 (0.0014)
-0.0027 (0.0013)
Provincial Trends No Yes Yes Yes Yes Yes Federal Sector Delete Recent Work Yes Control Group Males Childless
Females Notes: Reported statistics are the parameter on weeks of mandated leave from a regression of the indicated variable on weeks of leave, province, year and calendar month effects, a cubic in age, education (three categories) and a control for siblings aged 1-24. Robust standard errors, clustered on province, are in parentheses. Sample period is 1976 through October 1990. MOB is month of birth. Table 6: Impact of Introduction of Mandated Leave on Employed on Leave and Employed at Work from Time Series of Cross Sections Sample Current Mandate Employed and on Leave
0.0011 (0.0006)
0.0014 (0.0005)
0.0016 (0.0005)
0.0027 (0.0010)
0.0014 (0.0006)
0.0017 (0.0005)
Employed and at Work
-0.0004 (0.0004)
0.0000 (0.0006)
0.0000 (0.0005)
-0.0002 (0.0012)
-0.0001 (0.0006)
-0.0004 (0.0004)
Three Month Lagged Mandate Employed and on Leave
0.0010 (0.0006)
0.0014 (0.0005)
0.0016 (0.0005)
0.0027 (0.0010)
0.0014 (0.0006)
0.0019 (0.0005)
Employed and at Work
-0.0007 (0.0003)
-0.0004 (0.0005)
-0.0004 (0.0005)
-0.0007 (0.0010)
-0.0002 (0.0006)
-0.0008 (0.0006)
Provincial Trends No Yes Yes Yes Yes Yes Federal Sector Delete Recent Work Yes Control Group Males Childless
Females Notes: Reported statistics are the parameter on weeks of mandated leave from a regression of the indicated variable on weeks of leave, province, year and calendar month effects, a cubic in age, education (three categories) and a control for siblings aged 1-24. Robust standard errors, clustered on province, are in parentheses. Sample period is 1976 through October 1990.
38

Table 7: Impact of the 1990 Extension of Mandated Leave on Employed on Leave and Employed at Work from Panel-based Sample. Employed and On Leave MOB -0.0101
(0.0120) 0.0120
(0.0167) -0.0298 (0.0192)
0.0085 (0.0182)
0.0292 (0.0182)
0.0110 (0.0173)
0.0226 (0.0172)
MOB+3 0.0221 (0.0236)
0.0610 (0.0291)
0.0142 (0.0277)
0.0405 (0.0330)
0.0958 (0.0343)
0.0728 (0.0302)
0.0499 (0.0333)
MOB+4 0.1128 (0.0228)
0.1558 (0.0339)
0.0121 (0.0204)
0.1520 (0.0345)
0.2268 (0.0519)
0.1674 (0.0391)
0.1922 (0.0414)
Employed and at Work MOB -0.0184
(0.0071) -0.0217 (0.0050)
-0.0041 (0.0079)
-0.0197 (0.0060)
-0.0241 (0.0061)
0.0121 (0.0072)
-0.0217 (0.0141)
MOB+3 -0.0484 (0.0198)
-0.0564 (0.0166)
-0.0175 (0.0154)
-0.0472 (0.0184)
-0.0809 (0.0232)
-0.0198 (0.0195)
-0.0187 (0.0322)
MOB+4 -0.1010 (0.0217)
-0.1259 (0.0285)
-0.0399 (0.0324)
-0.1345 (0.0306)
-0.1343 (0.0432)
-0.1121 (0.0319)
-0.1897 (0.0568)
Job Continuity Employed MOB+3 Tenure>3
-0.0075 (0.0223)
0.0286 (0.0260)
-0.0176 (0.0334)
0.0078 (0.0287)
0.0435 (0.0304)
0.0808 (0.0304)
0.0477 (0.0349)
Employed MOB+4 Tenure>4
0.0918 (0.0335)
0.0911 (0.0277)
-0.0572 (0.0320)
0.0764 (0.0286)
0.1454 (0.0363)
0.1221 (0.0349)
0.0414 (0.0492)
Left Last Job 0.0065 (0.0094)
-0.0164 (0.0149)
0.0529 (0.0156)
-0.0143 (0.0142)
-0.0051 (0.0179)
-0.0414 (0.0149)
-0.0143 (0.0187)
Left Last Job-Personal
-0.0223 (0.0100)
-0.0233 (0.0128)
0.0432 (0.0121)
-0.0208 (0.0116)
-0.0241 (0.0166)
-0.0226 (0.0126)
-0.0193 (0.0130)
Years 1990-1991
1989-1992
1986-1989
1989-1992
1989-1992
1989-1992
1989-1992
Federal Delete Recent Work Yes Control Group Males Childless
Females Notes: Reported statistics are the parameter on a 0/1 indicator of the introduction of parental leave from a regression of the indicated variable on leave indicator, province and calendar month effects, a cubic in age, education (three categories) and a control for siblings aged 1-24. Robust standard errors, clustered on province/year, are in parentheses. Sample period as indicated. MOB is month of birth.
39
Table 8: An Account of the Change in the Proportion of Mothers Employed MOB+4 with Tenure>4 Change in Overall Employment at MOB+4 0.0299
(0.0230)
Change in the Proportion of Mothers Employed MOB+4 with Tenure>4
0.0911 (0.0277)
Change in the Proportion of Mothers Employed MOB+4 with Tenure=1
-0.0041 (0.0094)
Change in the Proportion of Mothers Employed MOB+4 with Tenure=2
-0.0290 (0.0106)
Change in the Proportion of Mothers Employed MOB+4 with Tenure=3
-0.0136 (0.0074)
Change in the Proportion of Mothers Employed MOB+4 with Tenure=4
-0.0145 (0.0064)
Total Change in Employment at Tenures<5 (Sum of Rows 3-6)
-0.0612
Change in part-time employment at Tenures<5
-0.0392 (0.0128)
Notes: Reported statistics are the parameter on a 0/1 indicator of the introduction of parental leave from a regression of the indicated variable on leave indicator, province and calendar month effects, a cubic in age, education (three categories) and a control for siblings aged 1-24. Robust standard errors, clustered on province/year, are in parentheses. Sample period is 1989-1992. MOB is month of birth.
40

Table 9: Impact of the 1990 Extension of Mandated Leave on Employed on Leave and Employed at Work from Time Series of Cross Sections Sample. Employed and on Leave
0.0289 (0.0042)
0.0400 (0.0068)
-0.0122 (0.007)
0.0424 (0.0071)
0.0610 (0.0103)
0.0405 (0.0069)
0.0438 (0.0069)
Employed and at Work
-0.0282 (0.0084)
-0.0333 (0.0075)
0.016 (0.008)
-0.0359 (0.0074)
-0.0387 (0.0111)
0.0044 (0.0072)
-0.0153 (0.0073)
Years 1990-1991
1989-1992
1986-1989
1989-1992
1989-1992
1989-1992
1989-1992
Federal Delete Recent Work Yes Control Group Males Childless
Females
Notes: Reported statistics are the parameter on a 0/1 indicator of the introduction of parental leave from a regression of the indicated variable on leave indicator, province and calendar month effects, a cubic in age, education (three categories) and a control for siblings aged 1-24. Robust standard errors, clustered on province/year, are in parentheses. Sample period as indicated.
41
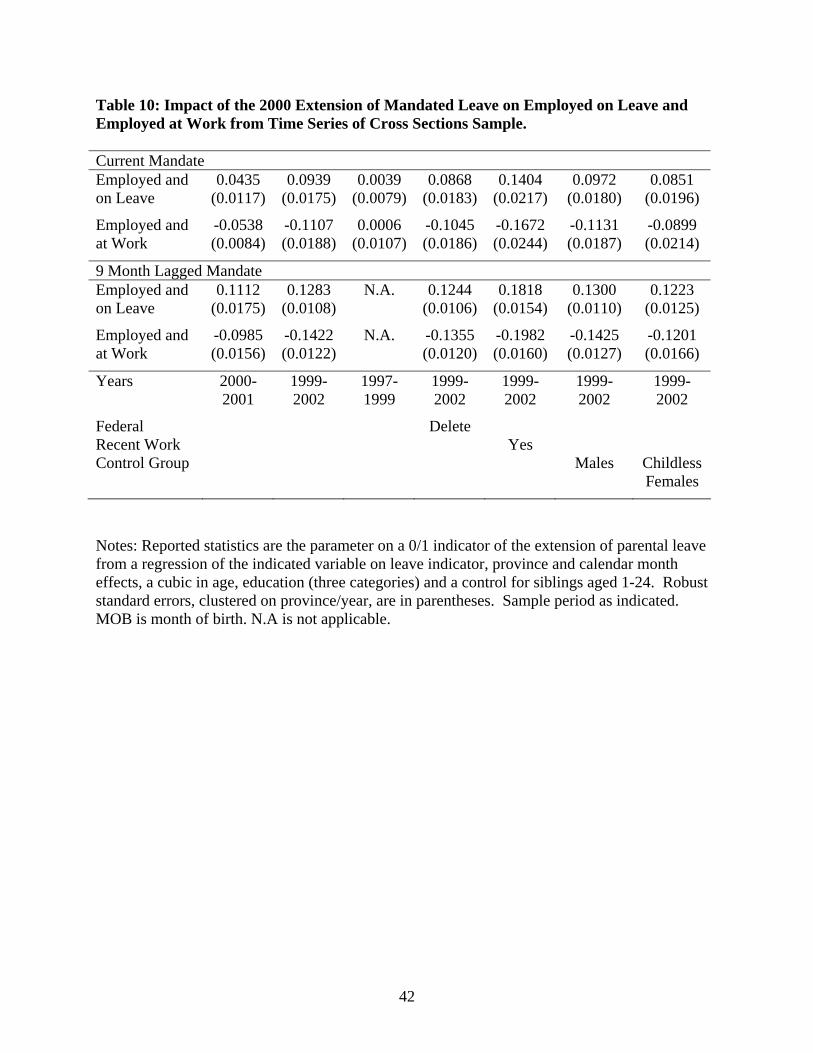
Table 10: Impact of the 2000 Extension of Mandated Leave on Employed on Leave and Employed at Work from Time Series of Cross Sections Sample. Current Mandate Employed and on Leave
0.0435 (0.0117)
0.0939 (0.0175)
0.0039 (0.0079)
0.0868 (0.0183)
0.1404 (0.0217)
0.0972 (0.0180)
0.0851 (0.0196)
Employed and at Work
-0.0538 (0.0084)
-0.1107 (0.0188)
0.0006 (0.0107)
-0.1045 (0.0186)
-0.1672 (0.0244)
-0.1131 (0.0187)
-0.0899 (0.0214)
9 Month Lagged Mandate Employed and on Leave
0.1112 (0.0175)
0.1283 (0.0108)
N.A. 0.1244 (0.0106)
0.1818 (0.0154)
0.1300 (0.0110)
0.1223 (0.0125)
Employed and at Work
-0.0985 (0.0156)
-0.1422 (0.0122)
N.A. -0.1355 (0.0120)
-0.1982 (0.0160)
-0.1425 (0.0127)
-0.1201 (0.0166)
Years 2000-2001
1999-2002
1997-1999
1999-2002
1999-2002
1999-2002
1999-2002
Federal Delete Recent Work Yes Control Group Males Childless
Females
Notes: Reported statistics are the parameter on a 0/1 indicator of the extension of parental leave from a regression of the indicated variable on leave indicator, province and calendar month effects, a cubic in age, education (three categories) and a control for siblings aged 1-24. Robust standard errors, clustered on province/year, are in parentheses. Sample period as indicated. MOB is month of birth. N.A is not applicable.
42
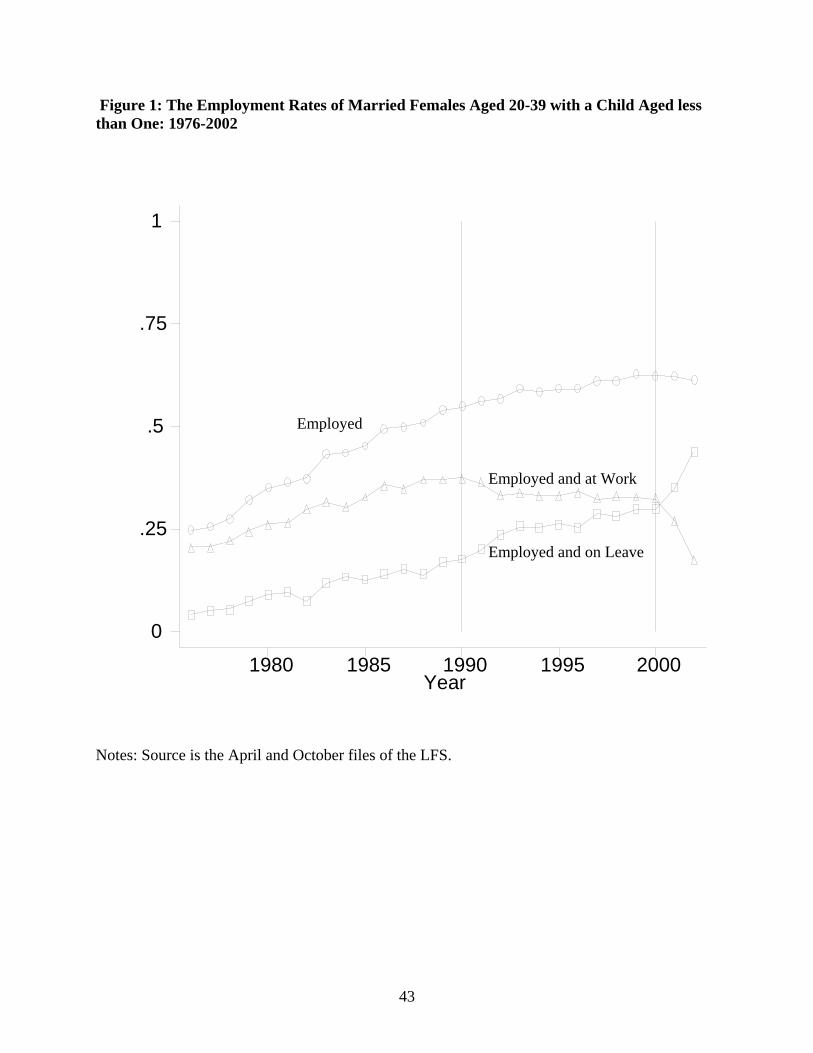
Figure 1: The Employment Rates of Married Females Aged 20-39 with a Child Aged less than One: 1976-2002
43
Employed
Notes: Source is the April and October files of the LFS.
Employed and at Work Employed and on Leave
Year1980 1985 1990 1995 2000
0
.25
.5
.75
1

Figure 2: The Proportion of Married Mothers, Aged 20-39, Employed and On Leave in the Month Before Birth
Notes: Source is the panel-based sample from the LFS.
Quebec Ontario
Year1976 1977 1978 1979 1980 1981 1982 1983 1984
0
.25
.5
.75
44

Figure 3: The Proportion of Married Mothers, Aged 20-39, Employed and On Leave in the “Month of Birth”
Y ear1985 1986 1987 1988 1989 1990 1991 1992 1993 199 4 1995 1996
0
.25
.5
.75
Notes: Source is the panel-based sample from the LFS. The proportion reported is for the provinces of British Columbia, New Brunswick, Prince Edward Island and Quebec. Figure 4: The Proportion of Married Mothers, Aged 20-39, Employed and On Leave Four Months after the “Month of Birth”
Y ear1985 1986 1987 1988 1989 1990 1991 1992 1993 199 4 1995 1996
0
.25
.5
.75
Notes: Source is the panel-based sample from the LFS. The proportion reported is for the provinces of British Columbia, New Brunswick, Prince Edward Island and Quebec.
45