how does performance funding impact the open access
TRANSCRIPT

Rowan University Rowan University
Rowan Digital Works Rowan Digital Works
Theses and Dissertations
9-10-2019
How does performance funding impact the open access mission How does performance funding impact the open access mission
of community colleges in Massachusetts? of community colleges in Massachusetts?
Walter T. Brooks Rowan University
Follow this and additional works at: https://rdw.rowan.edu/etd
Part of the Community College Leadership Commons, and the Higher Education Commons
Recommended Citation Recommended Citation Brooks, Walter T., "How does performance funding impact the open access mission of community colleges in Massachusetts?" (2019). Theses and Dissertations. 2734. https://rdw.rowan.edu/etd/2734
This Dissertation is brought to you for free and open access by Rowan Digital Works. It has been accepted for inclusion in Theses and Dissertations by an authorized administrator of Rowan Digital Works. For more information, please contact [email protected].

HOW DOES PERFORMANCE FUNDING IMPACT THE OPEN ACCESS
MISSION OF COMMUNITY COLLEGES IN MASSACHUSETTS?
by
Walter T. Brooks
A Dissertation
Submitted to the
Department of Educational Services and Leadership
College of Education
In Partial Fulfillment of the requirement
For the degree of
Doctor of Education
at
Rowan University
May 6, 2019
Dissertation Chair: Patricia C. Donohue, Ph.D.

© 2019 Walter T. Brooks

iii
Acknowledgments
I would like to express my appreciation to Dr. Patricia C. Donohue for her patience,
guidance, and help throughout this research project. Her knowledge and expertise as a
community college president was invaluable in helping me successfully complete my
doctoral studies. I would also like to thank Dr. Monica Kerrigan and Dr. Lawrence Nespoli
for their commitment to seeing this study through to its fruition. A sincere “thank you” to
my colleagues at the Massachusetts Community Colleges for their willingness to
participate in this study. I would like to give a special “thank you” as well to my wife,
sister, and my mother for their unwavering love and support through this endeavor.

iv
Abstract
Walter T. Brooks
HOW DOES PERFORMANCE FUNDING IMPACT THE OPEN ACCESS MISSION
OF COMMUNITY COLLEGES IN MASSACHUSETTS?
2018-2019
Patricia C. Donohue, Ph.D.
Doctor of Educational Leadership
The purpose of this case study of four community colleges was to determine if the
Massachusetts Performance Funding Formula (MAPFF) has negatively impacted access
in two threats to access: (a) decreased affordability; and (b) restriction of admissions,
enrollment, and recruitment in fiscal years 2014, 2015, and 2016. Participating senior
administrators provided their perceptions of how the Massachusetts Performance Funding
Formula impacted student access and their institutions. Access was negatively impacted
by decreased affordability due to significant increases to tuition and fees the students pay.
Access was also negatively impacted by a reduction and elimination of programs,
courses, and sections.
Keywords: Massachusetts, community colleges, performance funding formula, access

v
Table of Contents
Abstract .............................................................................................................................. iv
List of Figures .................................................................................................................... xi
List of Tables .................................................................................................................... xii
Chapter I: Introduction ........................................................................................................ 1
Background ................................................................................................................... 2
Research Questions ....................................................................................................... 3
Rationale and Significance of the Study ....................................................................... 3
Research Design............................................................................................................ 5
Pragmatic Philosophical Worldview............................................................................. 6
Conceptual Framework ................................................................................................. 6
Multiple-Case Study Design ....................................................................................... 10
Organization of the Proposal ...................................................................................... 12
Chapter II: Review of the Literature ................................................................................. 15
The Complex Missions of Community Colleges ........................................................ 16
The Open Access Mission of Community Colleges ................................................... 16
Opening the Doors to Higher Education ..................................................................... 21
Truman Commission. ............................................................................................ 21
National Defense Act. ........................................................................................... 21
Higher Education Act. .......................................................................................... 22
Carnegie Commission. .......................................................................................... 22
Spellings Commission. ......................................................................................... 22
Student Success and Completion ................................................................................ 23
Is Higher Education a Public Good? ........................................................................... 24

vi
Table of Contents (Continued)
Historical Funding of Community Colleges ............................................................... 27
Government Funding of Community Colleges ........................................................... 28
Community College Governance ................................................................................ 32
Performance Funding .................................................................................................. 34
Performance Funding 1.0 vs. 2.0. ......................................................................... 35
Performance Funding Research .................................................................................. 40
Twenty-Year History of Performance Funding at the University of
Memphis. .................................................................................................. 41
The impact of performance-Based Funding at Woodland Hills
Community College. ................................................................................. 43
Impacts of Performance Funding ................................................................................ 44
Some Positive Impacts of Performance Funding. ................................................. 44
Negative Consequences of Performance Funding. ............................................... 47
Beginning of Massachusetts Community Colleges .................................................... 51
Massachusetts Economic Influence of Community Colleges ..................................... 53
Massachusetts Vision Project ..................................................................................... 54
Massachusetts Outcomes Accountability ................................................................... 59
Performance Funding in Massachusetts...................................................................... 61
Massachusetts Performance Funding Model .............................................................. 64
Base Share: Enrollment Variables. ....................................................................... 65
Putting it All Together ................................................................................................ 68
Stop Loss Adjustment (Guaranteed Increase)............................................................. 70
Revenue Maximization ............................................................................................... 71
Basis for Research Design .......................................................................................... 75

vii
Table of Contents (Continued)
Building Upon the Research ....................................................................................... 77
Evidence of a Mission Shift ........................................................................................ 78
Chapter III Methodology .................................................................................................. 80
Study Protocol ............................................................................................................. 80
Research Questions ..................................................................................................... 81
Purpose of Study ......................................................................................................... 82
Research Design.......................................................................................................... 84
Data Collection ........................................................................................................... 88
Quantitative Administrative and Secondary Data. ................................................ 90
Qualitative Data. ................................................................................................... 93
Quantitative Data Analysis and Case Institution Selection ........................................ 96
Survey and Interview Data Analysis......................................................................... 106
Cross-Case Analysis ................................................................................................. 108
Validity and Reliability ............................................................................................. 109
Construct Validity. .............................................................................................. 109
Internal Validity. ................................................................................................. 110
External Validity. ................................................................................................ 111
Reliability. ........................................................................................................... 112
Data Dependency. ............................................................................................... 112
Researcher Bias ......................................................................................................... 115
Pilot Study ................................................................................................................. 118
Limitations of the Study............................................................................................ 118
Conclusion ................................................................................................................ 120

viii
Table of Contents (Continued)
Chapter IV: Findings....................................................................................................... 122
Building Upon the Research ..................................................................................... 122
Quantitative Administrative and Secondary Data ..................................................... 123
Tuition and Fees. ................................................................................................. 125
State Appropriation Change Before Stop Loss. .................................................. 126
Performance Share Percentage. .......................................................................... 127
Percentage Change in Operating Expenses. ........................................................ 129
Stop-Loss Impact. ............................................................................................... 129
State Appropriation Increases. ............................................................................ 130
Quantitative and Qualitative Survey Data ................................................................ 132
Participant Information Responses, SQ 30–33. .................................................. 133
Level of Review and Familiarity Responses, SQ 1, SQ 2, SQ 18,
and SQ 19. ............................................................................................... 135
Perceived Importance of Access Responses, SQ 14 and SQ 15. ........................ 137
Actions Taken During the Study Period Responses, SQ 4, 5, 6 and 7. .............. 138
Actions Influenced by the MAPFF, SQ 8, 9, 1,2 and 13. ................................... 141
Perceived Impact of the MAPFF on Institutions and Access, SQ 3,
10, 11, 16, 17, and 23–27. ....................................................................... 145
Perceptions of the MAPFF and Additional Comments, SQ 28–29. ................... 153
Perceived Impact of the MAPFF Stop-Loss Adjustment, SQ 18–21. ................ 155
Summary of the Quantitative and Qualitative Survey Data...................................... 158
Qualitative Interview Data. ................................................................................. 159
Interview Responses By Case Institution. .......................................................... 161
Summary of Interview Themes. .......................................................................... 181
ix
Table of Contents (Continued)
Discussion ................................................................................................................. 181
Stop-Loss Effect.................................................................................................. 183
Significant and Notable Findings........................................................................ 185
Conclusion ................................................................................................................ 195
Chapter V: Conclusions .................................................................................................. 197
Study Overview ........................................................................................................ 198
Findings Summary .................................................................................................... 200
Impact to Access. ................................................................................................ 201
Decreased Affordability (AFFORD). ................................................................. 202
Restrictive Admissions, Enrollment, And Recruitment (R.A.E.R.). .................. 204
Research Subquestion 1. ..................................................................................... 206
Research Subquestion 2. ..................................................................................... 207
Research Subquestion 3. ..................................................................................... 210
Research Subquestion 4. ..................................................................................... 212
Negative Impact on Access. ................................................................................ 213
Conclusion ................................................................................................................ 217
Positive Impact of the MAPFF. .......................................................................... 223
Observation. ........................................................................................................ 224
Limitations ................................................................................................................ 225
Recommendations for Future Research .................................................................... 227
Recommendations for Policy and Practice ............................................................... 229
Recommendation 1: Minimize Losses With A Hold Harmless Provision. ........ 230
Recommendation 2: Review Formula Results. ................................................... 230

x
Table of Contents (Continued)
Recommendation 3: Provide Instructions. .......................................................... 231
Recommendation 4: Require Annual Reports. ................................................... 232
Recommendation 5: Adjust for Student Affordability. ....................................... 232
Recommendation 6: Recognize Regional Demographic Variations. ................. 232
Recommendation 7: Highlight and Summarize Each Formula Component
in Final Allocation. ................................................................................. 233
Recommendation 8: Fund Adequately and Consistently. ................................... 233
Recommendations for Leadership ............................................................................ 234
References ....................................................................................................................... 236
Appendix A: Quantiative Data by Year by Case Institution........................................... 245
Appendix B: Selection Variables 1, 2 and 3 ................................................................... 246
Appendix C: Selection Variables 4 and 5 ....................................................................... 247
Appendix D: Timeline for Dissertation .......................................................................... 248
Appendix E: Alternative Explanations ........................................................................... 249
Appendix F: Survey ........................................................................................................ 251
Appendix G: Overview of the Massachusetts Performance Funding Formula .............. 265
Appendix H: Data Use Diagram ..................................................................................... 266
Appendix I: Consent-to-Participate Form ....................................................................... 267
Appendix J: Interview Protocol ...................................................................................... 268
Appendix K: Positions Targeted to Complete the Survey .............................................. 271
Appendix L: Survey Summary Findings Table .............................................................. 272
Appendix M: Interview Summary Findings Table ......................................................... 275

xi
List of Figures
Figure Page
Figure 1. MAPFF Formula Components. ......................................................................... 67
Figure 2. Data Triangulation. .......................................................................................... 113
Figure 3. Research Methods. .......................................................................................... 180
Figure 4. MAPFF Dashboards FY2014–2016. ............................................................... 193

xii
List of Tables
Table Page
Table 1. Status of College Financing Tied to Performance .............................................. 37
Table 2. Access, Affordability, Success and Accountability ............................................ 58
Table 3. Performance Funding Formula (MAPFF) .......................................................... 69
Table 4. Data Collection ................................................................................................... 83
Table 5. Data Sources and Their Purpose Served ............................................................. 89
Table 6. Survey Distribution and Interview Participants .................................................. 95
Table 7. Case Selection Criterion ..................................................................................... 99
Table 8. Case Selection Criterion Continued .................................................................. 103
Table 9. Quantitative Data .............................................................................................. 125
Table 10. The Position, Number and Tenure of Survey Respondents by
Institution (Questions 30, 31, 32, and 33) ........................................................... 134
Table 11. Number of Responses and Actions Taken During the Study Period .............. 138
Table 12. Number of Responses and Actions Taken by the Case Institutions
Influenced by Their Results on the MAPFF SQ 8 .............................................. 142
Table 13. Number of Responses and Perceived Negative Impact of the
MAPFF SQ10, 11, 16, and 17............................................................................. 147
Table 14. Number of Responses and Perception of Positive Impact and no
Impact of the MAPFF SQ 23–SQ 27 .................................................................. 151
Table 15. Number of Responses and What Surprised the Respondents
Most About the MAPFF SQ28 and 29 ............................................................... 153
Table 16. Number of Responses and Perception of the Stop-Loss
Adjustment of the MAPFF SQ 18, 20–22 .......................................................... 156
Table 17. Interview Participants ..................................................................................... 160

1
Chapter I
Introduction
The publicly stated mission of the Massachusetts community colleges espouses
open access to high-quality, affordable higher education for the states’ citizens. However,
an examination of how other states are tying funding to students’ success outcomes also
reveals that there may be a related shift in emphasis of the mission of community
colleges from allocating state funding based on enrollment and access to completion and
success. This shift in mission away from open access and more towards completion is
important because from the formation of community colleges in the early 1900s, open
access has been the primary mission, whereby access to higher education is for all, not
just for the brightest and the wealthiest (American Association of Community Colleges,
2012; Dougherty, 2001; Dowd & Shieh, 2013; Shannon & Smith, 2006). In
Massachusetts, a significant portion of the community college funding comes from the
state. Shifting the funding allocation away from enrollment and more towards completion
demonstrates a change in priority away from access.
The implementation of the performance funding formula (MAPFF) to allocate
state funding in Massachusetts does not demonstrate this shift. The focus of this study
was to examine the impact that state performance funding has had on the open access
mission of community colleges in Massachusetts. To gain a better understanding of the
impact of performance funding on access, we must understand how community colleges
are funded, what performance funding is, what open access is, and why it is such an
important mission that is worth preserving.

2
Background
In fiscal year 1993, for the first time in history since the data has been collected,
state appropriations for higher education nationally fell below the previous year.
Taxpayers complained about the rising costs against a perceived decrease in the quality
of higher education (Burke, 2002). With the curtailed funding and rising criticism,
renewed demands for accountability from higher education have become commonplace.
During the more recent recessionary period, beginning in December 2007 and ending in
June 2009, with state budgets strained, state legislators began questioning the quality and
quantity of undergraduate higher education. Now, during the slow and prolonged
economic recovery we are still experiencing today, critics are again questioning the
function of higher education, as well as the skyrocketing tuition and fee costs, as well as
the historic level of student loan debt (AACC, 2012; Dougherty, 2001; Dowd & Shieh,
2013; Shannon & Smith, 2006).
Traditionally, states budgeted appropriations for public colleges and universities
based largely on current costs, student enrollments, and inflationary increases. These
factors disregarded the quantity and quality of graduates and the benefits to society
(Burke, 2002). The cost-plus budgeting also “promoted inappropriate growth in
expenditures, enrollments, and programs, even in states with declining demographics and
decreasing student demands” (Burke, 2002; p20). State legislators, governors, and some
high-profile advocacy groups have noted that the U.S. is falling behind other countries in
educational attainment and argue that this traditional funding model does little to address
this concern (Tandberg & Hillman, 2013).

3
Stagnant or declining state fiscal support and increased expectations of improving
student success in community colleges are driving the implementation of the performance
funding formula.
This study examined the impact state performance funding had on one of the
primary missions of community colleges in Massachusetts: open access.
Research Questions
The overarching research question for this study was: How is performance
funding influencing the open access mission of community colleges in Massachusetts?
To answer this question, I sought answers to the following additional questions:
1. What operational changes that are directly related to the implementation of the
MAPFF have occurred at the institutional level to improve student success?
2. How has the MAPFF Program influenced tuition and fee rate changes?
3. How have changes in the Massachusetts state appropriations with MAPFF
influenced institutional changes in college education delivery or support for
student success that then affected access?
4. How does the senior management perceive the impact of performance funding
on student access to community colleges?
Rationale and Significance of the Study
Massachusetts is a system of community colleges with sufficient standardization
across the sector to generate cases to compare. The MDHE instituted the Massachusetts
Vision Project in 2010 with the stated goals of increasing the number of students
participating, persisting, and completing college, and of making the institutions of higher
education accountable for that achievement through the allocation of state funding using

4
the MAPFF. Massachusetts adopted the use of a performance funding formula to allocate
a significant amount of state funding to the community colleges annually, and has set a
goal to lead the nation in higher education. Prior to the implementation of the MAPFF,
Massachusetts most recently allocated appropriations to the community colleges by
overall percentage changes to the sector without consideration of institutional student
outcomes or even enrollment.
Four negative impacts found in studies conducted in Tennessee, North Carolina,
South Carolina, Missouri, Florida, and Washington as a result of performance funding
that may affect access are (a) increasing tuition and fee rates, making college less
affordable, as a result of having to expand institutional research staff to capture and
analyze data, and other staff and faculty to provide additional student support services;
(b) becoming more restrictive in admission, enrollment, and recruitment practices, known
as creaming, to improve outcomes on performance funding metrics; (c) weakening of
academic standards to improve outcomes; and (d) narrowing of institutional missions to
focus more on programs that are rewarded more highly in the performance funding
formula (Dougherty & Reddy, 2011; Rutherford & Rabovsky, 2014; Smith, 2015). The
Massachusetts Vision Project included a commitment to increase funding from the
Commonwealth. However, between 2014 and 2016, the first three years of using the
funding formula in Massachusetts to allocate funds to the community colleges,
appropriations for additional funds declined from $20 million to $9.1 million.
Closing the door to a population of students that have no other chance of
achieving their educational and professional goals would be a significant diversion of the
missions of community colleges and pose a significant threat to the educational
5
opportunity of American citizens. This study examined how the MAPFF has intentionally
and unintentionally turned away students because of the performance funding formula by
making attendance less affordable. This information could be useful for Massachusetts,
as well as, other states to design better performance funding programs and adequately
funding colleges so that access is not negatively impacted.
Research Design
Using four community colleges in Massachusetts, I conducted a multiple-case
study on the impact that implementation of performance funding has on the community
college open access mission. This one-time look at these colleges focused on the
immediate impact on operational changes and student tuition and fee increases resulting
from the MAPFF.
As a former senior administrator for a community college in Massachusetts, I
bring my own knowledge and experience into the study. In my position, I witnessed first-
hand the immediate impact of operational changes that were implemented with a view
toward improving student outcomes and performance scores. While the actions taken at
my former institution may have positively impacted student success, they may also have
negatively impacted students with increases in tuition and fees, increased selectivity in
the students being recruited and accepted into the institution, or reductions in program
and course offerings that eliminated or limited enrollment for some admitted students.
Although the MAPFF still incorporates a stop-loss component that guarantees an increase
to each institution regardless of the outcomes measured, results are provided by the
Massachusetts Department of Higher Education that show how each institution would
fair in relation to the other community colleges in the state before applying the stop loss.

6
Pragmatic Philosophical Worldview
A pragmatic worldview provides the philosophical basis for this study. The
pragmatic worldview is not committed to any one system and allows me to choose among
research designs to provide the best understanding of the research problem and to “draw
liberally from both quantitative and qualitative assumptions” (Creswell, 2014, p. 11). In
this study, I focused on the research question of how performance funding immediately
impacts operations that affects the open access mission of community colleges, and use
all approaches available to understand and answer this question. The pragmatic
worldview opens the door to multiple research methods, different worldviews,
assumptions, and forms of data collection and analysis (Creswell, 2014; Teddlie &
Tashakkorri, 2009).
Conceptual Framework
As Maxwell (2013) suggests, it is important for research design to make explicit
which paradigm(s) or theories the study will draw on, “since a clear philosophical and
methodological stance helps explain and justify design decisions” (p. 43). Four main
sources are used to construct a conceptual framework: 1) experiential knowledge; 2)
existing theory and research; 3) pilot and exploratory research; and 4) thought
experiments (Maxwell, 2013).
My experiential knowledge provides the basis for my conceptual framework. As a
former vice president of finance and operations, and a senior, cabinet-level administrator
at a community college in Massachusetts, I spent a considerable amount of time working
with community college funding allocated via the Massachusetts performance funding
formula. I have also worked extensively on developing institutional strategic plans and

7
how they effect change that involves both student access and success. These experiences
gave me a strong foundation and framework to position and develop my study.
As the vice president of finance of a community college in Massachusetts, I
participated in discussions with the president and other senior members of the president’s
cabinet about the MAPFF outcomes each year at my institution. I also participated in
meetings with the vice presidents of finance at most of the other community colleges and
leaders from MDHE, where the MAPFF and the amount of state appropriations were
discussed.
It was my responsibility as the Vice President of Finance to prepare a balanced
annual operating budget for my former institution. In the budget building process I
worked with the other senior leaders to stay within budget guidelines and accomplish
their goals. Having a similar position in another state expands my knowledge and
experience. Thus, my conceptual framework grew from experiential knowledge.
The second source informing my conceptual framework was found in existing
research. Existing research shows that open access continues to be one of the
fundamental missions of community colleges (AACC, 2012; Boggs, 2011; Cohen &
Brawer, 2006; Dowd & Shieh, 2013; MDHE, 2015; Oliver, 1995; Shannon & Smith,
2006; Townsend & Dougherty, 2006). However, some evidence has been found in the
previous research conducted that performance funding has led institutions to initiate
actions to maximize their state allocations from the formula through restrictive
enrollment practices and actions that increased costs of review and compliance with the
formula (Dougherty & Reddy, 2011; Smith, 2015; Tandberg & Hillman, 2013). The
focus of this study was to determine what impact the MAPFF has had on the open access

8
mission of the community colleges in the Commonwealth of Massachusetts in these and
other potential areas. The research conducted thus far does not adequately address the
financial impact on colleges, specifically in their operational budgets and ultimately on
the cost of attendance. Findings of note are instability in funding, funding levels that are
too low, shortfalls in regular state funding for higher education, and inequalities in
institutional capacity (Dougherty & Reddy, 2011, 2013). Previous studies also found
impacts of performance funding on community colleges through actions that restricted
admissions to community colleges and increased costs of compliance and review
(Dougherty et al., 2014, 2016; Dougherty & Reddy, 2011, 2013; Lahr, Pheatt, Dougherty,
Jones, Natow & Reddy, 2014; Hillman, Tandberg & Fryar, 2015). The findings of
restricted admissions and increased costs of compliance in the previous research has
become the basis for my study.
The third source informing my conceptual framework was a pilot study. I
conducted a pilot study using two community colleges in Massachusetts prior to
collecting the qualitative data for this study. The pilot study field-tested the survey and
interview protocols, leading to modifications in content and delivery that helped me
gather the data to answer my research questions. The two institutions used for the pilot
study were not included as one of the four case institutions in the final study.
Finally, I used thought experiments to inform my conceptual framework.
Performance funding programs are designed to improve institutional performance and
student outcomes (Dougherty et al., 2014, 2016; Dougherty & Reddy, 2011, 2013; Lahr,
Pheatt, Dougherty, Jones, Natow & Reddy, 2014; Hillman, Tandberg & Fryar, 2015). My
theory was the senior administrators of the institutions would seek the additional funding

9
offered by the MAPFF and initiate actions to maximize state appropriations that
negatively impacted access in two areas—decreased affordability and restrictive
admissions, enrollment, and recruitment practices.
To initiate actions that will maximize state appropriations and prepare balanced
fiscal year budgets, I theorize that the institutions will need additional revenue to increase
student services staff, increase faculty and advisors, and purchase applications and
systems necessary to generate the student data to monitor and increase student success. A
portion of the additional revenue will come from increased student fees that will decrease
affordability for some students who wish to attend community college. In an effort to
maximize state appropriations, I also believe the institutions will initiate actions to
improve their formula outcomes using restrictive admissions, enrollment, and recruitment
practices found in previous research.
My conceptual framework provides the foundation for my proposition on how the
MAPFF negatively impacts the open access mission of community colleges in
Massachusetts. My position as a Vice President of Finance and the knowledge acquired
of community college finances, my detailed knowledge of the MAPFF, and how the state
appropriations fit into the total revenue of the institutions in Massachusetts, serves as the
experiential knowledge for the framework. Using my experiential knowledge together
with the review and analysis of the existing research provided insight into the impacts
performance funding programs have had on institutions and students and serves as the
second component of the framework. For the third component of my framework, the pilot
study conducted on two institutions in Massachusetts provided the necessary feedback
needed to amend the survey and interview protocols to maximize their effectiveness in
10
gathering the information from the case institutions to help answer my research
questions. Finally, accumulation of my experiential knowledge, the existing research of
the impacts of performance funding, and the feedback from the pilot study, provided the
basis for my thought experiments theorizing that the implementation of the MAPFF will
negatively impact access through restrictive admissions, enrollment and recruitment
activities and actions decreasing affordability.
Multiple-Case Study Design
To determine the impact that the implementation of performance funding has on
the open access mission of community colleges, a multiple-case study was conducted on
four of the community colleges in the Commonwealth of Massachusetts. In particular, the
study focused on the changes the colleges have implemented to improve their
performance metrics, and how these changes have intentionally or unintentionally
impacted access.
The study used quantitative administrative and secondary data, including changes
in state appropriations and changes in tuition and fees from FY2014 through FY2016,
covering the first three years of the MAPFF. To augment the analysis of the quantitative
administrative and secondary data and quantitative surveys, one-on-one interviews were
conducted to uncover the reasons for the changes and generated causal links (Maxwell,
2013). The quantitative administrative and secondary data were collected and analyzed
first, and this was followed up with the collection and analysis of the survey and
qualitative interview data. These data were connected and compared together to
established patterns of behavior that supported my theory that the MAPFF has negatively
impacted student access.

11
Case studies researching the impact that performance funding has had on student
success and outcomes in Tennessee and Florida, Pennsylvania, and Ohio, as well as other
states, have been well documented, Dougherty and Natow (2010); Dougherty, Jones,
Lahr, Natow, Pheatt & Reddy (2014); Lahr, Pheatt, Dougherty, Jones, Natow & Reddy
(2014). While much has been learned about the positive and negative impacts that
performance funding has had on the colleges from these studies, the students, and the
states, few have shown that student success and outcomes are improved by the adoption
of a funding formula (Bragg & Durham, 2012; Dougherty & Reddy, 2011; Lahr, et. al.,
2014).
Each of the states examined in the multiple-case studies above that have adopted
performance funding to appropriate state funds to support the community colleges,
measure and reward student success and outcomes differently. Massachusetts is not an
exception (Dougherty, Natow, Bork, Jones, Vega, 2013). The MAPFF attempts to reward
maintaining access, as well as improving student success, and this study examined if the
formula did enough to maintain access or if it negatively affected it.
When Tennessee first adopted performance funding for public colleges in 1979,
most of the programs employed PF 1.0 programs (Dougherty & Reddy, 2011). These
programs allocated additional money to the public colleges over and above the base
appropriations as “bonuses,” which were to serve as enticements for the colleges to
improve student outcomes, such as numbers of students graduating, retention, and
transfers to four-year institutions.
However, in recent years, more states around the country have adopted new
policies allocating increasingly significant amounts of the appropriations by performance

12
outcomes, what is now called PF 2.0. There are three major reasons for the departure
from bonus allocations in PF 1.0 programs to base allocations in PF 2.0 programs. First,
state officials have questioned if the small percentages of additional funding were enough
to compel significant improvements in institutional practices and student outcomes
(Dougherty & Reddy, 2011; Quintero, 2012). Second, with the current and foreseeable
stagnation of the economy, future state budgets are unlikely to have enough funds to
provide incentives on top of the base allocations for higher education. Lastly, the PF 2.0
programs in Ohio, Tennessee, and Washington were endorsed by the U.S. Department of
Education and national policy groups, such as the National Governors Association, the
National Conference of State Legislators, Lumina Foundation, and the Gates Foundation
(Dougherty & Reddy, 2011; McKeown-Moak, 2013). From a different perspective, some
political leaders believe that public funds should not be used to fund higher education,
noting that as students are the primary beneficiaries of this investment, it is a private good
(Marginson, 2011). I address this debate further below after providing a brief history of
community colleges and their missions.
Organization of the Proposal
The literature review in Chapter II begins with the history of the open access
mission of community colleges in the United States. The history of student success and
completion in community colleges is reviewed, along with defining a public good and a
justification of how a community college education is considered a public good. The
economic impact of community colleges is examined both in Massachusetts and
nationally. The historical funding of community colleges is also examined, along with a
historical perspective of why and how performance funding programs were initiated in

13
Massachusetts and across the country, and the latest renewed interest. The external
pressures that were in play at the state level influencing policy changes for the public
funding for community colleges in some states and leading to the adoption of funding
based on performance outcomes is also examined. Research on the impact of
performance funding on student success is reviewed. A review of the negative
consequences of the implementation of performance funding programs is also reviewed.
Finally, I explain how my study will build upon existing research and how this need to
build upon the existing research served as the impetus for my research project.
Chapter III describes the research methodology and design that was used to
conduct the study, and the data that was collected and analyzed. I also outline why the
research study is being conducted and how the results can inform future studies and
strategies on the implementation of performance funding programs.
Chapter IV begins with a review of how my study will add to the existing
research and recaps the research questions. The findings are then discussed beginning
with the results from the quantitative administrative and secondary data. Next, the
findings from the quantitative and qualitative survey are discussed, followed by the
interviews by case institutions. The chapter continues with a discussion summarized by
common themes found and by the two threats to access. The chapter concludes with a
summary of the findings.
Chapter V presents the conclusions of the study based on the quantitative
administrative and secondary data, quantitative survey data, and the qualitative one-on-
one interviews from the senior-most administrators at four case institutions in

14
Massachusetts. I conclude the chapter with implications for future research, policy, and
practice.

15
Chapter II
Review of the Literature
Chapter II begins with a discussion of the complex mission of community
colleges and the history of the open access mission of community colleges in the United
States. Student success and completion in community colleges is reviewed, along with
defining a public good and a justification of how a community college education is
considered a public good. The historical funding of community colleges in the United
States is examined, along with a discussion on community college governance relative to
decision-making. The external pressures that were in play at the state level of
government, influencing the policy changes for the public funding of community colleges
in some states and leading to the adoption of funding based on performance outcomes are
examined. Performance funding programs are discussed, along with the circumstances
that led to their creation and the transformation from PF 1.0 to PF 2.0 programs. Research
studies on performance funding programs are reviewed together with both positive and
negative impacts.
The chapter continues with a review of Massachusetts Community Colleges and
their economic impact to the commonwealth, followed by a review of the creation of the
Massachusetts Vision Project and the implementation of performance funding programs
in Massachusetts. The chapter continues with a discussion of revenue maximization and
the role it plays in the MAPFF. The chapter concludes with a discussion on how my
study builds upon the research in the field.

16
The Complex Missions of Community Colleges
Community colleges have evolved into highly complex, comprehensive higher
education institutions that have “four enduring values: access, community
responsiveness, creativity, and a focus on student learning” (Boggs, 2011, p. 3).
Community colleges’ missions include student services, career education, developmental
education, community education, vocational and technical education, and transfer
education (Townsend & Dougherty, 2006). According to the Massachusetts Department
of Higher Education (MDHE, 2015), the publicly stated mission of the 15 community
colleges is to
offer open access to high quality and affordable academic programs, including
associate degree and certificate programs. They are committed to excellence in
teaching and learning, and provide academic preparation for transfer to four-year
institutions, career preparation for entry into high demand occupational fields,
developmental coursework, and lifelong learning opportunities. (para. 2)
From their very inception, providing access to higher education for everyone remains a
very important mission for community colleges. Critical focus on open access came from
the Truman Commission, The Carnegie Commission, and the Higher Education Act. Any
move away from open access would be a fundamental change in direction.
The Open Access Mission of Community Colleges
Community colleges are often called the “people’s college” or “democracy’s
college,” with open-door admission policies that admit students regardless of their
academic achievement and create educational opportunities (Dowd & Shieh, 2013).
Community college entrance requirements are for students to have a high school diploma

17
or equivalency or be 18 years old. SAT or ACT scores are not needed for acceptance, but
may be used to place students in appropriate courses, in addition to placement scores on a
state approved instrument, such as the College Board’s ACCUPLACER. Requiring such
placement in pre-degree level courses positions the students for success but also may
control access to degree-level courses and programs.
One of the most important elements of the community college is the open
enrollment policy (Oliver, 1995; Shannon & Smith, 2006). The primary mission of
community colleges in this country is thought to be providing access to higher education
for everyone, regardless of economic means or academic performance. The commitment
of community colleges as an engine of opportunity and economic growth has accounted
for more than 13 million students in credit and non-credit courses annually (AACC,
2012).
The community college open access mission is one of the reasons why the
community college movement grew so significantly in the United States in the 1960s and
1970s. In a report entitled “A Case for the Community College’s Open Mission” in 2006,
the authors make the case for the community colleges’ open mission, and their shared
“commitment to access is as American as the Declaration of Independence” (Shannon &
Smith, 2006, p. 15). The open-door mission of community colleges ensures access to
post-secondary education for all who can benefit, and is the foundation on which all
community college operations rest. Nationally, community colleges enroll many low
income, first generation, educationally disadvantaged, and minority students who would
not otherwise have an opportunity to attend higher education. Significant percentages of
Hispanic American, African-American, Native American, and Asian/Pacific Islanders are

18
enrolled in community colleges (Shannon & Smith, 2006). Moreover, with community
colleges enrolling 41% all U.S. undergraduates, these students are the most at risk of
being left behind by the changing labor market and the shift in the demand for workers
with higher education (AACC, 2019).
After the turn of the 20th century, there is clear evidence of the importance of the open-
access mission of community colleges. Public junior colleges began with a central
mission to provide transfer education for students seeking to pursue a baccalaureate
degree at a four-year institution (Cohen & Brawer, 2006). Early in the 20th century,
educators wanted junior colleges to relieve the research universities of having to provide
general education and serve as buffer institutions that would keep the poorly prepared
students from the universities and only send the brightest students (Cohen & Brawer,
2006). The first public junior college was established in 1902 by extending the Joliet
Township High School by two additional years (Koos, 1947).
Since the 1902 organization of public community colleges, their open-access
mission has evolved. Critical focus for open access came from the Truman Commission,
The Carnegie Commission, and the Higher Education Act. Any threat to the open-access
mission would be a fundamental change in direction. Admitting students regardless of
academic achievement, economic means, race, or religion, into college, also known as
open access or universal access, has become and remains a critical mission of community
colleges in the United States (Dougherty, 2001). Individuals without any post-secondary
education have limited access to good, higher paying jobs (Cohen & Brawer, 2008).
In 1925, the junior college definition was modified to include the development of
“a different type of curriculum suited to the larger and ever changing civic, social,

19
religious, and vocational needs of the entire community in which the college is located”
(Cohen & Brawer, 2008; “Institutional Definitions,” para. 1). As the national economy
became more industrialized and complex, the American people felt the need for higher
education for their children. Community colleges also enroll non-traditional aged
students, who attend college to maintain their jobs, to get re-trained for new jobs, or to
earn a promotion. Many work full time and attend class part time to get ahead in their
lives at an affordable cost. The average age of a student at a community college is 28
with a median age of 23, which is higher than the undergraduate students at many four-
year schools (American Association of Community Colleges, 2012).
For a diverse student population, community colleges have served as the gateway
to higher education and to the middle class (AACC, 2012; Dowd & Shieh, 2013;
Shannon & Smith, 2006). The open-access mission influences admissions and enrollment
processes, curricular structures, faculty hiring, and advising and counseling activities
(Shannon & Smith, 2006). Parallel to and arguably part of the open-access mission is the
commitment to providing a quality education at an affordable cost.
A significant percentage of students graduating from high schools and entering
community colleges require developmental coursework, and this requires the additional
application of resources by the community colleges (Dougherty & Reddy, 2011, 2013).
Community colleges also enroll large numbers of adult students who must attend college
to maintain their jobs, acquire jobs, or earn promotions. These students come with
different needs and requirements that require additional and unique resources from
community colleges to assist them in becoming successful. Continued reductions in state
funding and tying allocations to outcomes does not support the community colleges in

20
spending their limited resources on the neediest students. Shortage of funding limits the
resources to provide staff to support the neediest and most at-risk students. It’s likely that
the access and outcomes mission work against each other in the performance funding
formula for these students (AACC, 2012).
Nationally, almost half of the students who enter community colleges do not
attain their intended goals of earning a degree or certificate, transfer to four-year
institutions, or are still enrolled after six years (American Association of Community
Colleges, 2012). There is clearly room for improving student outcomes. The United
States once led the world in college degree completion. Although according to a report
published by the National Center for Higher Education Management Systems in 2005,
the United States only ranked eighth in the world for degree completion among 25–34
year olds (Jones & Kelly, 2007), a mere seven years later, in 2012, the U.S. college
completion rate dropped to sixteenth in the world for 25 to 34 year olds (American
Association of Community Colleges, 2014, 2012). This change in rank is not due to the
U.S. performing worse than it has in the past, but to its failure to improve and keep up
with advances in other countries.
This growing gap should be a significant concern for the United States’ political
and educational leadership. The “economic competitiveness of the 21st century and
beyond will require the U.S. to succeed at enhancing its stock of human capital” (Jones &
Kelly, 2007), hence, the increasing focus on student outcomes. The following
governmental “acts” and “commissions” focused on access and opportunities for higher
education.

21
Opening the Doors to Higher Education
Truman Commission. In July of 1946, President Harry Truman appointed a
presidential commission, known as the Truman Commission, with the charge to examine
“the functions of higher education in our democracy.” The formation of this commission
marked the beginning of a “substantial shift in the nation’s expectations about who
should attend college” (Hutcheson, 2007, p. 107). The commission’s report espoused two
goals: 1) to educate college students in a broad program of general education; and 2) to
improve college teaching (Hutcheson, 2007), by stating that higher education should be
much more accessible to the nation’s citizens, with approximately half of the nation’s
citizens being capable of completing the first two years of college (Hutcheson, 2007).
The commission report defined the concept of open access as “equal opportunity for all
persons, to the maximum of their individual abilities and without regard to economic
status, race, creed, color, sex, national origin, or ancestry” and called it “a major goal of
American democracy” (Hutcheson, 2007, p. 109).
National Defense Act. President Dwight D. Eisenhower issued a special message
to Congress on January 27, 1958, asking for help in strengthening the American
education system so that it could better compete with the Soviet Union in the areas of
technology and science. “For the sake of national security, Eisenhower called for the
federal government to take emergency action to provide funds to reduce the waste of
talent and promote education in math, science, and foreign language fields” (Cervantes,
Creusere, McMillion, McQueen, Short, Steiner, & Webster, 2005; p11), resulting in the
National Defense Act of 1958, Title II. Advocating for expanded opportunity and access
22
to higher education, this act provided low-interest loans for college students using a need-
based formula, expanding access for students from families with low incomes.
Higher Education Act. One of President Lyndon Johnson’s highest Great
Society priorities was to broaden educational opportunities for all Americans, and his
chief legislative instrument was the Higher Education Act of 1965. President Johnson’s
intention was to help willing individuals receive a post-secondary education that would
lead to a higher income for them and their children and would “benefit the country by
ensuring a steady supply of educated individuals to provide the human resources needed
for economic prosperity” (Cervantes, Creusere, McMillion, McQueen, Short, Steiner, &
Webster, 2005, pg. 17).
Carnegie Commission. The Carnegie Commission for Higher Education (1968–
1973) “made the community college the centerpiece of its call for universal access to
higher education” (Dougherty, 2001, p. 2). The Commission recommended that all states
support the call of the Truman Commission and enact legislation making the community
college “open access” for all persons over the age of 18 who are high school graduates
and who can benefit from continuing education (Dougherty, 2001).
Spellings Commission. In 2006, a commission authorized by then Secretary of
Education Margaret Spellings, known as the Spellings Commission, issued findings
regarding the access, affordability, quality, and accountability of American higher
education. The report describes access to higher education as “limited by the complex
interplay of inadequate preparation, lack of information about college opportunities, and
persistent financial barriers” (Spellings, 2006, p. 8). The skills “expectations gap” and the
need for developmental education reinforces the importance of the community colleges’
23
open-access admission policies and ability to serve the large number of the underserved
and underprepared groups (Horn & Radwin, 2012).
The Spellings Commission’s recommendations on accountability led to the
development of a consumer-friendly information database to improve performance and
transparency throughout higher education (Spellings, 2006, p. 21). This database is more
commonly known as the U.S. Department of Education College Scorecard (USDE,
2017).
Student Success and Completion
American higher education has achieved a great deal of success over the 370
years since the first college was established to train Puritan ministers in the
Massachusetts Bay Colony (Spellings, 2006). America led the world for the percentage of
college educated citizens for a long time but has become complacent and has fallen to
sixteenth in the world in completion rates for 25 to 34 year olds (American Association
of Community Colleges, 2012; Spellings, 2006). Many other countries are now educating
more of their citizens to more advanced levels than we are (Spellings, 2006; Bailey,
Jenkins & Jaggars, 2015). Now in the 21st century, significant and urgent reforms are
needed to not only provide post-secondary educational opportunities, but also to increase
the success levels of our students (American Association of Community Colleges, 2012;
Bailey, Jenkins & Jaggars, 2015). While not everyone needs to go to college, everyone
needs some post-secondary education to prosper and achieve more economic security
(Spellings, 2006).
Students are being lost in high schools and leaving before graduation. There is a
large percentage who are graduating from high school but who have not mastered

24
reading, writing, and thinking skills necessary for college-level work (Spellings, 2006;
Goldrick-rab; 2010; Dougherty & Reddy, 2011, 2013). The nation’s community colleges
are seeing 58% to as much as 63 % of their students take at least one developmental
education course in reading, writing, or mathematics (Horn & Radwin, 2012).
Some students do not enter college because they lack adequate information or
adequate funds to afford the rising costs of post-secondary education (Spellings, 2006).
Institutional quality has been measured by financial inputs and resources, rather than by
institutional comparisons of student learning outcomes to help individuals choose the
most appropriate college (Spellings, 2006). The college report card published on the
Federal Higher Education website was developed as a means to start to provide this
outcome information. Additionally, policymakers lack more comprehensive data to help
them “decide whether national investment in higher education is paying off and how
taxpayer dollars could be used more efficiently” (Spellings, 2006, p. 14).
Student success and completion in post-secondary education is vitally important
for America’s future. “In an increasingly competitive world economy, America’s
economic strength depends upon the education skills of its workers. In the coming years,
jobs requiring at least an associate degree are projected to grow twice as fast as those
requiring no college experience” (Obama, 2013, p. 1). Nearly 80% of new jobs over this
decade will require some post-secondary education or training beyond high school
(Munoz, 2014).
Is Higher Education a Public Good?
The recent recession forced the states to make deep reductions for higher
education funding. However, since the recession, most states have begun to restore some

25
of funding removed during the deep cuts, but funding levels remain below pre-recession
levels. The large funding cuts have led to steep increases in tuition and fees, and spending
cuts that may have weakened the quality of education available to the students (Mitchel,
Palacios & Leachman, 2014). The funding cuts and the actions by the institutions come at
a time when a “highly educated workforce is more crucial than ever to the nation’s
economic future” (Mitchel, Palacios & Leachman, 2014; p1). A report published on job
growth and education requirements through 2020 found that a large portion of future jobs
will require college educated workers (Carnevale, Smith & Strohl, 2013).
For many citizens, the purpose of completing a post-secondary education was to
gain access to better-paying jobs that allowed them to earn more throughout their lives.
But this is no longer the only reason. The United States economy has developed into one
that requires post-secondary skills, and citizens without this may not even have a job
(Matthews, 2013). By the beginning of 2010, the official end of the Great Recession, the
American economy had lost 5.6 million jobs for Americans with a high school education
or less (Matthews, 2013). “If more Americans are educated, more will be employed, their
collective earnings will be greater, and the overall productivity of the American
workforce will be higher” (U.S. Department of the Treasury and Department of
Education, 2012, p. 13).
A highly educated population is fundamental to economic growth and a vibrant
democracy. For the first time, the United States is seeing that younger generations will be
less educated than their parents. A better-educated United States citizen will give
business leaders a better-qualified workforce pool right here in the U.S., so they do not
have to ship jobs overseas. Substantial evidence shows that higher education raises

26
earnings. As individuals gain education, they are less likely to be unemployed (U.S.
Department of the Treasury and Department of Education, 2012). Individuals with only a
high school diploma were nearly twice as likely to be unemployed as those with a college
or advanced degree (U.S. Department of the Treasury and Department of Education,
2012). The skill premium, quantified as the difference between wages for individuals
with college degrees versus high school graduates, amounted to additional earnings of
$2.4 trillion, or 16% of the $15 trillion in total GDP in 2012 (U.S. Department of the
Treasury and Department of Education, 2012). This skill premium cannot be only for
those people who can afford to pay the tuition and fees of the increasingly expensive
private colleges and universities. This highlights the importance of the open-access
mission of community colleges.
The federal government, state, and many local governments around the nation
financially support public higher education through appropriations and direct grants to
students, such as Pell and federal student loans. In Massachusetts, there is no local
government financial support for the colleges. The community colleges in the state
depend on state appropriations and student tuition and fees as their primary sources of
revenue. Government support, along with the economic benefits to the students,
businesses, and the state and local economy, support the notion that public higher
education is a public good. Although the debate as to whether public higher education is a
public or private good may continue, it is clear by the actions of the federal government
and the economic impact of the Massachusetts community colleges that higher education
is a public good, one that all citizens benefit from, both directly and indirectly. However,
the percentage of college costs that are borne by the students has increased significantly,

27
as many states have experienced a decrease in revenues, translating into reductions in the
appropriations for the public colleges. This action has perpetuated the notion that public
education is shifting away from a public good and more towards a private good.
Historical Funding of Community Colleges
The contemporary community colleges in operation now arose in the 1960s in
response to new opportunities and unmet needs and demands of the public junior colleges
established in the early 1900s (Phelan, 2014). When the community colleges were small,
demands on public funds were modest. Today with more than 50% of college-aged
students attending community colleges, and rising institutional budgets, state legislatures
have begun to scrutinize the states’ investment in public higher education (Cohen &
Brawer, 2008). Since the 1960s, funding of the contemporary public community colleges
has varied significantly state by state. The two major sources of community college
operational funding are public appropriations, from both state and local taxing
authorities, and tuition and fees paid by the students. (Minor funding has come from other
miscellaneous income sources, such as facilities rental, commissions from the college
bookstore, and food service, etc.) The exact proportions of each of the major funding
sources varies significantly by state, which reflects the states’ “differing expectations and
goals for community colleges” (Phelan, 2014, p7). Some states chose to keep tuition and
fee rates very low or even at zero and have funded the community colleges at nearly
100% through public appropriations. Other states decided that government appropriations
and tuition and fees should be relatively equal in proportion. Some states choose not to
use local government financial support to fund the community colleges, as is the case in

28
Massachusetts. Regardless of the funding model used, community college funding has
historically been unstable due to the discretionary nature of state support (Phelan, 2014).
Government Funding of Community Colleges
Early in the 1990s, the national recession precipitated a historic decline in the
levels of state support for higher education, with budget cuts becoming commonplace. As
state revenues declined during this period, the funding of higher education, a significant
discretionary line item in state budgets, became an easy target for budget cuts and
redirections of funds for other priorities in state budgets.
During periods when government revenues decline and state budgets are strained,
legislative critics of higher education from both the government and private sector
complain about the quality and quantity of faculty teaching and student learning and the
bourgeoning of administrative positions and support staffs (Burke, 2002). During the
recession of the early 1990s, this criticism focused on undergraduate education and
specifically on “admitting too many unqualified students, graduating too few of those
admitted, permitting them to take too long to graduate, and allowing them to graduate
without the knowledge and skills required for successful careers” (Lively, 1992 in Burke,
2002; p7). An article published in the Chronicle of Higher Education reported that states
were enacting new laws and policies that required colleges to “demonstrate efficiency,
quality, and sound stewardship of public money” (Lively, 1992 in Burke, 2002; p8).
Former New Jersey Governor Thomas Keane, then president of Drew University, stated
that higher education has lost its image and significant changes were necessary to stay in
business (Burke, 2002). This sentiment was substantiated in a report issued during a 1993

29
conference of national leaders in higher education, with a statement that higher education
was failing to meet societal needs (Burke, 2002).
Since the late 1990s and over the next 20 years, there were significant shifts in the
proportions of funding coming from tuition and government support. State revenues
began to pick up larger shares of the funding, which was highlighted by the California
Proposition 13. In the late 1970s, Proposition 13 limited the property tax to 1% of the
property evaluations with a 2% annual increase. As a result, local community college
districts saw their major funding source effectively capped and were forced to look to the
state for more funding. “Within two years, the state of California’s share of community
college revenues increased from 42% to nearly 80%” (Cohen & Brawer, 2008; “Sources
of Funds,” para. 3). Community colleges in states with large systems, such as Colorado,
Florida, North Carolina, Virginia, and Washington, receive as much as 75% or more of
their funds from the state (Cohen & Brawer, 2008; Phelan, 2014). In 2012, New Jersey
state appropriations provided 17% of the community college revenues, local governments
provided 21%, and student tuition and fees provided 62% (New Jersey’s Community
Colleges Facts at a Glance, 2014). In Massachusetts, local governments do not provide
funding to the community colleges. At Cape Cod Community College, the
commonwealth funded 41% of the revenues and the students provided 51% in 2012. The
commonwealth funded 39%, 44%, and 46% in 2013, 2014, and 2015 respectively.
Students funded 50%, 48%, and 45% in 2013, 2014, and 2015 respectively (Audited
Financial Statements of Cape Cod Community College, 2012, 2013, 2104, and 2015).
However, the national average finds the percentage of funding coming from state
appropriations is now at 32.8% (AACC, 2019).

30
Changes in support vary from year to year as well. Public funding was flat during
the 1970s as a result of a decline in the percentage of full-time students, but turned up in
the mid-1980s, remained steady for several years, and increased again in the mid-1990s
(Cohen & Brawer, 2008; Phelan, 2014). As we have seen recently, the percentage of
public funding to community colleges has declined due to the severe and prolonged
recession in the mid-2000s. During the years when the state funding ebbed, the colleges
made up for that shortfall by increasing the percentage of the operating budget
contributed by tuition and fees, decreasing expenditures by deferring maintenance and
equipment purchases, freezing new employment, reassigning staff, and increasing the use
of part-time faculty (Phelan, 2014). Since the 2008 recession began, most states have
deeply cut funding to public colleges, and Massachusetts is no exception. As a result of
these deep funding cuts, public colleges have increased tuition and fees to compensate for
the revenue loss.
The significant increases in tuition “have accelerated longer-term trends of
reducing college affordability and shifting costs from states to students” (Mitchel,
Palacios, & Leachman, 2014, p. 2). However, shifting costs towards students have only
accounted for part of the revenue loss stemming from the state funding cuts. Public
colleges have cut faculty positions, eliminated course offerings, closed campuses, and
reduced services, among other cuts (Mitchel et al., 2014). Rising tuition, deep state
funding cuts, and reducing faculty and student services will have a negative impact on
outcomes as well as access. Adding performance funding to the mix may exacerbate the
impact by forcing colleges to become more selective with regard to the students they

31
admit and/or by increasing tuition and fees. It is my contention that student access is at
risk of being negatively impacted by the implementation of performance funding.
With each ensuing period of increased state funding, the funding patterns also
increased in complexity (Cohen & Brawer, 2008). Four typical models are listed for state
support: negotiated budget, unit-rate formula, minimum foundation, and cost-based
program funding (Cohen & Brawer, 2008).
Negotiated budget funding is primarily used in states where all or nearly all the
community college funds come from the state and is arranged and negotiated annually
with the state legislature or board (Cohen & Brawer, 2008). These budgets are usually
incremental, reflecting the prior year’s support with increases and decreases based on
available funds and changing costs (Cohen & Brawer, 2008).
The unit-rate formula allocates funds to colleges on the basis of full-time
equivalent students, the number of students in certain programs, the credit hours
generated, or a combination of measures, and is used in a majority of states (Cohen &
Brawer, 2008).
In the minimum foundation model, state allocations are made at a variable rate
that depends on the amount of local funding and is a variant of the unit-rate formula
(Cohen & Brawer, 2008). The intention is to allocate more state funds to community
colleges where local support is lower. This is a protection for smaller schools and
remains a portion of the performance funding formula in Massachusetts.
The cost-based funding formula allocates state funds based on budgeted
objectives and instructional categories using actual expenditures (Cohen & Brawer,
2008). Local funds may or may not be part of the formula. There are significant

32
variations among institutions state by state (Cohen & Brawer, 2008). Because of the
differences and the complexities of this type of funding, “absolute parity among the
institutions can never be achieved” (Cohen & Brawer, 2008; “Allocation Patterns,” para.
6). The performance funding models that are now in vogue in many states add even more
complexity by adding completion and student success measures to the mix.
Community College Governance
Governance can be defined as “a rationale, focused on decision making.” (Cohen
& Brawer, 2008; “Categorizing Governance,” para. 1). Three models have been used to
explain the governance structure of community colleges: bureaucratic, political and
collegial (Cohen & Brawer, 2008). The bureaucratic model is a formal structure with
defined patterns of activity, with the organization held together by authority delegated
from the top down. Political models assume a “conflict among contending forces,
students, faculty, administrators and trustees, each with different interests.” (Cohen &
Brawer, 2008; “Categorizing Governance,” para. 2). The collegial model is a structure
whereby the trustees share their authority with students and faculty, as well as with
administrators (Cohen & Brawer, 2008). The collegial model is more of a theoretical
model rather than an actual structure in use (Cohen & Brawer, 2008). The bureaucratic
and political are the most applicable to community colleges (Cohen & Brawer, 2008).
The community colleges in Massachusetts are part of a state bureaucratic system
of higher education. Each community college has a board of trustees appointed by the
Governor. Each community college president reports to the board of trustees and meets
with them monthly. Each of the community college presidents has a governing cabinet
made up of the senior-most administrators at the institution who report directly to the

33
president. Typically, the senior most administrators include the vice president of finance,
vice president of academics or provost, the senior human resources officer, vice president
of student services, and the senior information technology officer. Some institutions
include other administrators on the president’s cabinet, such as the senior institutional
research officer and other senior leaders unique to the institution.
During the time I was a vice president of finance at a Massachusetts community
college, at my institution and the other 14 institutions, the presidents and their cabinets
were responsible for leading strategic decision-making, including by not limited to,
tuition and fee rate increases, institutional budgets, and staffing. The vice presidents of
finance were responsible for leading the analysis and guiding the cabinet discussions on
budgeting and suggesting increases in tuition and fee rates for the institution. The boards
of trustees were provided monthly financial reports on year-to-date budget versus actual
results. Fiscal-year budgets that include all revenue sources, including state
appropriations, are recommended by the president through work completed by the vice
president of finance and other cabinet members and presented to the boards of trustees for
approval. When suggesting increases to tuition and fees the students pay, the president
and the vice president of finance conduct open campus meetings where the rationale for
the increases are explained and discussed with students, staff, and faculty. In most cases,
these open campus meetings are perfunctory at best. Understanding the community
college governance and decision-making structure is important to understand the findings
and conclusions of my study.

34
Performance Funding
Performance funding programs are designed to improve institutional performance
and student outcomes (Dougherty & Reddy, 2011). The outcomes are measured in the
formulas and are used as a basis for allocating state appropriations. Performance funding
programs provide incentives to the institutions that “mimic the profit motive for
businesses” (Dougherty & Reddy, 2011, p.2). The formula awards more state
appropriations to institutions that outperform most of the other institutions in the
commonwealth in the specific metrics contained in the formula.
By the early 1990s, strained government budgets, the criticism over the high cost,
inefficiencies, and poor results of public higher education produced negative reactions
toward public higher education. Conservative Republicans captured many of the
governorships and state legislature seats on campaign pledges to cut spending for state
programs, including higher education, which was characterized as just another
government program with education leaders as one more interest group. As a result, the
linking of state resources to campus results became an attractive policy alternative in
state capitols (Burke, 2002).
State funding of colleges linking budgeting to performance differs from the cost-
plus based budgeting by allocating resources for achievement of defined results.
Connecting resources to results in state budgeting took on two different forms,
“performance funding” and “performance budgeting” (Dougherty & Reddy, 2013).
Performance funding ties specific resources to institutional results based on a predefined
formula. Achieving good results on a designated indicator or metric, the campus receives
a specific amount of performance money for that measure. Performance budgeting has no

35
explicit formula tying performance to funding (Burke, 2002). The governing bodies
consider an institution’s past performance as one factor in determining their funding
allocations (Burke, 2002).
Performance Funding 1.0 vs. 2.0. Performance Funding 1.0 (PF 1.0) programs
provide small amounts of additional funds over and above state appropriations for
improvement in the performance of students on success and persistence measures
(Dougherty & Reddy, 2013). Performance Funding 2.0 (PF 2.0) programs tie the
colleges’ base state appropriations at various percentages to improvements in the
performance of students on success and persistence measures (Dougherty & Reddy,
2013).
Massachusetts introduced a performance funding formula (MAPFF) to allocate
state appropriations to the community colleges to increase accountability of the
institutions for the successful outcomes of their students. Several legislative concerns are
addressed by tying the state appropriations to enrollment and performance metrics: 1)
assess and reward colleges reflecting the goals of the MDHE’s Vision Project and other
priorities of the legislature; 2) address disparities and inequities in state funding between
colleges on a per student basis; and 3) add assurance that efforts to stop the growth in
student charges are instituted (Lenhardt, 2013). The annual cost to attend a community
college in Massachusetts is among the highest in the nation. During the 2015–2016
academic year, the total cost to attend a community college in Massachusetts was in
excess of $5,500 (MDHE, 2016). Below average state investments in higher education
have forced increases in mandatory fees at the community colleges and state universities.

36
The report published by CCRC on the impacts of state performance funding
systems in the U.S. found that beginning in Tennessee in the late 1970’, policy-makers
were seeking new ways to improve institutional performance and student outcomes.
Institutions could earn a bonus of 2% over and above their annual appropriations for
achieving performance goals outcomes (Dougherty & Reddy, 2011). Tennessee added
and dropped various performance indicators over the years and increased the percentage
of additional funding that institutions could earn from 2% to 5.45% of the base
appropriation (Dougherty & Reddy, 2011).
As of 2015, 32 states have operated a performance funding program in one form
or another, and several states are in formal discussions about it (Table 1; National
Conference of State Legislators, 2016). Most of these programs have been PF 1.0
programs or programs that involve supplements to the base state funding. However, in
recent years, a growing number of programs have re-emerged as PF2.0 models, which
allocates some base state funding to the institutions on the basis of performance
(Dougherty & Reddy, 2013).

37
Table 1
Status of College Financing Tied to Performance
In Place at 2-Year
Institutions
In Place at 4-Year
Institutions
In Place at 2-Year and
4-Year Institutions In Transition
New York
Wisconsin
Texas
Wyoming
Hawaii
Massachusetts
Maine
Pennsylvania
Arizona
Oregon
Virginia
North Carolina
Florida
Ohio
Indiana
Michigan
Illinois
Missouri
Arkansas
Louisiana
Oklahoma
Kansas
North Dakota
Montana
Colorado
New Mexico
Utah
Nevada
Connecticut
Vermont
Iowa South Dakota
Note. Adapted from Jones (2013).
The shift from enrollment and access-based funding to performance-based
funding is not a new concept. Institutions have received appropriations from the state for
achieving certain objectives, most often for growing enrollments and providing greater
access (Jones, 2012, 2013). In the past, institutions were rewarded by their respective
states for increasing access and enrolling more students. Enrollment-driven formulas
were the norm, with access strongly in the financing policy, and the “decision makers
became very good at devising ways to appropriately reward improvements in student
access” (Jones, 2012; p2). Performance funding itself is not new; “it’s the objectives for
which the incentives are being provided that are new; access is no longer the dominant
goal” (Jones, 2012, p. 2). Increased degree production has now taken over as the

38
dominant goal in many states. Now, decision-makers are trying to become equally adept
in devising ways to fund institutions based on student outcomes and success, which
validates the previous reference that management behaviors at community colleges are
increasingly being incentivized to imitate behaviors found in the business sector, with
economic goals driving institutional strategies and actions (Levin, 2005; Dougherty &
Reddy, 2011).
Tennessee’s program, the first of its kind, and its reformulation, exemplifies the
desires of the state’s goal to address widespread dissatisfaction with enrollment-based
funding and the growing public concern over outcomes assessment for higher education
(McLendon, 2013). The first iteration of the Tennessee performance-based funding
program, providing supplemental funding over and above base state allocations, featured
external accountability as well as institutional improvement goals. With support from the
Federal Fund for the Improvement for Postsecondary Education, the Ford Foundation,
and the Kellogg Foundation, the policy was implemented at several pilot campus sites,
with close involvement of the Tennessee Higher Education Commission. The pilot's
success propelled legislative action. At the time, campus leaders hoped that by
demonstrating the higher education community's commitment to active performance
assessment, they could forestall the imposition of a more restrictive state accountability
system (McLendon, 2013).
On the extreme end of the PF 2.0, state programs, such as those previously
employed in South Carolina and currently in Tennessee and Ohio, where 100% of the
higher education appropriations were based on performance, have experienced problems
during implementation because the uniform allocation approach insufficiently accounted

39
for the differences among the individual institutions’ missions (Kelderman, 2019). This
uniform approach was not accepted by each of the institutions and proved to be
controversial and costly, both in political and economic terms (McLendon, 2013). With
steep declines in tax funds available for higher education, the uniform allocation of
appropriations without consideration of institutional missions and the absence of
evidence that performance-based funding programs enhance institutional performance in
a cost-effective way, led to the discontinuation of the program, as it did in other states
(McLendon, 2013). However, as a result of some influential organizations, such as the
Bill and Melinda Gates Foundation, Lumina Foundation, National Governors
Association, Complete College America, and the National Conference of State
Legislators, a resurgence of performance-based funding is being seen and is one of the
most popular state policy trends in higher education (Hillman, et al., 2015).
Concerns that the United States is falling behind other countries in degree
completion and not keeping pace with labor market changes are leading state policy-
makers to align colleges better with state policy goals by funding colleges using a
performance-based program (Hillman, et al., 2015). State policy-makers believe that
“funding colleges according to their outputs, rather than inputs, incentivizes and
motivates colleges to increase degree productivity” (Hillman, Tandem, & Fryar, 2015; p
1). Quality improvement incentives funded by the Lumina Foundation were made in 11
states where significant commitments to a PF2.0 program allocating base state
appropriations has been tied to performance (McLendon, 2013). The PF2.0 programs
have distinct features that were more strongly emphasized than the earlier PF1.0
programs, including (a) the funding of degree production for the emerging economy; (b)

40
development of workforces prepared for the states’ perceived future needs; (c)
recognition that missions, measures, and incentives are more tightly and efficiently
linked; (d) incorporation of 'throughput” indicators such as, rates of student completion of
gateway courses, along with outcome measures; and (e) recognition of the financial and
political stakes are in play (McLendon, 2013). Tennessee’s experience with the initial
PF1.0 program and its current reformulated PF2.0 program is illustrative of the factors
driving the initial and now renewed interest in performance funding (McLendon, 2013).
Performance Funding Research
Much of the current and recent research on PF predominantly describes how it
works, the motivations behind implementing it to allocate state appropriations (Burke &
Serban, 1998; Harnisch, 2011; Dougherty, Natow, Bork, Jones, Vega, 2013; Dougherty
& Reddy, 2013; Friedel, Thornton, D’Amica, Katsinas, 2013; McKeown-Moak, 2013),
the stability of PF programs throughout the country (Burke & Modarresi, 2001;
Dougherty, Natow, & Vega, 2012), and to a lesser extent, the impacts on student
outcomes (Hillman, Tandberg, & Gross, 2014; Tandberg & Hillman, 2013; Rutherford &
Rabovsky, 2014). Increased expenditures without proportionate increases in public
financial support may lead to increases in the cost of attendance for students. Some of the
research also describes the potential negative impacts that include increased expenditures
by the institutions on instruction, student services, institutional research staff, systems
and analytical tools, and more selective admission processes (Wood, 2007; Shin, 2010;
Dougherty & Reddy 2011; Dougherty et al., 2014; Lahr, Pheatt, Dougherty, Jones,
Natow, & Reddy, 2014; Hillman, et al., 2015).

41
Case studies conducted on colleges and universities in the Tennessee Higher
Education System and Woodland Hills Community College in Oklahoma proved to be of
great interest and have become models for my case study.
Twenty-year history of performance funding at the University of Memphis.
The Tennessee study reviewed the performance-based funding program from its
inception in 1979 over a 20-year period. In 1974, the Tennessee Higher Education
Commission, the state’s coordinating agency for higher education and the agency having
the responsibility for developing policies for the equitable distribution of use of public
funds, initiated a five-year performance funding pilot program. The funding from the
Improvement of Postsecondary Education, the W.K. Kellogg Foundation, The Ford
Foundation, and one anonymous Tennessee foundation was used to conduct this study
(Latimer, 2001).
Latimer (2001) conducted a qualitative case study incorporating documentary
data, interviews, and observations of past and present campus staff to determine the
extent of the awareness of the PF policy and its purpose, the extent that PF affected
educational decision-making, and to determine what strengths, liabilities, and reform
suggestions of the PF policy are identified at the University of Memphis. The study found
that the awareness of and the implementation and execution of the PF policy at the
University of Memphis was largely an administrative function, with very little shared
information pertaining to the policy outside of the members of the president’s cabinet
(Latimer, 2001). The information that was shared focused on how the university did
during the year versus what can be done to improve in the future.
42
Early in the inception of the PF program, there was a high level of interest in the
policy, but interest declined as the years continued and the policy became viewed as an
administrative and regulatory burden. Understanding the mechanics of the PF policy
frequently rested solely with the PF officer position, a separate and unique position that is
in addition to the vice president of finance at the university. Very few administrators
could name more than a few performance indicators. This study also found that early in
the implementation of the PF policy, the university’s leadership used it to create modest
change at the institution. The administrators used the policy to make difficult academic
decisions that needed be made and that might not have been made otherwise (Latimer,
2001). The early leaders at the university found that PF was responsible for the
implementation of outcomes assessment and a significant motivator for some of the
departments to undergo accreditation.
This study also cited several identified weaknesses with the PF program,
including that there was no direct linkage between its execution and the PF funds that
come back to the institution, and that the indicators, scoring, implementation, and
reporting became too unwieldy and burdensome for the amount of funds it returned to the
university. The PF allocations for the university ranged between $40,000 and $50,000
from year to year, which is considered to be very minimal. All of the administrators
interviewed for this study had negative attitudes towards the PF policy, and the lack of
rewards for their efforts have led to a minimalist view of it (Latimer, 2001). However,
there was no mention of the impact the PF program had on the students and their access
to higher education.

43
The finding that early on in the implementation of PF, it drove a significant
change at the university and in the later years it no longer drove the strategic planning
process, is important for my study because PF in Massachusetts is its fourth year of
implementation and potentially at a point where the community colleges may be using it
to make significant changes and at a point where it may manifest some negative impacts,
most importantly decreased access.
The impact of performance-based funding at Woodland Hills Community
College. Wood (2007) conducted a research study at the Woodland Hills Community
College in Oklahoma to explore the impact of PF since its inception in 2001. The
researcher sought to determine the perception of campus stakeholders of the new PF
policy and the effects it had on instruction, programs, and administrative functions at the
institution. A qualitative case study design was conducted to examine how the PF policy
had been accepted, implemented, and championed within a single institution (Wood,
2007). Interviews were the primary method of data collection.
The PF program implemented at Woodland Hills Community College focused on
the success of first time, full-time students at the institution, with student success
narrowly defined as the retention and graduation for this cohort of students. The findings
suggest that PF did have an impact at the institution since its inception in 2001, but
shortly thereafter became “invisible” below the level of the vice presidents (specifically
the vice president of finance and the academic and student services vice presidents)
(Wood, 2007; p.134). This finding is consistent with the Tennessee study cited
previously. An interesting finding in this study was that the PF program prompted the
institution to spend money and personnel resources to attract “young, traditional students

44
that have a strong chance of maintaining good grades and staying in school until
graduation” (Wood, 2007; pg. 135). This cohort of students at Woodland Hills
Community College was only 10% of the total student body at the time of the study. It is
possible that Woodland Hills Community College, by targeting young, traditional
students with a strong chance of maintaining good grades and staying in school,
implemented a more selective admission and recruitment strategies. The evidence of
selected admissions as a result of the implementation of performance funding in multiple
studies supports the focus in my study on admissions and recruitment practices.
Impacts of Performance Funding
The studies of performance funding to date have focused on the impacts that this
method of allocating and rewarding state appropriations has had on student outcomes,
how these impacts are produced, and what obstacles and unintended effects are
encountered (Dougherty & Reddy, 2011).
Some positive impacts of performance funding. The research conducted thus
far on the impacts of performance funding programs in higher education has revealed that
there are some very positive impacts as a result of the implementation of these programs.
Performance funding is producing organizational changes that are intended to produce
improved student outcomes. As a result of implementing performance funding at the
Woodland Hills Community College, new programs were started that were designed to
connect students together by getting them involved with campus activities outside of the
classroom as a strategy to improve student retention and graduation rates (Wood, 2007).
By increasing student retention, enrollment improves, increasing tuition and fee revenue
for the institution, which would make up for a loss of state appropriation revenue.

45
Dougherty and Reddy (2011) conducted a summary of research in Tennessee,
Florida, Washington, Missouri, North Carolina, and South Carolina that shows that as a
result of state performance funding, colleges are making substantial changes to their
academic departments’ organizational structures, as well as academic programs and
curricula. Several of the studies conducted on these states with the top administrative
institutional leaders revealed that alterations were made to course and instructional
content and testing to improve performance by the students. Additionally, changes were
made in student services, advising, and tutoring functions so that students can become
more successful and the institutions can improve their performance metrics (Dougherty &
Reddy, 2011). These changes included hiring more staff and opening these offices for
longer hours during the week and on weekends to accommodate the numbers of students
that require these services. Colleges have made or are planning to make: (a) greater use of
data, (b) better institutional planning efforts, (c) more awareness of their performance, (d)
increasing awareness of state priorities, (e) increasing capacity to engage in
organizational learning and change, and (f) changes in institutional finances (Dougherty
& Reddy, 2011, 2013). State accountability mandates, such as tying funding to student
outcomes in the PF model, do influence the use of data for decision-making by the
community colleges (Kerrigan, 2010). By gathering and analyzing data on the outcomes
measured in the PF formula, institutions will become more aware of their effectiveness
with student success and provide input to improve institutional planning. Additionally,
there is evidence that performance funding prompts colleges to make substantial changes
to their academic and student services policies, programs, and practices (Dougherty &
Reddy, 2013). An example of this is hiring additional advisors and counselors that can

46
service more students, changing student orientation and making it mandatory for all new
incoming freshmen, and using technology to identify students who may be falling behind
and in need of tutoring and other student services (McPhail, 2011).
The top administrative leaders at the institutions in these studies indicated they are
using the performance funding programs for strategic analysis and planning. A study
interviewing the top campus officials at 14 Tennessee two-year colleges concluded that
assessment-based improvements have fostered more comprehensive and responsive
college planning (Dougherty & Reddy, 2011). Studies in Tennessee, Florida,
Washington, Missouri, North Carolina, and South Carolina found that academic practices
and department staffing were changed in response to the performance funding demands
(Dougherty & Reddy, 2011, 2013). There was also evidence found that awareness of the
performance funding programs is not diffused throughout the institutions (Dougherty &
Reddy, 2011). “As one moves down the chain of authority, knowledge about state
funding drops considerably” (Dougherty & Reddy, 2011, p. 17). Although the institutions
have made these changes in response to performance funding programs, evidence has not
been found that student success has improved because of them.
Macro and micro analytical performance funding studies, conducted within and
across states, were conducted and reported by Hillman, Tandem, & Fryar (2015) in the
Journals of Educational Evaluation and Policy Analysis and Rutherford and Rabovsky
(2014) in the Annals of the American Academy. These researchers found that states with
performance funding programs (1.0 or 2.0) compared to states not employing
performance funding programs, demonstrated little improvement in educational
outcomes. These studies showed similar results at the micro level for outcomes within the

47
State of Washington’s performance funding program, with little evidence that
performance funding produces improvements in student outcomes, with the exception of
short-term certificates. In fact, evidence has surfaced that shows that current performance
funding policies may contribute to lower performance over a longer period of time
(Rutherford & Rabovsky, 2014). My study was conducted using institutions within
Massachusetts and thus was at a micro analytical viewpoint. As stated earlier, the
performance funding research found focused more on finding effects on student
outcomes, obstacles, and unintended effects encountered with the implementation of the
performance funding programs. The unintended effects of performance funding cited in
the research to date have revealed impacts on enrollments through restrictive admission,
enrollment, and recruitment practices, but not through the primary focus on access.
Negative consequences of performance funding. Although there are some
positive things that are happening due to performance funding, there are also some
negative impacts of performance funding programs. To improve student success and to
meet and exceed the performance funding benchmarks, some community colleges in
Florida and Missouri have restricted admission of less prepared students to boost
retention and graduation rates by what has become known as “creaming” (Dougherty &
Reddy, 2011). A community college official in Florida stated that one institution did not
want to attract students with poor academic records, stating, “it is not who you start with,
it is who completes that matters” (Dougherty & Reddy, 2011, p. 42). One community
college in Florida also discontinued its disability services because the low retention and
job placement rates did not justify the high cost of these services. These studies also
revealed evidence that the intentional strategy to bypass high schools for recruiting

48
because of the low success rates of their students affected enrollment of minority and
low-income students (Smith, 2015; Tandberg & Hillman, 2013; Dougherty & Reddy,
2011). Three studies conducted on community colleges in Tennessee, one in Florida, and
one in Washington revealed that academic standards were intentionally weakened to
boost the success rates of students (Dougherty et al., 2013). The evidence of “creaming”
found in this study revealed in several community colleges and the implementation of a
strategy of by-passing high schools for recruiting students because of low success rates,
indicates that performance funding has negatively impacted access at some institutions
and supports the need for my study. Additionally, two Florida studies, one study in North
Carolina, and Washington revealed that some institutions were weakening academic
standards and inflated grades (Dougherty & Reddy, 2011).
In a 2014 case study by Lahr et al. (2014) on the unintended impacts of
performance funding on community colleges and universities in Indiana, Ohio, and
Tennessee, the most frequently cited unintended impact of performance funding on
student access was restricting admission of less prepared students. This study identifies
the types and numbers of unintended impacts, actual or potential, of state performance
funding policies on higher education institutions. The study describes that across the 18
institutions studied, at six of nine community colleges and eight of nine universities,
interviewees discussed the prevalence of restricted admission practices (Umbricht,
Fernandez, & Ortagus, 2017; Lahr et al., 2014).
The researchers chose nine community colleges and nine universities across
Indiana, Ohio, and Tennessee because “they differ substantially in their performance
funding histories, political, and socioeconomic structures” (Lahr et al., 2014; p 7). The

49
researchers differentiated between observed unintended impacts and potential unintended
impacts because of the relatively recent adoptions of performance funding programs in
several of the states (Lahr et al., 2014). The researchers found that restricting admissions
included the following practices: raising admission requirements, selective student
recruitment, and targeting financial aid (Lahr et al., 2014). Studies in Florida, North
Carolina, and Washington also found that performance funding can lead to “narrowing of
institutional missions that are not rewarded or minimally rewarded by the performance
funding programs” (Dougherty & Reddy, 2011, p. 40; Hillman et al., 2015; Tandberg,
Hillman, & Barakat, 2014).
To date, there has been little evidence that shows that performance funding has
influenced student completion and success. However, there is a growing concern that
maintaining access and improving the success of the students will be financially difficult
for the institutions (Bragg & Durham, 2012; Lahr et al., 2014). Former President
Obama’s American Graduation Initiative has “refocused higher education from access to
completion” as the primary measure of success for community colleges (Bragg &
Durham, 2012, p. 107). Consequently, community colleges may be caught in an
untenable position by offering the primary pathway to higher education for historically
underserved students, including learners who are underprepared for college-level
coursework and struggle to finish, and their ability to demonstrate student success. “If the
definition of college success shifts from access to completion without recognizing that
access and success are inextricably linked, community colleges are vulnerable to
criticism and possibly reduced public support” (Bragg & Durham, 2012, p. 107).
50
Bailey, Jaggars, and Jenkins (2015) suggest that community colleges are
considered to be the low-cost alternative for higher education. Bailey, Jaggars, and
Jenkins (2015) also suggest that the current trend of community colleges adopting the
guided pathway models that focus on student persistence and completion, focuses on high
quality completions. This is the goal of the many performance funding formula metrics.
However, existing state and federal funding formulas make it difficult for colleges to
make the necessary investments to retain students over time (Bailey et al., 2015).
Community colleges are designed to provide open access to higher education at
affordable costs. As state appropriations for higher education have declined over the past
decade, and to keep tuition and fees as low and affordable as possible, community
colleges have taken measures to reduce operating costs using three primary methods: (a)
increasing reliance on part-time instructors, (b) increasing student-to-faculty ratios, and
(c) using fully online instruction. Unfortunately, research has shown that considering
these measures to control and reduce operating costs, completion and success rates have
been hurt. Studies have shown that greater reliance on adjunct instructors reduces student
completion because these part-time instructors are paid to teach courses, not assist
students outside the classroom or participate in program development (Bailey, Jaggars, &
Jenkins, 2015). The second method of reducing operating costs, increasing student-to-
faculty ratios, reduces the quality of the instruction. While this measure saves money in
the short run, the longer-term effect is a reduction in the quality of education (Bailey,
Jaggars, & Jenkins, 2015). A third method of reducing the per-student costs of education
is using fully online instruction. Fully online instruction may help reduce the cost of
instruction but also may lessen faculty engagement in collaborative activities that can

51
improve student persistence and success. Increased reliance on part-time instructors,
increasing student-to-faculty ratios, and using fully online instruction are effective in
reducing and controlling operating costs in the short term but do not increase student
persistence and success and the successful implementation of guided pathways, (Bailey,
Jaggars, & Jenkins, 2015).
Beginning of Massachusetts Community Colleges
In 1958, then Governor Foster Furcolo, a liberal democrat, introduced a bill to
create a statewide system of community colleges in Massachusetts (Burns, 2005).
Governor Furcolo’s vision was to “provide educational opportunities within commuting
distance to students of all socioeconomic backgrounds” (Burns, 2005; p7). Governor
Furcolo enabled the Commission on the Audit of State Needs to look at several major
policy areas of the state, with education and the “critical need to provide adequate
educational opportunities for students of all ages” as a first priority (Burns, 2005; p.8). In
the commission’s report, numerous benefits of community colleges were cited, including
1) families saving money; 2) increased interest in the pursuit of higher education; 3)
building a larger talent pool for business and industry; 4) saving money for the taxpayers
because they would not have to pay for a costlier expansion of the state residential
colleges; and 5) increased knowledge and skills of the state’s and nation’s citizens
(Burns, 2005). Governor Furcolo believed that community colleges should provide
educational opportunities for all citizens and made the case for public higher education
being a public good because the state and the nation would gain from it. This was the
original commitment to an open-access mission. The publicly stated mission of the

52
community colleges found in the Massachusetts Department Higher Education web page
reads:
The 15 Community Colleges (also known as the Governor Foster Furcolo
Community Colleges) offer open access to high quality, affordable academic
programs, including associate degree and certificate programs. They are
committed to excellence in teaching and learning and provide academic
preparation for transfer to four-year institutions, career preparation for entry into
high demand occupational fields, developmental coursework, and lifelong
learning opportunities.
Community colleges have a special responsibility for workforce
development and through partnerships with business and industry, provide job
training, retraining, certification, and skills improvement. In addition, they assume
primary responsibility, in the public system, for offering developmental courses,
programs, and other educational services for individuals who seek to develop the
skills needed to pursue college-level study or enter the workforce.
Rooted in their communities, the colleges serve as community leaders,
identifying opportunities and solutions to community problems and contributing
to the region’s intellectual, cultural, and economic development. They collaborate
with elementary and secondary education and work to ensure a smooth transition
from secondary to post-secondary education. Through partnerships with
baccalaureate institutions, they help to promote an efficient system of public
higher education.

53
The community colleges offer an environment where the ideas and
contributions of all students are respected. Academic and personal support
services are provided to ensure that all students have an opportunity to achieve
academic and career success. No eligible student shall be deprived of the
opportunity for a community college education in Massachusetts because of an
inability to pay tuition and fees. (p. 1)
The publicly stated mission of the Massachusetts community colleges espouses
open access and a high quality, affordable education for the states’ citizens. Together
with the Vision Project, the Performance Funding Formula measures access, improving
student outcomes and holding the public institutions of higher education accountable for
results. However, without a consistent and substantial investment in public higher
education by the Commonwealth of Massachusetts, achieving all three of the stated goals
may not be possible.
Massachusetts Economic Influence of Community Colleges
Massachusetts prides itself in ranking among the top five states in the nation in
the increase of state appropriation for public higher education in 2013. “Brainpower is
our signature economic edge and failing to invest in that in Massachusetts would be like
Texas failing to invest in the oil industry or Iowa failing to invest in corn. “In
Massachusetts, we know in order to grow jobs and unlock economic opportunity; we
must put a college education in reach of all of our students” (MDHE, 2013, p. 4).
In 2002, Ed Moscovitch of Cape Ann Economics was engaged to research and
prepare a report of the economic impact for the investment in community colleges in
Massachusetts. The report stated that the greatest benefit of a Massachusetts community

54
college education to students is the “more than doubling of their full-time earnings
potential” (Moscovitch, 2002, pg. 1). Additionally, the report stated that “over the course
of a student’s working life, the increase in earnings attributable to a community college
education is $330,000” (Moscovitch, 2002, p. 1). Community colleges provide higher
education opportunities for students who might not otherwise have access to higher
education. The greatest benefit of community colleges to the commonwealth’s economy
is the increase in both personal income and the taxes resulting from the increased
earnings of community college students (Moscovitch, 2002). “Over the 30 year working
life of the students educated in FY2011 at community colleges, the commonwealth can
expect $25.2 million in additional tax revenues” (Moscovitch, 2002, p. 4). Also, spending
by the community colleges and students stimulate increased economic activity
(Moscovitch, 2002).
Massachusetts Vision Project
In a response to concerns over the rising costs of college and a new sense of
urgency about the need for excellence in Massachusetts public higher education, then
Governor Deval Patrick and the Massachusetts Legislature developed the Vision Project
to strengthen academic performance while holding the public institutions accountable to
the public for results (MDHE, 2013). In May of 2010, the Massachusetts Board of Higher
Education (BHE) approved the Vision Project performance agenda for community
colleges, state universities, and the University of Massachusetts. The goal of the Vision
Project is to demonstrate that public higher education can act in a unified and focused
way to ensure the future well-being of the commonwealth and be accountable for the
results to the people of the state (MDHE, 2010). The Vision Project was adopted to

55
provide a framework for the system wide and campus level activity, focusing on two
goals: 1) to produce the best educated citizenry and workforce in the nation; and 2) to be
a national leader in research that drives economic development.
The 2012 first annual report of the Massachusetts Vision Project, Time to Lead,
reported that the growth of high-wage jobs in Massachusetts comes mostly from health
care, finance, technology, education, and life sciences. The report states that for the
commonwealth to compete effectively for jobs, investment and talent, and sustain our
rich civic and cultural lives, Massachusetts needs to be the best educated citizenry and
workforce in the nation (MDHE, 2012). The overarching goal that summarizes the Vision
Project is to move the commonwealth to be a national leader in public higher education
(MDHE, 2013). The Vision Project outlines seven key outcomes, namely: college
participation, college completion, student learning, workforce alignment, preparing
citizens, closing achievement gaps, and research. The MDHE will compare and measure
the commonwealth against the rest of the nation in specific objectives in each of the
seven key outcomes.
The commission’s report to the General Court of Massachusetts recommended
“the commonwealth should allocate additional funding to the community colleges, state
universities, and the University of Massachusetts System, and should also increase
funding for state financial aid” (Malone, 2014, p. 19). The commission’s report noted that
in 2012, 52% of undergraduate students in Massachusetts attended an institution of
higher education in Massachusetts, with nine out of 10 graduates remaining in the state.
The report also stated that an increased investment in state financial aid will
“dramatically enhance student’s access to higher education.” Uneven and below-average

56
state investments in higher education have forced increases in mandatory fees at the
community colleges and state universities, and these increases have caused students and
families to be responsible for a greater share of college costs. As noted above, during the
2015–2016 academic year, the total cost to attend a community college in Massachusetts
was in excess of $5,500 (MDHE, 2016).
In 2009, the Massachusetts Board of Higher Education asked then Commissioner
of the Massachusetts Department of Higher Education (MDHE), Richard Freeland, to
establish a task force to develop a performance funding formula and engage the National
Center for Higher Education Management Systems (NCHEMS) to aid in the analysis and
development of the formula (Nelson & Keller, 2012). Thus, he was prepared in July of
2011, when the Massachusetts State Legislature instructed the Department of Higher
Education to create a performance funding formula based in part on the goals of the
Vision Project. Commissioner Freeland stated in the annual report on the Vision Project
that a funding formula for the Massachusetts Community Colleges would allocate
appropriations to the individual community colleges based in part on performance
(MDHE, 2013). The report outlined the numerous legislative concerns delineated in the
new formula, including: 1) ensuring that performance by community colleges supported
by public monies would be assessed and rewarded based on a series of metrics that both
reflected the MDHE’s Vision Project and reflected other policy priorities of the
legislature; 2) ensuring that disparities/inequities in state funding between colleges on a
per student basis would be addressed; and 3) making sure that efforts to stop the growth
in student charges are instituted. In July 2013, the Massachusetts legislature approved the
community college performance funding formula and began to distribute the state

57
appropriation in fiscal year 2014. The legislative concerns delineated in the MAPFF was
found in research conducted in several states to reduce the growth of the cost of higher
education and achieve greater efficiency for use of public money (Dougherty, Natow,
Bork, Jones & Vega, 2013).
Massachusetts community colleges are funded primarily through a combination of
state appropriations and student tuition and fees. Since their inception, Massachusetts has
provided a significant percentage of the funding for community colleges in the
commonwealth through appropriated funds. Since 2008 the funding of community
colleges has shifted more to the students. Currently, the average cost of attending a
community college in the Commonwealth of Massachusetts is in excess of $5,500
annually (MDHE, 2016).
The Vision Project is a system-wide, campus-level framework for the community
colleges, state universities, and the University of Massachusetts that focuses on seven key
outcome areas, broken down into three overarching goals of access and affordability,
success, and accountability, as shown in Table 2. Clearly, access is an accepted part of
the mission. The MDHE’s 2012 first annual report of the Vision Project, entitled “Time
to Lead: The Need for Excellence in Public Higher Education” compared the
commonwealth to the rest of the nation in specific objectives in each of the seven goals as
follows (MDHE, 2012):

58
Table 2
Access, Affordability, Success and Accountability
Goal Outcomes
1) College Participation Increasing the percentage of high school graduates
going to college
Increasing the readiness of these students
Safeguarding affordability
2) College Completion Increasing the percentage of students who earn
certificates and degrees to meet the state’s need for a
highly educated citizenry and workforce
3) Student Learning Improving teaching and learning through better
assessment
Documenting our results for the public
4) Workforce Alignment Aligning occupationally-oriented certificate and degree
programs with the needs of statewide, regional, and
local employers
5) Preparing Citizens Providing students with the knowledge and skills to be
engaged, informed citizens
6) Closing Achievement Gaps Closing achievement gaps among students from
different ethnic, racial, and income groups in all areas
of educational progress
7) Research Conducting research that drives economic development
Note: Vision Project Framework.
The first report, released in September 2012, states that in 2018, 63% of U.S. jobs
will require some college education and “if the commonwealth is to compete effectively
for jobs, investment, and talent and sustain our rich civic life and cultural landscape,
Massachusetts needs the best educated citizenry and workforce in the nation” (MDHE,
2011, p 3). The Massachusetts Community Colleges six-year success rate, measured by
first-time degree-seeking student graduations and completions, is less than 50%, which is
still slightly better than the national average; however, it is not achieving the state’s goal
to be a national leader (Malone, 2014). In the fourth annual report of the Massachusetts
Vision Project, the Board of Higher Education reaffirmed the overarching agenda with a
more direct emphasis on college access, affordability, and completion (MDHE, 2016).

59
Massachusetts Outcomes Accountability
In addition to increasing student success, the Massachusetts Vision Project
espouses a focus on making the public higher education institutions accountable to the
citizens of Massachusetts for results by working to reduce costs and maximize
operational efficiencies and making institutions accountable for helping students succeed
to meet industry demand for high-skilled talent (Malone, 2014). However, making the
institutions accountable for meeting the needs of industry is not solely the responsibility
of the institutions.
In a summary report of the April 2010 joint meeting on the Completion Agenda,
led by the American Association of Community Colleges (AACC), the Association for
Community College Trustees (ACCT), the Center for Community College Engagement,
the League for Innovation in the Community Colleges, the National Institute for Staff and
Organizational Development, and the Phi Theta Kappa Honor Society expressed that not
all factors of accountability for outcomes are under the control of the community college
leaders (McPhail, 2011). Being accountable for things outside of one’s control is not an
optimal position to be in. However, participants involved in advancing the completion
agenda shared their thoughts on the accountability of outcomes, including ways to change
the community college funding model and understanding that performance-based funding
is a mechanism to be considered (McPhail, 2011). Greater completions will be required
just to maintain appropriations as completion increases across the institutions. As the bar
is raised higher, institutions will be required to find ways to continue to compete with the
other community colleges or lose state appropriations even though they have increased
completions. The participants also identified key obstacles and barriers to college

60
completion, categorized into three groups: leadership and governance, finance and
budget, and teaching and learning (McPhail, 2011).
The Board of Higher Education in Massachusetts reinforced the commitment to
the Vision Project by holding the public institutions accountable for increasing college
graduates over the next 10 years. To achieve this, the Board of Higher Education
espouses “helping more students succeed in and complete college, close persistent
achievement gaps that keep too many African-American and Latino students from
graduating, and attracting and retaining students who are not being served by the system,
including those who currently can’t afford to attend college, those who are choosing to
attend college out of state, and adult students who need to finish their degrees” (Malone,
2014; p3). The Massachusetts Higher Education Finance Commission recommended that
the governor and the legislature increase the annual state appropriations for public higher
education starting in FY2016 by $95 million in operating budget support and annually for
the next five fiscal years. The additional funding will “allow for the expansion of
programs as well as support services for students, both of which are needed if the state is
to boost college completion rates and address current and projected shortages of high-
skilled talent” (Malone, 2014, p. 3). This level of state operational support will allow the
campuses to limit or possibly freeze mandatory fee increases, taking some of the burden off
the students and families. To enhance access to higher education for the neediest students,
the commission recommended an additional investment of $42 million to be allocated to
the MASSGrant student financial assistance program in FY16 to help increase the amount
of college costs covered from 8% to 50% of the need not covered by federal financial
assistance, for the students at the public institutions” (Malone, 2014, p. 3).

61
The Massachusetts Higher Education Finance Commission conceded that
improving outcomes requires increasing student support services and expanding
programs, which can increase costs to the institutions. It stressed that with the additional
support, the institutions can limit and possibly freeze the mandatory fees charged to the
students and thus keep the cost of college affordable.
America was once number one in the world for college completion, and has fallen
as low as 16th; and doing more of the same is not going to help (America Association of
Community Colleges, 2012). The public institutions of higher education cannot be the
only players responsible for turning it around. State governments need to be on the front
line of meaningful reform in the public colleges (Sugar, 2010).
Performance Funding in Massachusetts
In July of 2011, the Massachusetts State Legislature instructed the Department of
Higher Education to create a performance funding formula (MAPFF), based in part on
the goals of the Vision Project. Former Commissioner Freeland established a task force
including representatives of all 29 public higher education intuitions to develop a
performance funding formula. The Department of Higher Education engaged the
National Center for Higher Education Management Systems (NCHEMS) to aid in the
analysis and development of the formula (Nelson & Keller, 2012).
In the 2013 fiscal year, “Massachusetts ranks among the top five states in the
nation in the increase of state appropriation for public higher education over the previous
year” (MDHE, 2013, p. 2). This increase came after several years of declining investment
in public higher education, which has shifted significantly more of the costs to the
students. The average in-district tuition and fee rates for Massachusetts two-year public

62
higher education institutions were the fifth highest in the nation for 2014–2015 year
(Baum, Ma, Bell, & Elliot, 2014). Former Governor Patrick directed the Commissioner
of the Department of Higher Education to research the development of a funding formula
to meet the legislative concerns above by ensuring that performance by community
colleges supported by public monies would meet the goals of the Vision Project. The
legislative concerns include addressing the disparities and inequities in state funding
between colleges on a per-student basis and to stop the growth in student charges that
were already among the highest in the nation. In fiscal year 2014, the community colleges
began receiving all of their funding through the newly established MAPFF.
The Massachusetts Board of Higher Education, in collaboration with the
institutions, mandated the development of a performance measurement system in the
form of the performance funding formula for state and community colleges “in order to
promote accountability for effective management and stewardship of public funds and to
achieve and demonstrate measurable educational outcomes” (MDHE, 2013).
Each year, the community college campuses submit data to the Higher Education
Research System. The Department of Higher Education admits that effective
management and good stewardship of public funds is difficult to demonstrate, implying
that because of the rising costs of higher education and fewer degrees awarded,
community colleges are ineffective in managing the institutions and not good stewards of
public funds. The thinking goes that if colleges were more efficient then prices could be
lower and “more students would be able to afford, attend and complete college” (Belfield
& Jenkins, 2014, pg. 13). Using this logic, colleges are inefficient because the “cost/price
seems high.” (Belfield & Jenkins, 2014, pg. 13). Belfield & Jenkins, (2014) assert that

63
“higher education instruction is a labor-intensive service with tasks that are cognitively
challenging and interactive and cannot easily be routinized” (Belfield & Jenkins, 2014, p.
16). Belfield & Jenkins (2014) reveal that these tasks cannot be made more efficient by
reducing the amount of labor time allocated to them, and because labor represents the
largest expense category for community college budgets, significant reductions in
expenses are not likely.
As previously stated, Levin (2005) and Dougherty and Reddy (2011) suggest that
management behavior at community colleges are increasingly mimicking behavior found
in the business sector, where profit maximization is a top goal. It is for this reason that I
argue that as the community colleges in Massachusetts continue to operate within the
performance funding process and become more dependent on student outcomes for larger
portions of their state allocations, they will reexamine themselves and determine what
changes are necessary to maximize their state allocations determined by the funding
formula. Because the performance-based funding program in Massachusetts still imposes
a stop-loss measure providing a minimum increase in state funding, the incentive for the
colleges to make changes that will positively impact student success and outcomes was
diminished or delayed. However, as more of the base state financial support to the
community colleges is controlled by the funding formula and the stop-loss measures are
diminished and ultimately eliminated, the colleges will begin to find ways to add stability
and predictability to their revenue streams and/or other means to maintain a balanced
operating budget.
The changes that have been or potentially will be implemented include (a)
increased spending on instruction and student services, (b) increased spending on

64
institutional research staff and analytical tools, (c) additional investment in computer
systems and applications that will assist them in improving student outcomes, and (d)
more selectivity in the admission and recruitment process. Since community colleges
have some control over their tuition and fee rates, my espoused theory is that they may
begin or have already begun to raise fees to secure funds to support the increase in
spending focused on success, become more selective in their admissions and recruitment
practices, or a combination of both. Raising mandatory fees will make it more expensive
for the students and consequentially shut some students out of a college education
(Shannon & Smith, 2006). Additionally, as the community colleges implement changes
to instruction and student services, they may focus on the programs that they expect to
score well in the performance funding metrics, and in doing so, may discontinue other
programs that may not score as well. This “program narrowing” will shut out another
population of students and shut the door a bit further.
Massachusetts Performance Funding Model
After the collaborative effort between the Department of Higher Education, the
National Center for Higher Education Management Systems (NCHEMS) and the college
presidents, a performance-based funding model was presented to the Massachusetts
legislature for review. In July 2013 the Massachusetts legislature approved the
Community College Performance Funding Formula and began to distribute the state
appropriation beginning in fiscal year 2014. The formula is broken into three
components: (a) “base share,” roughly 36% of the total, using the enrollment variables;
(b) “performance share,” roughly 36% of the total, using the completion weights and

65
alignment multipliers; and (c) cost-of-operation subsidy,” roughly the remaining 28% of
the total.
The MAPFF was implemented to address three essential issues. The first was to
address the large inequities in per-student funding amongst each of the community
colleges, regardless of institution size, that have developed over time. Appropriations
have risen by identical percentages, while institutional growth has varied significantly.
The formula also addressed the issue of allocating funds in relation to aspects of
institutional performance that reflect statewide education goals, including a premium for
enrollments in STEM-related programs and trades and student success in these and all
programs, including premiums for students considered at risk. The third issue to be
addressed by the formula was to emphasize the role of community colleges in preparing
students for jobs in the states’ rapidly evolving economy.
Base share: Enrollment variables. The enrollment variables, which are
measured and assigned weights that reflect the statewide education goals, are shown in
Figure 1, reflecting the new performance funding detail. These programs shown are
identified using the Classification of Instructional Programs (CIP) codes. CIP codes
provide a scheme that supports the accurate tracking and reporting of fields of study. The
more highly weighted program variables, such as math and computer science,
engineering and architecture, technology, health related programs, as well as the most
heavily weighted trades’ variable, reflect the workforce priorities in Massachusetts. The
higher the weight in this category, the more value is given towards the performance
funding allocation. The credit-hour enrollments in each of the programs for each of the

66
15 community colleges shown below are then multiplied by the weights. This result in
the base share portion of the formula.
Performance Share Part 1: Completion weights. The completion weights (Figure
1) indicate the priorities of the state and are used for the calculation of the outcomes in
each of these areas for a total score. This measures not only completions with certificates
and associate degrees, but also progress and persistence. The largest component is the
Achieving the Dream Success Rate (ATD). The success rate captures the following
distinct outcomes for all first-time, degree-seeking students six years after initial entry:
1. Earning a degree or certificate at any Massachusetts community college and
transferring to a four-year institution;
2. Earning a degree or certificate at any Massachusetts community college
without a record of transferring to a four-year institution;
3. Transferring to a four-year institution without earning a degree or certificate at
any Massachusetts community college;
4. Remaining enrolled at any Massachusetts community college after six years
without earning a degree or certificate but with at least 30 credits earned.
5. Completing a credit bearing course in English and Math.
6. The number of degrees and certificates per (FTE) students.
7. The most heavily weighted completion metric, “Achieving the Dream”
success rate using a three-year average score.
Performance Share Part 2: Alignment multipliers. The alignment multipliers
apply to subsets of student cohorts (each row of the completion section is a different

67
cohort) that meet one of the alignment components with a multiplier applied for each of
the at risk populations shown in Figure 1.
Figure 1. MAPFF formula components (Massachusetts Vision Project and National
Center for Higher Education Management Systems, NCHEMS, 2013).
The data for each of the portions of the funding model is based on the results
tabulated from the prior fiscal year. The performance share is derived by multiplying the

68
number of awards issued (degrees, certificates, and transfers) times the completion
weights times the alignment multipliers.
Cost-of-operation subsidy. Each institution is then given a flat $4,500,000
operational subsidy each year, totaling $67,500,000 for all 15 community colleges.
Putting it All Together
Starting with the total state appropriation from the previous fiscal year, the base
share, the performance share, and the cost-of-operation subsidy are added together to
arrive at the state appropriation before the stop-loss adjustment for the new fiscal year.
The ancillary amount is then used to recalculate the results so that each institution is not
hurt by their performance and is guaranteed a minimum increases amount. The resulting
amount is the final appropriation that each institution will receive. The formula is
summarized in Table 3.

69
Table 3
Performance Funding Formula (MAPFF)
Component Description
Base Share (BS) Prior year AASL x WTD AVG % of
enrollment variables.
Performance Share (PS) Number of awards issued x completion
weights x alignment multipliers.
Cost of Operation Subsidy (COS) Flat $4,500,000 given to each college.
Appropriation before Stop-Loss Adjustment (ABSL) Summation of BS, PS, & COS.
Stop-Loss Adjustment (SLA) Ancillary amount provided by the state to
provide a minimum guaranteed percentage
increase to each college regardless of
performance.
Final Appropriation after Stop-Loss Adjustment
(AASL)
ABSL-SLA
Note. Formula: BS + PS + COS = ABSL; ABSL + SLA = AASL.
Using the above formula and Figure 1, the base share $86,913,411 is distributed
amongst the 15 community colleges using the proportional percentage of the enrollment
variables. The performance share allocation of $86,913,411 is calculated for each
institution based on their individual performance on both completion and alignment
variables, culminating into a performance share percentage for each institution. The cost-
of-operation subsidy of $4,500,000 is added to each institution.
Starting with the total state appropriation from the prior fiscal year of
$228,154,308, the ancillary amount is added for a new total of $241,326,822 for the
sector. Each institution is then given a flat $4,500,000 operational subsidy, totaling
$67,500,000 for all 15 community colleges. The total appropriation amount of
$241,326,822 is the sum of $86,913,411 times two, plus $67,500,000. The stop-loss
calculation is then applied, which ensures each college a minimum increase of at least
3.5%.

70
The smaller colleges, one of which I worked for, receives a larger percentage of
their annual state appropriation from the $4.5 million operational subsidy. Because of the
proportion from this subsidy, the smaller colleges are less impacted by the performance
or enrollment scores. However, if the MDHE changes the cost-of-operation subsidy
variable to consider the size of the institution, this would have a profound effect on the
annual state funding.
Stop Loss Adjustment (Guaranteed Increase)
For the first three years of the performance funding model, the state protected the
institutions by adding money to the total appropriation, so every institution was
guaranteed a 3.5% increase in FY2014 and 2015, and 2.5% increase in FY2016 from the
state. While data show the term “performance funding” generated fear of decreases, the
reality of guaranteed increases is shown in annual state appropriations. The feared
decreases did not happen in the first three years of the formula. The funding model shows
the total allocation amount for each campus before and after the stop-loss measure is
applied.
In a study on performance funding for higher education experiences on three
states (Indiana, Ohio, and Tennessee), a number of the respondents indicated that the
performance funding program had “little or no impact on their colleges budget” in part
because of a hold-harmless provision in their first few years (Dougherty, Jones, Lahr,
Natow, Pheatt, & Reddy, 2016, p. 154). The Ohio institutions used a hold harmless
provision in their performance funding program that limited how much funding colleges
may lose from one year to the next in the first few years of the formula (Dougherty,
Jones, Lahr, Natow, Pheatt, Vikash, 2014). In South Carolina, the performance funding

71
formula provided a hold harmless period preventing any institution from losing funding
until the formula’s full implementation took effect (Dougherty, Natow, Hare, Jones, &
Vega, 2011). In contrast, the MAPFF Stop Loss component guaranteed a minimum
increase in each of the first three years of the formula. The previous studies did not
indicate the hold harmless provision of the formula had as significant of an impact as was
found in my study.
Revenue Maximization
The Massachusetts performance-based funding formula allocates a larger
percentage of the total state appropriations to institutions that perform better in the
achievement of student outcomes and enrollments in STEM- and workforce-related
programs measured by the formula. The implementation of performance funding as a
“reform-minded funding strategy” incentivizes colleges to maximize revenue and
pressures colleges to become more accountable to state legislatures and the public, and
focus more on outcomes (Dowd & Shieh, 2013, p. 49).
Students represent economic entities in two ways, as “consumers” providing a
significant source of revenue through the tuition dollars they pay, and as “commodities”
providing value to the institutions because of their skills that are desired by businesses
and industry (Levin, 2005, p. 15). The access-for-all mission remains critically important
or the institutions will face loss of tuition dollars and state and federal funding. However,
viewing students as consumers and commodities demonstrates that management
behaviors at community colleges are increasingly imitating behaviors found in the
business sector, with economic goals driving institutional strategies and actions.

72
The “community” in community colleges has been more narrowly focused to
mean economic community, with students as economic entities (Levin, 2005, p.13). Saul
and Newell (1997) saw this shift in their research on neo-conservatism and stated that
“the elevation of maximum profit as the supreme legitimating purpose of democratic
society has led to a corruption of liberal education” (Saul & Newell, 1997, p. 1). In a
study of two community colleges, one in the United States and one in Canada, senior
administrators, faculty, staff, students, and board members supported the shift toward the
maximization of revenues (Levin, 2005).
In the U.S. community college, the state government began to permit the college
to retain all of the student fees, while previously they did not, but decreased allocations to
the institution (Levin, 2005). This community college looked to international students to
support its operations because of the higher tuition and fees they are charged (Levin,
2005). Additionally, this community college raised the tuition and fee rates, benefitting
the institution with a rise in revenue but also impacting enrollments because some
students did not have the extra money (Levin, 2005, p. 19). “Overall, due to state budget
cuts throughout the 1990s, programming and curricula were redesigned to support state
economic development.” (Levin, 2005, p. 19). College resources were redirected to high-
demand revenue generating programs (Levin, 2005). Their finding indicated that as
consumers, students and their demands increasingly shape the curricular and
organizational strategies that community colleges use to increase and maximize revenues
(Levin, 2005).
The community colleges in the Commonwealth of Massachusetts have two
primary revenue sources: (a) tuition and fees that the students pay, and (b) state

73
appropriations. Revenue is defined as the proceeds from selling an amount of product
produced by a firm (Total Revenue, 2013). Revenue maximization strategy dictates that a
business should do whatever is required to sell as much of its product as possible
(Revenue Maximization, 2013). Revenue maximization is different from profit
maximization, in which the strategy ignores the costs associated with the activity
(Revenue Maximization, 2013). Optimization is defined as finding an alternative with the
highest achievable performance by maximizing desired factors and minimizing undesired
ones (Optimization, n.d.). The product or output of an institution of higher education is a
successfully educated student; this is a desired outcome. The performance funding
formula instituted in Massachusetts defines what a successfully educated student is in the
commonwealth and distributes its appropriations to the community colleges by
comparing how effective each institution produces its product.
The president of each community college must present balanced fiscal year
budgets to the board of trustees for formal approval and adoption. A balanced budget is
one in which the sum of all institutional operating revenue, including state appropriations
and tuition and fee revenue, equals the sum of all operational expenditures. Operational
expenditures include instructional, student, and institutional costs. When budgets are not
balanced, changes are made to reduce costs, increase revenues, or often a combination of
both. The only revenue source that community colleges have direct control over is the fee
portion of the tuition and fee rates.
The community colleges in Massachusetts have some of the highest tuition and
fee costs among community colleges in the nation, and because of this, are limited in how
much they can raise the costs for students to increase revenues and remain a low-cost

74
alternative. To continue to be able to provide quality education for their students and
improve student outcomes as measured by the performance funding formula, the
community colleges must focus on making organizational improvements and search for
external sources of funds to maximize revenues and attain more of the state appropriation
allocations.
The Massachusetts Vision Project was adopted to provide a framework for the
system-wide and campus-level activity, focusing on two goals: (a) to produce the best
educated citizenry and workforce in the nation, and )(b to be a national leader in research
that drives economic development (MDHE, 2010). The creation of the Performance
Funding Formula builds on those goals by incentivizing community colleges to improve
student outcomes, operate more efficiently, and to hold institutions accountable for
results (Hillman, 2016). The introduction of the performance funding program
incentivizes performance on outcomes more heavily than enrollments and awards a
portion of the state funding on success in these metrics. The total formula results, using
the all the defined components of the formula for each of the 15 community colleges, are
summarized and ranked in order of success. A significant portion of the state
appropriations is then finally allocated to the institutions based on where each institution
is ranked. This supports the theory that institutions will seek the most state funds possible
to maximize their efficiency and revenue by improving their outcomes (Dougherty &
Reddy, 2011; Levin, 2005).
Decreasing enrollments at both two- and four-year institutions across the country
has rekindled an increased competition for the demographically declining number of
students seeking a higher education. Stagnant or declining state funding, an increased

75
emphasis on preparing citizens directly for the workforce, and the introduction of the
performance funding has demonstrated the change in priorities at the state level more
towards economic development (Dowd & Shieh, 2013; Levin, 2005). Because of this
shift in state priorities and the increasing competition for state appropriations as allocated
by the performance funding formula, the community colleges in Massachusetts are not
only faced with improving student outcomes to gain, or at least maintaining state funding,
but are also faced with finding supplemental and alternative sources of revenues to be
competitive.
The implementation of the performance funding formula in Massachusetts shows
evidence of this shift to market needs and workforce development. The report from the
board of higher education “Time to Lead,” stated that because the growth of high-wage
jobs in Massachusetts comes mostly from health care, finance, technology, education,
and life sciences, public higher education institutions in the commonwealth must refocus
their efforts (MDHE, 2012). The performance funding formula provides stronger weights
for these fields. The emphasis placed on the trades, engineering and architecture,
technology, and the sciences shows the priorities based on the state’s workforce needs.
When the Massachusetts community colleges perform well in these metrics as measured
in the funding formula, they can secure a larger share of the state appropriations.
Basis for Research Design
I used a multiple-case study design on a subset of community colleges in the
Commonwealth of Massachusetts to determine the impact that the implementation of
performance funding has had on the open-access mission of these colleges. The use of a
case study methodology on my study was influenced by two separate dissertation

76
research studies conducted on the University of Memphis in Tennessee (Latimer, 2001)
and the Woodland Hills Community College in California (Wood, 2007). Both studies
were conducted using a case study method incorporating documentary administrative
data, as well as surveys and interviews. These studies reviewed how performance funding
affected the administration’s decision-making and the positive and negative impacts of it
on the institutions. Additionally, the following larger studies conducted on performance
funding also served as a guide to my study: (a) Dougherty and Natow (2010); (b)
Dougherty, Jones, Lahr, Natow, Pheatt, and Reddy (2014); (c) Lahr, Pheatt, Dougherty,
Jones, Natow, and Reddy (2014); (d) Hillman, Tandberg, and Gross (2014); and (e)
Hillman, et al. (2015). Each of these studies were also conducted using documentary
administrative data, surveys, and interviews. The multiple sources of evidence used in
these studies revealed intended and unintended negative impacts of performance funding
on the institutions that included changes to admissions and recruitment practices through
raising admission requirements, selective student recruitment and targeting financial aid,
and increases of tuition and fees, all of which are the focus of my study.
As with many changes of this magnitude, it takes time before the results are
realized to the point where the colleges may begin to see the impact of their efforts on
their operating budgets. Since each community college has significant amounts of
appropriation money at stake, it is reasonable to assume, based on the revenue
optimization theory discussed earlier, that each of them will be trying to maximize their
metric scores to at least maintain their appropriation level. However, there is a very good
chance that even with achieving improvements in student outcomes, the schools may not
secure any additional funding and may in some cases lose state funding support.

77
Building Upon the Research
Community colleges still advocate that providing access to higher education to all
continues to be one of their fundamental missions. Some evidence has been found in the
research conducted that performance funding has had a negative impact on access
through restrictive admission, enrollment, and recruitment practices, such as creaming
and bypassing certain high schools for recruiting because of low success rates and
through increased tuition and fee costs (Smith, 2015; Tandberg & Hillman, 2013;
Dougherty & Reddy, 2011). The focus of my study is to determine what impact the
MAPFF has had on the open access mission of the community colleges in the
Commonwealth of Massachusetts in these and other areas.
The research conducted thus far does not directly address the financial impact on
colleges and the strategies to manage the results, specifically in their operational budgets,
which can translate into an increased cost of attendance. Of note are instability in
funding, funding levels that are too low, shortfalls in regular state funding for higher
education, and inequalities in institutional capacity as a significant concern (Dougherty &
Reddy, 2013). In the study mentioned earlier on the unintended impacts of performance
funding on community colleges in three states, the findings reveal frequent mentions of
actions by the colleges such as restricting admissions and increasing costs of compliance
with performance funding (Lahr, et. al., 2014). My case study set out to determine if the
performance funding program in Massachusetts incentivizes community colleges to make
institutional changes to improve their performance funding formula results that may
specifically be detrimental to their open-access mission.

78
On August 22, 2013, at the University of Buffalo, then President Obama placed
the issue of college affordability and performance funding on the National Agenda
(Friedel et al., 2013; Obama, 2013). In his plan to make college more affordable, he
advocated holding students and colleges receiving federal student aid responsible for
making progress towards a degree and challenged states to increase funding and to fund
public colleges based on performance (Executive Office of the President, 2014; Obama,
2013). President Obama, using the recommendations outlined in the Spellings
Commission report, created the College Scorecard to provide more information about
college costs and outcomes to families of potential students (Executive Office of the
President, 2014). With this plan coming from a democratic president, along with the
strong support from republicans in Congress, and coupled with the desires of ordinary
citizens demanding lower costs of higher education (Dougherty, Natow, Bork, Jones, &
Vega, 2013), performance funding has a good chance of becoming the norm. However,
performance funding can have a significant negative effect if the community colleges are
raising tuition and fees, restricting admissions and enrollment, or weakening academic
standards to counteract funding declines due to performance-based funding.
Evidence of a Mission Shift
The literature review conducted as part of my research has shown evidence that
performance funding has negatively impacted access in community colleges through
restricting admissions of less prepared students and increasing the cost of attendance.
The publicly stated mission of the Massachusetts community colleges espouses
open access to high quality, affordable higher education for the states’ citizens. The
literature research conducted in preparation for my study shows that open access was, and
79
remains, one of the most important missions of community colleges nationwide.
However, examination of how states are tying funding to the success outcomes of
students also reveals that there may be a related shift in emphasis of the mission of
community colleges from allocating state funding based on enrollment and access to
completion and success. In Massachusetts, a significant portion of the community college
funding comes from the state. Shifting the funding allocation away from enrollment and
more towards completion demonstrates a change in priority away from access. My study
researched the impact the implementation of the MAPFF had on the open-access mission
of the community colleges in Massachusetts.

80
Chapter III
Methodology
Chapter III describes the research methodology and design that was used to
conduct the study and the data that was collected and analyzed. The chapter also outlines
why the research study was conducted and how the results can inform future studies and
strategies on the initial design, redesign, and implementation of performance funding
programs.
This multiple-case study examined the impacts that the Performance Funding
Program, implemented in 2014 in the Commonwealth of Massachusetts, has had on the
open-access mission of its community colleges. Other research on performance funding
discussed in the literature review focused predominantly on the different types of
programs, how they work, the motivations behind implementing them, and some of the
positive and negative impacts both on the institutions and the states. However, the
research to date has revealed some negative impacts on access through selective and
restrictive enrollment and admissions. The current research noted an impact to access but
was not focused on the impact to access as a result of performance funding.
This chapter presents the study’s methodology, beginning with a review of the
research questions relevant to the study. The research design is described, as well as the
case selection, data collection, and analysis techniques that were used.
Study Protocol
The protocol for this case study includes (a) research questions, (b) research
design, (c) conceptual framework, (d) selection of the cases, (e) data collection
procedures, (f) analysis of the data collected, (g) discussion of the findings, and (h)

81
conclusions. Reliability is demonstrated by ensuring that the operations of a study can be
repeated with the same results (Yin, 2009). This case study protocol operationalizes and
documents the process that was followed in the execution of the study. Outlining and
documenting the process enhances reliability because it allows the study to be repeated
and it minimizes errors and biases.
Research Questions
Revenue Maximization is the theory behind the inception of the performance
funding formula in Massachusetts. Massachusetts wants to incentivize the colleges to
improve student outcomes by allocating a significant percent of the state allocations
through the performance funding formula. To explore its impact, the overarching
research question answered from my study is:
How is performance funding influencing the open-access mission of community
colleges in Massachusetts?
To answer this question, I answered the following subquestions:
1. What operational changes have occurred at the institutions to improve student
success that are directly related to the implementation of the MAPFF?
2. How has the MAPFF Program influenced tuition and fee rate changes?
3. How have changes in the Massachusetts state appropriations with MAPFF
influenced institutional changes in college education delivery or support for
student success that then affected access?
4. How does the senior management perceive the impact of performance funding
on student access to community colleges?
82
Purpose of Study
Management behaviors at community colleges are increasingly mimicking
behavior found in the business sector, where profit maximization is a top goal (Dougherty
& Reddy, 2011; Levin, 2005). It is for this reason that I argue that as the community
colleges in Massachusetts continue to operate within the performance funding process
and become more dependent on student outcomes for larger portions of their state
allocations, they will reexamine themselves and determine what changes are necessary to
maximize their state allocations as determined by the funding formula.
The purpose of this multi-case study was to discover the impact of the
performance funding program on the community college open-access mission in
Massachusetts. I define impact as actions initiated that decreased affordability for the
students and/or actions that restricted enrollments by the institutions. It’s important to
ensure that opportunities for higher learning are not diminished by tying state
appropriations to student outcomes and the achievement of embedded statewide goals.
I examined how the implementation of the MAPFF is impacting the open-access
missions of community colleges in Massachusetts. Quantitative administrative and
secondary data, quantitative and qualitative surveys, and qualitative interview data was
gathered at four institutions for the study. Because Massachusetts is a new adopter of
performance funding for community colleges, I focused the review on the data spanning
from fiscal years 2014 through 2016.
Because of the findings found in several documented studies reviewed earlier
showing that access was negatively affected by the implementation of performance

83
funding programs, my research focused on operational changes that restrict admissions,
recruiting, and enrollment, and increased student costs, as shown in the in Table 4.
Table 4
Data Collection
Restrictive Admissions, Enrollment
and Recruitment (R.A.E.R.)
Research
Question
Connections
Increased Student Costs
(AFFORD)
Research
Question
Connections
Variable Source Variable Source
Raising Admission
Requirements
Surveys
Interviews
1,3,4
Increased
Compliance
Costs
Financial
Statements
Audits;
Surveys and
Interviews
2,3
Selective Student
Recruitment
(Creaming)
Surveys
Interviews
IPEDS
MDHE
1,3,4
Increase
Costs of
Student
Support
Financial
Statements
Audits;
Surveys and
Interviews
2,3
Targeting
Institutional
Financial Aid
Surveys
Interviews 1,3,4
Tuition and
Fee
Increases
IPEDS, MDHE 2,3
Eliminating &
Reducing Programs,
Courses, and
Sections
Surveys
Interviews 1,3,4
Note. Research questions: 1) What operational changes have occurred at the institutions
to improve student success that are directly related to the implementation of the MAPFF?
2) How has the MAPFF Program influenced tuition and fee rates changes? 3) How have
changes in the Massachusetts state appropriations with MAPFF influenced institutional
changes in college education delivery or support for student success that then affected
access? 4) How does the senior management perceive the impact of performance funding
on student access to community colleges?
The quantitative administrative and secondary data were obtained from (a) college
websites, (b) annual financial statement audits, (c) operating budgets, (d) Higher

84
Education Information Resource System (HEIRS) data from the Massachusetts
Department of Higher Education, (e) Integrated Postsecondary Education Data System
(IPEDS), (f) National Center for Education Statistics (NCES), and (g) the National
Center for Higher Education Management System (NCHEMS). The qualitative data
originated from open- and close-ended surveys and one-on-one interviews of senior
administrators at each institution. In the first two years of the MAPFF, significant
increases in the state-wide appropriations were added, totaling $20 million in FY2014,
$13.1 million in FY2015. However, with the new administration elected in Massachusetts
in 2015, the appropriation increase was reduced to $9.1 million in FY2016. As discussed
earlier in this chapter, indications of further cuts in state appropriations for the
community colleges are suspected but not imposed yet.
Research Design
To determine the impact that the implementation of performance funding has on
the open-access mission of the community colleges, a multiple-case study was conducted
on four of the community colleges in the Commonwealth of Massachusetts. In particular,
the study focused on the changes the colleges have implemented to improve their student
success performance and how these changes may have intentionally or unintentionally
impacted access. Quantitative administrative and secondary data, such as changes in state
appropriations, tuition and fee increases, FTE enrollment changes, and performance share
percentage changes were examined from FY2014 through FY2016, covering the first
three years of the MAPFF. I included the collection and analysis of quantitative
administrative and secondary data, quantitative and qualitative surveys, and qualitative
one-on-one interview data identified and explained actions taken by the institutions in

85
reaction to the MAPFF for the allocation of state appropriations. The qualitative data
obtained from the interviews were used for a deeper review of the preliminary findings
from the quantitative administrative and secondary data.
A case study explores a phenomenon, such as performance funding, bounded by
time, place, and manner (Yin, 2009). Case studies are appropriate to explain “how” or
“why” events occur when examining contemporary events and when the investigator has
little or no control, such as with performance funding in Massachusetts (Yin, 2009). My
study used a multiple-case study design on a subset of community colleges in the
Commonwealth of Massachusetts to determine the impact that the implementation of
performance funding had on the open-access mission of such institutions. Similar to other
multiple-case studies, my study’s results were expanded to generalize the theory using
“analytic generalization” rather than to “enumerate frequencies under statistical
generalization” (Yin, 2009; “Traditional Prejudices Against the Case Study Method,”
para. 4). A multi-case study design offers an advantage over single-case design because
the “evidence from multiple cases is often considered more compelling and robust” (Yin,
2009; “What Are the Potential Multiple-Case Designs (Types 3 & 4),” para. 4). Selection
of each case in a multiple-case study is important to predict similar or contrasting results
(Yin, 2009).
Community colleges share a mission to provide higher educational opportunities
for everyone, regardless of socioeconomic circumstance or academic preparedness. The
15 Massachusetts community colleges receive the state appropriations from a
performance funding formula implemented in 2014. I reviewed the changes the four case

86
institutions have implemented that may have negatively impacted access because of the
implementation of performance funding in Massachusetts.
The Commonwealth of Massachusetts is incentivizing the community colleges to
improve student success and completion by allocating a significant percent of the total
state appropriations through the performance share portion of the MAPFF. As
documented in the literature review in Chapter 2, research has shown that access has been
negatively impacted because of performance funding as the result of restrictive
admissions, enrollment, and recruitment practices, and decreased affordability.
Previous research has shown that access has been negatively impacted because of
performance funding as a result of institutional actions that restricted admissions,
enrollment, and recruitment. Additionally, performance funding programs have also
increased institutional costs of review and compliance with the formulas.
To conduct my study, both quantitative administrative and secondary data and
qualitative interview data were collected and analyzed to determine how the MAPFF
impacted access. The quantitative data collected to demonstrate and associate restrictive
admissions, enrollment, and recruitment practices, and decreased affordability to the
implementation of the MAPFF included FTE enrollment, performance share percentage,
state appropriation amounts, cost of operations, tuition and fee rates charged to the
students, and the stop-loss adjustments. Additionally, a quantitative and qualitative
survey with multiple-choice and open-ended questions was distributed to the senior
administrators at each of the four case institutions.
The qualitative data collected included one-on-one interviews conducted with
participants from the case institutions to drill down on the quantitative data obtained to

87
better understand the perceptions and actions taken by the senior administrators. The
open-access mission is likely to be negatively impacted when performance funding leads
to decreased affordability and/or restrictive admission, enrollment, and recruitment
practices. My proposition is that the open-access mission was negatively impacted in the
Massachusetts community colleges in one or both areas as found in the previous research.
To demonstrate and associate restrictive admissions, enrollment, and recruitment
practices to the implementation of the MAPFF, quantitative administrative and secondary
data were collected and analyzed. The quantitative data included decreases in FTE
enrollment, changes in performance share percentage, and state appropriation changes
before and after the stop-loss adjustment. Significant decreases in FTE enrollment greater
than the sector average, a large percentage change in performance share from 2014–2016,
and a significant benefit from the stop-loss adjustment were used to indicate the potential
for implementing restricted admissions, enrollment, and recruitment practices.
Responses to the survey and one-on-one interviews were analyzed for each of the
case institutions. Analysis of the quantitative data and the qualitative interview data
significantly contributed to the findings and conclusions discussed later in Chapters IV
and V.
Decreased affordability is demonstrated by an increase in the overall tuition and
fee rates charged to the students. To associate tuition and fee increases to the
implementation of the MAPFF, quantitative administrative and secondary data were
collected and analyzed. The quantitative data included the performance share percentage
changes calculated in the MAPFF, the associated change in state appropriations before
and after the stop-loss adjustment, and the tuition and fee changes for each of the first

88
three years of the formula. A significant increase in tuition and fees, together with a
significant loss of state appropriations before and after the stop loss, indicate an attempt
to replace lost state revenue with tuition and fee revenue directly from the students.
Responses to the survey and one-on-one interviews were analyzed for each of the
case institutions. Analysis of the quantitative data and the qualitative interview data
significantly contributed to the findings and conclusions discussed later in Chapters IV
and V.
The open-access mission is likely to be negatively impacted when performance
funding leads to decreased affordability and/or restrictive admission, enrollment, and
recruitment practices. My proposition is that the open-access mission was negatively
impacted in the Massachusetts community colleges in one or both areas as found in the
previous research.
Data Collection
My study draws on multiple sources of quantitative administrative and secondary
data and qualitative data. Using multiple sources of evidence in a case study improves the
construct validity (Yin, 2009).

89
Table 5
Data Sources and Their Purpose Served
Data Variables
Data Sources Tuition
&
Fees
Enroll
Data
State
Funding
Cost
Of
Ops.
Perf.
Share %
Stop
Loss
Impact
Select
Case
Study
Colleges
Familiar
with PF
Formula
Perception
of Impact
of
MAPFF
Qu
anti
tati
ve,
Ad
min
istr
ativ
e &
Sec
on
dar
y
Dat
a
MDHE-
HEIRS
X X
IPEDS X X X
Financial
Statement
Audits
X X X
MA
Performance
Funding
Module
X X X X X
Case Study
Colleges Web
Sites
X
Surveys of
Senior
Administrators
& Directors
X X
Qu
alit
ativ
e
Interviews
with Senior
Administrators
& Directors
X X
Impact to
Access
Aff
ord
abil
ity
Res
tric
ted
Ad
mis
sio
ns
Aff
ord
abil
ity
&
Res
tric
ted
Ad
mis
sio
ns
Aff
ord
abil
ity
&
Res
tric
ted
Ad
mis
sio
ns
Aff
ord
abil
ity
&
Res
tric
ted
Ad
mis
sio
ns
Aff
ord
abil
ity
&
Res
tric
ted
Ad
mis
sio
ns
Aff
ord
abil
ity
&
Res
tric
ted
Ad
mis
sio
ns
Aff
ord
abil
ity
&
Res
tric
ted
Ad
mis
sio
ns
Aff
ord
abil
ity
&
Res
tric
ted
Ad
mis
sio
ns
Research Question
Connections 2 1,3 1,2,3 1,2,3 1,3 2,3 2 1,2,3 1,2,3,4
Note. Research questions: 1) What operational Changes have occurred at the institutions
to improve student success that are directly related to the implementation of the MAPFF?
2) How has the MAPFF Program influenced tuition and fee rates changes? 3) How have
changes in the Massachusetts state appropriations with MAPFF influenced institutional
changes in college education delivery or support for student success that then affected
access? 4)How does the senior management perceive the impact of performance funding
on student access to community colleges?

90
Quantitative administrative and secondary data. Table 5 summarizes the data
sources and the purpose they served. Administrative and secondary data was collected
using (a) MDHE HEIRS and IPEDS; (b) financial statement audits; (c) Massachusetts
performance funding model, and (d) college websites for fiscal years 2014, 2015, and
2016.
HEIRS (Higher Education Information Resource System) and IPEDS. The
HEIRS database is a data warehouse into which each public higher education institution
submits data at regular intervals during the year. The warehouse contains data on access,
affordability, student success, and quality indicators, and efficiency and effectiveness
indicators for the 15 community colleges in Massachusetts. These data are reviewed by
the Board of Higher Education for consistent responses before being published online.
Once published, the data become the basis for the annual Performance Measurement
Report.
Integrated Postsecondary Education Data System (IPEDS) is a system of
interrelated surveys conducted annually by the U.S. Departments of Education National
Center for Education Statistics (NCES) (U.S. Department of Education, 2014) and
contains historical data on enrollment and institutional costs.
Financial statement audits. The audited financial statements prepared by the
community colleges are audited by independent accounting firms, are approved and
accepted by the college’s board of trustees annually and are then made part of the public
record. The colleges generally publish the annual financial statement audits on their
websites and make them available in their libraries. Additionally, the Department of

91
Higher Education also has each college’s financial statement audits and will provide them
when asked.
The audits include a management discussion and analysis (MD&A), as well as
notes on the financial statements that contain information that explain the significant
changes in operational expenditures, state appropriations, and tuition and fees from one
fiscal year to the next, and may provide information that helped answer my research
questions. Additionally, the audits are completed as required by the Governmental
Accounting Standards Board (GASB) standards, followed by the commonwealth and
each of the community colleges. This provided consistently reported data for all the
community colleges.
The amount of state appropriations received by the subject institutions was
collected from the MAPFF and confirmed in the annual financial statement audits of each
of the colleges from 2014–2016. The cost of operations was collected from the Financial
Statement audits, and the MD&A from each audit was examined to identify how the
changes from one year to the next were explained by the institution’s financial leadership.
Massachusetts performance funding model. The performance funding model is a
spreadsheet with multiple tabs that summarizes all the data into the first tab labeled
“Dashboard.” This is the mechanism used to determine how state appropriations will be
allocated to each of the 15 community colleges. The model provides details and outcomes
using three variables: (a) enrollment variables, (b) completion variables, and (c)
alignment variables. The formula first calculates a base share amount (BS) using a
weighted average percentage of the enrollment variables. Then the performance share
(PS) is determined for each institution’s outcomes, using the completion and alignment

92
variables. Next a flat $4,500,000 is added for the cost-of-operation subsidy (COS). These
are then added together to determine the amount of state appropriations before the stop-
loss adjustment (ABSL). Finally, the formula then applies the ancillary amount for the
stop-loss adjustment (SLA) to arrive at the final state appropriation after the stop-loss
adjustment (AASL) to ensure that each college gets at least the minimum increase
(Appendix A).
Survey. Case study research methods are designed to illuminate a decision or a set
of decisions, why the decisions were made, and how they were implemented (Yin, 2009).
The quantitative and qualitative survey asked specific questions (Appendix H) to identify
changes the colleges made or are planning to make, and the participant’s perceived
impacts of those changes on access because of the MAPFF funding. Responses to the
survey were grouped, counted, and displayed by case institution representing the
quantitative aspect of the survey. The participant’s responses on the open-ended
questions indicating the changes made at their institutions and their perceptions of the
MAPFF impact on the institution and on access, represent the qualitative aspect of the
survey. I analyzed participant’s responses to understand the results of the quantitative
administrative and secondary data and the influence the formula had on the decisions
made by the senior administrators of each of the institutions.
In the development of survey questions, I used multiple-choice questions because
they are easier to use and score and are more reliable because of the uniformity of
responses (Fink, 2013). The multiple-choice questions offered several different methods
of responses, including a five-point, ordinal, Likert Scale, multiple answer, and open
response (see Appendix H). The Likert Scale questions included the following response
93
choices: 1) strongly agree, 2) agree, 3) disagree, 4) strongly disagree, and 5) not sure. I
have removed the neutral choice to divert the respondents from taking the path of least
resistance but have included the “not sure” choice because this answer is pertinent to
answering my research questions. The surveys were distributed and conducted
electronically using Qualtrics. The participants were asked about their knowledge and
familiarity with the formula, institutional actions taken because of the formula, and
opinions about the potential positive and negative impacts of the formula.
The survey (see Appendix H) was administered to the senior administrators and
directors listed previously in Table 6 of each institution. The responses to the structured
open- and close-ended survey were analyzed to identify meaningful and similar patterns
of responses compared to the findings from the administrative data (Yin, 2009). I used
these data to refine the interview protocols for the one-on-one interviews conducted, and
to obtain a deeper understanding of the decisions made by the institutions and how they
were influenced by the MAPFF.
Qualitative data. A purposeful sampling method (Creswell, 2011) was used to
select the participant positions (listed in Table 6) at each case institution. The selection of
senior and mid-level administrators was supported by various studies of performance
funding impacts (Dougherty & Reddy, 2011, 2013; Lahr, et. al., 2014; Tanberg &
Hillman, 2013), where these administrators were sought to participate in the surveys and
one-on-one interviews because they are operating and making strategic institutional
decisions. Each of the participants represent different operational areas of the institution,
including financial, academic, student affairs, and institutional research which bring
different perspectives on the impact of the MAPFF on access. This type of purposeful
94
sampling method is called “maximal variation sampling” (Creswell, 2011; “Using
Sampling Procedures” para. 2).
One-on-one interviews. Prior to conducting the interviews, I distributed an
informed consent form (see Appendix K) detailing the interviewees’ rights as participants
in the study (Creswell, 2007). The interviews were recorded, with the approval of the
participants, and transcribed for analysis.
Interview protocols (Appendix L) were developed broadly and were refined using
the results of the administrative documentary data and survey. The questions obtained
greater detail from the participants that explained the results of the quantitative
administrative and secondary data and insured my research questions were fully
addressed. I conducted surveys and one-on-one interviews with the senior administrators,
as shown in Table 6. The interviews were conducted by telephone with three of the four
case institutions selected for the study; one institution declined to participate in the study
after approval of the IRB. I worked with the president’s office and my peers (chief
financial officers) at each of the institutions to schedule the interviews.
The selection of survey and interview participants listed in Table 6 was guided by
previous research studies on performance funding programs (Larimer, 2001, Wood, 2007,
Dougherty, 2011, 2013). The top administrative leaders were selected by their function of
the college and potential to influence change at each of the institutions. These positions
are typically members of the president’s cabinet.

95
Table 6
Survey Distribution and Interview Participants
Each Institution
President
Vice President, Administration and Finance
Vice President of Academic Affairs
Vice President or Dean of Student Services
Director of Admissions
Budget Manager
Institutional Research Director
The broad interview questions from the proposal were refined after an
examination of the findings from the quantitative administrative and secondary data
(Appendix L). The interview questions were used to determine the respondents’
familiarity with the performance funding formula, how it was used in their strategic
planning, and to share their thoughts and opinions on the impact that performance
funding has had on their institution.
Follow-up questions were asked during the interviews specific to comments made
to the main questions. Probing questions were asked that elicited more details and
completed the idea and filled in the missing pieces of information (Rubin & Rubin,
2005).
Since I no longer lived in Massachusetts, and travel and scheduling in-person
interviews would be difficult, the interviews were conducted via telephone at mutually
agreeable times. The interviews lasted approximately 30–45 minutes and were recorded
using an audio device that permitted me to transcribe the conversation. No one other than

96
me has access to the conversation audio file. The identities of the institutions are not
revealed, and aliases were used for the interviewees’ names to maintain anonymity.
The interview subjects were informed that my study is to research the impact on
access of the Massachusetts community colleges because of the implementation of the
performance funding formula. The results of the study will be used to inform future
strategy on performance funding, not only in Massachusetts but also nationally.
Additionally, their participation will be added to the scholarly work in the field and help a
student achieve his doctoral degree. I asked my peers for assistance in following up with
the interviewees to make the time to meet with me for the interviews.
The data from the one-on-one interviews sought to identify the motivations of
decisions more deeply (Yin, 2009; Seidman, 2006). Responsive interviewing was used to
generate a “depth of understanding” to address and confirm or eliminate alternative
plausible explanations for those actions taken by the institutions unrelated to the
implementation of the performance funding formula (Rubin & Rubin, 2005, p. 30). The
questions obtained the participants’ interpretation of their institutions’ reactions to the
performance funding formula as it related to access (Rubin & Rubin, 2005). The findings
from the administrative data and the responses to the survey were used to refine and
generate the interview questions.
Quantitative Data Analysis and Case Institution Selection
A purposeful sampling method, using publicly available documentary data
focused on the two documented threats to access for the first three years of the MAPFF,
was used to select the case institutions for this multi-case study. The two threats to access
researched were decreases affordability (cost of attendance) and restrictive admission,

97
enrollment, and recruitment practices (enrollment). The variables examined for all 15
community colleges in Massachusetts were: 1) percentage change in MAPFF
performance share between FY2014 and FY2016; 2) percentage change in state
appropriations before the stop-loss adjustment between FY2013 and FY2016; 3)
percentage change in FTE enrollment from FY2013–FY2016; 4) percentage change in
tuition and fees from FY2013–FY2016; and 5) total state funding after stop loss for
FY2016 only (see Appendices C&D).
Twelve of the 15 institutions were considered for the full study (Appendices C
and D). Institutions B and E were not considered for the full study because they were
used for the pilot study. Institution D was not considered because I was working there at
the time of selection, making it difficult to remove my biases.
Decreased affordability was addressed by comparing the tuition and fee increases
and the state appropriation changes. Restrictive admission, enrollment, and recruitment
practices were addressed by comparing the performance share percentage and the
enrollment changes.
Four case institutions were selected based on the review and analysis of the
quantitative data relative to restrictive admission, enrollment, and recruitment practices
and decreased affordability. I examined quantitative and qualitative surveys and
qualitative one-on-one interviews to understand the actions taken by the senior leadership
of the institutions, and how the performance funding formula influenced these actions.
My expectations are the high probability case institutions C1 and C2 will show similar
results—an impact to access—while the lower probability case institution C3 and the low
98
probability case institution C4 will show similar results would have less or no impact to
access.
Explanatory studies that analyze relationships between variables must address and
eliminate competing plausible explanations (Krathwohl & Smith, 2005; Yin, 2009). To
address the internal validity of the case study, Yin (2009) recommends incorporating
rival explanations as part of the initial design of the case study to help mitigate the risk
that some other factor may have had a causal relationship to the outcomes found.
The two impacts to access focused on for my study are affordability and
restrictive admissions, enrollment, and recruitment practices. These two threats to access
can be motivated by intentional actions instituted by the institutions or unintentional by-
products of actions taken. That is, the result of raising tuition and fees to replace a
decrease or smaller increase in state appropriations as allocated by the performance
funding formula decreases affordability for some students. Additionally, to improve the
outcomes measured in the performance funding formula, institutions may have altered
their admission, recruitment, and enrollment practices in some way. Both actions are a
threat to student access to higher education.

99
Table 7
Case Selection Criterion
% Change in
Performance
Share Sector
Rank
[Smallest
Increase]
2014–2016
(Asc. Order)
% Change in
FTE Sector
Rank
[Largest
Increase]
2013–2016
(Dec. Order)
% Change in
Stage
Funding
Before Stop-
Loss Sector
Rank
[Largest
Derease]
2013–2016
(Asc. Order)
% Change in
T&F Sector
Rank
[Largest
Increase]
2013–2016
(Dec. Order)
R.A.E.R. R.A.E.R. AFFORD AFFORD
RANK Variable 1 2 4 4
High
1 Institution N N N L
2 Institution A A O F
3 Institution J L H H
4 Institution H F K N
Medium
5 Institution G K F H
6 Institution O J L O
7 Institution F M J J
8 Institution K O G C
Low
9 Institution M G I G
10 Institution L H A I
11 Institution C I C M
12 Institution I C M A
Note 1. R.A.E.R. stands for restricted admissions, enrollment, and recruitment.
Note 2. AFFORD stands for affordability.
Note 3. Highlighted cells indicate the institution was selected for full study.

100
The administrative data gathered and analyzed indicates that all 12 of the eligible
community colleges have increased their fee rates over the three-year period between
2014 and 2016. However, the percentage increases in the rates varied ranging from
+3.6% to +23.7%, with an average change of +6.4% (Appendix E). Tuition and fee rate
increases make the cost of attending a community college in Massachusetts more
expensive for students. Additionally, by reviewing the appropriation allocations in the
performance funding formula over the first three years of its use, the combination of
tuition increases, and appropriation decreases could indicate a negative impact to open
access because of decreased affordability. The variables used for each of the 12
institutions eligible for the full study are shown in Table 8. Each of the 12 institutions
were ranked from 1 (highest potential) to 12 (lowest potential) impact.
Examining enrollment declines and simultaneous increases in the performance
share percentage before the stop loss on the MAPFF reveal a potential of some type of
restrictive admission, enrollment, and recruitment practices. The restricted admissions,
enrollment, and recruitment data reveal that 11 of the 12 eligible colleges have
experienced full-time equivalent (FTE) declines from 2014–2016, ranging from -2.4%– -
13.0%, with an average change of -4.9%. The performance share percentage showed
variations over the same period ranging from 0.8%–10.0%, with an average change of
7.0%. The colleges were not penalized for these large changes in performance share
percentage due to the stop-loss adjustment. There were also some institutions that
received less state funding after the stop loss than before (Appendix D).
The performance share percentage ranked by smallest to largest increase (Table 7)
for each institution is a calculated result indicating how well the institutions performed

101
with student completions and the alignment criterion as defined in the MAPFF (Figures 2
& 3), which determines a significant portion of the state funding received. The
percentage change in FTE, ranked largest to smallest increase, and the percentage change
in tuition and fee rates, ranked largest to smallest increase, (Table 7) are independent and
not determined by the MAPFF.
Each institution shown in Table 7 was ranked in either ascending or descending
order from 1–12 for each variable and categorized into three levels of potential negative
impact to access (high, medium, and low). High potential is assigned when the
quantitative administrative and secondary data variables ranked 1–4, reflecting the
highest chance where the institution took actions and changes that either may have
negatively impacted access through decreased affordability or restricted admissions and
or enrollment and recruitment practices, or both. Medium potential was assigned when
the same data variables ranked 5–8, reflecting actions or changes that either may have
decreased affordability or restricted admissions, enrollment, and recruitment practices.
Low potential was assigned where the same data ranked 9–12, reflecting the smallest
chance where the college took actions or changes that either may have negatively
impacted access through decreased affordability or restricted admissions, enrollment, and
recruitment practices.
The affordability criterion (AFFORD) in Table 7 considers two variables, the
percentage change in state funding before the stop loss, ranked from the largest decrease,
1 (high potential), to the smallest decrease, 12 (low potential), and the percentage change
in T&F from the largest increase, 1 (high potential), to the smallest increase, 12 (low
potential). This combination of large tuition and fee increases and large reductions in

102
state appropriations before the stop-loss adjustment indicated the potential that
institutional actions were taken seeking to replace less state appropriations with tuition
and fee revenue, resulting in decreased affordability of attending these institutions. Out of
the two threats to access, decreased affordability will be easier to determine.
The restricted admissions, enrollment, and recruitment criterion (R.A.E.R.) in
Table 7 considers two additional variables, the percentage change in performance share,
ranked from the largest decrease, 1 (high potential), to the largest increase, 12 (low
potential), and the percentage change in FTE enrollment declines, ranked from the largest
decrease, 1 (high potential) to the largest increase, 12 (low potential). This combination
of performance share percentage increases, as measured by the MAPFF, against the
change in FTE enrollment declines, may reveal actions taken by the institutions to
improve the institutional scores on the MAPFF through more restrictive admissions,
enrollment, and recruitment practices. It is anticipated that institutions that fall into the
high potential range would have the greatest chance of supporting the conceptual
proposition that the MAPFF negatively impacted access through literal replication (Yin,
2009). Alternatively, it is anticipated that institutions in the medium and low potential
ranges will reveal contrasting results, no negative impact on access, through theoretical
replication (Yin, 2009).

103
Table 8
Case Selection Criterion Continued
Average Ranking
of R.A.E.R.
Variables 1 & 3
Average Ranking
of AFFORD
Variables 2 & 4
Average Ranking
of the 4 Variables
% Change in Perf.
Share Sector Rank
[Smallest Increase]
2014–2016 (Asc.
Order)
R.A.E.R. AFFORD Both P. Share %
Institutions Rank Rank Calc. Rank
A 2.1 11.0 6.5 2
C 11.5 9.5 10.5 11
F 5.5 3.5 4.5 7
G 7.0 8.5 7.8 5
H 7.0 4.0 5.5 4
I 11.5 9.5 10.5 12
J 4.5 7.0 5.8 3
K 6.5 3.5 5.0 8
L 6.5 3.5 5.0 10
M 8.0 11.5 9.8 9
N 1.0 2.5 1.8 1
O 7.0 4.0 5.5 6
Note 1. High Potential Range 1–4
Note 2. Medium Potential Range 5–8
Table 8 shows that institutions N and F, with an average ranking of 1.8 and 4.5
respectively for all four variables, decreased affordability (AFFORD) and restricted
admission, enrollment, and recruitment (R.A.E.R.) were selected for the study because
they exhibit the best chance of literal replication of a negative impact to access.
For the selection of the third and fourth case institutions, additional variables were
considered. The first additional variable used was the FY16 state funding dollars awarded
after the stop loss adjustment. This variable is ranked from smallest to the largest and
indicates the size of the institution based on the final state funding dollars in FY16. I
believe that institutions receiving less state funding would rely more on tuition and fees

104
to effect changes in their institutions to make improvements in the key areas measured by
the MAPFF to receive more state funding in the subsequent years.
The second additional variable was the percentage change in performance share
over the three years of the study, FY2014–FY2016, ranked from lowest to highest (Table
8). The percentage change in performance share was chosen because it reflects the impact
the formula had on each of the institutions over the first three years of the formula rather
than the impact of any single year. The MAPFF calculates and uses the performance
share percentage to determine the allocation amount based on performance, the second
component of the formula, focused on student success measures, before the stop-loss
adjustment. Lower performance share indicates weaker performance in the metrics
measured by MAPFF (Table 3), when compared to all of the institutions in the sector and
would lead to less state funding should the stop-loss adjustment be phased out.
Institutions A, G, H, J, K, L, and O all fell within the medium potential range for
the combined (AFFORD) and (R.A.E.R.) variables and were considered for the study
(Table 8). However, when considering decreased affordability by itself, only institutions
G and J fell within the medium potential range, with an 8.5 and 7.0 respectively. To
select the third case institution, I reviewed which of these two institutions received less
total state funding because I believed that this, together with the (AFFORD) variable,
would have a moderate chance of revealing an impact to access. Institution J was the
third institution selected for the study because it fell into the medium potential range for
both of the (AFFORD) variables and the (R.A.E.R.) variables and received slightly less
state funding than institution G.

105
The fourth and final institution selected for the study was institution C. The
average ranking for institutions C, I, and M all fell within the low potential range for the
combined (AFFORD) and (R.A.E.R.) variables, with combined scores of 10.5, 10.5, and
9.8 respectively, and were considered for the study (Table 8). However, institution C was
the fourth institution selected for the study because it received the most state funding in
FY2016 after the stop-loss adjustment and had the second highest performance share
score out of all 12 institutions. This combination of the most state funding and the second
highest performance share indicated the lowest potential for a negative impact to access
because there would be little to improve upon as far as the MAPFF metrics are
concerned. The four institutions, N, F, J, and C were ranked higher potential to lower
potential, respectively, for impacting access because of the MAPFF. These four
institutions were examined in the qualitative portion of my study.
Performance funding programs embody theories of action (Argyris & Schon,
1974) to improve student outcomes. Using revenue maximization theory, the MAPFF,
through “material incentives that mimic the for-profit motive for business” (Dougherty &
Reddy, 2011; Levin, 2005), incentivizes the community colleges in the commonwealth to
improve student outcomes. The MAPFF Program allocates all of the state appropriations
based on three formula components described earlier (Table 2): base share (BS), which
considers the enrollment variables; performance share (PS), which includes the
completion and alignment variables; and cost-of-operation subsidy (COS). The formula
culminates with a composite score for each of the 15 community colleges that determines
the amount of state appropriation before the stop loss adjustment (ABSL). A greater
amount of state appropriations is achieved by institutions outperforming other institutions

106
on the base share (BS) and the performance share (PS) components of the formula. A
review of each institution’s results from the MAPFF for each of the first three years of
use was conducted to identify colleges with decreased state appropriations before the
stop-loss adjustment.
The expectation is the MAPFF influenced institutional changes that negatively
impacted access for the case institutions that have a high potential composite score of the
selection criteria and not influenced changes that negatively impacted access for the case
institutions that have a low potential composite score of the selection criteria. As
delineated in the literature review, these negative impacts have been cited in other
research as indicators for negative impacts of performance funding programs in other
states. The case selection process is similar to several studies on the unintended impacts
of performance funding referenced in the literature review (Lahr, et. al., 2014;
Dougherty, et. al., 2014).
Survey and Interview Data Analysis
The results of the surveys and the interviews of the senior administrators from
case institutions 2, 3, and 4 were examined. Unfortunately, only one participant from the
Case 1 institution completed the survey, and no one participated in the interview portion
of the study after giving IRB approval. The Case 1 institution’s unwillingness to
participate is unfortunate because the quantitative administrative and secondary data
displayed the highest potential for the leaders of the institution to have taken actions that
would have negatively impacted access. Also, of note, the financial impact of the MAPFF
is more extreme at the case 1 institution. The MAPFF results showed a reduction in state
appropriations of 24.94% before the stop loss adjustment, indicating the lowest change in
107
performance share percentage. The stop loss adjustment significantly helped the case 1
institution with receiving 16.48% more appropriations after the adjustment. The data also
show the case 1 institution increased tuition and fee rates by 11.41% between FY2013
and FY2016. Although the data from the remaining three participating case institutions
support the findings and helped answer the research questions, the number of institutions
was a relatively small percentage of the total population. The data was manually coded
using multiple first cycle and second cycle coding methods (Saldana, 2009). The First
Cycle coding methods used were the Attribute and Exploratory methods (Saldana, 2009).
The attribute coding included the demographic information about the case institutions
and the participant characteristics. Attributes and characteristics, overall enrollment size
of the institutions, and the participants’ position title and tenure of employment at the
institutions were used. The exploratory method of coding included the holistic and basic
elements of the data compiled into themes (Saldana, 2009). Provisional data coding was
used under this method, employing a predetermined start list set of codes that were
developed from the anticipated categories and from other studies referenced in the
research in the literature review (Saldana, 2009). This list of coding was consistent with
the two threats of access being studied, decreased affordability and restrictive admissions,
enrollment, and recruitment practices.
The second cycle coding method used was pattern coding (Saldana, 2009). Pattern
coding grouped the summaries of the first cycle coding into a smaller number of
categories or themes. The identification of themes that came from the data was grouped
and summarized into categories under the two threats of access. With the relatively small
amount of data, both first and second cycle coding was completed manually. The coded

108
results of the survey and interview data of the institutional leaders are found in
Appendices N and O.
The coded results were then compiled and compared against the two themes of
access impact: (a) affordability; and (b) restriction of admissions, enrollment, and
recruitment. When analyzing and coding the data, a third theme emerged. Similar and
recurring responses were received from each of the case institutions that the MAPFF is
insignificant and an unimportant measure of performance. Due to the stop-loss adjustment,
not only did no college received less state appropriations between 2014 and 2016, but they
received at least a 3.5% increase in FY2014 and FY2015, and a 2.5% increase in FY2016
regardless of their performance outcomes as measured by the formula.
Finally, a cross-case analysis was also conducted to aid in the identification of
similar or dissimilar patterns of results on decreased affordability and/or restrictive
admission, enrollment, and recruitment practices and identify replication.
Cross-Case Analysis
A cross-case analysis technique is appropriate to use when a case study has at
least two individual cases (Yin, 2009). All three cases, (C2, C3, and C4 institutions) were
examined together using a cross-case synthesis analytical technique (Yin, 2009), to
understand and identify if either or both threats to access, decreased affordability, and
restrictive admission, enrollment, and recruitment practices, was present, as well as how
the performance funding formula influenced the results. The review of these three cases
helped support my proposition of a negative impact on access. The findings of all three
individual case studies were compiled, coded, and reviewed to reveal the findings as
decreased affordability, restrictive admissions, enrollment, and recruitment. The overall
109
pattern of findings compiled and examined was used to identify similar patterns that
supported and contradicted my proposition that the MAPFF negatively impacted access.
Validity and Reliability
Throughout the study, I used the four tests of validity “common to all social
science methods” (Yin, 2009; “Criteria for Judging the Quality of Research Designs,”
para. 3). Yin, (2009) describes four tests the researcher should use to demonstrate the
quality of the research study: (a) construct validity, (b) internal validity, (c) external
validity, and (d) reliability. The construct and reliability tests were addressed in the data
collection phase of the study. The external validity was addressed as part of the overall
research design. The internal validity was addressed during the data analysis phase.
Construct validity. Construct validity identifies correct operational measures for
concepts being studied (Yin, 2009). The participants in my study perceived their
institutions were not getting enough funding from the state from the MAPFF. To
understand this perception, multiple sources of information were used, including
quantitative administrative and secondary data and qualitative data to improve credibility
and reliability of the findings. Actual state appropriation amounts, the annual increases
for each of the 15 community colleges, and the total annual appropriations for the sector
were examined from immediately prior to the study period and during the study period.
The stop-loss adjustment for each of the case institutions was also examined to determine
the impact it had on their perception. The data collected and analyzed did not support the
perceptions of the senior administrators that the state did not provide sufficient increases
in funding for their institutions through the MAPFF.

110
To demonstrate decreased affordability (AFFORD), the following quantitative
administrative and secondary data variables were collected and analyzed: a) state
appropriation amounts and change percentages before and after the stop-loss adjustment;
b) tuition and fee rates and change percentages; and c) cost of operations amounts and
change percentages. To demonstrate restrictive admission, enrollment, and recruitment
practices (R.A.E.R), the following data variables were collected and analyzed (a) FTE
enrollments and change percentages, and (b) performance share percentages and changes.
Additionally, I sought responses to specific survey questions (Appendix H) and one-on-
one interview questions (Appendix L) that provided feedback on the motivations, the
decision-making processes used, and the perceptions of the senior administrators in
reaction to the MAPFF. Previous research has found that some colleges subject to a
performance funding formula, have reported increased cost of review and compliance and
initiated restrictive admissions and enrollment practices (Dougherty et al., 2013, 2014;
Dougherty & Reddy, 2011, 2013; Lahr, et al., 2014; Latimer, 2001; Tandberg, et al.,
2014; Wood, 2007).
Internal validity. Yin (2009) describes internal validity for exploratory case
studies where the researcher infers that a particular event results from some earlier
occurrence. Drawing upon previous research where implementation of a performance
funding formula has led to negative consequences, such as restrictive admissions and
increased cost of compliance and review, I developed the following protocol to capture
data necessary to determine how the MAPFF influenced access through decreased
affordability (AFFORD) and restrictive admissions, enrollment, and recruitment practices
(R.A.E.R.): (a) research questions, (b) case study research design, (c) conceptual

111
framework, (d) selection of the case institutions, (e) quantitative and qualitative data
collection procedures, (f) analysis of the data collected, (g) discussion of the findings, and
(h) conclusions. I based my conclusions on the robust quantitative administrative and
secondary data and the qualitative data collected and analyzed during the study. Rival or
alternate explanations were anticipated and enumerated to help address the causes of
changes that may point away from the MAPFF as the reason for an impact to access
(Appendix G).
External validity. Yin (2009) described analytic generalization as when a
previously developed theory is used as a template to compare the results of the case
study. Selective admission, enrollment, and recruitment actions were found in previous
case studies on both two- and four-year public institutions in multiple states (Dougherty
& Reddy, 2011, 2013; Dougherty et al., 2014; Rutherford & Rabovsky, 2014). I used four
case institutions in my study to test the proposition that through the implementation of a
performance funding formula, the MAPFF, access was negatively impacted through
restrictive admissions, enrollment, and recruitment (R.A.E.R.) and through decreased
affordability (AFFORD). Case institutions C1 and C2 were selected and grouped as high
potential to negatively impact access. Case institutions C3 and C4 were selected and
grouped as lower and low potential to negatively impact access respectively.
I reviewed and analyzed how the four case institutions impacted student access in
reaction to the implementation of the MAPFF in 2014. The MAPFF allocates all of the
state appropriations for the 15 community colleges. Although the surveys and other
quantitative and qualitative data were used to gather some information from participants

112
of the four case institutions, analytic, rather than statistical generalization, was used to
analyze the findings.
Reliability. Reliability is demonstrated by ensuring that the operations of a study
can be repeated with the same results (Yin, 2009). This case study protocol
operationalizes and documents the process that was followed in the execution of the
study. Outlining and documenting the process enhances reliability because it allows the
study to be repeated and it minimizes errors and biases. The clear definition of the study
procedures, sampling, design, and analysis, described in the study protocol, contribute to
reliability. As described earlier, I used publicly available data to analyze and select the
case institutions for this multiple case study. Specified positions at each case institution
were invited to complete the online survey and the one-on-one interview. Positions
selected for knowledge of the MAPFF helped me obtain the balance of the data that
answered the research questions about the impact on student access. The data from the
case institutions were analyzed individually and using a cross-case analysis technique.
Data dependency. To ensure the validity of the data, I used the highest quality
data from recognized sources. The sources of the data outlined above for each of the four
case institutions were obtained directly from the Massachusetts Department of Higher
Education HEIRS website, from the Federal IPEDS higher education data repository, and
directly from the institutions themselves. The HEIRS data are submitted directly by each
institution annually and are the most reliable and consistent information available.
Additionally, other researchers can easily find this data. The identical survey was
administered to the senior leadership at each of the case institutions. The interview
protocol began with broad and general questions for each institution but was customized

113
based on the survey responses to provide clarity and ensured that I’ve interpreted the
survey data correctly. Data triangulation occurred from the three data gathering methods
outlined to determine alignment, either supporting or contrasting the theoretical argument
that the MAPFF negatively impacts access. This triangulation cross-checked the data and
increased validity (Figure 2). Evidence from each of the case studies added more
compelling and robust findings that achieved reliability and validity of the results.
Creswell (1994) discussed the need to find convergence among sources of
information and to employ different methods of data collection. Yin explains that when
two or more cases are shown to support the same theory and do not support a rival theory,
that replication is achieved (Yin, 2009).
Figure 2. Data triangulation.
My study’s method of validity and triangulation followed several of the case
studies researched. In the study of the 20-year history of performance funding at the
Quantitative Administrative and
Secondary Data
Qualitative
Interview Data
Quantitative Survey Data

114
University of Memphis, Latimer (2001) collected and examined documentary data, as
well as interviews and observations. The researcher used the documentary data to
corroborate and augment the evidence found from the other sources. In the Woodland
Hills case study, the researcher used interviews as the primary method of inquiry.
However, the researcher also used documentary data to corroborate information gained
from the interviews.
In my study, quantitative administrative and secondary data, quantitative and
qualitative survey, and qualitative interview data were used to corroborate and triangulate
the information captured and thus improved the data analysis. Alternative explanations,
(Appendix G), include several reasons for increasing tuition and fee rates that may be
unrelated to the performance funding formula. To identify and eliminate alternative
explanations for decreased affordability and restricted admission practices, I summarized
the qualitative data summarized and identified competing issues. Competing issues
unrelated to the MAPFF guided me to listen to the participants’ interview responses
carefully and probe for the actual causes. The senior administrators’ interview responses
teetered between factual data and their perceptions of the same data. The gap between
factual and perceptional responses are discussed further later in Chapter IV. I coded and
analyzed the survey data and one-on-one interviews. The variables in Appendices C and D
for fiscal years from 2013, the year before the start of the MAPFF, through 2016, the third
year of using the formula, were compiled and compared against the average results of the
15 institutions for the same period.

115
Researcher Bias
As a former vice president of finance and operations, and a senior, cabinet-level
administrator at a community college in Massachusetts, I became very familiar with the
performance funding formula used to allocate state appropriations to all 15 community
colleges in Massachusetts. Additionally, as a senior level administrator for several years
in New Jersey, I spent a considerable amount of time working with community college
funding not allocated via a performance funding formula. I have also worked extensively
on developing institutional strategic plans and how they effect change that involves both
student access and success. These experiences gave me a strong foundation and
framework to position and develop my study.
As the vice president of finance of a community college in Massachusetts, I bring
a valuable component for my study rather than a bias to be eliminated. In my capacity as
a senior administrator at a community college in Massachusetts, I participated in
discussions with the president and other senior members of the president’s cabinet about
the MAPFF outcomes each year at my institution. I also participated in meetings with the
vice presidents of finance at most of the other community colleges and leaders from
MDHE, where the MAPFF and the amount of state appropriations were discussed.
It was my responsibility as the Vice President of Finance to prepare a balanced
annual operating budget for my former institution. Preparing the operating budget is part
of the responsibilities of the vice president of finance at all of the community colleges in
Massachusetts. A balanced budget is achieved when the total forecasted revenues are
equal to the total forecasted expenses. An accurate revenue forecast will help facilitate
better decision making on the expense plans and better control the operational budgets.

116
There are two primary sources of revenue for my former institution, and for all of
the community colleges in Massachusetts, state appropriations and tuition and fees. The
forecasted tuition and fee revenue equal the sum of the projected student enrollment
credit hours times the tuition and fee rates (minus institutional financial aid). As
explained earlier in the chapter, revenue from state appropriations is determined by the
MAPFF. Most of the community colleges in Massachusetts seek approval for their new
fiscal year budgets prior to the end of their current fiscal year (July 1 to June 30). The
results of the MAPFF calculations that determine exactly how much state appropriations
will be awarded to each individual institution, are not available until after the new fiscal
year budgets are adopted. When trying to project the state appropriation revenue for a
new fiscal year, the minimum guarantee built into the formula becomes the initial
budgeted amount expected from the state. The stop loss adjustment portion of the
MAPFF guaranteed a minimum increase in each of the first three years of the formula
(FY2014 – FY2016). Forecasting any amount exceeding the minimum guarantee is
speculative.
Total expenses for the community colleges in Massachusetts and elsewhere,
consist mostly of instructional, student, and institutional expenses. Staff and faculty
salaries and benefits make up a majority of the expenses (80% or more). Additionally,
utility costs, information technology costs, and facilities costs regularly increase each
year.
In the preparation of the new fiscal year budget, when the projected expenses
exceed the projected revenues, strategic decisions must be made at the senior
administrative level to correct this imbalance. In my experience at my former institution

117
in Massachusetts and in New Jersey, obstacles exist that make it difficult to reduce
expenses in a significant way. Staff and Faculty union contracts stipulate multi-year
salary increases, conditions when reductions in force must be met, as well as other
negotiated terms that impact costs. In the flat or decreasing enrollment environment
taking place in Massachusetts during the study period, the total revenue from tuition and
fees would decrease. It was difficult to forecast an increase in expenses that stayed within
the amount of the guaranteed minimum state appropriation increase from the MAPFF.
Therefore, in order to present a balanced budget to the board of trustees, I and the other
senior administrators at my former institution, made strategic decisions on how much to
increase the fee rates the students pay and speculate on the enrollment change. We also
speculated on how much our student retention, persistence, and other student success
efforts will impact our MAPFF results and provide more state appropriations beyond the
guaranteed minimum increase. Our student success efforts typically involved hiring more
faculty and staff advisors, developing new first year experience programs, purchasing
early alert and case management applications, and more. These efforts added to the
projected expense increases. As a result of my experience, I theorized that the other
community colleges would make similar decisions. Being intimately involved with my
former institution’s budget preparation and strategic decision making, I brought these
preconceptions and biases about increased costs and potential restrictive measures
restricting access to the community colleges to the study.
To mitigate the risk of researcher bias, I used multiple sources of rich
administrative data, a survey with both closed- and open-ended questions, and one-on-
one interviews with multiple subjects with financial, academic, and student services

118
responsibilities at each of the four institutions. Since I was part of the field that my study
is taking place in, there is an inescapable influence that will be present in the interviews.
Reflexivity is the fact that “the researcher is part of the world he or she studies”
(Maxwell, 2013; p 125). I minimized this influence as much as possible and avoided
leading questions during the interviews, and actively listened to the responses of the
interviewees, taking notes and recording the interviews. The data gathered from the
interviews were examined after all of the interviews were completed. Seidman (2006)
states that analyzing the data during the interviews should be avoided as much as possible
to avoid imposing meaning from one participant’s interview onto the next. After all the
interviews, I analyzed the transcripts and carefully coded and interpreted the data.
The coded interview data was added to the cross-case analytic table with the
results from the quantitative administrative and secondary data and quantitative survey
data that identified patterns of responses.
Pilot Study
To help me refine my data collection plans and methodologies and identify
possible problems and set the stage for the actual study, I conducted a pilot study with
two community colleges in Massachusetts, institutions B and E, that were not selected as
one of the institutions for my multiple-case study (Appendix D). The pilot study field-
tested the survey and interview protocols and led to modifications in content and delivery
that helped me gather the data to answer my research questions.
Limitations of the Study
There are five principle limitations to my study, with each discussed below. First,
my study was restricted to a single state, which limited the scope of the research. The

119
study only focused on the Massachusetts Performance Funding Formula, first
implemented in FY2014, and its impact on four community colleges in the
commonwealth through FY2016.
Second, a relatively small number of senior administrators ultimately participated
in the survey. Twenty-eight senior administrative leaders were invited to complete the
survey, and after several months of reminders, only 13, or almost 50%, completed the
survey. Thus, my interpretations are influenced by a small number of community college
administrators.
Third, all quantitative and qualitative research is subject to my analysis and
interpretation (Maxwell, 2013). Because of my former senior financial administrative
position with a community college in Massachusetts, and my familiarity and use of the
MAPFF, the creation of the survey and interview protocols, interactions with the
interviewees, and my data analysis, my subjectivity was unavoidable. However, this
subjectivity was mitigated by conducting a pilot study with two community colleges in
Massachusetts and by working closely with the chair of my dissertation committee, who
was a former community college president at multiple institutions (not in Massachusetts)
and is intimately familiar with the funding and operations of community colleges.
The Fourth limitation is the scope of my study was to determine how the MAPFF
impacted student access and did not attempt to determine how the MAPFF impacted
student success and degree completion. There were no attempts to mitigate this
limitation, although no findings or conclusions are presented on this topic.
Finally, no attempt was made to investigate the perceptions of the senior
administrators that not enough funding was allocated by the MAPFF. The MAPFF
120
allocated 100% of the state appropriations for the community colleges through the
formula and increased the total appropriations each year during the study period. The
perceptions of the senior administrators’ actions were incentivized, although the data did
not reflect the reality of MAPFF. Future research should focus more on perceptions of the
senior administrators.
Conclusion
As mentioned in the literature review, the research conducted thus far on
performance funding has focused on the development of and the process of working with
performance funding formulas and indicates some positive impacts. Despite the positive
impacts of the performance funding process as discovered in the research conducted to
date, the research indicates that existing performance funding programs encounter
significant obstacles to success and produce significant unintended impacts on students
and colleges (Smith, 2015; Tandberg & Hillman, 2011; Dougherty & Reddy, 2011), such
as restrictive admissions, enrollment and recruitment practices, relaxing academic
standards to improve student success, and/or making it too expensive for some students to
attend a community college because of increases in tuition and fees, all of which
indicates a negative impact on student access.
The significance of my study was to determine if community colleges in
Massachusetts are turning students away from a chance of a college education because of
the imposition of performance funding. Massachusetts is one of a number of states that
have adopted some form of performance funding, so it is important for the field to
understand the phenomena and its impact on students. Understanding how Performance

121
Funding affects access will inform decision-makers at the policy and college level on
future strategy.

122
Chapter IV
Findings
This chapter presents the findings from a multi-case study of the impact a
Performance Funding program has on the open-access mission at a sample of community
colleges in the Commonwealth of Massachusetts. The chapter begins with a review of my
study and builds upon existing research, followed by the research questions. Next the
quantitative administrative and secondary data and the qualitative data collected are
discussed. The chapter concludes with a summarization of six significant findings.
Building Upon the Research
Evidence has been found in prior research that performance funding has had a
negative impact on access through creaming and bypassing certain high schools for
recruiting because of low success rates and other restrictive admission, enrollment, and
recruitment practices. Evidence was also found that performance funding programs have
increased costs of review and compliance for the institutions. My study builds on findings
that performance funding has negatively impacted institutions in various ways and
examines the direct impact on the open-access mission of community colleges with its
focus on two threats to access, decreased affordability and restrictive admissions,
enrollment, and recruitment. The results of the study address how the MAPFF negatively
influenced the open-access mission of community colleges in Massachusetts.
The Department of Higher Education of the Commonwealth of Massachusetts
espoused three primary goals for their public higher education institutions. The first goal
was the continued affirmation of the primary mission of the community colleges in
Massachusetts to provide open access to high quality, affordable higher education for the
123
states’ citizens. The second goal was the creation of the Vision Project to strengthen
academic performance, while holding the public institutions accountable to the public for
results (MDHE, 2013). The third goal, a sub-component of the Vision Project, was the
development of the Massachusetts Performance Funding Program (MAPFF) to allocate
the state appropriations and incentivize the community colleges to improve student
success and completion by allocating a significant percent of the total state appropriations
through the MAPFF.
My study’s proposition is that the open-access mission will be negatively
impacted in the Massachusetts community colleges in the form of decreased affordability
and/or restrictive admissions, enrollment, and recruitment practices. As documented in
the literature review in Chapter II, research has shown that these two threats to access
have been found in other studies researching the impacts of the use of a performance
funding formula to allocate state appropriations.
Quantitative Administrative and Secondary Data
Through examination of quantitative data, four institutions were selected for the
study, two with a high probability of negatively impacting access, one lower potential
and one low potential of negatively impacting access. My expectations are the high
probability case institutions 1 and 2 will show similar results and demonstrate an impact
to access, while the lower probability case institution 3 and the low probability case
institution 4 will show similar results and would show a lower impact to access.
The four case institutions, grouped into the high potential to low potential for
impacting the open access mission, are listed in Table 9, with two additional variables

124
added from the financial statement audits prepared by independent auditing firms: (a) the
operating expense change percentage, and (b) operating cost per FTE percentage change.
As a reminder, high potential is assigned when the quantitative administrative and
secondary data variables ranked 1–4, reflecting the highest chance where the institution
took actions and changes that either may have negatively impacted access through
decreased affordability or restricted admissions and or enrollment and recruitment
practices, or both. Medium potential was assigned when the same data variables ranked
5–8, reflecting actions or changes that either may have decreased affordability or
restricted admissions, enrollment, and recruitment practices. Low potential was assigned
where the same data ranked 9–12, reflecting the smallest chance where the college took
actions or changes that either may have negatively impacted access through decreased
affordability or restricted admissions, enrollment, and recruitment practices.

125
Table 9
Quantitative Data
Results C1 – High C2 – High C3 – Lower C4 - Low
Increase T&F & Additional Fees
(Actual) 11.41% 16.52% 6.27% 5.67%
FTE Decrease (Actual) -12.94% -7.52% -5.28% 0.52%
State Appropriations $
FY16 – FY13 Before SL (Calc) $32,119 $70,174 $52,834 $91,546
State Appropriations %
FY16 - FY13 Before SL (Calc) -24.94% 20.29% 38.3% 60.93%
State Appropriations $
FY16 – FY13 After SL (Actual) $41,554 $70,698 $50,247 $84,531
State Appropriations %
FY16 – FY13 After SL (Actual) 16.48% 23.14% 29.77% 44.52%
State Appropriation $ Change
FY16 - FY13 After SL
(Calc vs. Actual)
$9,435 $524 $-2,587 $-7,015
Stop Loss Impact %
FY16 – FY13 (Actual) 29.4% 0.7%% -4.9% -7.7%
Operating Expense Change (Calc) 3.8% 4.8% 12.8% 9%
MAPFF Performance Share %
Change (Actual) 0.80% 8.0% 4.9% 9.6%
Impact on Access - Yes Yes Yes
Tuition and fees. As explained previously in Chapter III, the MDHE has
determined and set the level for the tuition component of the total tuition and fees
charged to students. The MDHE requires the colleges remit all in-state revenue received
from the tuition component back to the commonwealth (Malone, 2014). All out-of-state
tuition revenue is retained by the colleges. The Department of Higher Education in
Massachusetts has determined and set the level for the tuition component, remaining

126
largely unchanged for more than a decade, and only permits each college to change the
variable fee component. Students pay a single rate, which is referred to as the tuition and
fee rate. Other fees established and changed individually by each college, such as student
activity fees, facilities, or parking fees, may be components of the variable fee portion of
the total tuition and fee rate or may be separately charged.
The tuition and fee increase for Case 1 and Case 2, 11.41% and 16.52%
respectively, exceeded the 15-community college sector increase of 8.2%. Alternatively,
the tuition and fee increase of 6.27% for Case 3 and 5.67% for Case 4, are less than the
sector average. Tuition rates are generally established by the Department of Higher
Education in Massachusetts. However, each college has the autonomy to change their
fees rates to accommodate their individual institutional financial needs.
State appropriation change before stop loss. The percentage changes shown in
Table 9 represent the average difference between the total appropriations before the stop-
loss adjustment, in comparison to the previous year over the first three years of the
MAPFF (FY2014–FY2016). Each case institution would have received the total
allocation of appropriations before the stop loss based solely on the results of the
performance metrics within the MAPFF had the stop-loss adjustment not been applied.
The MDHE initially stated that the stop loss adjustment would be phased out after four
years.
Case 1 would have lost a significant amount of state appropriations and should be
motivated to initiate actions to improve outcomes as measured by the MAPFF. Case 2
would have gained but should have been motivated to improve because it saw the other
institutions receiving significantly larger shares. The high gains for the Case 3 and 4

127
institutions suggest they were doing a good job as measured by the MAPFF and had
limited incentive to take actions to improve.
Performance share percentage. As previously explained, there are four
components that make up the state appropriation allocation using the MAPFF for each
institution: (a) base allocation, (b performance allocation, (c) flat cost of operation
subsidy, and (d) stop loss adjustment (Table 3). The base allocation is determined by the
enrollment variables as defined by the formula. The performance allocation is determined
by the student success, completion, and alignment variables in the formula and is added
to the base share. The performance share percentage, the second component, indicates
each institution’s results on student success outcomes on the MAPFF metrics in relation
to all the community colleges in Massachusetts. The third component, the flat cost of
operation subsidy, is $4,500,000 given to each institution regardless of performance or
size. The base allocation, the performance share percentage, and the cost-of-operation
subsidy is used to determine the amount of the state appropriation that would be allocated
by the formula before the application of the “hold harmless” or stop-loss adjustment
amount.
The performance share of the sector of 15 community colleges in Massachusetts
averaged 6.7%. Institutions with a performance share less than the average 6.7%, indicate
lower performance as measured by the MAPFF compared to the other institutions in the
sector and would receive a smaller proportion of the total state appropriation allocation
before the stop loss adjustment. Conversely, institutions with a performance share greater
than the average 6.7%, indicate higher performance as measured by the MAPFF

128
compared to the other institutions in the sector and would receive a greater proportion of
the total State appropriation allocation before the stop-loss adjustment is applied.
Over the first three years of the MAPFF, the Case Institution 1, high potential to
impact access, showed very little improvement, while Case Institutions 2, 3, and 4
showed better increases in performance share. The Case 2 institution was also ranked as
high potential to impact access because it ranked second in the R.A.E.R. and AFFORD
variables (Table 8). However, it scored better in the performance share percentage, the
second component, than the sector average. The Case 3 institution was ranked as lower
potential to impact access. The Case 4 institution, low potential to impact access, showed
the most improvement in performance share percentage, the second component, over the
first three years of the MAPFF, showing they already have strong performance on the
measures. Although Case Institutions 3 and 4 were ranked as lower and low potential to
impact access respectively, both were found to have negatively impacted access. In fact,
the high potential Case Institution 2, and both low potential Case Institutions 3 and 4,
were found to have negatively impacted access, although this finding was not expected.
During the one-on-one interviews, the respondents from the Case Institution 3 indicated
that the institution had to reduce student aid by $600,000 because of the perceptions of a
lack of funding from the state. The respondents from the Case 4 institution indicated that
part of that college’s $10 per-credit-hour fee increase was due to their perception of a
lack of funding from the state. Note, the Case 3 institutions received an additional $3.277
million in state appropriations in FY2016 beyond what it received in FY13. The Case 4
institution received an additional $7.8 million in state appropriations in FY2016 than it
received in FY13.

129
Percentage change in operating expenses. Operating expenses were collected
from the annual financial statement audits from the four case institutions and were not
used in the case selection criteria. Two of the four case institutions showed increases in
operating expenses that were greater than the sector average. Case 3, 12.8% and Case 4,
9% exceeded the sector average increase of 7.92%. Case 2 increased less than the sector
average with a 4.8% increase. Case 1 had the least increase in operating expenses, with a
3.8% increase. Although both the Case 3 and 4 institutions would have received much
higher state appropriations before the stop-loss adjustment, 38.37% and 60.93%
respectively, Case 3 institution received $2.6 million less state appropriations after the
stop-loss adjustment and the Case 4 institution received $7 million less. Case 3 and 4
received larger state allocation increases giving them more money to spend. The increase
in expenses greater than the sector average at the Case 3 and 4 institutions may indicate
potential actions taken by these institutions over the FY2014–FY2016 period that
increased costs in response to their outcomes on the MAPFF even though the Case 3
institution was categorized as lower potential and Case 4 as low potential threat to access.
The responses to the survey and interview questions provided more detail to help with the
assessment of the increases at these institutions and how they chose to use their increased
funds.
Stop-loss impact. The stop-loss adjustment added to the MAPFF went beyond
preventing a loss of appropriations found in previous studies. Instead, the stop-loss added
to the formula guaranteed that each institution would receive a minimum increase of
3.5% in FY2014 and FY2015, and 2.5% in FY2016. Table 9 shows that Case 1 institution
would have received 24.94% less state appropriation over the first three years of the

130
MAPFF had it not been for the stop-loss adjustment. Case 2, Case 3, and Case 4 all
would have received more appropriations before the stop loss, 20.29%, 38.37% and
60.93% respectively. However, because of the stop-loss feature of the formula, Case 3
and 4 institutions received less appropriations after the stop-loss adjustment than they
would have before the stop-loss adjustment over the three years under study. Case 3 and
4 institutions still received strong increases after the stop-loss adjustment. This finding
will be discussed in more detail below.
State appropriation increases. The state increased the total appropriation for the
community colleges in each year of the first three years of the MAPFF (2014–2016). The
FY2014 increase was $20 million, 9.6%; the FY2015 the increase was $13.1 million,
5.8%; and the FY2016 increase was $9.1 million, 3.8% for a total over the first three
years of $42.3 million. This data is important because the participants from each of the
four case institutions, indicated during the interviews, that the state has added little new
funding to be allocated by the MAPFF.
Prior to the collection and analysis of the surveys and interview data, review of
the quantitative data indicated actions taken by the institutions to decrease affordability
and restrict admissions during the initial three years of the MAPFF implementation. All
15 community colleges received more state appropriations in each of the three years
under study because of the stop-loss adjustment guarantee. Case 1 institution received a
$9.435 million increase in state appropriations after the stop-loss adjustment overall
(calculated vs. actual), increased tuition and fee rates 11.41, and experienced a 12.94%
decrease in FTE enrollment (Table 9). The Case 2 institution received a small increase in
state appropriations of $523.7 thousand after the stop-loss adjustment overall (calculated

131
vs. actual), increased tuition and fee rates 16.52%, and experienced a 7.52% decrease in
FTE enrollment (Table 9). The Case 3 institution received $2.587 million less in state
appropriations after the stop-loss adjustment overall (calculated vs. actual), increased
tuition and fee rates 6.27%, and experienced a 5.28% decrease in FTE enrollment (Table
9). The Case 4 institution received $7 million less in state appropriations after the stop-
loss adjustment overall (calculated vs. actual), increased tuition and fee rates 5.67%, and
experienced a 0.52% increase in FTE enrollment (Table 9). Each of these case
institutions showed increases in costs and increases in tuition and fee rates that the
students pay, and cases 3 and 4 had diminished appropriations as a result of the stop loss
adjustment. The Case 4 institution is the only institution showing a slight increase in the
FTE enrollment.
The minimum state appropriation increases for each institution were 3.5% in
FY2014, 3.5% in FY2015, and 2.5% in FY2016 after the stop-loss adjustment (Appendix
A). The FY2016 total allocations include the addition of the collective bargaining costs.
Prior to FY2016, the collective bargaining costs were allocated to the institutions as a
supplementary appropriation. The quantitative data show that the Case 1 institution
received an increase in state appropriations of 16.48% between FY2016 vs. FY2013
(Table 9). Their operating cost increases over the same period amounted to 3.8% (Table
9). The quantitative data show that the Case 2 institution received an increase in state
appropriations of 23.14% in FY2016 versus FY2013 (Table 9). Their operating cost
increases over the study period amounted to 4.8% (Table 9). The quantitative data show
that the Case 3 institution received an increase in state appropriations of 29.77% in
FY2016 versus FY2013 (Table 9). Their operating costs increased 12.8% over the same

132
period (Table 9). The quantitative data showed that the Case 4 institution received an
increase in state appropriations of 44.52% in FY2016 versus FY2013 (Table 9). Its
operating costs increased 9% over the same period (Table 9).
Increase in costs, coupled with increases in the fees that students pay, decreases in
FTE enrollment, and the impact of the stop-loss adjustment, indicate actions were taken
at the institutions that impacted affordability and to a smaller degree, enrollment.
However, the responses from the survey and interview data, and the subsequent analysis,
supplements the quantitative data and provides additional support for a correlation to the
MAPFF and potential evidence of causation to a negative impact to student access.
Quantitative and Qualitative Survey Data
Online surveys were administered using Qualtrics to each case institution’s senior
leadership. Invitations to complete the survey were sent out via electronic mail over a
period of two months, along with several reminders.
Thirty-three open- and closed-ended, multiple-choice/multiple-answer questions
were included on the survey. The survey questions focused on the perceptions of the
participants of the MAPFF’s impact on the institutions, the impact on student access, and
the familiarity of the senior leadership and the remaining staff and faculty of the college
community with the formula (see Appendix H). The specific institutional positions in
Appendix M were targeted to complete the surveys because previous research has shown
that the staff in these positions would have the most knowledge of a performance funding
formula and how it may have impacted the decisions made at the institutions (Dougherty
& Reddy, 2013; Hillman, et al., 2014; Tandberg & Hillman, 2013).

133
The cases were compiled into categories, high potential (Cases 1 and 2), to lower
potential (Case 3) and low potential (Case 4), as described previously of evidence
indicative of a negative impact to access (Table 8). These descriptions were further
reviewed in Table 9.
The survey responses by case institution were compiled, coded, grouped, and
categorized into case categories for high potential and lower potential, as shown in
(Appendix N). The survey questions sought responses to several categories of questions,
participant information (Appendix N, 30, 31, 32, and 33), level of review and familiarity
of the MAPFF (Appendix N, 1, 2, 18, and19), perceived importance of the open-access
mission (Appendix N, 14 and 15), actions enacted at the institutions during the study
period (Appendix N, 4, 5, 6, and 7), actions enacted that were influenced by the MAPFF
(Appendix N, 8, 9, 12, and 13) and the perceived impact of the MAPFF on their
institution and on access (Appendix N, 3, 10, 11, 16, 17, 20, 21, 22, 23, 24, 25, 26, 27,
28, 29).
Participant information responses, SQ 30–33. A summary of the respondents
from each case institution is shown in Table 10.
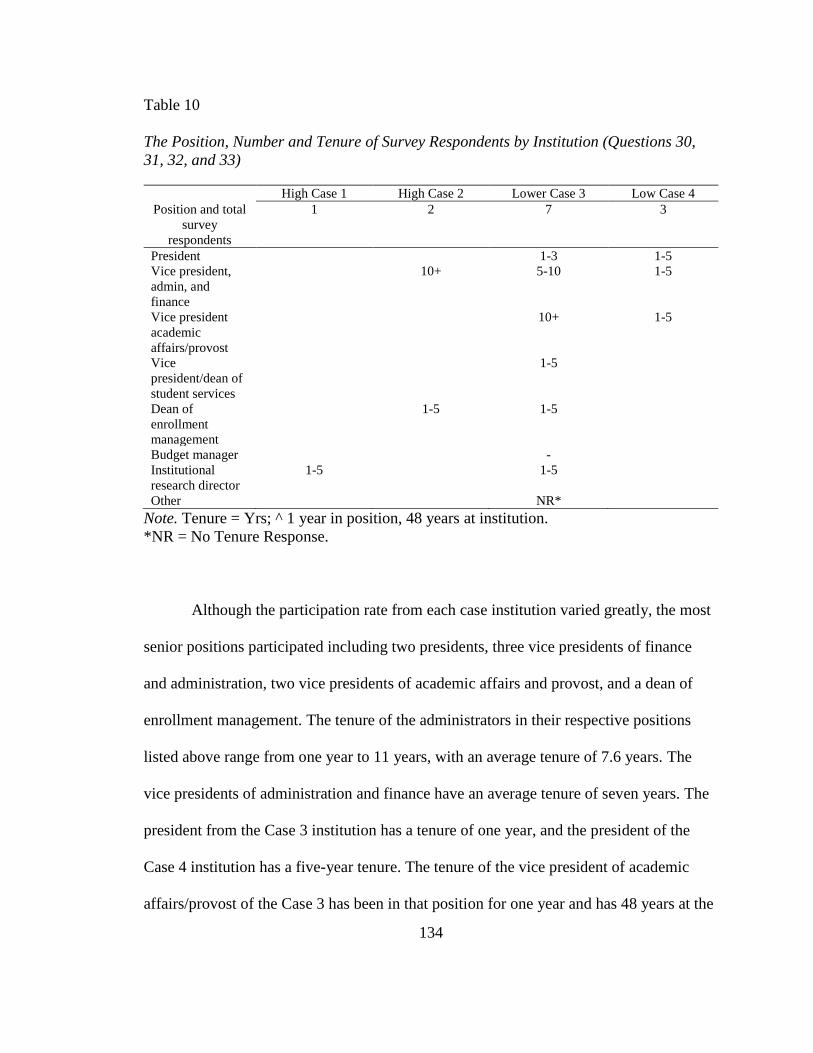
134
Table 10
The Position, Number and Tenure of Survey Respondents by Institution (Questions 30,
31, 32, and 33)
High Case 1 High Case 2 Lower Case 3 Low Case 4
Position and total
survey
respondents
1 2 7 3
President 1-3 1-5
Vice president,
admin, and
finance
10+ 5-10 1-5
Vice president
academic
affairs/provost
10+ 1-5
Vice
president/dean of
student services
1-5
Dean of
enrollment
management
1-5 1-5
Budget manager -
Institutional
research director
1-5 1-5
Other NR*
Note. Tenure = Yrs; ^ 1 year in position, 48 years at institution.
*NR = No Tenure Response.
Although the participation rate from each case institution varied greatly, the most
senior positions participated including two presidents, three vice presidents of finance
and administration, two vice presidents of academic affairs and provost, and a dean of
enrollment management. The tenure of the administrators in their respective positions
listed above range from one year to 11 years, with an average tenure of 7.6 years. The
vice presidents of administration and finance have an average tenure of seven years. The
president from the Case 3 institution has a tenure of one year, and the president of the
Case 4 institution has a five-year tenure. The tenure of the vice president of academic
affairs/provost of the Case 3 has been in that position for one year and has 48 years at the
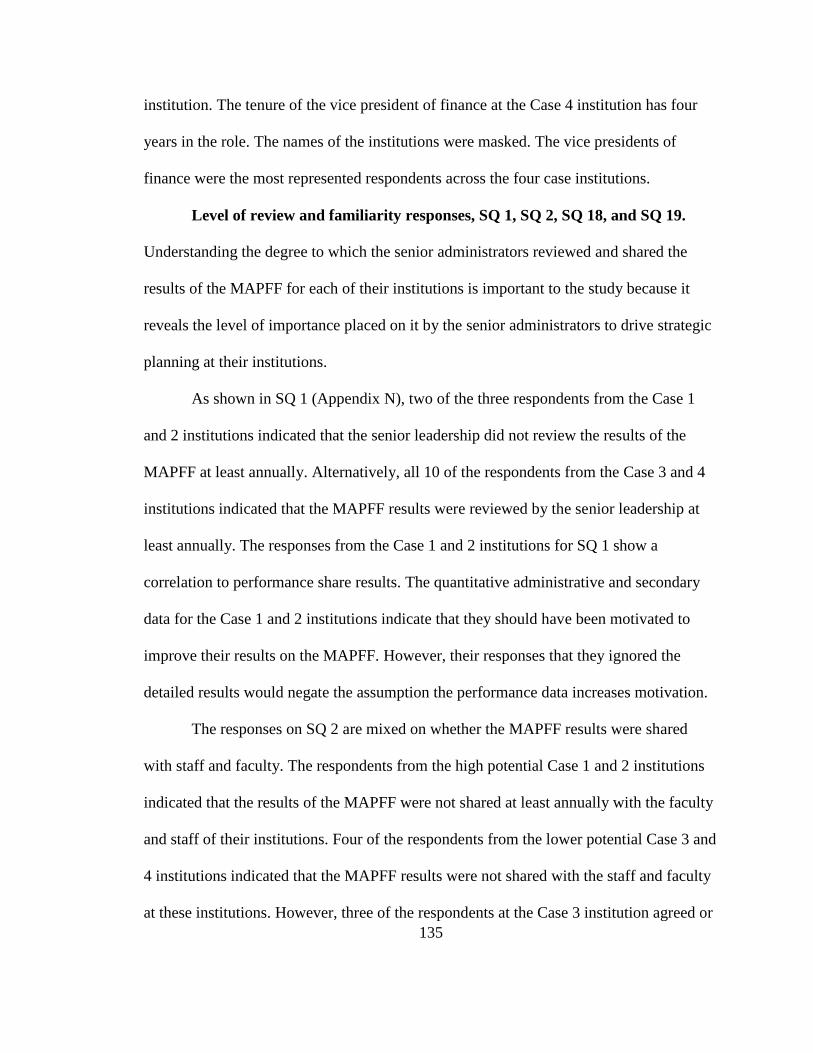
135
institution. The tenure of the vice president of finance at the Case 4 institution has four
years in the role. The names of the institutions were masked. The vice presidents of
finance were the most represented respondents across the four case institutions.
Level of review and familiarity responses, SQ 1, SQ 2, SQ 18, and SQ 19.
Understanding the degree to which the senior administrators reviewed and shared the
results of the MAPFF for each of their institutions is important to the study because it
reveals the level of importance placed on it by the senior administrators to drive strategic
planning at their institutions.
As shown in SQ 1 (Appendix N), two of the three respondents from the Case 1
and 2 institutions indicated that the senior leadership did not review the results of the
MAPFF at least annually. Alternatively, all 10 of the respondents from the Case 3 and 4
institutions indicated that the MAPFF results were reviewed by the senior leadership at
least annually. The responses from the Case 1 and 2 institutions for SQ 1 show a
correlation to performance share results. The quantitative administrative and secondary
data for the Case 1 and 2 institutions indicate that they should have been motivated to
improve their results on the MAPFF. However, their responses that they ignored the
detailed results would negate the assumption the performance data increases motivation.
The responses on SQ 2 are mixed on whether the MAPFF results were shared
with staff and faculty. The respondents from the high potential Case 1 and 2 institutions
indicated that the results of the MAPFF were not shared at least annually with the faculty
and staff of their institutions. Four of the respondents from the lower potential Case 3 and
4 institutions indicated that the MAPFF results were not shared with the staff and faculty
at these institutions. However, three of the respondents at the Case 3 institution agreed or

136
strongly agreed that the MAPFF results were shared with staff and faculty, and two were
not sure.
The responses from the lower potential Case 3 and 4 institutions were inconsistent
on whether the results of the MAPFF were shared with faculty and staff. The responses
on SQ 1 and SQ 2 for all four case institutions may also indicate a lack of importance
being placed on the MAPFF at some of the institutions. These responses support the
finding that the senior administrators are ignoring the MAPFF detailed results and
looking only at the final appropriation amounts. These findings were followed up on
during the interviews and discussed below.
SQ 18 shows two respondents from each of the Case 2, Case 3, and Case 4
institutions indicated their institutions’ result on the MAPFF before the stop-loss
adjustment has been a significant concern with their senior leadership. The responses on
SQ 18 show one respondent from the Case 3 and 4 institution were not concerned with
their results before the stop-loss adjustment. One respondent from the Case 1 institution
and four respondents from the Case 3 institution were not sure if their results on the
MAPFF before the stop-loss adjustment were a concern with the senior leadership.
SQ 19 asked the respondents if there were no concerns to indicate what the
reactions have been. Only one respondent from the Case 4 institution indicated that they
tend to lead in all categories of the formula. This response supports the categorization of
the Case 4 institution as low potential to make changes impacting access, since they
know and understand their performance. However, it also supports that they were
motivated before and already scheduling the changes to make improvements.

137
The responses to SQ 18 and 19 are inconsistent among each institution and across
all four institutions. The respondents indicating a concern over their results on the
MAPFF before the stop-loss adjustment suggest some level of a review of the MAPFF,
although it may be of just the dashboard summary. This was followed up during the
interviews.
The responses received on the level of review and familiarity of the MAPFF from
the four case institutions are inconsistent. Respondents from the high potential case
institutions indicated review was not done, while others from the lower potential case
institutions indicate a review was done. Similarly, the responses also indicate a
perception that the MAPFF results were shared with other staff and faculty, while others
indicated the results were not. Reviewing the results of the MAPFF could indicate
interest on the part of the senior administrators to identify performance deficiencies and
developed plans of action to make improvements. It is of note that the low potential
institutions seem more committed to use the data. Perhaps their commitment to
performance led to the reason they were ranked as low potential to impact access. These
findings also indicate that the stop-loss adjustment had a significant impact on the
effectiveness of the MAPFF and will be discussed later in this chapter.
Perceived importance of access responses, SQ 14 and SQ 15. The responses to
SQ 14 (Appendix N) show that all 13 respondents of the survey strongly agreed that
access is one of the most important missions of community colleges and consistently
indicated that access is an important mission of the community colleges in
Massachusetts. The responses to SQ 15 show that there were no disagreements and no
responses (Appendix N).
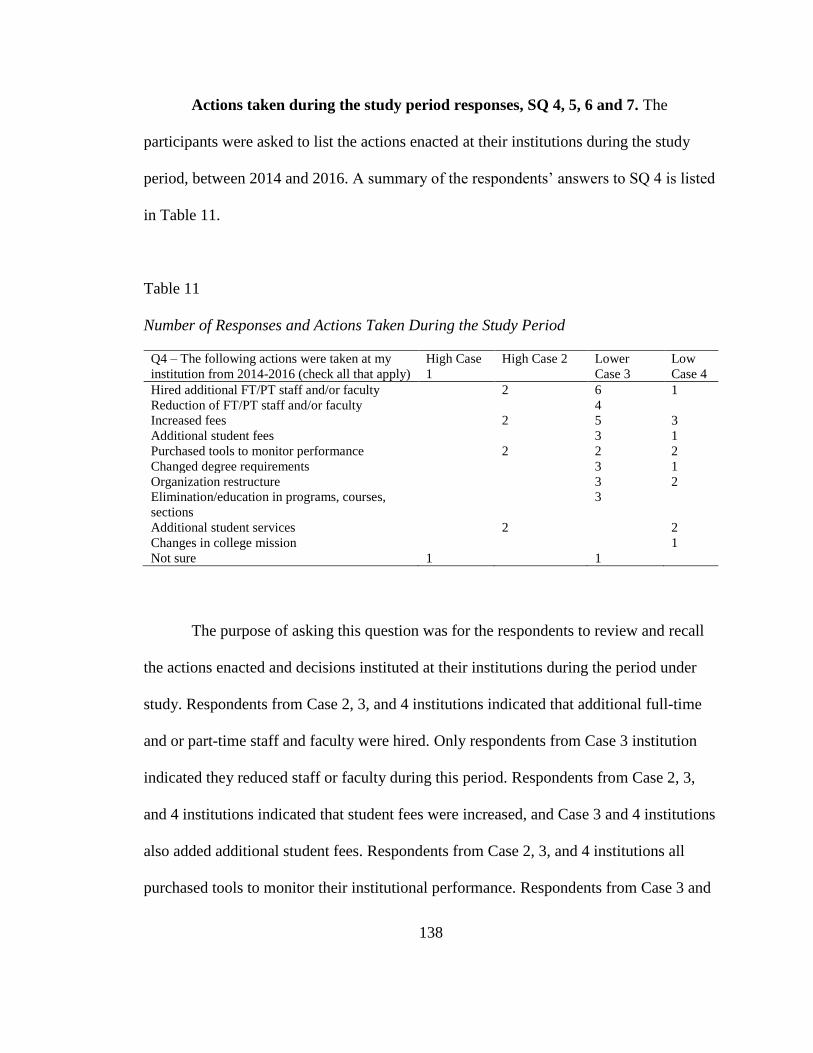
138
Actions taken during the study period responses, SQ 4, 5, 6 and 7. The
participants were asked to list the actions enacted at their institutions during the study
period, between 2014 and 2016. A summary of the respondents’ answers to SQ 4 is listed
in Table 11.
Table 11
Number of Responses and Actions Taken During the Study Period
Q4 – The following actions were taken at my
institution from 2014-2016 (check all that apply)
High Case
1
High Case 2 Lower
Case 3
Low
Case 4
Hired additional FT/PT staff and/or faculty 2 6 1
Reduction of FT/PT staff and/or faculty 4
Increased fees 2 5 3
Additional student fees 3 1
Purchased tools to monitor performance 2 2 2
Changed degree requirements 3 1
Organization restructure 3 2
Elimination/education in programs, courses,
sections
3
Additional student services 2 2
Changes in college mission 1
Not sure 1 1
The purpose of asking this question was for the respondents to review and recall
the actions enacted and decisions instituted at their institutions during the period under
study. Respondents from Case 2, 3, and 4 institutions indicated that additional full-time
and or part-time staff and faculty were hired. Only respondents from Case 3 institution
indicated they reduced staff or faculty during this period. Respondents from Case 2, 3,
and 4 institutions indicated that student fees were increased, and Case 3 and 4 institutions
also added additional student fees. Respondents from Case 2, 3, and 4 institutions all
purchased tools to monitor their institutional performance. Respondents from Case 3 and

139
4 institutions indicated that degree requirements were changed, and a respondent from
Case 4 institutions indicated that there was a change in their college mission.
Respondents from Case 3 and 4 institutions indicated that there were organizational
restructures. Respondents from the Case 3 institution indicated that there were reductions
and or eliminations in programs and course offerings during this period. Respondents
from Case 2 and 4 institutions indicated that additional student services were added.
The responses to Survey Question 4 indicate that many actions were taken at the
Case 2, 3 and 4 institutions during the period under study, FY2014–FY2016. SQ 5
provided an opportunity to add actions that were not listed in SQ 4. The responses
indicated there were no other actions added by the respondents (Appendix N).
Several of the actions listed in SQ 4 may indicate increases in institutional costs,
such as hiring of additional full-time and part-time staff and faculty and the purchase of
tools to monitor and comply with their institutions’ performance. Additional student
services added at the Case 2 and case 4 institutions may indicate actions to improve
student success but may also lead to an increase in institutional costs. Organizational
restructures show support for new student support services focused on performance
improvement or may be done to reduce operational expenses. Reductions of full- and
part-time staff and faculty may indicate actions to control and reduce costs. Eliminations
and reductions in course offerings may also indicate actions to reduce institutional costs.
However, increases to, and additional student fees, are actions that decrease affordability
for some students. The eliminations and reductions in course offerings may also indicate
actions that restrict admission, enrollment, and recruitment activities.

140
Increases in some institutional costs, without proportionate decreases in costs
elsewhere in the institution, or adequate increases in state appropriations, may lead to
increases in student tuition and fees. Each case institution did receive state appropriations
increases each year of the study period (Appendix A). The quantitative administrative
and secondary data show that the Case 2 institution raised the tuition and fee rate the
most out of the four case institutions (Table 9). The same data for the Case 3 institution
shows that they were negatively impacted by the stop-loss adjustment by $2.6 million
over the three years of the study, although they received a 29.8% increase in state
appropriation allocations. The Case 3 institution raised tuition and fees by 6.27% during
the study period (Table 9). These data may indicate actions motivated by their results on
the MAPFF that negatively impacted access through decreased affordability.
The participants were then asked in SQ 6 and 7 if they believe their results on the
MAPFF influenced some of the strategic planning and decisions making at their
institutions (Appendix N). Two respondents from the Case 2 institution, four from the
Case 3 institution, and one from the Case 4 institution agreed that their results on the
MAPFF influenced some strategic planning and decision-making. One respondent from
the Case 1 institution, one from the Case 3 institution, and two from the Case 4 institution
disagreed. Two respondents from the Case 3 institution were not sure. Of the respondents
that disagreed in SQ 6, one respondent from the Case 2 institution added environmental
factors such as demographic shifts in their service area influenced their strategic
decisions. One respondent from the Case 3 institution added the crisis of the day and
student attainment data influenced their strategic decision-making. Respondents from the
Case 4 institution indicated student attainment data and their six-year plan influenced

141
their strategic decisions. Note that student attainment, or student enrollment and
retention, are measured by the MAPFF and reflected in the performance share percentage
calculation.
Although the responses to SQ 4–SQ7 are inconsistent and some respondents
indicate that some strategic decisions were influenced by their results on the MAPFF, they
do not indicate which specific strategic decisions were made and the motivations behind
these actions. The respondents were then asked which of the actions in SQ 4 they perceived
were influenced by their institution’s results on the MAPFF in SQ 8, 9, 12, and 13.
Understanding the actions taken by the institutions and which were influenced by
the MAPFF and the perception of the senior leadership of those actions on the impact on
the institution, and access, is important because it provides insight to the use of the
MAPFF in strategic planning and provide additional evidence to help determine the
intentional or unintentional response to their results on the MAPFF that may have
negatively impacted access.
Actions influenced by the MAPFF, SQ 8, 9, 1,2 and 13. In SQ 8, the
respondents indicated the following actions were influenced by the MAPFF in the survey
as shown in Table 12. The actions listed as choices for the respondents, were actions
found in other research studies conducted on the impact of Performance Funding
formulas on institutions of higher education in other states (Dougherty & Reddy, 2011,
2013; Lahr, et al., 2014). The respondents were also given an opportunity to identify
actions that were not listed in the survey in SQ 9 (Appendix N). No additional actions
were identified.

142
Table 12
Number of Responses and Actions Taken by the Case Institutions Influenced by Their
Results on the MAPFF SQ 8
Q8 – I believe that the following actions were
influenced by my institution’s results on the
MAPFF
High Case
1 High Case 2
Lower
Case 3
Low
Case 4
Increased fees 1 1 1
Additional student fees 1 1 1
Purchased tools to monitor performance 2
Changed degree requirements 1 1 1
Organization restructure 1 1
Elimination/education in programs, courses,
sections
1
Additional student services 1
Changes in college mission 1
Not sure 1 6
The senior administrators at the Case 2 (high-potential institution) and Case 3 and
4 (lower- and low-potential institutions respectively), indicated that the MAPFF
influenced student fee additions and increases. This finding indicates there may be a
correlation between the MAPFF and decreased affordability for the students. Only the
two respondents from the Case 2 institution indicated that the MAPFF influenced the
purchase of tools to monitor performance, although SQ 4 shows that Case institutions 2,
3, and 4 purchased these tools during the study period. This indicates the purchase of
tools to monitor performance by Case 3 and 4 institutions were not influenced by the
MAPFF intentionally or possibly were planned before the formula was implemented.
One respondent from each Case 2, 3, and 4 institutions indicated the MAPFF
influenced changes in their degree requirements, even though only Case 3 and 4
institutions indicated these changes were made during the study period in SQ 4. The
respondents from Case 2 and 3 institutions indicated the MAPFF influenced restructures

143
in their organizations; however, the respondents from the Case 2 institution did not
indicate that there were organization restructures during the study period in SQ 4.
Responses from the Case 2 institution indicated the MAPFF influenced eliminations and
reductions in programs, courses and sections, and the addition of student services, even
though they did not indicate the program, course, and sections eliminations in SQ 4. The
respondents from the Case 3 institution indicated there was an elimination and reduction
in programs, courses, and sections (Table 11); however, they did not indicate that the
MAPFF influenced those changes (Table 12). These noted inconsistencies between the
responses to SQ 4 and SQ 8 indicate there was not a conscious connection to the MAPFF
or it did not influence actions taken during the study period, the actions were influenced
by something else, or they were confused by these two questions. These responses were
followed up on during the interviews.
Six of the seven respondents of the Case 3 institution were not sure what actions
enacted at their institution were influenced by the MAPFF even though all seven
respondents from the Case 3 institution indicated that the senior leadership reviewed and
discussed the results of the MAPFF at least annually (Appendix N). No respondent
indicated “other” for SQ 8, and thus there were no actions added in SQ 9.
The responses to SQ 8 from the high potential, Case 2 institution, indicated
actions that correlate to both threats to access, decreased affordability, and restrictive
admission, enrollment and recruitment. The respondents indicated that the MAPFF
influenced increases and additional student fees, some of which might have been to pay
for the purchase of tools to monitor performance and the additional student services.
Respondents from the lower potential Case 3 and 4 institutions indicated that student fees

144
were increased, and additional student fees were added as a result of their results on the
MAPFF. The not sure responses from the Case 1 and 3 institutions may indicate a lack of
strategic review and planning directly related to the MAPFF or an inability to understand
the connection between the goals of the overall Vision Plan from the goals of the
MAPFF. The responses to SQ 8 were followed up on during the interviews to gain a
better understanding of their responses to the survey.
Responses to SQ 12 (Appendix N) show that one respondent from the Case 2
institution, three from the Case 3 institution and one from the Case 4 institution indicated
that the MAPFF “somewhat,” or “significant” on a five-point Likert scale, (significant,
substantial, somewhat, none yet but may in the future, and not sure), influenced tuition
and fee increases at their institutions. The president from the Case 3 institution indicated
the MAPFF significantly influenced their tuition and fee increases, and the vice president
of academic affairs indicated the MAPFF somewhat influenced their tuition and fee
increases. The vice president of finance at the Case 4 institution indicated that the
MAPFF influenced their tuition and fee increases. Four respondents from case 2, 3, and 4
institutions indicated that the MAPFF has not yet influenced tuition and fee increases.
One respondent from the Case 1 and case 3 institutions indicated that they were not sure.
Only one respondent from the Case 3 institution indicated the construction of a new
student center influenced their tuition and fee increases in SQ 13.
Although the responses to SQ 12 were mixed, three of the most senior positions at
the case institutions indicated their results on the MAPFF for Case 2, 3, and 4 institutions
influenced fee increases and additional student fees. In my experience in higher
education, the president, vice president of academic affairs, and vice president of finance
145
are intimately involved in the determination and recommendation of the tuition and fee
rates to the board of trustees at their institutions. This finding further supports the
responses in SQ 8 and correlates to the decreased affordability threat to access.
The responses from three of the four case institutions on these survey questions
indicate actions taken that directly decreased affordability for students through increased
and additional student fees. Some respondents also indicate actions that appear to impact
operational costs by purchasing tools to monitor performance and adding additional
student services and eliminating or reducing programs, courses, and sections.
Interestingly, three of the four case institutions indicated that degree requirements were
changed at their institutions because of the MAPFF. It’s important to note that while Case
2 senior administrators indicated they do not review the MAPFF data, they seem to have
reacted to the principles and goals of the MAPFF. Findings from other research studies
concluded that changes to degree requirements were done to increase student completion
which improves institutional results on the performance funding formulas and helps them
to increase their government appropriations.
Perceived impact of the MAPFF on institutions and access, SQ 3, 10, 11, 16,
17, and 23–27. The participants were asked in SQ 3 (Appendix N), to indicate the level
of incentives, based on a five-point Likert scale (significant, substantial, somewhat, none
yet but may in the future, and not sure), for student success at their institutions that were
provided by the MAPFF. Five respondents from the Case 3 institution and one
respondent from each of the Case 2 and Case 4 institutions indicated that the MAPFF
“somewhat” provided incentives to improve student success. One respondent from each
of the Case 1 and Case 2 institutions and two from the Case 3 institution indicated that
146
they were not sure. Two respondents from the Case 4 institution indicated that the
MAPFF has not yet provided incentives to improve student success but may in the future.
It is noteworthy that no respondents indicated the MAPFF provided a substantial or
significant level of incentives to improve student success and responses were mixed even
for the lower levels.
SQ 3 was included in the survey to help me understand how the participants felt
about the MAPFF. I did not attempt to research the impact the MAPFF had on student
success. The participants were then asked which actions they considered negatively
impacted their institution. The responses to SQ 10, 11, 16, and 17, indicating negative
impacts on the institutions are shown in Table 13.

147
Table 13
Number of Responses and Perceived Negative Impact of the MAPFF SQ10, 11, 16, and
17
Most of the senior administrators at the four case institutions indicated that the
actions listed in SQ 10 negatively impacted their institutions (Table 13). The tuition and
fee increase at the Case 2 institution was the largest of the four case institutions; however,
only one response indicated a negative impact on their institution on SQ 10. The tuition
and fee increase at the Case 1 institution was the second largest, but the respondent did
not indicate a negative impact on the institution SQ 10. Two of the seven total
respondents from Case 3 institution indicated that their results on the MAPFF
precipitated larger increases in student fees, despite their tuition and fee increase of
6.27% (Table 9), was less than the sector of 15 average and just slightly larger than the
Qualitative Case 1 Case 2 Case 3 Case 4
Surveys 1 Respondent 2 Respondents 7 Respondents 3 Respondents
SQ 10 - I believe that the MAPFF has
negatively impacted my institution in the
following ways: (Check all that apply).
Add'l Compliance Costs (1) No neg impact (1)
Larger T&F inc (1)
Elim/Reduce courses (1)
reductions in staff/faculty (1)
lower staff morale (1)
Addl costs of compliance (1)
No Neg Impact (1) Larger
fee inc (2) reduc std
svcs (2) lower
staff/fac morale (4)
Elim/Reduce courses (3) staff
reductions (2) reduct in
academic qual (1)
add'l cost of compliance (1)
Redductions in staff/fac
(1)
reduct in std svcs (1)
No Neg impact (2)
SQ 11 - Please provide other examples not
mentioned in Q10 above.
Blank Blank I have not seen this used at all as
an explanation for funding
decisions (1)
Blank
SQ 16 - Research conducted in other states
has shown that performance funding has
negatively impacted access through
increased student costs, restricted
admissions and selective student
recruitment. I believe that the
implementation of the MAPFF has
negatively impacted student access through
the following mechanisms: (Check all that
apply)
Not Sure (1) Access not negatively impacted
(1) Increase std
costs (1) Elim/Reduction of
courses (1)
Access not negatively impacted
(2)
Not sure (2) Inc
std costs (3) Elim/Reduce
courses (3)
Access has not been
negatively impacted (3)
SQ 17 - Please provide other examples not
mentioned in Q16 above if applicable.
Blank Blank Blank Blank
FY2014 - FY2016
Lower PotentialHigh Potential

148
Case 4 institution tuition and fee increase. This finding suggests that even though the fee
increases were less than the sector average, they would not have been as much without
the MAPFF. This suggests that only a portion of the tuition and fee increases instituted
during the study period were influenced by the MAPFF results. However, it shows some
correlation between the MAPFF and decreased affordability for students, a documented
threat to access.
Several respondents from the Case 2, 3, and 4 institutions indicated the MAPFF
negatively impacted them through reductions in staff and faculty, reduction in student
services, and elimination and reduction in programs, courses, and sections. Reductions in
staff and faculty, student services and programs, and courses and sections are cost-saving
measures that may limit tuition and fee increases but may also correlate to second threat
to access, restrictive admissions, enrollment, and recruitment practices by limiting the
number of choices students have for classes desired and/or support and guidance in
student services.
Respondents from Case 1, 2, and 3 institutions indicated that the MAPFF
negatively impacted them through additional costs of review and compliance activities.
This also may correlate to increases in tuition and fees. Three of the seven respondents
from the Case 3 institution indicated lower staff morale as a result of the MAPFF. It was
noteworthy that all three vice presidents for finance from Case 2, 3, and 4 institutions
indicated that the MAPFF has not negatively impacted their institutions. Their responses
are not consistent with those of the presidents and other senior leaders at these
institutions. The inconsistency of these responses were reviewed during the interviews to

149
gain a better understanding of why the other senior administrators of the institutions felt
differently than the vice presidents of finance.
Discrepancies were noted in the responses from the respondents at the Case 3 and
4 institutions to SQ 8 (Table 12) and SQ 10 (Table 13). The respondents from the Case 3
institution indicated that the MAPFF negatively impacted them when they eliminated and
reduced programs, courses, and sections in SQ 10 (Table 13), but did not indicate that
those actions were influenced by the MAPFF in SQ 8 (Table 12). The respondents from
the Case 4 institution indicated that the fee increases influenced by the MAPFF in SQ 8
(Table 12) did not negatively impact them in SQ 10 (Table 13). The respondents were
asked to provide other examples of actions that negatively impacted their institutions in
SQ 11, and one respondent from the Case 3 institution indicated that they have not seen
the MAPFF used as an explanation for funding decisions.
The senior administrators were asked if the MAPFF negatively impacted student
access in SQ 16 (Table 13). Four of the respondents from Case 2 and 3 institutions
indicated that the MAPFF negatively impacted access through increased student costs,
correlating to the decreased affordability threat. Four respondents from the Case 2 and 3
institutions indicated that the MAPFF negatively impacted access through the elimination
and reduction in programs, courses, and sections, correlating to restrictive admissions,
enrollment, and recruitment practices. All three respondents from the Case 4 institution
indicated the MAPFF had no negative impact on them. However, two of the three
respondents previously indicated the MAPFF negatively impacted their institutions
through reductions in staff and faculty and student services (Table 13). None of the
respondents from the Case 4 institution indicated that the MAPFF negatively impacted

150
student access by the increased student costs they indicated in their responses to SQ 8
(Table 12). All three vice presidents of finance from Case 2, 3, and 4 institutions
indicated that the MAPFF has not negatively impacted access. The responses from the
vice presidents of finance indicate a disconnection between increasing costs for students
and access to higher education. The responses from the vice presidents of finance were
followed up on in the interviews. No other actions were indicated that negatively
increased access in SQ 17.
The responses indicating actions taken at the case institutions during FY2014–
FY2016) influenced by the MAPFF (Table 12) and the responses negatively impacting
their institutions (Table 13) and the responses negatively impacting access were
inconsistent. While there were some perceptions of impact by the MAPFF, most of the
actions taken were not consciously connected to the MAPFF. Tuition and fees were
increased at all four case institutions over the study period. The vice presidents from all
three case institutions responded that their institutions increasing student fees did not
negatively impact student access. Some respondents from the Case 2 and 3 institutions
indicated that increasing student costs negatively impacted their institutions and student
access, and one of the respondents form the Case 4 institution felt that it negatively
impacted their institution and did not impact student access.

151
Table 14
Number of Responses and Perception of Positive Impact and no Impact of the MAPFF
SQ 23–SQ 27
The participants were asked in SQ 23 if they believe the MAPFF has positively
impacted their institutions. Nine responses indicated the positive impact of the MAPFF
was increased awareness of institutional performance. One of the respondents from each
of the Case 1, 3, and 4 institutions stated that there were no positive impacts because of
the MAPFF. One respondent from the Case 3 institution indicated they felt the MAPFF
improved student services and instruction and improved student success and completion.
Qualitative Case 1 Case 2 Case 3 Case 4
Surveys 1 Respondent 2 Respondents 7 Respondents 3 Respondents
SQ 23 - I believe that the MAPFF has
positively impacted my institution in the
following ways: (Check all that apply).
None (1) Increased awareness (2) None (1)
Improved std success and
completion (1) Increased
awareness of institutional
performance (5)
Provided the needed incentive to
improve student services and
instruction (1)
None (1)
Inc awareness of
institutional
performance (2)
SQ 24 - What are other examples of positive
impacts not mentioned in Q23?
Blank Blank Blank Blank
SQ 25 - I believe that my institution's
outcomes on the MAPFF has had NO impact
on my institution either positively or
negatively from 2014 - 2016.
Not Sure (1) Disagree (2) Agree (2) Not sure
(3) Disagree (3)
Agree (1)
Disagree (1)
Not sure (1)
SQ 26 - If you agree that the MAPFF has had
NO impact on your institution from question
15 above, what do you believe were the
reasons: (Check all that apply)
None (1) None (2) Stop Loss (2) None
(3) Inc tuition
rev thru enrollment (1)
Ignore results because MAPFF
will be discontinued (1)
Gon't understand MAPFF results
(1)
Ignore results b/c
MAPFF will be
discontinued (1)
Focused more on rev
growth thru enrollment
(2) None (1)
SQ 27 - Please provide other examples not
mentioned in Q26 above.
Blank Blank The formula has only been used
to distrubute small annual
increases rather than the whole
pot of money so the affect is
minimal (1)
Blank
FY2014 - FY2016
Lower PotentialHigh Potential

152
The participants were asked in SQ 24 to add other examples not mentioned in SQ 23.
There were no additional examples noted.
The participants were asked in SQ 25 if they felt the institutional outcomes from
the MAPFF had no impact, either positive or negative, on their institutions. Two
respondents from the Case 3 institution indicated there were no positive or negative
impacts of the MAPFF on their institution, three were not sure, and three disagreed (or
felt that there were positive impacts to their institution). However, a majority of the
responses to SQ 23 indicated positive impacts on their institution. One respondent from
the Case 4 institution felt there were positive impacts of the MAPFF on their institution
(disagreed), one felt there were no positive or negative impacts, and one wasn’t sure.
However, two of the three responses indicated the positive impact of increased awareness
of institutional performance. One respondent from the Case 1 institution wasn’t sure.
There was no consensus on the perceived impact of the MAPFF on institutional
outcomes, either positive or negative.
The participants were then asked in SQ 26 and 27 to indicate the reasons they felt
the MAPFF had no impact on their institution’s outcomes. Two respondents from the
Case 3 institution indicated the stop-loss adjustment was the reason they felt there was no
impact on their institution. One respondent each from both the Case 3 and 4 institutions
indicated they ignore the results of the MAPFF because they believe the formula will be
discontinued. One respondent from both the Case 3 and 4 institutions was more focused
on increasing tuition revenue through enrollment rather than through the MAPFF. None
of the responses to SQ 26 addressed the performance metrics of the MAPFF as the reason
for not having an impact on their institutions. The stop-loss response for SQ 26 from two

153
respondents at the Case 3 institution prompted more probing questions during the
interviews to get a better understanding of the stop-loss impact.
The participants were asked in SQ 27 to provide other examples not mentioned in
SQ 26. One respondent from the Case 3 institution indicated that the formula has only
been used to distribute small annual increases rather than the whole pot of money, so the
effect is minimal. The MAPFF allocated all the state appropriations with an additional
$20 million in FY2014, $13.1 million in FY2015, and $9.1 million in FY2016 to the 15
institutions.
Perceptions of the MAPFF and additional comments, SQ 28–29. The
participants were asked in SQ 28 (Table 15), what surprised them most about the
MAPFF.
Table 15
Number of Responses and What Surprised the Respondents Most About the MAPFF
SQ28 and 29
Out of a total of three responses to SQ 28, one respondent from the Case 2
institution added that the MAPFF became irrelevant because of their perception of a lack
Qualitative Case 1 Case 2 Case 3 Case 4
Surveys 1 Respondent 2 Respondents 7 Respondents 3 Respondents
SQ 28 - What has surprised you most about
the MAPFF and your institutions results?
Blank MAPFF became irrelevant suw
to lack of funding (1)
How the institution compares
with the other CCs (1)
Not always favorable and we
can't figure out why (1)
Blank
SQ 29 - Please add any additional comments
on the MA Performance Funding Program
you feel will be pertinent to this study.
Blank Blank Other measures such as the VFA
seem to place the CCs in a better
light than do the measures of the
DHE (1)
Blank
FY2014 - FY2016
Lower PotentialHigh Potential
154
of funding, although they received an increase of $3.7 million in state appropriations in
FY2016, versus FY2014. While the Case 2 institution’s performance share percentage of
8% was greater than the sector average of 6.7%, they saw little impact in state
appropriations received. The cumulative stop-loss impact was a $.524 million increase in
state appropriations over the three years of the MAPFF (FY2014, FY2015, and FY2016).
The MAPFF Dashboard shows the calculation of state appropriations before and after the
stop-loss adjustment. The MAPFF is used to allocate all the state appropriations, and if it
wasn’t for the stop-loss adjustment, the Case 2 institution would have only received
$.524 million less appropriations, for a net gain of $3.2 million.
One respondent from the Case 3 institution noted that how their institution
compares with the other community colleges surprised them. Another response to SQ 28
was that the performance of the Case 3 institution was not always favorable, and they
can’t figure out why. These responses reflect at least a cursory review of the MAPFF
results on the dashboard. There is little data reflecting accurate perceptions or knowledge
of the detail displayed in the performance tabs within the MAPFF spreadsheet.
The participants were asked in SQ 29 (Table 15), to add any additional comments
regarding the MAPFF they felt is appropriate for the study. The only response was
recorded from the Case 3 institution, which stated that other measures, such as the VFA
(Voluntary Framework of Accountability), seem to place the community colleges in
better light than the measures of the DHE formula.
While only a few responses to SQ 28 and SQ 29 were recorded, they indicate a
misconception and misunderstanding of the MAPFF. The response from the Case 2
institution indicated that not enough funding was being allocated by the MAPFF when in

155
fact, all the state appropriations are allocated through the formula. The two other
responses from the Case 3 institution indicated surprise in how their institution compared
to the other institutions in the sector. The MAPFF spreadsheet details each component
that compiles into the final appropriation both before and after the application of the stop-
loss adjustment. A review of the details would provide the data needed to understand how
they fared when compared to the other institutions.
The responses to SQ 3, and SQ 23–SQ 27 were very inconsistent with some
responses, indicating a degree of ambivalence towards the effectiveness of the MAPFF.
The respondents from the Case 2, 3, and 4 institutions indicated the most significant
impact of the MAPFF was increased awareness of their institutional performance. Both
respondents of the Case 2 institution indicated that their senior leadership did not review
the results of the MAPFF at least annually (SQ 1, Appendix N).
Perceived impact of the MAPFF stop-loss adjustment, SQ 18–21. The
participants were asked in SQ 18 if their institution’s result on the MAPFF before the
stop loss was a significant concern. Two of the respondents from the Case 2 and 3
institutions and one respondent from the Case 4 institution indicated that their results
before the stop-loss adjustment were a concern. This indicates a lack of understanding of
the stop-loss adjustment because Case 2, 3, and 4 institutions would all have received
more state appropriations without it; nevertheless, their immediate fix was to raise fees.
Four respondents from the Case 3 institution and one from the Case 1 institution were not
sure. A respondent from the Case 4 institution stated during the interview that they were
not concerned with the results because they tend to lead the other institutions in all the
MAPFF categories. It was noted that this response reflects a more conscious connection

156
to the detailed results of the MAPFF. The responses to SQ 18 were inconsistent across
the case institutions. To get a better understanding regarding what the causes of the
concerns were, the participants were then asked in SQ 20 what actions would be taken
once MDHE eliminated the stop-loss adjustment.
Table 16
Number of Responses and Perception of the Stop-Loss Adjustment of the MAPFF SQ 18,
20–22
Participants at three of the case institutions indicated that they would be forced to
take actions to improve their results on the MAPFF if the stop-loss adjustment was
discontinued. However, the data in Table 16 also suggests the senior administrators plan
to take actions that will have an unintended impact to the outcomes that are desired by the
Qualitative Case 1 Case 2 Case 3 Case 4
Surveys 1 Respondent 2 Respondents 7 Respondents 3 Respondents
SQ 18 - I believe that my institution's results
on the MAPFF, before the stop loss
adjustment, has been of significant concern
with our senior leadership.
Not Sure (1) Agree (2) Disagee (1) Not
sure (4) Agree (1)
Strongly agree (1)
Disagree (1)
Strongly disagree (1)
Agree (1)
SQ 20 - DHE proposed that the Stop Loss
component of the funding formula will be
phased out after the fourth year of using the
formula. Once the MAPFF stop loss
adjustment is discontinued, I believe that my
institution will most likely take the
following actions to replace any lost
appropriations: (Check all that apply).
Take Steps to improve
scores on MAPFF (1)
Raise tuition & fee rates (2)
Decrease staff/faculty (1)
Secure alternative revenues (1)
Elim/ Reduce academic
program courses (2)
Take steps to improve our
scores on the MAPFF (1)
Raise tuition & fee rates (2)
Secure alternative revenues (4)
Reduce services currently
available to students (2)
Take steps to improve our
scores on the MAPFF (2)
Decrease staff/faculty (3)
Reduce/Elim courses (2)
Raise tuition & fee rates
(2)
Secure alternative
revenues (2)
SQ 21 - Please provide additional
information for Q20 above.
Blank Blank I cannot Answer (1) We would have an
increase in funding (1)
SQ 22 - With the decline in additional State
appropriations since the implementation of
the MAPFF for the community college
sector, I believe that the current funding
formula will be modified significantly or
discontinued in the near future.
Agree (1) Agree (2) Agree (3)
Disagree (1)
Not Sure (3)
Agree (1)
Strongly Agree (1)
Disagree (1)
FY2014 - FY2016
Lower PotentialHigh Potential

157
Department of Higher Education. Ten of the 13 respondents stated they would reduce
student services, program offerings, and staff and faculty. Seven of the respondents
indicated they would seek alternative revenues, and six responded they would increase
their tuition and fees to make up for any state funding lost.
Responses received from the Case 2, 3, and 4 institutions on SQ 20 indicate that
they would raise tuition and fee rates, secure alternative revenues, eliminate programs,
courses and sections, and reduce student services. Respondents from the Case 1, 2, and 3
institutions indicated they would take steps to improve their scores on the MAPFF. This
confirms my theory the results on the MAPFF would motivate actions to improve their
outcomes on the MAPFF. The participants were asked in SQ 21 to provide additional
information on actions when the stop-loss adjustment is phased out.
One respondent from the Case 3 institution indicated they could not answer this
question. One respondent from the Case 4 institution indicated that they would have an
increase in funding. These set of questions were asked to provide some insight on the
significance of the stop-loss adjustment to strategic planning and decision-making at the
case institutions. Note that phasing out the stop-loss adjustment provides increases to
Case 3 and 4 and a smaller increase to Case 2. The responses make it appear that only
one respondent knew that.
This question was included in the survey to help gain a better understanding of the
importance and significance of the stop-loss adjustment by the senior administrators.
Their responses to SQ 18 and 20, as well as SQ 10, 11, 16, and 17 indicate confusion on
regarding the impact of the stop-loss adjustment. These questions were followed up on
during the one-on-one interviews.

158
With the decline in additional state appropriations since the implementation of the
MAPFF, the participants were in asked in SQ 22 if they believed the current formula
would be modified significantly or discontinued soon. Eight of the respondents agreed
the formula would be changed or discontinued, two disagreed, and three were not sure.
Perhaps the responses from the Case 1 and 2 institutions indicated more of a wait-and-see
attitude on the longevity of the MAPFF before taking it more seriously. The responses
from the Case 3 and 4 institutions are inconsistent. The responses to this question and SQ
3 (Appendix N) indicated ambivalence towards the MAPFF and a lack of confidence that
it provides incentives to achieve the state’s goals and improve student success.
Summary of the Quantitative and Qualitative Survey Data
The analysis of the results of the survey questionnaire yielded the following
significant findings:
1. The survey responses are mixed on the level of review and dissemination of
the MAPFF results to others at the institutions. Most senior administrators
from the high potential, Case 1 and 2 institutions, disagreed on the review and
discussions surrounding their institutions MAPFF results in SQ1 and SQ 2.
Alternatively, most of the responses by the lower potential, Case 3 and 4
institutions, agreed that the MAPFF results were reviewed and discussed by
the senior administrators in SQ1 and were disseminated to others at their
institutions in SQ 2.
2. The survey responses indicated that the MAPFF influenced increases in and
additional student fees, increased operational costs for the purchase of tools to

159
monitor performance, additional student services, organization restructures,
and elimination/reduction in programs, courses, and sections (Table 12).
3. Some respondents of the survey indicated negative impacts to their institutions
through decreased affordability (AFFORD) and potential restrictive
admissions, enrollment, and recruitment practices (R.A.E.R.) (Table 13).
4. A consistent response on the survey from the vice presidents of finance at
Case 2, 3, and 4 institutions indicated that the MAPFF has not had a negative
impact on their institutions or on student access (Table 13).
5. The survey respondents appeared to have trivialized or overlooked the results
of the MAPFF before the stop-loss adjustment and the impact it has on their
institutions short of the final appropriation allocation (Table 16).
6. The perception from most of the survey participants is the MAPFF would be
altered significantly or discontinued in the future (Table 16).
Qualitative interview data. Invitations to participate in follow-up, one-on-one
interviews at the case institutions with the senior leadership in Table 17 were sent via
electronic mail. Included with the email was a summary table of finance and performance
data for their institution to refresh their memory on their institutions’ results of the
MAPFF. A total of seven one-on-one interviews were conducted across the four case
institutions, with each interview conducted over the telephone due to distance. Responses
were recorded using an electronic device, and transcribed and coded using exploratory
methods (Saldana, 2009). It became evident from the survey responses that the positions
below dean were not privy to how this data was used in the MAPFF and therefore, they

160
were not selected to be interviewed. The dean of enrollment management from the Case 3
institution did not respond to my requests for an interview.
Table 17
Interview Participants
Institution Name Title
Approximate
# of Years in
Position
C1 -
C2
Paul
Vice President of Finance
10+
Sally Dean of Enrollment Management & College
Access
1–5
C3
Robert President 1–3
Jake Vice President of Finance 5–10
Kim Interim Vice President of Academics 10+
C4 Rachael President 1–5
Eric Vice President of Finance 1–5
The interview participant names are representative of their gender and the length
of time in the position, but the names are aliases. One of the presidents and the interim
vice president of academics had only been in their respective positions at the Case 3
institution for one year at the time of their participation in the qualitative portion of the
study. The remaining respondents have been at their position at the case institutions long
enough to experience the application and use of the MAPFF and its impact on their
respective institutions and students.
The interview questions focused on the first three fiscal years of the performance
funding formula’s use in Massachusetts, FY2014–FY2016. The questions started broadly
and were customized based on the survey responses of the respondents and from the
findings of the quantitative administrative and secondary data. They were designed to
161
determine the familiarity with the performance funding formula, how it was used in their
strategic planning, and address and confirm or eliminate alternative plausible
explanations for those actions taken by the institutions that could be unrelated to the
implementation of the performance funding formula (see Appendix O). The interviews
revealed additional insight into the responses on the survey. Several inconsistencies were
noted on the responses in the interviews versus how the respondents answered the survey
questions.
Interview responses by case institution. The Case 1 and 2 institutions are
classified in the study as high potential for negatively impacting student access. The Case
3 and 4 institutions are classified as lower potential for negatively impacting student
access.
A summarization of key data from the MAPFF results spreadsheets, compiled and
distributed by the Department of Higher Education, and the HEIRS database, was
prepared for each of the case institutions. The individual case institution summary data
was included in the invitation to participate in the one-on-one interviews to refresh their
recollection of their institutions’ data.
Case 1 interviews. The IRB at the Case 1 institution approved my study.
However, numerous requests for interviews spanning two months went unanswered.
Finally, the vice president of academic affairs responded to me that they do not wish to
participate in the qualitative portion of the study. As a reminder. only one person
responded to the survey. The Case 1 institution was grouped as having the highest
potential to impact access. The MAPFF results showed a reduction in state appropriations
of 24.94% before the stop loss adjustment, indicating the lowest change in performance

162
share percentage. The stop loss adjustment significantly helped the case 1 institution with
receiving 16.48% more appropriations after the adjustment. The data also show the case 1
institution increased tuition and fee rates by 11.41% between FY2013 and FY2016.
Unfortunately, the case 1 institution’s reluctance to fully participate in the study
weakened the findings. The quantitative data showed that the case 1 institution was
significantly impacted by the MAPFF evidenced by the amount of state appropriations
calculated both before and after the stop-loss adjustment. I expected to obtain and
understand the perceptions of the senior leaders of the case 1 institution on the impact of
the MAPFF on their institution and students and the motivations behind the tuition and
fee rate increases. Since my study focused on the quantitative and qualitative data of only
four case institutions, the reluctance of the case 1 institution to participate reduced the
amount of data by 25% and weakened the benefit for the commonwealth on learning the
impact of the MAPFF on community college students. However, the data from the three
remaining case institutions was sufficiently robust to determine the impact to access.
Case 2 interviews summary. Several important findings are identified from the
responses of the interviews from the Case 2 institution. The first finding was the reasons
behind their fee increases were mixed.
“Paul,” the vice president of finance, responded to my question regarding why the
institution increased student fees 16.52% over the first three years of the MAPFF by
stating that the board of trustees and the college leadership wanted to hire the additional
people necessary to meet the demands that were being placed on them to achieve better
student success. The increase in student fees provided the needed revenue to hire the
additional people. The two respondents from the Case 2 institution indicated on SQ 10
163
(Table 13) that the MAPFF negatively impacted access by influencing larger tuition and
fee increases. However, they also indicated that they reduced staff and faculty and
eliminated and reduced courses, programs, and sections. While these survey and
interview responses from the Case 2 institution somewhat contradict themselves, these
actions indicate an attempt to make changes that align with the goals of the MDHE and
the implementation of the MAPFF. However, it also supports my proposition that the
institutions would initiate actions that would increase costs for students and negatively
impact access. After reviewing where their fees are in comparison to the other
community colleges in Massachusetts, they made a conscious decision not to be the
institution with the lowest fees, as they had been in the past.
“Sally,” the dean of enrollment and college access, stated that the primary driver
of the fees increases was their facilities [portion] of their tuition and fees that all students
pay and not because of their results on the MAPFF. As stated previously, the fee portion
of the tuition and fees vary among the institutions. A portion of the fee for the Case 2
institution includes an increase for facilities. She stated that they increased their facility
fee to help support a new building that they’ve brought online, and made smaller fee
increases in the student activities and technology fees.
The second finding is the respondents are concerned about retention and
graduation rates more for enrollment revenue purposes than in terms of the funding
formula.
I pointed out to “Paul” on the summary chart that his institution’s performance
share percentage decreased from 9% in 2014 to 7.6% in 2016. I asked him what he
attributes that decrease in performance share percentage to.

164
“Paul” admitted:
There are certain areas where we need to make some big improvements,
especially in retention and graduation rates. We’re very concerned about retention
and graduation rates more for enrollment purposes than we are in terms of the
funding formula. We know retaining students and getting them to graduation is
going to have a bigger impact on our enrollment and have a much bigger financial
impact on us than the funding formula would have.
“Sally” stated that the results of the MAPFF were not part of the strategic
planning of the college and didn’t know why they were not. She also stated that the
institution was initially focused more on student recruitment and enrollment during the
early implementation of the MAPFF but has now “flipped,” parallel to national efforts, to
focus on retention efforts. When asked about her institutions’ enrollment decline, she
responded that their retention was the primary problem, as well as their ability to attract
new students during those years. She reiterated that she didn’t attribute any of the
enrollment decline to the MAPFF. The perception was that retaining students and getting
them to graduation is going to have a bigger impact on their enrollment and have a much
bigger financial impact than the funding formula would have.
The third finding is the perception that the goals of the MAPFF were separate and
apart from the goals of the Vision Project, even though the implementation of the
MAPFF was an extension of the Vision Project and reflects the same goals. “Paul” stated
that “every three years, we would adopt a set of strategic priorities based on the Vision
Project,” (same goals as the MAPFF) when asked if his institution’s leadership made
strategic decisions to improve results on the MAPFF. He said that they paid close

165
attention to the formula when it first came out when setting institutional priorities
because a significant amount of money was attached to it.
The fourth finding is vice president of finance is relied upon to communicate the
MAPFF results to the other senior administrators and displayed an overall lack of a depth
of knowledge of the MAPFF. When asked about the impact of the stop loss-adjustment
on her institution, she admitted that she was unfamiliar with it and asked me to explain it.
I then asked “Sally” how familiar she was with the MAPFF components for her
institution and she replied, “not very familiar at all.” She stated that the vice president of
finance told the senior staff that “such a small amount of funding is tied to the MAPFF to
not establish goals based on the results.” This data point correlates to the responses on the
survey regarding the level of review and familiarity of the MAPFF.
In “Sally’s” opinion, there is a “lack of depth of knowledge” of the MAPFF and
the college community as a whole is not familiar with the MAPFF. “Sally” also indicated
lower staff morale due to “working more with less,” but said that is not a direct result of
the formula. However, her institution received $3.7 million, or 23% more state
appropriations in FY2016 than in FY2013.
The fifth finding is the perception by the vice president of finance that the
MAPFF does not allocate enough funding to warrant more attention paid to the detailed
results of the formula. In response to his institution’s appropriation before the stop-loss
adjustment in fiscal years 2014, 2015, and 2016, “Paul” said that the performance of his
institution “didn’t make that much of a dollar difference” and they benefited from the
stop-loss adjustment like other institutions that made the funding more “palatable, fairer,
and more livable.”

166
He went on to say:
As the years went by and the amount of money attached to the formula got
smaller and smaller, we started paying less attention to the formula itself, but we
focused on the strategic vision that was laid out by the commonwealth for the
community colleges.
“Paul’s” response noted, however, that even though the amount of the increase
got smaller each year, the amount of state appropriation grew each year between FY2014
and FY2016. The MAPFF is used to allocate all the state appropriations. The MAPFF
allocates 100% of the total state appropriations to the community colleges each year ,and
the spreadsheet dashboard displays this. The total state appropriations increased $20
million, 9.6% in FY2014, $13.1 million, 5.8% in FY2015, and $9.1 million, 3.5% in
FY2016. While the state appropriation changes over this period began with a $20 million
increase, the next two years saw increasingly smaller increases. The total stop-loss impact
for Case 2 institution between FY2014 and FY2016 was $523,700, or 2.4% over this
period. This supports “Paul’s” perception that the amount of money tied to the formula is
insignificant. It also supports the responses from the senior administrators of the cursory
review of the MAPFF, focusing on the net amount of new appropriations received after
the stop loss, or just the final funding amount. However, the Case 2 state appropriation in
FY2016 was $3.7 million, or 23% more than in FY2013, the year before MAPFF.
Finally, the respondents indicated was that no actions were taken at their
institutions to restrict enrollments because of the MAPFF. “Paul” did not feel that their
declining enrollment during the three years of the study was attributable to actions taken
at his institution because of their results on the MAPFF. He stated, “the economy got

167
better, and people can go out and get jobs.” Additionally, he stated that the four-year
institutions in Massachusetts were competing against them by offering developmental
courses and had “lowered their standards for admissions, and that is driving students
away.” The third reason he stated for the declining enrollment was that they [other senior
administrators at his institution] “know we have a problem with retention and have to
work on that because if we can get our retention rates better, the enrollment figures would
be better.” “Paul” stated that his institution is “totally revamping our advising system and
we’re doing some things that actually are showing some results in terms of retention.” He
stated that “some additional staff were hired, and some full-time faculty were given
release time to work as liaisons.” This response is contrary to his response to the Survey
Question 10, where the respondents indicated that staff and faculty were reduced at his
institution.
When asked if his institution changed admission, enrollment, and recruitment
policies because of the MAPFF, “Paul” stated that nothing like that was done. He went
on to say that “we can’t afford to do anything that would restrict admissions.” “Paul’s”
final statement was: “the formula is really not the driving force in our student success
initiatives, but they [student success initiatives] will help us with the formula.”
Case 3 interviews summary. Several important findings are identified from the
interview responses from the Case 3 institution. The first finding identified is the
variation of responses on the reasons behind the tuition and fee increases.
“Robert,” the president, started out by saying that he is still in his first year as
president at the Case 3 institution. “Robert” stated that from what he has seen, the
MAPFF had significantly influenced the increases in his institution’s fee increases. He

168
suggested that the MAPFF doesn’t seem to consider the high cost of some programs,
which may limit the funding from the commonwealth and force institutions to “increase
their fees more than they would have.” He was unaware that the MAPFF weights STEM
enrollments higher than other programs. STEM programs are typically higher cost
programs to run. By weighting the higher cost programs more, the MAPFF does consider
the higher cost of programs.
“Jake,” the vice president of finance, responded to questioning about his
institutions’’ fee increases by stating that it was “to fill the budget gap.” He also added
that his institution has been relying on both fee increases and the use of their reserves to
fill the budget gap for the past couple of years. “Jake” attributed the budget gap to their
declining enrollment and said that “the state hasn’t really given us any increase in our
appropriation.” Upon a review showing that the commonwealth did increase
appropriations to the institutions each year during the first three years of the formula, he
stated that, “I still don’t really feel they’ve stepped up because they were flat-funded
before that, and these increases just put us where we should have been had we been given
the regular increases all along.” He also stated that he was recommending cost-saving
measures that included reductions and retrenchments to reduce operational expenses and
help balance their budget. “Jake” added that their former president retired after more than
30 years at the college and “didn’t care about the budget deficit. He just kept giving
employee raises and raising student fees and using reserves” to pay for them.
“Ken,” the interim vice president of academics, attributed the increase in fees over
the three years under study to the declining enrollment they had. “If we don’t meet our
goals of enrollment, then the only way we can move forward without cutting back too

169
much and losing too many positions is to increase the fees.” He added that, “the trustees
never had a good appetite for increasing the fees, [and] they finally said no more.” He
also mentioned that they borrowed funds from their foundation, not their reserves, during
this time.
The second finding is the lack of familiarity with the components of the MAPFF
and how the components address the goals of the Vision Project. “Robert” also stated that
the MAPFF incentivizes colleges to increase student outcomes “by default,” [sic] but he
felt that “we need to be as nimble and we need to be able to create programs that meet
our business and industry needs. Those needs may fall outside of what has been defined
by the bureaucracy of the funding formula.” He went on to add, however, that
“sometimes we feel the pressure to have to say ‘no’ to things that are not going to help us
in the funding formula.” This finding implies the MAPFF doesn’t reflect the needs of the
local business community for each institution. While an observation of concern, my study
was not designed to explore the composition of the formula.
“Robert” was not aware that his institution had lost funding because of the stop-
loss adjustment, and after he reviewed the chart above, he stated that he was “concerned
about that.” Because of his unfamiliarity with the stop-loss adjustment, I asked him if he
and his senior staff review and discuss his institution’s outcomes of the MAPFF. He said
that they have reviewed the formula results and that his CFO has “discussed them with
the other CFOs in the commonwealth.” Not being familiar with the impact of the stop-
loss adjustment on his institution during the FY2014–FY2016, preceding his tenure at the
Case 3 institution indicates his reliance on his vice president of finance’s interpretation

170
and communication of the formula’s results, and supports the misperceptions of
performance share versus the bottom line state allocation after the stop-loss adjustment.
“Jake” felt that because of the reports the colleges are required to file annually
with the Department of Higher Education indicating their results against the goals of the
Vision Project, the results are scrutinized more by the commonwealth than the MAPFF
results. He stated: “I tend to wonder how much the formula is the driver [for improving
outcomes] versus just knowing that the report is going to come out ranking each
institutions’ performance on the Vision Project goals. We’re going to be held accountable
based on another [Vision Project] report that they are really focusing on.” This implies
that the MAPFF is separate and distinct from the Vision Project, even though the MAPFF
was a stated goal and part of the overall Vision Project, and the formula elements reflect
the goals of the Vision Project. “Jake” did not know why his institution’s performance
share percentage increased over the three years being studied, but offered: “others
[institutions] were doing badly, and we worked on graduation rates, retention, and
increasing the underserved people as part of the Vision Project.” This response indicates
that “Jake” knew these elements count towards performance but did not indicate that he
knew they are also part of the goals of the MAPFF. “Ken” was unfamiliar with the stop-
loss adjustment of the MAPFF and could not answer my questions related to the funding
loss after the adjustment.
The third finding is the reliance on the Title III grant to make improvements on
student success initiatives before the implementation of the MAPFF and the expiration of
the grant in 2015, interrupting their progress. When asked about actions taken at his
institution to improve outcomes as measured by the MAPFF, “Robert” responded: “we

171
began overhauling our academic and career advising services for our students but lost the
grant funding [Title III] awarded a few years ago [prior to MAPFF] that was helping us to
do that.” He went on to add that his institution had received a big gift that would allow
them to again pursue this effort. This indicates a commitment by the Case 3 institution to
adding staff to achieve the goals of the MAPFF. Previously, the grant and later the gift
they received would help them continue their efforts with less of an impact on their
tuition and fee rates. Note that they were already focused on this goal prior to the
implementation of the MAPFF.
“Jake” could not recall what his institution did to improve student outcomes
except that they used a Title III grant for revamping the advising process. After we
reviewed and discussed his institution’s performance before the stop-loss adjustment,
“Ken” said that they had a Title III grant that had helped. However, when the grant ended
in 2015, he stated that, “all of the good work we did, we couldn’t keep up with because
we weren’t able to afford all of the advisors and so forth.” “Ken” confirmed that they had
to reduce the staff and reconfigure their advising program after the end of the grant.
However, “Ken” made no mention of receipt of an additional monetary gift described by
“Robert” to help them continue to work on improving their academic and career services.
“Ken” made a final point that the formula results had a demoralizing effect on the
institution. “We all think we’re doing a great job and yet we see the results and ask how
other institutions can be doing better than we are.” This comparison sentiment reflects
that “Ken” and others trivialized or overlooked the formula results before the stop-loss
adjustment, and only looked at final allocations. Even so, the Case 3 institution received
$3.277 million, or 29.8% more, in state appropriations in FY2016 than in FY2013.

172
However, because of the stop-loss impact, it would have received $2.6 million more in
state appropriations before the application of the stop-loss adjustment over the same
three-year period.
The fourth finding is the participants felt their enrollment loss was not caused by
the MAPFF. “Robert” stated that he did not feel that their results on the MAPFF
contributed to any of his institution’s enrollment decline during this period. He echoed
others interviewed that the reasons were because of an improving economy, a decline in
the number of high school graduates, and a low unemployment rate.
“Jake” stated he did not feel that their results on the MAPFF contributed to any of
the 11% enrollment decline during the period under study. He also echoed his presidents’
response that it was attributable to fewer high school graduates and added that there was
a disruption surrounding the construction of a new building on campus that may have
negatively impacted their enrollments during this time. “Jake” also stated that it was
important to focus on efforts to increase enrollments by “beefing up our admissions
efforts, because you have to put the money in there to get the enrollments.”
“Ken” attributed his institution’s enrollment decline to changing demographics
and a reduction of the number of high school graduates. “We also have downsized
programs and hired an outside consultant to help them review and make
recommendations on programs that would attract more students,” he said. He added that
by having fewer course offerings, “that does eliminate some student access because they
might not offer the course on the day the students want it.”
The last finding is the perception of a lack of funding from the state. “Jake’s”
institution received appropriation increases each year but would have received more

173
appropriations before the application of the stop-loss adjustment but lost a total of $2.6
million after the adjustment over the three years of the MAPFF. “Jake” indicated that he
understood that and responded by saying, “yeah that definitely hurt us.” However, their
state appropriation in FY2016 was $3.277 million, or 29.8% more, than in FY2013, the
year before the MAPFF. “Jake’s” perception reflects a mindset of too little or no new
funding that was not supported by the data.
Consistent with his survey responses, at first “Jake” didn’t feel that the MAPFF
had any negative impacts on access, but then added that, “they had to make about
$600,000 cuts to institutional financial aid” during the time period under study. However,
he still didn’t think it was a result of their results on the MAPFF. “There were all the
other things going on, like the state not having the money to give us regular increases,
collective bargaining pressures, and enrollment decreases,” he said. Then “Jake” added
that, “yeah I guess there has been some negative impact to access since the
implementation of the MAPFF.” Reduction of institutional aid can directly impact the
number of students enrolled because it directly impacts the cost of attendance
(AFFORD).
Jake’s final comment was:
The formula sounds good on the surface, but once you really dig into it, I don’t
think it really works that well. It’s like kicking someone when they’re down
because cutting funding due to poor performance on the MAPFF makes it more
difficult to make improvements.

174
Although the Case 3 institution received $3.277 million more in state appropriations in
FY2016 than in FY2013, the year before the MAPFF, “Jake’s” perception consistently
went to “no funding” and ignored the positive effects his institution saw.
Case 4 interviews summary. Several important findings were identified from the
responses of the interviews from the Case 4 institution. The first finding is the results of
the MAPFF influenced an additional increase in their student fees.
“Rachel,” the president, stated that “we have the lowest fees of all 15 community
colleges in the state” and the increase in fees was due to a large deficit the college had
and was funding with unrestricted reserves. “When I came in, there was a $4 million
budget deficit, and we had to increase fees to dig ourselves out of this hole,” she said. She
mentioned that 10 years earlier, the state was paying 70% of the costs and the students
paid 30%. This changed to the students paying 70% and the state paying 30%. She added
that they experienced a loss of general funds when money was added to state funding
because, “it is targeted to things in workforce development or STEM.” She added that,
“our crisis when we have enrollment slides is really the general funds.” “Rachel” also
noted that the government “likes to lean on the idea of accountability as part of their
solutions and keep us efficient; after years of doing that, we are all pretty much efficient.”
“Eric,” the vice president of finance echoed Rachel’s response on the reasons for
the increase in fees. “They don’t need to be the least expensive nor the most expensive,
but somewhere in the bottom third,” he said. “Eric” also added that, “they did feel that it
wasn’t fair to current students to try to solve our $4 million budget deficit all at once, the
combination of fee increases and use of our reserves took three to four years to solve.” I
asked Eric what he thought about receiving $7 million less in appropriations after the

175
stop-loss adjustment than they would have received before the stop loss over the first
three years of the MAPFF and if that influenced any part of the fee increases. At first, he
said “no” because “they figured we anticipated we weren’t going to get it.” However,
“Eric” then came to the realization that the loss due to the stop-loss adjustment was used
in determining the amount of their fee increase. He stated that, “I guess you might say
that, yeah, not getting it was factored into setting our fees.” He added that “if the formula
ran without the stop loss or if we were funded based on our size, we would have charged
a lot less on our fees. We would not have increased by $10 per credit hour.” “Eric” also
added that had it not been for the stop-loss adjustment, “we would have probably spent
more money on some of the areas that needed it.” He continued with: “The total state
appropriation wasn’t increased enough to cover our mandated costs that we have every
year. Performance funding only works if the state is willing to fund us; otherwise it
becomes just a matter of winners and losers.” “Eric’s” responses indicate that not only
was their tuition and fee increase impacted by the stop-loss adjustment, but also that they
were not able to make improvements in their operations to positively impact student
success.
The second finding is the president of the Case 4 institution was the first
participant that was aware of the difference between the stop-loss impact, the
performance share percentage, and the enrollment component of the MAPFF. None of the
other participants indicated any knowledge of this. The Case 4 institution’s state
appropriation in FY2016 was $7.8 million, or 44.5% more than in FY2013, the year
before the MAPFF. However, the Case 4 institution received $7 million less in state
176
appropriations after the stop-loss adjustment over the same three-year period than it
would have before (Table 21).
“Rachel” responded to that fact by stating that, “the stop loss is really an
anathema. The politicians don’t have the courage to give less funding to an institution
because of poor results on a funding formula. She went on to say that the stop loss may
impact what an individual institution receives in state funding, but it doesn’t impact the
entire system in Massachusetts. “So, access doesn’t change when you look at the entire
system.” In “Rachel’s” view, her institution was negatively impacted by the stop-loss
adjustment, which supports why she felt the state politicians lacked courage to give less
funding to poor performing institutions. It is noteworthy that “Rachel” is the only
participant that indicated awareness of the difference between the stop-loss impact and
the performance share. She was also the only senior administrator who mentioned some
detailed knowledge of the enrollment component of the MAPFF. She stated that they did
review the detailed results of the MAPFF early on but had stopped doing that and now
just discuss the additional money there is available, so they can balance the budget. She
added that the Department of Higher Education needs to reform the formula to be more
nuanced based on the institutions’ characteristics. “I know that my completion rate and
my retention rate will go up because of the work we are doing on development education
and student success integration, and if the formula was more nuanced, it would separate
us from the field, and we would receive more state funding.” The formula already
separates them from the field on performance; her perception is from the stop-loss
impact.

177
“Rachel” made a point of saying the negative impact of the MAPFF was because
the state appropriations did not reflect the true worth of the institution. “There is a certain
cynicism that happens in the conversation that you’re being measured, held to account,
and you’re not good enough to prove your worth. Your performance dollars coming in
that you ‘earn’ are never reflective of what your true work is.” This statement reflects the
antithetical relationship between the stop-loss adjustment and the performance share
percentage. The performance share percentage for the Case 4 institution exceeded the
sector average in all three years of the MAPFF but was significantly impacted by the
stop-loss adjustment. In FY2016 alone, the Case 4 institution received $2.9 million less in
state appropriations after the stop loss than it would have before and outperformed the
sector average performance share (9.6% versus 6.7%). She went on to say that they
would have been better off if they didn’t have a formula because “the formula implies a
certain negligence before it happens. The amount of money allocated by the MAPFF is so
little that it’s really not an incentive and we’re under scrutiny with really no reward.”
While “Rachel” was being critical of MAPFF by stating that it measures them and
holds them to account for good results and that the formula is not reflective of what their
true work is, their performance share percentage is the second highest of all 15
institutions in the Commonwealth. “Rachel” did understand the impact of the stop-loss
adjustment, which supports her negative view of the MAPFF. They received $7 million
less in state appropriations between FY2014 and FY2016 than they would have received
before the stop-loss adjustment. I pointed out that her institution’s performance share
percentage increased over the first three years of the MAPFF and asked her what she

178
attributed that to. She responded, “I think the increased performance on development
education is part of that.
The third finding is the respondents attributed their enrollment changes to
demographic changes and not to their outcomes on the MAPFF. “Rachel” stated that her
institution did not alter its admission and recruitment activities to improve their outcomes
on the MAPFF. She stated that they have not, and she has not heard any talk about that at
the Council of Presidents. “I don’t hear that talk and I’m not seeing that practice in
Massachusetts; I don’t know about the state colleges and universities.” The part that tips
us over is our lack of enrollment loss during this time.” She added that their small
enrollment decline was due to the declining high school graduation rates and an
economic recovery, but that was kept to a minimum because of the population growth of
the greater metropolitan community.
“Eric,” was asked if his institution took any actions to change its admissions or
recruitment practices. He said, “no, we didn’t do anything. We took no actions
specifically to give us better funding.” The performance share percentage for the Case 4
institution increased over the period under study. “Eric” felt that his institution’s
enrollment was “good and strong” [less of a decline] when other colleges had a larger dip
in enrollment. “Eric” echoed “Rachel’s” response to the reasons for the slight enrollment
decline: that the high school graduation rates declined, and the population of the greater
metropolitan community grew. He added that they “did nothing to restrict admissions,
and if someone suggested that they would be rousted out of town.” In fact, “Eric” added:
“we are trying to make admissions easier by moving away from a strict dependence on
179
Accuplacer and moving to a GPA in high schools, and some other ways to get students
into college-level courses quicker” to improve their enrollment.
The fourth finding is the Case 4 institution was already an Achieving the Dream
(AtD) school prior to the implementation of the MAPFF and didn’t need the incentive of
the MAPFF metric to guide their focus in this area. “Eric” added that they were already
an Achieving the Dream (AtD) school prior to the implementation of the MAPFF. They
didn’t need the incentive of the MAPFF metric to guide their focus in this area. As stated
previously, the largest component in the MAPFF completion variable is the “AtD
Success Rate.” The AtD portion of the second variable in the MAPFF rewards colleges
for serving students of color, low-income students, and other historically
underrepresented student populations. The institutions success in this variable is weighted
at 45% of the total Variable 2 measurement (Figure 3) and significantly impacts the
performance share percentage. This supports the low potential categorization of the Case
4 institution, since they were already focused on this area of student success.

180
Figure 3. Research methods.
The fifth finding is the perception that not enough money was allocated by the
MAPFF. All the state appropriations are allocated through the MAPFF. Finally, the
respondents stated they did not look at the details of the MAPFF but rather just focused
on the amount of total state appropriation change. The MAPFF allocates 100% of the
total state allocation, and the MAPFF spreadsheet displays the detailed calculations for
all the components of the formula.
“Eric” confided that they did not look at the details of the MAPFF but rather just
focused on the amount of total state appropriation change. This is because there is not a
lot of money tied to the formula. “I think if they [state] funded the formula, we would pay

181
more attention to the formula. But it becomes kind of a useless exercise that there’s no
money going into it.” As noted earlier, the MAPFF allocates all the state appropriations
to the community colleges.
Summary of interview themes. Several common themes were found among the
participants from the Case 2, 3, and 4 institutions. The first theme is a perception that the
goals of the Vision Project are separate and distinct from the goals of the MAPFF.
Respondents from each of the Case 2, 3, and 4 institutions did not appear to recognize
that the goals of the MAPFF are the same in the Vision Project. The second theme found
is the institutional results of the MAPFF influenced negative impacts to student access
through decreased affordability for the students. Respondents from each of the Case 2, 3,
and 4 institutions attributed large tuition and fee increases to the MAPFF. The third
theme found is the vice presidents of finance at Case 2, 3, and 4 institutions were relied
upon to evaluate and communicate the results of the MAPFF with the other senior
administrators. The fourth theme found is the senior administrators trivialized or
overlooked their institutional detailed results before the stop-loss adjustment, effectively
nullifying the fiscal incentive intended by the MDHE to improve student success with the
MAPFF. Finally, the respondents perceived the MAPFF did not cause the reduction in
enrollments at the case institutions; however, some programs, courses, and sections were
reduced or eliminated in response to the perception of a lack of state funding.
Discussion
This chapter began by asking, “how is performance funding influencing the open
access mission of community colleges in Massachusetts?” In review, performance
funding programs are designed to improve institutional performance and student

182
outcomes using formulas for the basis for allocating state appropriations. To answer this
question, the study sought to determine how the senior leadership of four community
colleges in Massachusetts responded to their institutions’ results of the Massachusetts
performance funding formula (MAPFF) over the first three years of use, FY2014–
FY2016. A major finding of my study is the disconnection found between the
performance funding component metrics and the impact of the Massachusetts
Performance Funding Formula (MAPFF), which includes the stop-loss adjustment
(guaranteed increase).
Performance funding involves the use of a formula to tie government funding to
institutional performance on specific indicators (Dougherty & Reddy, 2011). As
explained in Chapter II, the MAPFF was introduced in FY2014 to allocate state
appropriations to the 15 community colleges in Massachusetts for the successful
outcomes of their students, to stop the growth of student charges already among the
highest in the nation, add accountability of the institutions for the use of public funds, and
to address several other legislative concerns. It was stated in Chapter II that the stop-loss
adjustment (guaranteed increase) of the MAPFF could diminish or delay the performance
incentive of the funding formula. My analysis of the data collected indicates that the stop-
loss adjustment component of the MAPFF has significantly altered the intended purpose
that the MDHE had for the implementation of the formula. The stop -loss adjustment
diverted attention away from the impact of performance improvements by the institutions
for the first three years under study. After fiscal year 2014, the institutions continued
increasing student fees in FY2015 and 2016. Although this stop-loss effect was identified
before collecting data, the degree to which it impacted the results was more profound.

183
The difference between the performance share and the stop-loss adjustment is an
important distinction to recap before the results of the findings are discussed. Chapter III
describes how the MAPFF determines the amount of state appropriation each of the
community colleges receive by combining the results of the base share, performance
share, cost-of-operation subsidy, and then the fourth component is application of the stop-
loss adjustment (Table 3). The stop-loss adjustment is both to hold institutions harmless
for poor performance results on the first three components of the MAPFF, as evidenced
by the performance share percentage, and to guarantee a minimum funding increase as
stipulated when the MAPFF was instituted (3.5% in FY14 and FY15, and 2.5% in FY16).
However, an institution with higher performance share percentages can be negatively
impacted because of the stop-loss adjustment even though they receive more state
appropriations than the previous fiscal year. This is because they may receive less than
they would have before the stop-loss adjustment; coined as the “stop-loss effect.” The
stop-loss effect is described next.
Stop-loss effect. The “stop loss” feature guaranteed each institution would
receive a minimum increase of 3.5% in fiscal years 2014 and 2015, and 2.5% in FY2016.
At the time of the implementation of the MAPFF, the Massachusetts Department of
Higher Education (MDHE) scheduled the phase-out of the stop-loss adjustment over the
first four years of the MAPFF. MDHE reduced the stop-loss adjustment percentage in
fiscal year 2016 to 2.5% from 3.5%. The institutions scoring a higher performance share
percentage in the MAPFF saw the calculated value in the MAPFF dashboard, but did not
receive the full benefit. The stop-loss adjustment of the MAPFF reallocates
appropriations from better performing institutions to institutions for which their state

184
appropriations would not have reached the minimum increase in any year. The MAPFF
for Case 2, 3, and 4 institutions all showed that they would have received more
appropriations before the stop loss, 20.3%, 38.4%, and 60.9% respectively, but instead
saw part of the appropriations reallocated to other institutions, such as to case 1
institution (Table 9). The missing feedback in the qualitative portion of my study from
the case 1 institution is unfortunate because they significantly benefitted from the stop-
loss effect. The quantitative administrative and secondary data for the case 1 institution
also displayed the highest potential for the leaders of the institution to have taken actions
that would have negatively impacted access. Without their participation in the interviews,
it is unknown if the perceptions of the senior administrators at the case 1 institution
would have differed from the other case institutions. My analysis of the data collected
from the qualitative interviews indicate the senior administrators looked at the final
allocations after the stop loss and felt the MAPFF did not allocate enough funding to
warrant more detailed attention paid to the formula.
Analysis of the qualitative data led to my conclusion that the stop-loss effect is
significant. The consistent perception of the senior administrators that the MAPFF did
not allocate enough funding, points to a confusion between performance as measured by
the formula and the total appropriation—the impact of the stop-loss effect. The stop-loss
effect is the difference between the state funding calculated before and after the stop-loss
adjustment. The quantitative administrative and secondary data, the quantitative and
qualitative survey, and qualitative interview responses indicate that the stop-loss effect
significantly affected the perception of the participants and the effectiveness of the
MAPFF as originally intended by the MDHE. Most of these administrators viewed the

185
final MAPFF allocation (after the stop-loss adjustment) as the effect of the performance
formula.
The performance allocation is determined by the student success, completion,
and alignment variables in the formula. The performance share percentage is the gauge or
score indicating the effectiveness of each institution in meeting the goals determined by
MDHE. The stop-loss adjustment is applied after the calculation of the performance share
percentage and the result is the state appropriation allocation for each of the 15
community colleges in Massachusetts.
The intent of the Department of Higher Education is to incentivize improved
performance as measured by the MAPFF by rewarding the institutions with more state
appropriations showing improved student success. However, because of the stop-loss
adjustment, the MAPFF guaranteed each institution received additional state
appropriations in each of the first three years of the MAPFF, regardless of their outcomes
on the first three components of the formula. Essentially, the effectiveness of the
performance funding incentive was lost.
Analysis of the survey and interview data revealed inconsistent views of how the
formula impacted the institutions with regards to strategic decision-making, specifically
impacting access. Two significant findings and four other findings emerged from the
quantitative and qualitative data analysis, as summarized below.
Significant and notable findings. Two significant findings were found in my
study: 1) the stop-loss effect appears to have had a significant impact on the effectiveness
of the MAPFF and prompted actions by the senior leadership negatively impacting access
and 2) the perception of the senior administrators that the state is not funding the formula

186
enough to have any impact on access. Four other notable findings were also found and
included: 1) lack of detailed review of the MAPFF results and the reliance on the
interpretation and communication from the vice presidents of finance; 2) the
trivialization, and/or lack of attention paid to the enrollment variable within the base
share component of the MAPFF; 3) the perception that the Vision Project was more of an
incentive to improve student success over the MAPFF, and 4) the perception that none of
the enrollment losses at the case institutions were related to actions implemented because
of the MAPFF.
The most significant finding was the stop-loss effect “resulting from the hold
harmless factor” had a significant impact on the effectiveness of the MAPFF because the
senior leadership perceived the final allocation as the most significant result of the
MAPFF. The stop-loss effect is the difference between the state funding calculated before
and after the stop-loss adjustment which guaranteed and minimum increase to all the
colleges. Although all four case institutions received more state appropriations in each of
the three years of the study, the Case 3 and 4 institutions saw their state allocations
reduced as a result of the stop-loss adjustment. The state appropriations were reduced by
a total of $2.587 million for Case 3 institution and $7.014 million for Case 4 institution
over the first three years of the formula. Case 2 institution received a total increase of
$523,700 over the first three years of the formula. The Case 1 institution would have
received $2.4 million, or 24.9% less in state appropriations before the stop-loss
adjustment, and received $1.6 million, or 16.48% more after the stop-loss. Because of
these results, the senior administrators trivialized or overlooked the performance
component of the formula, stifling any actions to improve student success as incentivized

187
by the formula. Although previous studies reported some use of hold harmless or stop-
loss provisions to appropriation losses, the impact and effectiveness of them were not
elaborated on because they were not the primary focus (Dougherty, et al., 2011;
Dougherty, et al., 2014; Dougherty, Jones, Lahr, Natow, Pheatt, and Reddy, 2016;
Dougherty & Reddy, 2011, 2013). These studies found that the top administrative
institutional leaders at various two- and four-year institutions in Tennessee, Florida,
Washington, Missouri, North Carolina, and South Carolina used the performance funding
programs output to analyze institutional effectiveness and develop strategic plans to
improve student success results that could maximize the amount of state appropriations.
In the Woodland Hills study, early on the performance funding formula did motivate
strategic planning, however, the performance funding formula was invisible to staff and
faculty below the vice president level (Wood, 2007).
Possibly related to the first finding, the second significant finding was the senior
administrators from the Case 2, 3, and 4 institutions perceived that the state was not
funding the formula enough to have any impact on them, positive or negative. The
MAPFF allocates all the state appropriations for the community colleges, qualifying it as
a PF 2.0 program (Dougherty & Reddy, 2013). Additionally, the quantitative data show
the Massachusetts appropriations were increased by $20 million or 9.6%, $13.1 million
or 5.8%, and $9.1 million or 3.5% in FY2014, FY2015, and FY2016 respectively. The
Case 2, 3, and 4 institutions received $3.7 million (23%), $3.3 million (29.8%), and $7.8
million (44.5%) more in state appropriations in FY2016 than they did in FY2013. These
increases would be considered good by any standard. However, they received less than
they would have received before the stop-loss adjustment. The stop-loss effect masked

188
the magnitude of the performance portion of the funding formula and is a significant
reason the Case 2, 3, and 4 institutions felt this way.
All three vice presidents of finance at Case 2, 3, and 4 institutions had the mindset
that due to the lack of state funding in the years leading up to the implementation of the
MAPFF, they did not recognize or give credit for the increases they did receive. “Jake,”
the vice president of finance at the Case 2 institution, didn’t think the state stepped up
because the institution had been flat funded before the MAPFF was implemented. “Eric,”
the vice president of finance at the Case 4 institution, indicated that the state
appropriations increases were not enough to cover their mandated costs and didn’t expect
much from the state because he anticipated they wouldn’t get much of an increase.
The first notable finding is each institution’s lack of a detailed review of the
MAPFF results and the reliance on the interpretation and communication from the vice
president of finance regarding the formula’s results. The vice presidents of finance at
Case 2, 3, and 4 institutions felt that the MAPFF was not an important measure that
warranted a detailed review because they interpreted the MAPFF as allocating too few
dollars to the institutions. This also indicates a trivialization and/or a lack of attention
paid to the difference between the performance share and the stop-loss effect. The
performance share is the measurement of how well each institution performed in the
college completion and alignment variables. The stop-loss adjustment is applied after the
calculation of the performance share. The dashboard page of the MAPFF spreadsheet
summarizes the dollar impact of base share, performance share, cost-of-operation
subsidy, and the total appropriation both before and after the stop-loss adjustment. It
seemed that the vice presidents of finance were not concerned with the detail of the

189
MAPFF, focusing only on the appropriation after the stop loss. Perhaps the vice
presidents of finance understand having the stop-loss adjustment in the MAPFF but feel
that the state would never eliminate it as the MDHE intended. In publicly funded
community colleges, the vice president of finance is typically the position responsible for
knowing the details of how the state allocates appropriations and using this information
to develop the fiscal year budgets and sharing this information for value in strategic
decision-making. It appeared the other senior administrators feared the formula and game
themselves permission not to fully analyze and understand the results. The interviews
with the participants at all three case institutions reveal the vice presidents of finance are
controlling the MAPFF information provided to others at the institutions, masking the
information by making the decision before the administrators who control the operations
for student success are engaged. As a result, this defeated the incentive of the MAPFF on
improving student access and success. This finding is contrary to the findings in previous
performance funding studies where early on, the PF program drove significant change at
the institutions (Dougherty & Reddy, 2011, 2013; Dougherty, et al., 2016; Dougherty,
Jones, Lahr, Natow, Pheatt, Vikash, 2014; Lahr, Pheatt, Dougherty, Jones, Natow &
Reddy, 2014; Latimer, 2001, Hillman, et al., 2015; Wood, 2007).
The study conducted at the University of Memphis found that the senior
administrators at the university found the PF formula was unwieldy and burdensome for
the funds it returned (Latimer, 2001). The University of Memphis study indicated the
existence of a performance funding officer position. However, there was no mention that
the PFO controlled the PF-resulting information, releasing it to the other senior
administrators at the institution. Other studies found that the PF program had an impact at

190
the institution early on but shortly became “invisible” below the vice president level
(Dougherty & Reddy, 2011; Dougherty, et al., 2016; Dougherty, Jones, Lahr, Natow,
Pheatt, Vikash, 2014; Lahr, Pheatt, Dougherty, Jones, Natow & Reddy, 2014; Latimer,
2001, Hillman, et al., 2015; Wood, 2007). Having a separate performance funding officer
position could indicate that this institution treated the performance funding program as
strategically important. It could also mean that the other senior leaders, including the vice
president of finance, were not as committed to learning and understanding how the
performance funding program impacted their institutions.
The second notable finding is the trivialization, and/or, lack of attention paid to
the enrollment variable of the MAPFF. The base share enrollment variable weights
programs higher in STEM and workforce development, providing an opportunity for the
institutions to maximize this component of the formula. Although the senior
administrators indicated the MAPFF did not directly impact access, they instead focused
on increasing overall enrollments. Apart from the president of the Case 4 institution, the
interviewees did not seem to know the MAPFF weights enrollments differently by
program. Each institution was focused on increasing total, overall enrollment through
obtaining new students and improving their rates of retention. When probed about their
overall enrollment strategy, most of the participants never mentioned familiarity with or
attempts to strategically increase enrollments weighted higher in the MAPFF. The
enrollment variables with the higher weights in STEM and workforce-related programs
as shown in Figure 1, indicate the Department of Higher Education’s priorities for the
public institutions in the commonwealth. These goals are also outlined in the overall
Vision Project goals. “Rachel,” the president of the Case 4 institution, recognized that the
191
MAPFF targets enrollments in workforce development and STEM but did not indicate a
change in their enrollment strategies because of it. “Rachel” also indicated this did not
match the needs of the local businesses. While focusing on all enrollments is an action
consistent with profit maximization and imitating behaviors found in the business sector,
found in Levin (2005), it ignores or trivializes the goals and priorities of the Department
of Higher Education in Massachusetts for more STEM and workforce enrollment. This
finding is contrary to the findings in other studies on performance funding programs,
where actions were found to be more selective in admissions to boost graduation rates
(Dougherty, Jones, Lahr, Natow, Pheatt, Vikash, 2014). Although the Case 2, 3, and 4
institutions overlooked the enrollment goals in the base-share component of the MAPFF,
they focused on increasing overall enrollments and indicated they did not engage in any
kind of restrictive admissions, enrollment, and recruitment practices.
The third notable finding is many of the participants stated that their institutions’
focus on improving enrollment and student success were incentivized more by the Vision
Project results and not the MAPFF. However, the MAPFF is a sub-component of the
Department of Higher Education’s overall Vision Project.
The fourth notable finding is all senior administrators did not perceive any of the
enrollment loss was related to actions implemented because of improving their results on
the MAPFF. Although there were some contradicting responses between the survey and
interview responses, the participants agreed that fewer high school graduates, an
improving economy, and lower unemployment rates were the principle drivers for their
enrollment declines. This would be standard community college strategic responses.
However, the data show reductions and eliminations of programs, courses, and sections at

192
Case 2 and 3 institutions were influenced by the MAPFF in response to the perception of
a lack of state funding. The Vision Project addresses the desire of the Massachusetts
Department of Higher Education to produce the best-educated citizenry and workforce in
the nation and be national leaders in research that drives economic development (MDHE
2010; 20111; 2012; 2013). The Vision Project focuses on five key areas: (a) college
participation, including college readiness and enrollment; (b) college completion,
including graduation and student success rates; (c) student learning, including campus-
level and system-wide assessment; (d) workforce alignment, including promotion of
STEM education and statewide workforce planning; and (e) research. The Vision Project
explicitly lists specific policies and practices for the college completion area, including
performance funding (MDHE, 2011). The MAPFF components also align directly to the
enrollment variables (Figure 1), completion (Figure 2), and the alignment multipliers
(Figure 4). Their failure to recognize this fact indicates a lack of understanding of the role
the MAPFF plays in the Vision Project for Massachusetts.

193
Figure 4. MAPFF Dashboards FY2014–2016.
2,2
39
,94
1$
4,8
70
,65
5$
4
,50
0,0
00
$
1
1,6
10
,59
7$
12
.2%
10
,74
8,4
46
$
40
0,9
40
$
3
.9%
8,9
42
,23
2$
9,0
47
,04
0$
4
,50
0,0
00
$
2
2,4
89
,27
2$
15
.2%
20
,46
1,3
26
$
94
3,0
88
$
4
.8%
13
,87
1,6
49
$
9,7
86
,20
9$
4
,50
0,0
00
$
2
8,1
57
,85
7$
17
.6%
25
,28
5,8
25
$
1,3
35
,62
8$
5.6
%
3,5
57
,22
1$
5,5
85
,56
4$
4
,50
0,0
00
$
1
3,6
42
,78
5$
20
.0%
12
,09
1,1
22
$
72
1,5
95
$
6
.3%
2,2
37
,10
3$
1,8
99
,00
7$
4
,50
0,0
00
$
8
,63
6,1
10
$
-13
.2%
10
,19
7,4
57
$
24
8,7
18
$
2
.5%
7,1
79
,02
1$
7,6
76
,75
0$
4
,50
0,0
00
$
1
9,3
55
,77
1$
0.2
%1
9,7
93
,77
1$
4
82
,77
5$
2.5
%
5,4
23
,76
2$
6,8
58
,30
5$
4
,50
0,0
00
$
1
6,7
82
,06
7$
9.2
%1
5,8
16
,95
4$
4
48
,82
2$
2.9
%
8,2
25
,58
6$
6,5
52
,99
7$
4
,50
0,0
00
$
1
9,2
78
,58
3$
-4.7
%2
0,7
33
,05
6$
5
05
,68
4$
2.5
%
10
,17
8,8
48
$
10
,56
8,9
47
$
4
,50
0,0
00
$
2
5,2
47
,79
5$
15
.6%
22
,92
5,1
99
$
1,0
80
,11
5$
4.9
%
5,5
86
,91
9$
5,1
44
,66
6$
4
,50
0,0
00
$
1
5,2
31
,58
6$
10
.0%
14
,28
3,5
27
$
44
0,8
91
$
3
.2%
7,9
59
,76
4$
8,1
32
,97
6$
4
,50
0,0
00
$
2
0,5
92
,74
0$
-0.1
%2
1,1
23
,37
9$
5
15
,20
4$
2.5
%
6,6
84
,13
3$
9,3
81
,35
2$
4
,50
0,0
00
$
2
0,5
65
,48
5$
9.4
%1
9,3
64
,63
8$
5
58
,44
9$
3.0
%
8,9
99
,74
4$
8,0
53
,27
5$
4
,50
0,0
00
$
2
1,5
53
,01
9$
8.5
%2
0,3
98
,30
8$
5
36
,99
4$
2.7
%
2,4
63
,08
8$
33
9,8
72
$
4,5
00
,00
0$
7,3
02
,96
0$
-3
4.0
%1
1,3
33
,24
7$
2
76
,42
1$
2.5
%
7,3
66
,67
7$
7,0
18
,07
1$
4
,50
0,0
00
$
1
8,8
84
,74
9$
-21
.9%
24
,77
5,1
19
$
60
4,2
71
$
2
.5%
2,0
44
,78
6$
4,0
26
,41
5$
4
,50
0,0
00
$
1
0,5
71
,20
1$
16
.4%
9,7
46
,38
6$
66
6,7
55
$
7
.3%
7,4
18
,47
2$
7,8
58
,48
4$
4
,50
0,0
00
$
1
9,7
76
,95
6$
17
.5%
18
,14
4,9
44
$
1,3
19
,26
7$
7.8
%
11
,92
6,4
70
$
8,4
48
,68
7$
4
,50
0,0
00
$
2
4,8
75
,15
7$
25
.8%
22
,05
7,3
62
$
2,2
77
,81
8$
11
.5%
3,1
87
,57
1$
3,4
87
,58
4$
4
,50
0,0
00
$
1
1,1
75
,15
5$
9.9
%1
0,6
18
,00
9$
4
50
,38
0$
4.4
%
2,1
36
,84
0$
2,2
18
,46
5$
4
,50
0,0
00
$
8
,85
5,3
05
$
-1.1
%9
,26
9,9
30
$
3
13
,47
6$
3.5
%
6,0
32
,29
2$
6,5
64
,99
0$
4
,50
0,0
00
$
1
7,0
97
,28
2$
-0.4
%1
7,7
61
,98
8$
6
00
,64
7$
3.5
%
4,6
25
,91
1$
6,1
76
,18
8$
4
,50
0,0
00
$
1
5,3
02
,09
9$
10
.9%
14
,46
9,6
11
$
67
2,9
57
$
4
.9%
7,1
98
,46
9$
4,8
59
,44
9$
4
,50
0,0
00
$
1
6,5
57
,91
7$
-7.9
%1
8,6
13
,77
0$
6
29
,45
1$
3.5
%
8,7
12
,19
3$
8,9
37
,60
0$
4
,50
0,0
00
$
2
2,1
49
,79
2$
16
.7%
20
,39
8,9
33
$
1,4
15
,34
0$
7.5
%
4,8
31
,59
5$
4,5
74
,20
4$
4
,50
0,0
00
$
1
3,9
05
,79
9$
15
.1%
12
,89
8,6
51
$
81
4,1
48
$
6
.7%
6,6
30
,12
5$
6,9
90
,55
2$
4
,50
0,0
00
$
1
8,1
20
,67
7$
-0.7
%1
8,8
85
,59
6$
6
38
,64
3$
3.5
%
5,8
22
,47
5$
7,3
75
,67
5$
4
,50
0,0
00
$
1
7,6
98
,15
0$
4.9
%1
7,4
67
,00
4$
5
90
,67
2$
3.5
%
7,8
94
,34
5$
7,6
69
,29
7$
4
,50
0,0
00
$
2
0,0
63
,64
3$
22
.8%
18
,00
1,1
72
$
1,6
67
,23
6$
10
.2%
2,1
70
,18
7$
65
8,8
07
$
4,5
00
,00
0$
7,3
28
,99
5$
-2
7.2
%1
0,4
22
,32
9$
3
52
,44
6$
3.5
%
6,2
81
,67
8$
7,0
67
,01
5$
4
,50
0,0
00
$
1
7,8
48
,69
3$
-18
.2%
22
,57
1,1
37
$
76
3,2
75
$
3
.5%
2,1
12
,31
8$
3,3
30
,59
4$
4
,50
0,0
00
$
9
,94
2,9
12
$
24
.5%
9,2
07
,28
1$
1,2
19
,07
4$
15
.3%
6,8
20
,62
2$
7,0
76
,76
3$
4
,50
0,0
00
$
1
8,3
97
,38
5$
32
.5%
16
,69
9,3
47
$
2,8
13
,95
6$
20
.3%
8,9
12
,76
3$
7,6
03
,52
5$
4
,50
0,0
00
$
2
1,0
16
,28
8$
20
.1%
19
,69
1,7
04
$
2,1
95
,07
3$
12
.5%
3,2
24
,45
2$
2,4
44
,27
2$
4
,50
0,0
00
$
1
0,1
68
,72
4$
3.5
%1
0,1
67
,62
9$
3
43
,83
3$
3.5
%
2,1
51
,04
9$
3,1
46
,82
3$
4
,50
0,0
00
$
9
,79
7,8
72
$
25
.5%
9,0
48
,21
1$
1,2
42
,32
2$
15
.9%
5,9
69
,31
3$
7,1
97
,64
9$
4
,50
0,0
00
$
1
7,6
66
,96
2$
9.9
%1
7,0
67
,69
2$
9
93
,09
8$
6.2
%
4,4
70
,66
8$
6,2
23
,78
0$
4
,50
0,0
00
$
1
5,1
94
,44
8$
28
.1%
13
,93
9,2
29
$
2,0
80
,12
3$
17
.5%
6,7
02
,10
9$
5,3
41
,32
1$
4
,50
0,0
00
$
1
6,5
43
,43
0$
-4.8
%1
7,9
84
,31
9$
6
08
,16
5$
3.5
%
8,2
13
,61
4$
7,4
71
,74
8$
4
,50
0,0
00
$
2
0,1
85
,36
2$
17
.9%
19
,03
2,1
93
$
1,9
11
,01
0$
11
.2%
4,7
43
,48
4$
3,4
45
,54
2$
4
,50
0,0
00
$
1
2,6
89
,02
7$
15
.3%
12
,05
6,2
06
$
1,0
48
,69
8$
9.5
%
6,3
69
,88
1$
6,4
44
,25
8$
4
,50
0,0
00
$
1
7,3
14
,13
9$
-1.8
%1
8,2
46
,95
3$
6
17
,04
7$
3.5
%
5,3
80
,00
9$
6,2
39
,96
7$
4
,50
0,0
00
$
1
6,1
19
,97
6$
-1.1
%1
6,8
76
,33
2$
5
70
,69
7$
3.5
%
7,3
31
,54
4$
6,4
06
,53
5$
4
,50
0,0
00
$
1
8,2
38
,07
9$
40
.5%
16
,25
9,4
69
$
3,2
78
,91
2$
25
.3%
2,1
78
,26
0$
1,0
79
,71
5$
4
,50
0,0
00
$
7
,75
7,9
74
$
-20
.3%
10
,06
9,8
83
$
34
0,5
27
$
3
.5%
5,7
47
,06
9$
6,8
74
,66
4$
4
,50
0,0
00
$
1
7,1
21
,73
3$
-18
.7%
21
,80
7,8
62
$
73
7,4
64
$
3
.5%
80
,32
7,1
56
$
80
,32
7,1
56
$
6
7,5
00
,00
0$
2
28
,15
4,3
11
$
9.6
%2
28
,15
4,3
11
$
2
0,0
00
,00
0$
9
.6%
SY
ST
EM
TO
TA
L$
20
8,1
54
,31
1
Ins
titu
tio
n M
$1
2,9
80
,55
7
Ins
titu
tio
n N
$9
,72
9,3
56
Ins
titu
tio
n O
$2
1,0
70
,39
8
Ins
titu
tio
n J
$1
1,0
07
,50
8
Ins
titu
tio
n K
$1
7,6
29
,90
6
Ins
titu
tio
n L
$1
6,3
05
,63
5
Ins
titu
tio
n G
$1
1,8
59
,10
6
Ins
titu
tio
n H
$1
7,3
76
,15
4
Ins
titu
tio
n I
$1
7,1
21
,18
3
Ins
titu
tio
n D
$9
,82
3,7
96
Ins
titu
tio
n E
$7
,80
5,8
89
Ins
titu
tio
n F
$1
6,0
74
,59
4
Pe
rce
nta
ge
Dif
fere
nc
e
in F
un
din
g
Ins
titu
tio
n A
$7
,98
8,2
07
Ins
titu
tio
n B
$1
3,8
85
,39
1
Ins
titu
tio
n C
$1
7,4
96
,63
1
Pe
rfo
rma
nc
e
All
oc
ati
on
($
)
Co
st
of
Op
era
tio
n
Su
bs
idy
($
)T
ota
l A
llo
ca
tio
n %
Dif
fere
nc
e i
n F
un
din
g
20
13
To
tal
All
oc
ati
on
Aft
er
Sto
p
Lo
ss
Ad
jus
tme
nt
Dif
fere
nc
e $
(+
/-)
be
twe
en
Sto
p
Lo
ss
an
d F
Y1
3 G
AA
5.8
%2
41
,32
6,8
22
$
1
3,1
72
,51
1$
5
.8%
Ne
w F
un
din
g A
llo
ca
tio
ns F
Y1
4
Ma
ssa
ch
use
tts P
ub
lic C
om
mu
nit
y C
oll
eg
es
FY
13
Fu
nd
ing
Am
ou
nt
Ne
w F
un
din
g L
ev
el
- N
o S
top
Lo
ss
Ne
w F
un
din
g L
ev
el
- W
ith
Sto
p L
os
s
Ba
se
All
oc
ati
on
($
)
SY
ST
EM
TO
TA
L$
22
8,1
54
,31
18
6,9
13
,41
1$
8
6,9
13
,41
1$
67
,50
0,0
00
$
24
1,3
26
,82
2$
Ins
titu
tio
n M
16
,33
3,9
36
$
Ins
titu
tio
n N
10
,06
9,8
83
$
Ins
titu
tio
n O
21
,80
7,8
62
$
Ins
titu
tio
n J
12
,08
4,5
03
$
Ins
titu
tio
n K
18
,24
6,9
53
$
Ins
titu
tio
n L
16
,87
6,3
32
$
Ins
titu
tio
n G
13
,79
6,6
54
$
Ins
titu
tio
n H
17
,98
4,3
19
$
Ins
titu
tio
n I
18
,98
3,5
93
$
Ins
titu
tio
n D
10
,16
7,6
29
$
Ins
titu
tio
n E
8,9
56
,45
4$
Ins
titu
tio
n F
17
,16
1,3
41
$
Ins
titu
tio
n A
9,0
79
,63
1$
Ins
titu
tio
n B
16
,82
5,6
77
$
Ins
titu
tio
n C
19
,77
9,5
44
$
Pe
rfo
rma
nc
e
All
oc
ati
on
($
)
Co
st
of
Op
era
tio
n
Su
bs
idy
($
)T
ota
l A
llo
ca
tio
n
9,0
99
,59
6$
3.5
%
Ne
w F
un
din
g A
llo
ca
tio
ns F
Y1
5
Ma
ssa
ch
use
tts P
ub
lic C
om
mu
nit
y C
oll
eg
es
FY
14
G
AA
(w
/o
Co
lle
cti
ve
Ba
rga
inin
g)
Ne
w F
un
din
g L
ev
el
- N
o S
to
p L
oss
Ne
w F
un
din
g L
ev
el
- W
ith
Sto
p L
oss
Ba
se
All
oc
ati
on
($
)
10
0,9
15
,68
8$
10
0,9
15
,68
8$
6
7,5
00
,00
0$
2
69
,33
1,3
75
$
3.5
%2
69
,33
1,3
75
$
Pe
rce
nta
ge
Dif
fere
nc
e
in F
un
din
g
% D
iffe
ren
ce
in
Fu
nd
ing
fro
m 2
01
4
To
tal
All
oc
ati
on
Aft
er
Sto
p
Lo
ss
Ad
jus
tme
nt
Dif
fere
nc
e $
(+
/-)
be
twe
en
Sto
p
Lo
ss
an
d F
Y1
4 G
AA
Ins
titu
tio
n N
11
,05
6,8
26
$
Ins
titu
tio
n O
24
,17
0,8
48
$
SY
ST
EM
TO
TA
L$
26
0,2
31
,77
9
Ins
titu
tio
n K
20
,60
8,1
75
$
Ins
titu
tio
n L
18
,80
6,1
89
$
Ins
titu
tio
n M
19
,86
1,3
14
$
Ins
titu
tio
n H
20
,22
7,3
72
$
Ins
titu
tio
n I
21
,84
5,0
84
$
Ins
titu
tio
n J
13
,84
2,6
36
$
Ins
titu
tio
n E
9,9
48
,73
9$
Ins
titu
tio
n F
19
,31
0,9
96
$
Ins
titu
tio
n G
15
,36
8,1
32
$
Ins
titu
tio
n B
19
,51
8,2
38
$
Ins
titu
tio
n C
23
,95
0,1
97
$
Ins
titu
tio
n D
11
,36
9,5
27
$
To
tal
All
oc
ati
on
Aft
er
Sto
p
Lo
ss
Ad
jus
tme
nt
Dif
fere
nc
e $
(+
/-)
be
twe
en
Sto
p
Lo
ss
an
d F
Y1
4 G
AA
Pe
rce
nta
ge
Dif
fere
nc
e
in F
un
din
g
Ins
titu
tio
n A
10
,34
7,5
06
$
Ne
w F
un
din
g A
llo
ca
tio
ns F
Y1
6
Co
mm
un
ity
Co
lle
ge
FY
15
G
AA
(w
/ C
oll
ecti
ve
Ba
rga
inin
g)
Ne
w F
un
din
g L
ev
el
- N
o S
to
p L
oss
Ne
w F
un
din
g L
ev
el
- W
ith
Sto
p L
oss
Ba
se
All
oc
ati
on
($
)P
erf
orm
an
ce
All
oc
ati
on
($
)
Co
st
of
Op
era
tio
n
Su
bs
idy
($
)T
ota
l A
llo
ca
tio
n %
Dif
fere
nc
e i
n F
un
din
g
fro
m 2
01
5

194
Before arriving at my conclusions, I considered the correlation versus causation
phenomenon. A correlation between variables does not automatically mean the change in
one variable caused the change in another variable. This research study sought to
determine if the implementation of the MAPFF, used as the mechanism in Massachusetts
to allocate funding based on performance, caused a negative impact to access on either of
two threats to access: decreased affordability and/or restricted admission, enrollment, and
recruitment practices.
My proposition states that the implementation of the MAPFF will have negatively
impacted access in two areas: (a) intentional restrictive admissions, enrollment, and
recruitment practices; and (b) decreased affordability.
As for restrictive admissions, enrollment, and recruitment practices, actions that
limit or restrict admissions or recruitment of students influenced by the MAPFF were
explored (Table 4). The senior leadership perceived the MAPFF did not contribute to any
part of their enrollment losses during the three-year period under study. However,
responses from the participants at Case 2 and 3 institutions indicated the MAPFF
influenced the reduction elimination of some programs, courses, and sections at their
institutions during the study period in response to the perception of too little funding from
the state. Previous studies found that institutions operating under a performance funding
formula restricted admissions and enrollment intentionally by being more selective of
students admitted into the colleges (Dougherty & Reddy, 2011, 2013; Lahr et al., 2014;
Smith, 2015; Tandberg & Hillman, 2013). The results of my study did not find
intentional restrictive admission and enrollment practices.

195
For decreased affordability the following variables were considered: increased
costs through operational changes, additional staffing, and new and increased tuition and
fees (Table 4). The quantitative administrative and secondary data and the qualitative
interview data showed the MAPFF did influence some portion of the tuition and fee
increases and new fees, and a reduction of student aid during the study period. Previous
studies found that institutions operating under a performance funding formula
experienced increased costs related to the review and compliance of a formula and
engaged targeting financial aid (Dougherty & Reddy, 2011, 2013; Lahr, et al., 2014;
Smith, 2015; Tandberg & Hillman, 2013).
Conclusion
The findings reached after a thorough analysis of the quantitative administrative
and secondary data, the quantitative and qualitative survey data, and the qualitative
interview data center around the perceptions and interpretations of the MAPFF and its
purpose by the senior leadership of the case institutions.
This chapter considered if the MAPFF had an impact on student access at the case
institutions in my study. The data show that the changes at Case 2 were greater than case
3 and case 4 institutions in most of the variables measured. The tuition and fee increase
of 16.52% at case 2 was the largest of the four case institutions. The tuition and fee
increase at case institutions 3 and 4 were 6.27% and 5.67% respectively. The state
appropriation calculation before the stop-loss adjustment, indicating the results of the first
three components of the MAPFF, for the Case 2 institution was 20.29% versus 38.3%
and 44.52% for case institutions 3 and 4 respectively. The FTE change at the Case 2
institution was -7.52% versus -5.28% and +0.52% for case institutions 3 and 4

196
respectively. The performance share percentage change at Case 2 was 8.0% versus 4.9%
and 9.6% at the Case 3 and 4 institutions respectively. The stop-loss impact percentage at
Case 2 was 2.4% versus -6.2% and -10.2% at the case 3 and 4 institutions.
The findings from the quantitative data and qualitative interview data suggest that
the MAPFF did have a negative impact on access at Case 2, 3, and 4 institutions, in both
decreased affordability and through the reduction and elimination of programs, courses,
and sections. While I did not question the participants if some of the tuition and fee
increases would have been instituted anyway without the MAPFF, I must consider that
they probably would have. However, it was clear that actions were instituted in response
to the perception that the amount of the state appropriations allocated through the
MAPFF after the stop-loss adjustment would decrease and negatively impacted student
access.

197
Chapter V
Conclusions
The purpose of my study was to determine if one or both of two previously
documented threats to access—decreased affordability and restricted admissions,
enrollment, and recruitment—were found at the case study institutions as a result of the
implementation of the MAPFF. This chapter presents conclusions based on the findings
from the quantitative administrative and secondary data, the quantitative and qualitative
survey data, and the qualitative one-on-one interview data obtained from the senior most
administrators at four case institutions in Massachusetts.
Guiding the findings is the overarching research question for my study of: How is
performance funding influencing the open-access mission of community colleges in
Massachusetts?
Subquestions asked:
1. What operational changes have occurred at the institutions to improve student
success that are directly related to the implementation of the MAPFF?
2. How has the MAPFF Program influenced tuition and fee rate changes?
3. How have changes in the Massachusetts state appropriations with MAPFF
influenced institutional changes in college education delivery or support for
student success that then affected access?
4. How does the senior management perceive the impact of performance funding
on student access to community colleges?

198
Study Overview
The study began with the quest to determine if the performance funding formula
(MAPFF), implemented by the Department of Higher Education as part of the
Commonwealth of Massachusetts Vision Project, negatively impacted the open-access
mission of the community colleges in Massachusetts.
The Massachusetts Legislature developed the Vision Project to strengthen
academic performance at the community colleges while holding the public institutions
accountable to the public for results (MDHE, 2013). The legislative concerns for the
formation of the MAPFF include addressing the large inequities in per student funding,
allocating funds in relation to aspects of institutional performance that reflect statewide
education goals, emphasizing the role of community colleges in preparing students for
jobs in the states’ rapidly evolving economy, and stopping the growth in student charges
that are already among the highest in the nation.
Levin (2005) and Dougherty & Reddy (2011) suggested that the management
behavior at community colleges is mimicking the business sector and making decisions to
maximize profit as a goal. It was for this reason I argued that the community colleges in
Massachusetts would respond to the MAPFF by making changes at their institutions to
maximize their state appropriations, and through their actions, may negatively impact the
open-access mission of community colleges in Massachusetts.
The Commonwealth of Massachusetts is incentivizing the community colleges to
improve student success and completion by allocating 100% of total state appropriations
through the three components of the MAPFF. The base enrollment share component
weights enrollments in STEM and workforce development programs more heavily than
199
other programs, and as a result, adds annual variability within the formula. The
performance share component incorporates student success and alignment variables. The
cost-of-operation subsidy is a flat $4,500,000 for each institution. Finally, a fourth factor
intended to be temporary hold harmless is the stop loss adjustment which guarantees a
minimum increase for each institution. The actual state allocation is the result of all four
factors after adjusting with the stop loss. As documented in the literature review in
Chapter II, research has shown that performance funding programs have negatively
impacted access in the areas of: decreased affordability (AFFORD) and restrictive
admissions, enrollment, and recruitment practices (R.A.E.R.).
My study’s proposition, as it relates to the impact of the MAPFF on the open
access mission, is that the open-access mission was negatively impacted in the
Massachusetts community colleges in one or both areas of decreased affordability and
restrictive admissions, enrollment, and recruitment because of the MAPFF.
All 15 community colleges in Massachusetts increased their tuition and fee rates
during the three years under study. The increases ranged between 3.5% and 23.7%. The
percentage change in FTE for the 15 community colleges ranged between a 0.5%
increase to a 15.1% decrease from 2013 through 2016. Only 12 of the 15 community
colleges were considered for the full study. Two of the 15 institutions were used for the
pilot study, and the third was my home institution at the time my study began, leaving 12
for consideration.
The investigation began by selecting four institutions for this multi-case study
using a purposeful sampling method, discussed in depth in Chapter III. Each of the four
case institutions were examined in view of the two documented threats to access,

200
decreased affordability (AFFORD) and restrictive admissions, enrollment, and
recruitment practices (R.A.E.R.). Based on the quantitative administrative and
documentary data, Case 1 and 2 institutions were grouped into the high potential
category, the Case 3 institution into the lower potential category, and the Case 4
institution was grouped into the low potential category for a negative impact to access.
The data from the surveys and interviews were analyzed to examine how the
MAPFF influenced actions implemented at each of the institutions that may have
impacted the affordability to attend the three case institutions and/or limited enrollments
by restricting admissions, enrollment, and recruitment in some intentional or
unintentional way. Note, the case 1 institution withdrew from participating in the study.
Findings Summary
Described in chapter four, two significant findings were found in my study: 1) the
stop-loss effect appears to have had a significant impact on the effectiveness of the
MAPFF as the senior leaders look at the bottom line, unaware of the formula details; and
2) the perception of the senior administrators that the state is not funding the formula
enough to pay attention to the details of the formula results. Four other notable findings
were also found and included: 1) lack of detailed review of the MAPFF results and the
reliance on the interpretation and communication from the vice presidents of finance; 2)
the trivialization, and/or lack of attention paid to the enrollment variable within the base
share component of the MAPFF; 3) the perception that the Vision Project was more of an
incentive to improve student success over the MAPFF, and 4) the perception that none of
the enrollment losses at the case institutions were related to actions implemented because
of the MAPFF.

201
Impact to access. Findings from the quantitative administrative and secondary
data, the quantitative and qualitative survey data, and the qualitative interview data
collected from the four case institutions were compiled into the two documented areas of
threats to access: (a) decreased affordability (AFFORD); and (b) restrictive admissions,
enrollment, and recruitment (R.A.E.R.).
Decreased affordability for the students is defined in my study when tuition and
fees are increased to replace a reduction in, or smaller increase in state appropriations as
allocated by the MAPFF and/or to fund operational cost increases related to actions taken
at the institutions to improve their performance share percentage results on the MAPFF.
Previous studies revealed that some institutions may not have the financial and human
resources necessary to initiate actions to increase college completions (Dougherty &
Reddy, 2011, 2013; Dougherty et al., 2013, 2014, 2016; Lahr, et al., 2014; Latimer, 2001;
Tandberg, et al., 2014; Wood, 2007). However, these studies did not indicate that the
tuition and fee rates of the institutions were increased to fund the additional financial and
human resources necessary to increase college completions.
Restriction of admissions, enrollment, and recruitment practices is defined in my
study when institutions may have altered their admission, recruitment, and enrollment
practices to improve the outcomes measured in the performance funding formula that
may have decreased access to the institutions. Many studies on performance funding
found institutions engaging in restrictive admissions and selective enrollment activities
that impacted enrollment to improve their formula outcomes (Dougherty & Reddy, 2011,
2013; Dougherty et al., 2013, 2014, 2016; Lahr, et al., 2014; Smith, 2015; Tandberg &
Hillman, 2013).
202
Decreased affordability (AFFORD). The quantitative data collected shows the
tuition and fee rate dollar changes and the percentage changes over the first three years of
the MAPFF (Appendix B). The MDHE required the community colleges in
Massachusetts to freeze tuition and fees in FY2014 for adding $20 million to the total
appropriations allocated through the MAPFF. The Case 2 and 3 institutions raised fees in
each of the next two fiscal years, and Case 1 and 4 institutions waited until FY2016. This
data indicates that the MDHE did not achieve one of its primary goals of the MAPFF to
stop tuition and fee increases.
The quantitative data revealed the stop -loss effect for the Case 1 institution was
significantly positive, receiving 29.8%, 42.2%, and 55.2% more state appropriations in
each of the first three years of the MAPFF, showing increased reward above the
performance ratings (Appendix B). The stop-loss effect for the Case 3 institution was -
5.0%, -7.2%, and -6.2% for the first three years of the MAPFF. The stop-loss effect for
the Case 4 institution was -6.3%, -11.3%, and -10.2% for the same period. The stop-loss
effect for the Case 2 institution was -3.4%, 3.9%, and 2.4% over the first three years of
the MAPFF. Thus, Cases 2, 3, and 4 earned more money under the performance formula
and then lost it to the stop-loss adjustment.
Analysis of the quantitative survey responses indicates that some participants
from each of the Case 2, 3, and 4 institutions perceived the MAPFF influenced actions,
including increasing operational costs by hiring full and part-time faculty and staff,
adding additional student fees, and increasing existing tuition and fees (Table 12).
Additional responses from Case 1, 2, and 3 institutions indicated actions taken that
increased costs to the institutions through expansion of student services and the purchase
203
of tools to monitor performance. These actions were consistent with results from other
studies on performance funding impacts (Dougherty & Reddy, 2011, 2013; Dougherty et
al., 2013, 2014, 2016; Lahr, et al., 2014; Latimer, 2001; Tandberg, et al., 2014; Wood,
2007). These responses were also confirmed during the one-on-one interviews. However,
contradicting results are evident from the survey responses because the three vice
presidents of finance from the Case 2, 3, and 4 institutions indicated there were no
negative impacts from the MAPFF (Table 13). During the interviews, the vice presidents
of finance indicated that the MAPFF did ultimately influence some portion of their
tuition and fee increases based on final allocations, reflecting the stop-loss effect, not in
reaction to the performance share component results. Several respondents from the Case
2, 3, and 4 institutions indicated potential cost saving measures with a reduction in staff
and faculty and reduction in student services. These actions could also preserve
affordability by restricting the amount of fee increases. However, focusing on cost
savings may limit initiatives to improve student success, which is a primary goal of the
MAPFF.
Further analysis of the qualitative interview data indicates that some of the
participants felt not enough money was allocated through the MAPFF to warrant detailed
analysis or as an incentive to improve performance. This finding is also consistent with
the results of other studies on performance funding (Dougherty & Reddy, 2011, 2013;
Dougherty et al., 2013, 2014, 2016; Lahr, et al., 2014; Latimer, 2001; Wood, 2007).
However, the Case 2 institution received $3.7 million, or 23% more, in state
appropriations in FY2016 than in FY2013 ($19.794 vs $16.074). The appropriation
increase for the Case 3 institution in FY2016 was $3.277 million, or 29.8% more, than

204
FY2013 ($14.284–$11.007). The Case 4 institution received $7.8 million, or 44.5% more,
in state appropriations in FY2016 than in FY2013. I did not ask the participants to
quantify the appropriation increase amounts they felt would have been enough to
examine their results on the MAPFF more closely. These increases would be considered
good by community colleges across the country.
The quantitative data revealed tuition and fee increases at each of the case
institutions during the three-year period. Additionally, the quantitative data reveal
significant appropriation adjustments from the stop-loss adjustment. The qualitative data
collected indicate that several senior administrators, including a president at one case
institution and the vice presidents of finance at all three case institutions, indicated that
some portion of their tuition and fee increases and additional student fees were influenced
because of their results, or their perception of the results of the MAPFF. Although each
of the case institutions received more money, the senior administrators spoke about
shortfalls, cuts and being hurt by the MAPFF. The tuition and fee increases and additions,
coupled with significant appropriation adjustments, point to a correlation of negative
impacts on affordability because of the MAPFF.
Restrictive admissions, enrollment, and recruitment (R.A.E.R.). Analysis of
the quantitative data indicate that enrollments declined at each of the case institutions in
varying degrees over the three years of the study (Appendix B). All respondents
perceived that the decline was not related to the MAPFF and that they had not changed
admissions process, contrary to some previous studies. Analysis of the survey responses
indicate some participants perceived a negative impact on student access because they
had to eliminate programs, courses, and sections because they perceived the MAPFF did

205
not allocate enough funds to their institutions. Additionally, reductions in staff and
faculty and reductions in student services, enacted because of the MAPFF, also
contributed to the reduction in enrollment and retention. Although the responses were
mixed, there seems to be a potential correlation to the MAPFF that eliminations and
reductions in these areas will impede the institutions ability to provide the programs and
courses and services students may want and need to fulfill their educational goals. While
the previous studies found restrictive and selective admissions and enrollment activities
implemented because of performance funding, they did not specify enrollment reductions
tied to perceptions of inadequate state funding (Dougherty & Reddy, 2011, 2013;
Dougherty et al., 2013, 2014, 2016; Lahr, et al., 2014; Smith, 2015; Tandberg & Hillman,
2013).
Some responses from the Case 1, 2, and 3 institutions indicated increased
operational costs of compliance. One response from the Case 3 institution indicated a
reduction of academic quality and rigor as a result of their results on the MAPFF.
Previous studies also found a reduction or weakening of academic quality (Dougherty &
Reddy, 2011, 2013; Dougherty et al., 2013, 2014, 2016; Lahr, et al., 2014; Smith, 2015;
Tandberg & Hillman, 2013). Respondents from two of the case institutions indicated the
MAPFF influenced changes in their organization structure (Table 12).
These actions occur routinely within institutions of higher education and may
have a positive or negative impact on the institutions and students. Several respondents
from the Case 2 and 3 institutions indicated that staff morale had been negatively
impacted because of the MAPFF. This could suggest that the MAPFF may be having a
deleterious impact on the institutions, the effects of which were not pursued in my study.

206
Research Subquestion 1. What operational changes have occurred at the
institutions to improve student success that are directly related to the implementation of
the MAPFF? The survey used in my study specifically asked the participants to select
from a list of changes, found in previous research on the impact of performance funding
programs, that were influenced by their institutions’ results on the MAPFF. SQ 8 (Table
12) asked the respondents to identify actions undertaken at their institutions that were
influenced by their results on the MAPFF. These responses were then followed up during
the one-on-one interviews.
As seen in Chapter IV, the responses indicate (a) organization restructures; (b)
both additions and reductions in student services; (c) the purchase of tools to monitor
institutional performance and compliance; (d) reductions in staff and faculty; and (e)
elimination and reduction of programs, courses, and sections. The findings in my study
were also found in the following studies on performance funding programs: (Burke &
Modarresi, 2001; Dougherty & Reddy, 2011, 2013; Dougherty et al., 2013, 2014, 2016;
Lahr, et al., 2014; Latimer, 2001, Smith, 2015; Tandberg & Hillman, 2013; and Wood,
2007).
Support for proposition. These responses address the research question and
reveal intentional actions instituted by the institutions that were influenced in part by the
Vision Project, the expiration of a Title III grant and the MAPFF. Elimination and/or
reduction in the number or programs, courses, and sections will help the institution
reduce costs by reducing the number of faculty and other instructors. The respondents
indicated on the survey and during the interviews that these actions initiated at their
institutions were influenced by the MAPFF even though many of the senior

207
administrators admitted not examining their results of the MAPFF in detail. Additionally,
there was no support found indicating these actions were intentionally done to negatively
impact access. While these actions routinely happen when FTE enrollment falls, they
appear to have unintentionally impacted access by eliminating course and section options
for students.
Reductions in staff and faculty, student services and programs, and courses and
sections are cost saving measures that may limit tuition and fee increases but may also
unintentionally correlate to the second threat to access, restrictive admissions, enrollment,
and recruitment practices (R.A.E.R.) by limiting the number of choices students have for
classes desired and/or support and guidance in student services.
The Case 3 institution was the only case institution that received a Title III grant.
The purpose of the Title III Grant matched part of the goals in the Vision project for
increasing student success and offers an alternative explanation for the organizational
restructures and revamped student advising changes made, which may not reflect the
institutions results on the MAPFF.
Research Subquestion 2. How has the MAPFF Program influenced tuition and
fee rate changes? The Department of Higher Education in Massachusetts determines and
set the level for the tuition component and only permits each college to change the
variable fee component of the tuition and fee amount. As a condition of increasing the
total state appropriations in FY2014 by $20 million, the 15 public community colleges in
Massachusetts agreed to freeze the fee rates in that fiscal year.
All 15 community colleges increased tuition and fees, and the increases in fees
alone do not answer my question. The quantitative administrative and secondary data

208
show all four case institutions increased student fees during the period under study
(Appendix B). The Case 2 institution increased fees in both FY15 and FY16. The fee
amount in FY16 amounted to 16.52% more than the fees in FY14, significantly more
than sector average of 8.2%. The Case 1 institution froze their fees in FY14 and FY15.
However, it increased its fees in FY16, which is 11.41% more than FY15. This increase
is also significantly more than the sector average increase. The fee increases implemented
at the Case 3 institution in FY15 and FY16 amounted to 6.27%, and the fee increases at
the Case 4 institution in FY16 amounted to 5.67%, both less than the sector average
increase of 8.2%. To put these increases in context, comparing the increases during the
study period to the increases immediately prior to the implementation of the MAPFF,
contrasting results appear. The fee increases from FY2012 to FY2013 were 0.2%, 3%,
2.7%, and 0% for case institutions 1, 2, 3, and 4 respectively. The fee increases from
FY2013 through FY2016, after the implementation of the MAPFF, were significantly
larger even after the state mandated that fee rates could not be increased in FY2014, the
first year of the MAPFF.
The survey and interview responses from the institutions provided the additional
input that provided additional data to support my proposition. Respondents from the Case
2 institution indicated that the board of trustees and the college leadership wanted to hire
the additional people necessary to meet the demands that were being placed on them to
achieve better student success. The increase in student fees provided the needed revenue
to hire the additional people. Case Institution 3 also indicated that the institution had to
reduce student aid by $600,000 because of the perceptions of a lack of funding from the
state. Respondents from the Case 4 institution indicated that the MAPFF was an element
209
for the higher increases they pursued. Routine tuition and fee increases are normal but are
usually smaller as shown by the increases in 2013 above.
When the price of tuition and fees are increased, some students will find it
difficult to take the number of credits desired or any courses at all. It is as result of this
that decreased affordability, or the increased cost of attendance, will negatively impact
access.
The larger increase in student tuition and fees and additional student fees that
were implemented because of the perceptions and concerns of the senior administrators
about the MAPFF, indicate actions that, while not intentionally made to negatively
impact student access, ultimately did because they increased the cost of attendance,
making their institutions less affordable and less accessible to some students.
Support for proposition. The larger increases in student tuition and fees,
additional student fees, and the reduction of student aid support my proposition that
access would be negatively impacted because of the MAPFF. However, the actions
initiated by the institutions are not because of responding to their results on the formula,
but instead over concerns about it. Even the stronger performers, lower and low potential
Case 3 and 4 institutions, were still taking actions for the threat of MAPFF results.
Additionally, these responses are consistent with previous research. Previous studies
revealed that some institutions may not have the financial and human resources necessary
to initiate actions to increase college completions but did not address if there were
increases in the tuition and fee rates as a direct result of the performance funding results
(Dougherty & Reddy, 2011, 2013; Dougherty et al., 2013, 2014, 2016; Lahr, et al., 2014;
Latimer, 2001; Tandberg, et al., 2014; Wood, 2007).

210
Research Subquestion 3. How have changes in the Massachusetts state
appropriations with the MAPFF influenced institutional changes in college education
delivery or support for student success that then affected access? The survey and
interview responses from the Case 2 and 3 institutions indicate that some programs,
courses, and sections offered to students were reduced or eliminated and negatively
impacted their institutions (Table 13). Also, a reduction of student services was indicated
by the participants from the Case 3 and 4 institutions.
These actions indicate some correlation to the MAPFF. However, the qualitative
data do not support causation. Most responses did not connect the enrollment declines
each institution experienced since FY2014 to program or course eliminations or
reductions. Although these actions may indicate routine changes, they also indicate an
unintended, negative impact to access by reducing the courses and sections available to
students. The senior administrators at each of the case institutions indicated that these
actions were made as a cost-saving measure to make up for smaller increases in state
appropriations. Although additional state appropriations were received in each of the
three years under study, their perception of smaller increases was the final state
allocation, reflecting the stop-loss adjustment portion of the formula (stop-loss effect).
Only one respondent indicated the MAPFF negatively impacted their institutions with a
reduction in academic quality and rigor.
In the follow-up interviews, I probed more deeply into the changes that were
made that were influenced by the MAPFF. Like performance funding 2.0 (PF 2.0)
programs that allocate significant amount of funds through the formula (Dougherty &
Reddy, 2013), several of the interviewees indicated that they didn’t focus on the details of

211
the MAPFF because they felt there was not a lot of money tied to it. Although the
MAPFF allocated 100% of the total state appropriations, several of the interviewees
stated that their vice president of finance told them not to make strategic plans based on
the MAPFF results because the amount of money tied to the formula was small. Note, the
percentage of state appropriations allocated to each institution varies with the results of
the MAPFF’s base component, performance component, and stop-loss adjustment. The
flat $4,500,000 cost-of-operation subsidy is given to each institution regardless of size
and is allocated through the MAPFF. The increases that each of the case institutions did
receive would be good by any standard. As stated earlier, the Case 2, 3, and 4 institutions
received $3.7 million (23%), $3.3 million (29.8%), and $7.8 million (44.5%) more
respectively in state appropriations between FY2013 and FY2016.
While respondents discussed several changes, each stated definitively that none of
the changes instituted at their institutions were a direct result or were influenced by their
results on the MAPFF. Additionally, each of the participants stated that actions were not
initiated to intentionally restrict admissions, enrollment, or recruitment of students
(R.A.E.R.).
Support for proposition. The survey and interview data support a correlation
between the elimination and reduction of programs, courses, and sections offered and the
MAPFF, but it does not show that the MAPFF caused it. Data did not clearly show that
actions taken at the case institutions were an attempt to improve student success and
negatively impact access. Thus, the findings are not consistent with previous research that
found institutions restricting admissions, enrollment, and recruitment to improve student
success because of a performance funding formula and negatively impacting access

212
(Dougherty & Reddy, 2011, 2013; Dougherty et al., 2013, 2014, 2016; Lahr, et al., 2014;
Smith, 2015; Tandberg & Hillman, 2013). Alternative explanations were explored,
indicating that enrollment declines were a result of demographic changes, fewer high
school graduates, and an improving economy. The participants in the study consistently
stated that all three of these alternative explanations contributed to the enrollment
declines and not because of actions taken because of the MAPFF.
Research Subquestion 4. How does the senior management perceive the impact
of performance funding on student access to community colleges? Six of the 13
respondents on the survey indicated that the MAPFF did not negatively impact student
access and two weren’t sure. However, four of the survey respondents indicated that
access was negatively impacted because of increased student costs. During the
interviews, several of the senior administrators that originally responded that the MAPFF
did not negatively impact access, changed their perceptions, and acknowledged that
access was negatively impacted at their institutions.
Support for proposition. The emphasis of RQ 4 on perception turned out to be a
critical observation. It appears the perceptions driving administrator actions were
incentivized by the MAPFF, even though the data did not reflect the reality of the
MAPFF. The quantitative administrative and secondary data indicate that all four case
institutions received more state appropriations over the three years under study as
guaranteed by the stop-loss adjustment. The C1 institution received 12.54%, C2 received
15.97%, C3 received 18.48%, and C4 received 28.41% more in state appropriations in
FY2016 versus FY2013. The data obtained from the surveys and interviews indicate the
perceptions of the amount of state appropriations received after the stop-loss adjustment,

213
influenced the senior administrators to add to the tuition and fee increases at the case
institutions and negatively impacted access. Also, the interviews at all three case
institutions reveal the vice presidents of finance were relied upon to disseminate and
control the MAPFF information provided to others at the institutions, masking the
information and drawing conclusions before the administrators who control the
operations for student success were engaged. As a result, this gave the other senior
administrators permission not to understand the formula and defeated the incentive of the
MAPFF on improving student access and success. In a case study of Indiana’s
performance-based funding program, limited evidence was found that the effects of
performance funding could limit access for low-income and minority applicants
(Umbricht, et al., 2017). The findings are also consistent with previous research that
found institutions negatively impacted student access because of a performance funding
formula in the form of decreased affordability (Dougherty & Reddy, 2011, 2013;
Dougherty et.al, 2013, 2014, 2016; Lahr, et.al, 2014; Mitchel, Palacios, & Leachman,
2014; Bailey, Jaggars, & Jenkins, 2015).
Negative impact on access. Previous research on the impact of performance
funding has revealed that senior administrators at the institutions are the most
knowledgeable about performance funding and the formulas used (Dougherty 2011,
2013; Latimer, 2001; Wood, 2007). However, the previous research has not indicated
sole reliance on the vice presidents of finance or the performance funding officer
(Latimer, 2001) to control and disseminate the results to other senior leaders.
The MAPFF results report distributed by the MDHE, is a multi-tab spreadsheet
showing the detailed results of all the components making up the final state appropriation

214
amount for each of the 15 community colleges in Massachusetts. It is possible that the
MDHE did not adequately communicate the importance of reviewing the details within
the spreadsheet to be used as a tool to improve performance. I did not pursue this line of
questioning with the participants of my study. However, as a former vice president of
finance at a Massachusetts community college during FY2013–FY2016, no guidance was
provided by MDHE on how to use the MAPFF results report as a tool to improve
performance during my tenure. Much of the statewide conversations I was involved with
included the vice presidents of finance from each of the community colleges and
representatives from MDHE. These conversations were limited to the dissatisfaction with
the amount of the annual total state appropriation increases, with no substantive
discussions on the results of the components of the formula for strategic planning. The
predominant feedback from the vice presidents of finance was a dissatisfaction with the
amount of the annual increases of the total state appropriations, which got in the way of
discussing the goals of the MDHE reflected in the formula results. The MDHE
representatives rarely spoke about the goals and incentives of the MAPFF that can help
maximize state appropriations. Perhaps this was because the MDHE representatives at the
meetings were not familiar with MAPFF variables enough to have cogent conversations
with the vice presidents who more deeply understand the finances of the campuses.
The actions of the case institutions during the study period supported my
proposition of negatively impacting access. However, their actions were based on their
perceptions of a lack of funding coming from the MAPFF. The state appropriations were
increased in each year during the study, and each case institution received more
appropriations in each of those years. In reality, the increases they received are good by

215
any state standards. This perception that the state was not funding the formula enough
prevented more strategic decision-making to meet the goals outlined by the MDHE and
to maximize their state appropriations.
The negative impact of the Massachusetts performance funding program on
student access was consistent with previous research that found institutions negatively
impacted student access because of a performance funding formula in the form of
decreased affordability (Dougherty & Reddy, 2011, 2013; Dougherty et.al, 2013, 2014,
2016; Lahr, et.al, 2014; Mitchel, Palacios, & Leachman, 2014; Bailey, Jaggars, &
Jenkins, 2015).
However, contrary to my proposition, the case institutions in my study negatively
impacted affordability because of the amount of appropriations received after the stop-
loss adjustment, rather than instituting student success initiatives to improve their results
on the MAPFF and achieve the goals of the MDHE (performance effect). The stop-loss
adjustment portion of the MAPFF was included to prevent institutions from losing state
appropriations during the initial implementation of the formula. It also guaranteed that
each institution would receive 3.5% more state appropriations in FY2014 and FY2015,
and 2.5% more in FY2016. The MDHE intended to phase out the stop-loss altogether
after four years. The institutions scoring a higher performance share percentage in the
MAPFF saw the calculated value in the MAPFF dashboard, but did not receive the full
benefit. The stop-loss adjustment of the MAPFF reallocates appropriations from better
performing institutions to institutions where their state appropriations would not have
reached the minimum increase in any year. The MAPFF for Case 2, 3, and 4 institutions
all showed that they would have received more appropriations before the stop loss,

216
20.3%, 38.4%, and 60.9% respectively, but instead saw part of the appropriations
reallocated to other institutions, such as to Case 1 institution (Table 9).
Alternative explanations were explored for increasing student fees due to regular
inflationary increases, mandates from MDHE, to fund higher costs due to retirement
accruals and contractual wage increases. Although some of these reasons contributed to
part of the increases in tuition and fees, several senior administrators specifically stated
that a portion of the tuition increases were due to appropriations lost after the stop-loss
adjustment portion of the formula. One senior administrator attributed a negative impact
to access because of a reduction of institutional aid given to students to help control their
costs. I did not question the participants of the study if some of the tuition and fee
increases would have been instituted anyway without the MAPFF; however, I must
consider they probably would have.
As I prepared for study, I anticipated the stop-loss adjustment would diminish or
delay the incentive for the colleges to make changes at their institutions to improve
student outcomes and success. The survey and interview data revealed a misperception of
the function and application of the stop-loss adjustment, as well as the extent to which the
base and performance components were trivialized or overlooked by the vice presidents
of finance. This led the case institutions to ignore the detailed results of the formula and
supported the perception that not enough money was tied to the MAPFF after the final
state allocations. The qualitative data indicate that the stop-loss adjustment caused the
case institutions to increase the tuition and fees more than they would have without it.

217
Conclusion
My study sought to examine how the Massachusetts community colleges are
responding to the MAPFF, with a focus on answering the overarching research question
of how performance funding is influencing the open-access mission of community
colleges in the Commonwealth of Massachusetts. Through the collection and analysis of
quantitative administrative and secondary data, the quantitative and qualitative survey
data, and the qualitative one-on-one interview data, the six significant findings found
suggest that the MAPFF imposed by the Department of Higher Education (MDHE), and
in use in Massachusetts has unintentionally negatively impacted student access in the
form of decreased affordability and to a lesser extent, through restrictive admissions,
enrollment, and recruitment activities as the result of intentional actions taken, in part, to
the perception of inadequate funding and to replace lost appropriation increases lost due
to the MAPFF stop-loss adjustment.
In previous research conducted, the authors of these studies found that
performance funding formulas have led to unintended negative impact on the institutions
because of increased costs of compliance with the imposed goals of the formulas
(Dougherty & Reddy, 2011, 2013; Dougherty et.al, 2013, 2014, 2016; Lahr, et.al, 2014;
Tandberg, et al., 2014, Wood, 2007). These previous studies also found negative impacts
to access in the form of raising admission standards or by altering enrollment and
recruitment practices. By raising admission standards and altering recruitment practices,
the institutions in these studies attempted to maximize their state appropriations but
appeared not to attempt to maximize tuition and fee revenue because they restricted
admissions. The results from my study did not find actions taken to intentionally restrict

218
admissions, enrollment, and recruitment practices by the case institutions. In fact, the
findings from my study were that the senior administrators initiated intentional actions to
increase overall enrollment and student retention. However, by reducing programs,
courses, and sections, and by increasing tuition and fee rates, access appears to have been
negatively impacted through cost-saving measures in reaction to their perception of the
final state appropriations each fiscal year after the stop-loss adjustment portion of the
MAPFF.
The study examined data from four case institutions selected by using purposeful
sampling. Each of these case institutions was grouped into a potential to impact access
based on the quantitative administrative and documentary data. Based on this data, Case
1 and 2 institutions were grouped as high potential to negatively impact access. Case 3
institution was grouped as lower potential and Case 4 institution was grouped as low
potential. The findings from the study indicate that three of the four case institutions
negatively impacted access, Case 2 high potential institution, Case 3 lower potential, and
Case 4 institution low potential. The senior administrators from the Case 1 institution
chose not to participate in the qualitative portion of the study, and only one respondent
completed the survey.
While the findings support my proposition that access was impacted due to the
MAPFF, the impetus was from the perception of a lack of funding from the state instead
of actions implemented to improve student success. Previous research studies have
discovered similar results where there was inadequate state funding, although these
findings were from states with PF 1.0 programs that provide budgetary bonuses on top of
the regular appropriations (Dougherty & Reddy, 2011; 2013; Latimer, 2001;). The

219
performance funding program in Massachusetts is a PF 2.0 program in which the formula
is used to allocate the regular appropriations with a significant percentage of the
appropriations incentivized for improved performance results.
The data acquired from the surveys and interviews indicate that the case
institutions were not focused on or overlooked their performance results on the detailed
variables of the formula in making strategic decisions. The participants from the three
case institutions participating in the qualitative interview portion of the study all stated
that they instituted actions to increase total, overall enrollments. These responses partially
support profit maximization. However, the enrollment variable of the formula weights
STEM and trade enrollments more than liberal arts, business, and non-credit workforce
development programs, supporting the state’s higher educational goals. There was no
evidence found that their actions to increase enrollments considered these more heavily
weighted areas.
Each of the participants from the three institutions participating in the qualitative
portion of the study admitted that very little, if any, attention was paid to their
institutions’ detailed outcomes on the MAPFF. Instead, they focused primarily on the
amount of state appropriation they would be getting after the stop-loss adjustment. This
led to the most significant finding of my research study, which I termed the “stop-loss
effect.” The stop-loss adjustment portion of the MAPFF guaranteed each institution
would receive a minimum increase regardless of their individual performance on the
formula metrics. The senior administrators at case institutions C2, C3, and C4, focused
on the amount of the state appropriations they received after the application of the stop-
loss adjustment and trivialized or overlooked the performance share percentage leading to

220
the state appropriations before the stop-loss adjustment. By overlooking the performance
share, the senior administrators missed the opportunity to use the MAPFF results for
strategic planning and decision-making with an eye towards improving student success.
The Massachusetts Department of Higher Education (MDHE) scheduled to phase
out the stop-loss adjustment over the first four years of the MAPFF. Institutions scoring a
higher performance share percentage in the MAPFF (performance effect), saw the
calculated value in the MAPFF dashboard, but did not receive the full benefit. This
supports the survey responses indicating the limited positive impact of the MAPFF was
increased awareness of institutional results. The MAPFF dashboard, the first of many
tabs in the spreadsheet (Appendix A), shows the outcomes for all 15 community colleges.
The MAPFF reallocates appropriations from better performing institutions to institutions
where their state appropriations would not have reached the minimum increase in any
year.
The MDHE implemented the MAPFF in part to hold public institutions
accountable for student success and address several essential issues (MDHE, 2013). The
formula also addressed the issue of allocating funds in relation to aspects of institutional
performance that reflect state-wide education goals, including a premium for enrollments
in STEM-related programs and trade, and student success in these and all programs,
including premiums for students considered at risk. The third issue to be addressed by the
formula is to emphasize the role of community colleges in preparing students for jobs in
the state’s rapidly evolving economy. Finally, the formula was adopted to stop the growth
in student charges that are already among the highest in the nation.

221
The MAPFF fell short on incentivizing the institutions to focus on statewide goals
of preparing students for jobs in the state’s rapidly evolving economy because the case
institutions focused on growing enrollment in all programs instead of focusing enrollment
efforts in the programs weighted higher in the MAPFF. The case institutions indicated
they were focusing enrollment efforts on all programs to grow tuition and fee revenue,
partially supporting the revenue maximization theory discussed earlier. While they were
trying to maximize tuition and fee revenue, there were no indications to maximize state
appropriations. However, these actions do not directly address the intended goal of the
state to grow enrollments in STEM- and workforce-related programs and trades.
The incentive to focus on statewide goals imbedded within the MAPFF variable
components was overlooked by the senior administrators as a result of the stop-loss
effect. Had the stop-loss adjustment just guaranteed that no institution would lose
appropriations (hold harmless), rather than adding a minimum increase, the incentive
might have been preserved. However, Case 2, 3, and 4 institutions had their state
appropriation increases reduced through the reallocation to other institutions in the sector
to bring them up to the minimum increase percentage detracting from the value of
performance share increases. This contributed to the perception the state allocated too
few dollars to warrant a detailed review of the MAPFF results.
Not only did the MAPFF not curtail the institutions from raising the student
tuition and fee costs, but it also contributed to the size of the increases. Case 1 and 2
institutions increased the tuition and fee rates 11.41% and 16.52% respectively over the
study period, FY2014–FY2016 (Table 9). Although the tuition and fee increases at Case
3 institution averaged 6.27% and 5.67% at Case 4 institution over the first three years of
222
the MAPFF, the president and vice president of finance at Case 4 institution
acknowledged the impact of the stop loss influenced the size of their increases in tuition
and fees. The community college sector average tuition and fee increase was 8.2% over
this period.
In my higher education professional career of 18 years, I’ve worked at two public
community colleges in two different state systems and a private, four-year institution in a
third state. In that time, I’ve come to understand that increasing student costs impacts
some students’ ability to attend college. Some students are financially able to absorb
tuition and fee increases more easily than others. However, lower income and some
minority students will have a difficult time paying for higher tuition and fee costs because
federal and state aid has not kept up with the amount of the institutional increases. The
impact of performance funding formulas on low income and minority students was not a
focus of my study.
Colleges and states are reluctant to raise tuition because it conflicts with the open-
access mission (Bailey & Morest, 2006). However, the financial statement audits
revealed that tuition and fee revenue for the community colleges in Massachusetts
account for a significant and growing percentage of their operating revenues. State
appropriations account for a diminishing percentage of about 35–50% of the total
operating revenues for the community colleges. As previously described, the tuition
portion of the total tuition and fee rates for community colleges, was set by the MDHE.
The MDHE and the presidents of the community colleges agreed not to increase student
fees as a condition of getting the $20 million increase in appropriations in the first year of
the MAPFF. However, there was no similar agreement in the two ensuing years. The

223
annual cost to attend a community college in Massachusetts is among the highest in the
nation. During the 2015–2016 academic year, the total cost to attend a community
college in Massachusetts was in excess of $5,500 (MDHE, 2016). The MDHE was
concerned that it would negatively impact access for some students. That being said,
there was a disconnection found between the impact of raising the cost of attendance for
students versus the perception from the vice presidents of finance at Case 2, 3, and 4
institutions from their survey and interview responses that the MAPFF did not negatively
impact access. This is problematic since the other senior administrators at these
institutions indicated they rely on the vice presidents of finance to analyze and
communicate the results of the MAPFF on their budgets. Only after the interviews did the
vice presidents of finance acknowledge that a portion of their tuition and fee increases
were influenced by the MAPFF and negatively impacted access; however, not because of
actions taken to improve their performance scores on the MAPFF, rather, in response to
the perception of the final State allocation, including [reflecting] the stop-loss adjustment
portion of the formula (stop-loss effect).
Positive impact of the MAPFF. I focused on the impact the MAPFF had on the
open-access mission. In the collection of survey and interview data, I requested responses
and perspectives on positive impacts the formula may have had on the institutions (Table
14). The largest response from the participants was that the MAPFF forced the
institutions to increase their awareness of institutional performance. This perception is
supported by the MAPFF dashboard portion of the spreadsheet. The summary outcomes
of all 15 colleges, both before and after the stop loss, are displayed together. However,

224
the MAPFF spreadsheet has each of the detailed, supporting calculations for all the
components in separate tabs, revealing how each institution’s performance was derived.
Many participants felt that the formula had no positive impact on their
institutions. Only two of the participants felt that the MAPFF positively impacted their
institution by improving student success and completion and improved student services
and instruction.
Observation. Finally, one of the key goals of creating and implementing the
MAPFF was to hold institutions receiving public funding accountable for student success
(MDHE, 2013). The analysis of the quantitative administrative and secondary data, the
quantitative and qualitative survey data, and the qualitative interview data revealed to me
that the implementation of the MAPFF had the appearance of meeting one of the
MDHE’s key goals of holding the community colleges in Massachusetts, that receive
public money in the form of annual state appropriations, accountable for student success
results. However, I believe it failed to meet this goal. There are several reasons for this
observation.
First, the stop-loss adjustment guaranteed each institution would receive more
appropriations in each of the first three years of the MAPFF regardless of how well they
performed as measured by the formula. The senior administrators from the case
institutions stated they felt the MDHE didn’t place emphasis on the outcomes achieved
on the MAPFF. Poor performance on the MAPFF was rewarded with increases in each of
the three years of the study.
Second, the consistent perception of the senior administrators was that not enough
money was added to the MAPFF to incentivize the institutional leadership to strategically

225
use their outcomes to improve student success. Each of the case institutions was grouped
into a potential to impact access based on the quantitative administrative and
documentary data. The expectation was that both the high potential case institutions, C1
and C2, would have taken actions negatively impacting access through decreased
affordability or restricted admissions, enrollment or recruitment. The expectation was that
the lower and low potential case institutions, C3 and C4, would have less incentive and
would have less or no negative impact on access. Although the MAPFF allocated
additional funds in each of the first three years of the formula to each of the community
colleges in Massachusetts, including the four case institutions, the perception of the
senior administrators was the additional funds were not significant enough for strategic
use. The senior administrators stated they did not review their detailed outcomes on the
MAPFF and focused on the final amount received. Thus, while changes were at times
relational or proportional, the “perceptions” factor worked strongly at all cases,
minimizing the anticipated differences.
Limitations
There are five main limitations to my study. First, my study was restricted to a
single state, which limited the scope of the research. The study only focused on the
Massachusetts Performance Funding Formula, first implemented in FY2014, and its
impact on four community colleges in the commonwealth through FY2016.
This multi-case study was conducted on four out of 15 community colleges in
Massachusetts. To mitigate this limitation, I selected the institutions using a purposeful
sampling method by looking at several variables that could indicate a high potential and

226
lower potential of actions taken to negatively impact access and find literal replication
among the high potential and low potential cases.
Second, only one participant from the Case 1 institution completed the survey,
and no one participated in the interview portion of the study after giving me IRB
approval. The Case 1 institution’s unwillingness to participate is unfortunate because the
quantitative administrative and secondary data displayed a high potential for the leaders
of the institution to have taken actions that would have negatively impacted access.
However, without the data from the survey and the one-on-one interviews, I did not
obtain the perceptions of the senior administrators on the impact of the MAPFF on their
institution and on the students. Although the data from the remaining three participating
case institutions support the findings and helped answer the research questions, the
number of institutions represented a relatively small percentage of the total population.
Third, a relatively small number of senior administrators ultimately participated in
the survey. Twenty-eight senior administrative leaders were invited to complete the
survey, and after several months of reminders, only 13, or almost 50%, completed the
survey. Thus, my interpretations are influenced by a small number of community college
administrators. Even though only a relatively small number of senior administrators
participated in my study, the significant findings enumerated earlier were found in Case
2, 3, and 4 institutions.
The fourth limitation is the scope of my study was to determine how the MAPFF
impacted student access and did not attempt to determine how the MAPFF impacted
student success and degree completion. There were no attempts to mitigate this
limitation, although no findings or conclusions are presented on this topic.

227
Finally, no attempt was made to investigate the perceptions of the senior
administrators that not enough funding was allocated by the MAPFF. The MAPFF
allocated 100% of the state appropriations for the community colleges through the
formula and increased the total appropriations each year during the study period. The
perceptions of the senior administrators’ actions were incentivized although the data did
not reflect the reality of MAPFF. Future research should focus more on perceptions of the
senior administrators.
Recommendations for Future Research
Future research on performance funding should include studying the perception of
how other Massachusetts accountability programs, such as the Vision Project, competes
for the perception and attention given to the MAPFF at the publicly funded institutions in
Massachusetts. Several of the participants from the case institutions in my study
perceived that the Department of Higher Education focused more on the institutions’
performance in the attainment of goals as defined by the Vision Project rather than the
results of the MAPFF. It appeared that the other senior administrators feared the formula
and gave them permission not to fully analyze and understand the results. The mindset of
the vice presidents of finance of the case institutions was the perception the MAPFF was
not an important measure that warranted a detailed review because they interpreted the
MAPFF as allocating too few dollars to the institutions. The reality was the performance
funding formula in Massachusetts allocated 100% of the total appropriations for the
community colleges and shared many of the same goals of the Vision Project. The state
appropriation increases were $20 million in FY2014, $13.1 million in FY2015, and $9.1

228
million in FY2016. These increases are not insignificant. Additionally, the institutions
received more appropriations each of these years.
Another area to consider for a future study would be to research if community
colleges have become numb to changes in funding because they’ve had to do more with
less for so long. The additional state appropriations added to the formula in each of the
three years studied were more than had been allocated in several years prior.
I examined the interpretations and perceptions of the senior administrators of
community colleges in the commonwealth. Further research is needed to examine how
the Department of Higher Education and the legislative leaders of the commonwealth
evaluate the results of the MAPFF on the stated goals in the creation of the formula,
which were institutional accountability and slowing down the growing costs of higher
education.
The most significant finding of my study is the negative impact on access
primarily because of the stop-loss adjustment portion of the MAPFF on institutional
allocations. The impact of the stop-loss adjustment, termed the stop-loss effect, altered
the perception of the senior administrators and decreased the effectiveness of the formula.
In several studies on performance funding, a number of the respondents indicated that the
performance funding program had “little or no impact on their colleges budget” in part
because of a hold-harmless provision in their first few years (Dougherty, Jones, Lahr,
Natow, Pheatt, and Reddy, 2016, pg. 154). Ohio institutions used a hold-harmless
provision in their performance funding program that limited how much funding colleges
could lose from one year to the next in the first few years of the formula (Dougherty,
Jones, Lahr, Natow, Pheatt, Vikash, 2014). In South Carolina, the performance funding
229
formula provided a hold harmless period preventing any institution from losing funding
until the formula’s full implementation took effect (Dougherty, et al., 2011). The results
of my study support these findings. Research on the stop-loss or hold harmless provisions
of performance funding programs should be conducted to determine their impact and
effectiveness.
Recommendations for Policy and Practice
The lessons learned from my study can be valuable for future revisions to the
current funding formula, development of performance funding programs in other states,
and college leadership enrichment. College leaders need to distinguish between
perception and fact. The senior administrators interviewed in the study described their
perceptions of the outcomes of the MAPFF without fully understanding and verifying the
facts. The other senior leaders relied upon the vice president of finance to interpret and
communicate the results of the formula rather than reviewing and understanding the
results themselves. Consequently, the effectiveness of the MAPFF was diminished and
the senior leaders missed the opportunity to fully understand the MAPFF results and use
them to update their assumptions and make better, more informed decisions.
Compounding this, they held on to their perceptions that state appropriation increases
were too little in spite of the significant increases the colleges actually received, i.e.,
updating their perception based on evolving facts.
Staying within the boundaries of what I’ve learned from my study, the insights
gained from the people directly responsible at the institutions to implement and direct
change, and from what I’ve learned from the research done in the preparation for my
230
study, I submit the following recommendations for both the institutions subject to a
performance funding formula and the implementing body.
Recommendation 1: Minimize losses with a hold harmless provision. As
stated in (Umbricht, et al., 2017), a performance funding formula isn’t merely about
holding institutions accountable for the use of public money or increasing the number of
graduates; “it is also about increasing access to higher education and creating a more
skilled workforce” (p. 667). The goals of the Vision Project and the MAPFF as a
component of it, included maintaining access and creating a more skilled workforce for
the commonwealth (MDHE, 2011). However, the impact of the stop-loss adjustment
appeared to divert the attention of the senior administrators away from the enrollment and
performance results of the formula and reinforced the perception that not enough money
was allocated by the formula to make a difference. Therefore, it is advisable for policy-
makers who are interested in implementing or modifying performance funding programs
with a hold-harmless provision or stop-loss adjustment to minimize the appropriation loss
rather than provide a guaranteed increase. Plan ahead and phase out the hold-harmless
feature after three or four fiscal years to provide time for institutional adjustment to the
formula.
Recommendation 2: Review formula results. The findings in my study indicate
a fear on the part of the senior leaders at the institutions to review and understand the
details of the formula. During the one-on-one interviews, the senior leaders at the case
institutions expressed their perceptions about the formula and its impact on the
institutions and students without analyzing the full details available to them. The detailed
data provided within the MAPFF spreadsheet, displays the results from the base share,

231
performance share, and the alignment variables for each institution. Additionally, the vice
presidents of finance were relied upon to review, interpret, and communicate the results
to the other senior administrators. Review and analysis of the formula’s detailed results
by all the senior administrators at an institution would provide an opportunity to gauge
the institution’s performance in each of the variables in the formula and use the data to
enhance decision making. Although it is the primary responsibility of the vice president
of finance to understand the amount of state appropriations an institution will be
receiving from the funding formula, the review and analysis of the enrollment, retention,
student access, and success results provided in the formula, are essential for all of the
senior administrators to review and understand. Becoming familiar with the detailed
results of the performance funding formula variables and components will improve
strategic decision making that respond to the goals of the formula, improve revenue, and
better manage the expenses of the institution. Therefore, it is advisable for the president
and the academic and student vice presidents at the institutions, and other senior leaders
responsible for student success subject to a performance funding formula, review and
understand the results of all formula components and use in strategic planning.
Recommendation 3: Provide instructions. The MDHE communicated the
progress made by the community colleges on the goals of the Vision Project to the public
each year through the publication of glossy color brochures. I thought these publications
were put together well and effectively communicated the progress of the Vision Project.
What I didn’t see was communication and instruction on how the institutions should
review and interpret the variables in the MAPFF and use their results to improve student
success and achieve the goals of the commonwealth. As a new senior administrator in a

232
community college in Massachusetts at the start of the first year of the MAPFF, receiving
detailed instruction on the review and use of the MAPFF would have been beneficiary
not only to me, but also to the other senior leaders at my institution. Therefore, it is
advisable for the MDHE, and policy makers in other states, provide instructional sessions
annually on how to use the results of the performance funding formula effectively to
improve student success and achieve the goals of the policy makers.
Recommendation 4: Require annual reports. The MDHE and policy makers in
other states should emphasize the importance of the performance funding formula and
require the institutions prepare and submit annual reports to their individual boards of
trustees on how the results of the formula were used to plan and implement change
connected to the stated goals and objectives of the performance funding program. Hence,
the college leadership will become more aware of the facts and lead to more informed
and improved decision making.
Recommendation 5: Adjust for student affordability. The quantitative data
collected and analyzed on all 15 community colleges in Massachusetts revealed tuition
and fee increases in the second and third year of the three year study period (FY2014 –
FY2016). To help minimize the impact on student affordability, the MDHE and policy
makers in other states should include a variable within the formula that adjusts the final
allocation amount when the tuition and fee rates are increased or decreased beyond a
predetermined range.
Recommendation 6: Recognize regional demographic variations. The
president of the case 3 institution pointed out that the enrollment variable in the MAPFF
does not account for regional workforce and demographic variations of the community

233
colleges service areas. Although there were institutional representatives from all of the
community colleges on the task force that originally developed the variables in the
MAPFF, the regional workforce needs, and demographic variations of the individual
institutional service areas were not incorporated into the component variables of the
formula. Short of incorporating a variable or some adjustment into the funding formula to
recognize these regional differences, the senior leadership at the institutions should
develop strategies and figure out how to use the formula’s components to their advantage.
Recommendation 7: Highlight and summarize each formula component in
final allocation. The MAPFF is a multi-tab spreadsheet that contains the detailed
calculations for each of the formula components for all 15 community colleges. The first
tab of the spreadsheet summarizing the final state allocations for each institution is called
the “Dashboard.” However, the detailed calculations supporting the final amounts on the
dashboard for all 15 community colleges are contained in the other tabs within the
MAPFF spreadsheet and could be difficult to decipher and understand for non-financial
managers. Two of the three components of the MAPFF, base share and performance
share, have multiple variables and calculations that culminate into the amounts
summarized on the dashboard. I recommend that the detailed tabs be summarized and
highlighted to simplify and facilitate review and analysis by the institution and the board
of trustees. By doing so, the results can be more easily seen which can help reduce the
fear of reviewing and trying to understand the formula results.
Recommendation 8: Fund adequately and consistently. The state appropriation
increases were $20 million in FY2014, $13.1 million in FY2015, and $9.1 million in
FY2016. The amounts of these increases are considered good by any standard. However,

234
the amount of the increases for each year were not known from the onset and
implementation of the MAPFF. The FY2014 increase of $13.1 million and the FY2015
increase of $9.1 million were not known until the state budgets were finalized for each of
the fiscal years. During my tenure at a community college in Massachusetts, the state
budgets were not finalized before the college presented budgets to the board of trustees
for approval.
The diminished state appropriation increases over the three years of the study
signify a trend that can alter the value and importance placed on the performance funding
program by the senior leaders at the colleges. I recommend that state consistently fund
the formula and provide more consistent and predictable funding over a long enough
period, to be an effective incentive for the institutions to strive for.
Recommendations for Leadership
The president and senior leaders must be as familiar with all of the sources of
income in the budget as they are with the expenses. The state appropriations are a
significant percentage of the income side of the budget second only to tuition and fee
revenue. As the Vice President of Finance, a great deal of calculations and projections
were conducted, data shared with the president and senior leaders, and decisions made on
the tuition and fee revenue as part of the annual budget process. A similar level of review
and analysis of the formula’s detailed results would provide an opportunity to gauge the
institution’s performance in each of the variables in the formula and use the data to
enhance income projections and strategic decision making.
The president as the CEO of the institution should lead the senior leaders through
the performance funding formula results and build stronger connections between the

235
strategic plans and budgeting. Perhaps higher education leadership and degree programs
should include critical examination of the income sources and performance funding
formulas as part of managing an institutional operating budget.
As a senior leader in a community college in Massachusetts during the
implementation of the MAPFF and working on this research project, I became very
familiar with details of the MAPFF and the results for my institution. I attempted to point
out the details of the MAPFF to my colleagues at my institution and at the other
institutions and found little interest in discussing it. I was mindful not to influence how
the study unfolded or bias the results in any way. If I was still working in a community
college in Massachusetts, or at another public college subject to a performance funding
formula, I would use the results of this study to educate the senior leaders how to use the
results to drive strategic decisions.

236
References
Albright, B. N. (2009). Tip sheet: Higher education performance funding 2.0 (Making
Opportunity Affordable Initiative). Indianapolis, IN: Lumina Foundation.
American Association of Community Colleges. (2012). Reclaiming the American Dream:
A Report from the 21St-Century Commission on the Future of Community
Colleges.
American Association of Community Colleges (AACC). (2019). 2019 Fast Facts.
Retrieved from https://www.aacc.nche.edu/wp-
content/uploads/2019/05/AACC2019FactSheet_rev.pdf
Argyris, C., & Schon, D. A. (1974). Theory in practice: Increasing professional
effectiveness. Jossey-Bass.
Bailey, T. R., Jenkins, D., & Jaggars, S. S. (2015). Redesigning America's Community
Colleges. Cambridge, MA: Harvard University Press.
Bailey, T., & Morest, V. S. (2006). The community college equity agenda in the twenty-
first century: Moving from access to achievement. Defending the community
college equity agenda, 246–270.
Baum, S., Ma, J., Bell, D. W., & Elliott, D. C. (2014). Trends in College Pricing, 2014.
Trends in Higher Education Series. College Board.
Belfield, C., & Jenkins, D. (2014). Community college economics for policymakers: The
one big fact and the one big myth. Community College Research Center Working
Paper, 67.
Boggs, G. R. (2004). Community colleges in a perfect storm. Change: The Magazine of
Higher Learning, 36(6), 6–11.
Boggs, G. R. (2011). Community colleges in the spotlight and under the microscope. New
Directions for Community Colleges, 2011(156), 3–22.
Bragg, D.D. & Durham, B. (2012). Perspectives on access and equity in the era of
(community) college completion. Community College Review, 40(2) 106–125.
Burke, J. C. (Ed.) (2002). Funding public colleges and universities: Popularity,
problems, and prospects. Albany, NY: SUNY Press.
Burke, J. C., & Modarresi, S. (2001). Performance funding programs: Assessing their
stability. Research in Higher Education, 42(1), 51–70.

237
Burke, J. C., & Serban, A. (1998). State synopses of performance funding programs. New
Directions for Institutional Research, spring (97), 25–48.
Burns, K. A. (2005). “A man on a mission: Foster Furcolo and the creation of the
Massachusetts community college system,” Ph.D. dissertation, Graduate College
of Education, University of Massachusetts, Boston, MA, 2005.
Carnevale, A. P., Smith, N., & Strohl, J. (2013). Recovery: Job growth and education
requirements through 2020.
Cervantes, A., Creusere, M., McMillion, R., McQueen, C., Short, M., Steiner, M., &
Webster, J. (2005). Opening the Doors to Higher Education: Perspectives on the
Higher Education Act 40 Years Later. TG (Texas Guaranteed Student Loan
Corporation).
Cohen, A. M., & Brawer, F.B. (2008). The American community college. San Francisco,
CA: Jossey-Bass.
Creswell, J. W. (2014). Research design: Qualitative, quantitative, and mixed methods
approaches. Thousand Oaks, CA: Sage Publications.
Dougherty, K. J. (2001). The contradictory college: The conflicting origins, impacts, and
futures of the community college. Albany: State University of New York Press.
Dougherty, K. J., Jones, S. M., Lahr, H., Natow, R. S., Pheatt, L., Reddy, V. (2014).
Envisioning performance funding impacts: The espoused theories of action for
state higher education performance funding in three states.
Dougherty, K. J., Jones, S. M., Lahr, H., Natow, R. S., Pheatt, L., & Reddy, V. (2016).
Looking inside the black box of performance funding for higher education: Policy
instruments, organizational obstacles, and intended and unintended impacts. RSF:
The Russell Sage Foundation Journal of the Social Sciences, 2(1), 147–173.
doi:http://dx.doi.org/10.7758/RSF.2016.2.1.07
Dougherty, K. J., Natow, R. S., Bork, R. H., Jones, S. M., & Vega, B. E. (2013).
Accounting for higher education accountability: Political origins of state
performance funding for higher education. Teachers College Record, 115(1), n1.
Dougherty, K. J., Natow, R.S., Hare, R. J., Jones, S. M., & Vega, B. E. (2011) The
politics of performance funding in eight states: Origins, demise, and change.
Report to the Lumina Foundation for Education. Community College Research
Center, Columbia University.
Dougherty, K. J., Natow, R. S., & Vega, B. E. (2012). Popular but unstable: Explaining
why state performance funding systems in the United States often do not persist.
Teachers College Record, 114(3), n3.
238
Dougherty, K. J., & Natow, R. S. (2010). Continuity and change in long-lasting state
performance funding systems for higher education: The cases of Tennessee and
Florida. CCRC Working Paper No. 18.
Dougherty, K. J., & Reddy, V. (2011). The Impacts of State Performance Funding
Systems on Higher Education Institutions: Research Literature Review and Policy
Recommendations. CCRC Working Paper No. 37. Community College Research
Center, Columbia University.
Dougherty, K. J., & Reddy, V. (2013). Performance funding for higher education: What
are the mechanisms. What are the impacts?
Dowd, A. C., & Shieh, L. T. (2013). Community college financing: Equity, efficiency,
and accountability. The NEA Almanac of Higher Education, 37-65.
Fink, A. (2015). How to conduct surveys: A step-by-step guide. Sage Publications.
Friedel, J. N., Thornton, Z. M., D’Amico, M. M., & Katsinas, S. G. (2013). Performance-
based funding: The national landscape. U. o. AEP Center (Ed.), 20.
Goldrick-Rab, S. (2010). Challenges and opportunities for improving community college
student success. Review of Educational Research, 80(3), 437–469.
Harnisch, T. L. (2011). Performance-based funding: A re-emerging strategy in public
higher education financing. Washington, DC: American Association of State
Colleges and Universities, 1–12.
Hillman, N. (2016). Why performance-based college funding doesn’t work. The Century
Foundation, 8.
Hillman, N. W., Tandberg, D. A., & Fryar, A. H. (2015). Evaluating the impacts of
“new” performance funding in higher education. Educational Evaluation and
Policy Analysis, 37(4), 501–519.
Hillman, N. W., Tandberg, D. A., & Gross, J. P. (2014). Performance funding in higher
education: Do financial incentives impact college completions? The Journal of
Higher Education, 85(6), 826–857.
Horn, L., & Radwin, D. (2012). The Completion Arch: Measuring Community College
Student Success—2012. College Board Advocacy & Policy Center.
Hutcheson, P. A. (2007). The Truman Commission’s vision of the future. Thought &
Action, 107.
Jones, D. (2012). Performance Funding: From Idea to Action. THINK THIS. Complete
College America.

239
Jones, D. (2013). Outcomes-Based Funding: The Wave of Implementation. Complete
College America.
Jones, D., & Kelly, P. (2007). The emerging policy triangle: Economic development,
workforce development, and education. Boulder, CO: National Center for Higher
Education Management Systems and Western Interstate Commission for Higher
Education.
Kelderman, E. (2019). The rise of performance based funding: How colleges are adapting
in the new age of accountability. The Chronicle of Higher Education,
Washington, DC: The Chronicle of Higher Education.
Kerrigan, M. R. “Data-driven decision making in community colleges: New technical
requirements for institutional organizations,” EdD diss., Columbia University,
Teachers College, New York, 2010.
Koos, L. V. (1947). Rise of the People's College. The School Review, 55(3), 138–149.
Krathwohl, D. R., & Smith, N. L. (2005). How to prepare a dissertation proposal:
Suggestions for students in education and the social and behavioral sciences.
Syracuse: Syracuse University Press.
Lahr, H., Pheatt, L., Dougherty, K. J., Jones, S., Natow, R. S., and Reddy, V. (2014).
Unintended impacts of performance funding on community colleges and
universities in three states. New York, NY: Columbia University, Teachers
College, Community College Research Center.
Latimer, D. A. “A case study of the twenty-year history of performance funding at the
University of Memphis,” Ph.D. dissertation, University of Tennessee, Knoxville,
2001.
Lenhardt, S. W., “Community college reform: Funding formula task force report,” 2013.
Retrieved from
http://www.mass.edu/system/aboutsystem.asphttp://www.mass.edu/system/abouts
ystem.asp
Levin, J. S. (2001). Globalizing the community college: Strategies for change in the
twenty-first century. Springer.
Levin, J. S. (2005). The business culture of the community college: Students as
consumers; students as commodities. New Directions for Higher Education,
2005(129), 11–26.
Lively, K. (1992). Campus accountability is hot again. The Chronicle of Higher
Education, 11(6).

240
Malone, M. (2014). Report to the general court of Massachusetts. Higher Education
Finance Commission. Retrieved from
http://www.mass.edu/hefc/HigherEducationFinanceCommission-FinalReport10-
2014.pdfhttp://www.mass.edu/hefc/HigherEducationFinanceCommission-
FinalReport10-2014.pdf
Marginson, S. (2011). Higher education and public good. Higher Education Quarterly,
65(4), 411;433;-433. doi:10.1111/j.1468-2273.2011.00496.x
Massachusetts Department of Higher Education (MDHE). (2010). The vision project: A
public agenda for higher education in Massachusetts. A proposal to the
Massachusetts Board of Higher Education. Retrieved from
http://www.mass.edu/bhe/lib/documents/BHE/BHE10-06VisionProject.pdf
Massachusetts Department of Higher Education (MDHE). (2011). Vision project
preview: Graduation and student success rates. Boston, MA.
Massachusetts Department of Higher Education (MDHE). (2013). Within our sights: The
vision project. Boston, MA.
Massachusetts Department of Higher Education (MDHE). (2015). About the public
higher education system. Retrieved from
http://www.mass.edu/system/aboutsystem.asphttp://www.mass.edu/system/abouts
ystem.asp
Massachusetts Department of Higher Education (MDHE). (2016). The degree gap:
Honing in on college access, affordability and completion in Massachusetts.
Boston, MA.
Matthews, D. (2013). A Stronger Nation through Higher Education: Visualizing Data to
Help Us Achieve a Big Goal for College Attainment. Lumina Foundation for
Education.
Maxwell, J.A. (2013). Qualitative research design: An interactive approach (Third ed).
Thousand Oaks, CA: Sage Publications.
McKeown-Moak, M. P. (2013). The “new” performance funding in higher education.
Educational Considerations, 40(2), 3.
McLendon, M. K., & Hearn, J. C. (2013). The resurgent interest in performance-based
funding for higher education. Academe, 99(6), 25–30.
McPhail, C. J. (2011). The Completion Agenda: A Call to Action. Summary Report from
the November 10-11, 2010, Meeting of the American Association of Community
Colleges Commissions and Board of Directors. American Association of
Community Colleges (NJ1).

241
Mishory, J. (2019). Expanding “Free College”: How to build a job training guarantee.
The Century Foundation. Retrieved from https://tcf.org/content/report/expanding-
free-college-build-job-training-guarantee/
Mitchel, M., Palacios, V., & Leachman, M., (2014). States are still funding higher
education below pre-recession levels. Center on Budget and Policy Priorities
(May 2014), Washington, D.C.
Moscovitch, E., “Massachusetts community colleges: A smart investment,” Cape Ann
Economics, Boston, MA, 2002.
Mullin, C. M. (2012). Why access matters: The community college student body. Policy
Brief.
Munoz, C. (2014). New commitments to improve college opportunity. Retrieved from
http://www.whitehouse.gov/blog/2014/08/13/new-commitments-improve-college-
opportunityhttp://www.whitehouse.gov/blog/2014/08/13/new-commitments-
improve-college-opportunity
National Conference of State Legislators (2016). Performance based funding for higher
education, Washington, DC: Retrieved from
http://www.ncsl.org/research/education/performance-funding.aspx
Nelson, S. & Keller, J. (2012). Massachusetts Department of Higher Education:
Community College Performance-Based Funding Model [PowerPoint slides].
Retrieved from https://www.mass.edu/searchresults.asp?
New Jersey’s Community Colleges Facts at a Glance (2014). Retrieved from:
http://www.njccc.org/wp-content/uploads/2013/03/Facts-at-a-Glance-
2014.pdfhttp://www.njccc.org/wp-content/uploads/2013/03/Facts-at-a-Glance-
2014.pdf
Obama, B. (2013). State of the Union Address. (2013). The American Presidency Project,
February 12.
O’Connor & Drew P.C. (2012) Cape Cod Community College: financial statements and
management discussion and analysis. Retrieved from
https://www.capecod.edu/files/public-information/6-30-2012-financial-
statements.pdf
O’Connor & Drew P.C. (2013) Cape Cod Community College: financial statements and
management discussion and analysis. Retrieved from
https://www.capecod.edu/files/public-information/6-30-2013-financial-
statements.pdf

242
O’Connor & Drew P.C. (2014) Cape Cod Community College: financial statements and
management discussion and analysis. Retrieved from
https://www.capecod.edu/files/public-information/6-30-2014-financial-
statements.pdf
O’Connor & Drew P.C. (2015) Cape Cod Community College: financial statements and
management discussion and analysis. Retrieved from
https://www.capecod.edu/files/public-information/6-30-2015-financial-
statements.pdf
Oliver, C. (1995). The Community College Open-Door Philosophy: What Negative
Outcomes Have Developed? Retrieved from
http://search.ebscohost.com.ezproxy.rowan.edu/login.aspx?direct=true&db=eric&
AN=ED388345&site=ehost-live
Optimization (n.d.). In BusinessDictionary.com. Retrieved from BusinessDictionary.com
website: http://www.businessdictionary.com/definition/optimization.html
Phelan, D. J. (2014). The clear and present funding crisis in community colleges. New
Directions for Community Colleges, 2014(168), 5-16. doi:10.1002/cc.20116
Quintero, J. (2012). Making performance funding work for all. Policy brief. Retrieved
from http://www.workingpoorfamilies.org/wp-
content/uploads/2012/05/policybrief-spring2012.pdf.
Revenue Maximization. (2013). In Routledge Dictionary of economics. London, United
Kingdom: Routledge. Retrieved from
http://ezproxy.rowan.edu/login?url=http://search.credoreference.com/content/entr
y/routsobk/revenue_maximization/0
Rubin, H. J., & Rubin, I. S. (2005). Qualitative interviewing: The art of hearing data
(2nd ed.). Thousand Oaks, CA: Sage Publications.
Rutherford, A., & Rabovsky, T. (2014). Evaluating impacts of performance funding
policies on student outcomes in higher education. The ANNALS of the American
Academy of Political and Social Science, 655(1), 185–208.
Saldana, J. (2009). The coding manual for qualitative researchers. Thousand Oaks, CA:
Sage Publications.
Saul, J. R., & Newell, W. R. (1997, 06). The unconscious civilization. Toronto: Canadian
Review of Books Ltd.
Seidman, I. (2006). Interviewing as qualitative research: A guide for researchers in
education and the social sciences (3rd ed.). New York: Teachers College Press.

243
Shannon, H. D., & Smith, R. C. (2006). A case for the community college's open access
mission. New directions for community colleges, 2006(136), 15–21.
Shin, J. C. (2010). Impacts of performance-based accountability on institutional
performance in the U.S. Higher Education, 60(1), 47–68.
Smith, C. P., “Impact of intended and unintended outcomes of performance-based
funding on community colleges,” Ph.D. dissertation, University of Maryland and
University College, MD, 2015.
Spellings, M. (2006). A test of leadership: Charting the future of US higher education.
Washington, DC: U.S. Department of Education.
Sugar, T. (2010). Boosting college completion at community colleges: Time, choice,
structure and the significant role of states. The White House Summit on
Community Colleges, 30.
Tandberg, D., & Hillman, N. (2013). State performance funding for higher education:
Silver bullet or red herring. WISCAPE Policy Brief, 18.
Tandberg, D. A., Hillman, N., & Barakat, M. (2014). State higher education performance
funding for community colleges: Diverse effects and policy implications.
Teachers College Record, 116(12), 1.
Teddlie, C. & Tashakkori, A. (2009). Foundations of mixed methods research:
Integrating quantitative and qualitative approaches in the social and behavioral
sciences. Thousand Oaks, CA: Sage Publications.
Total Revenue. (2013). In Routledge Dictionary of economics. London, United Kingdom:
Routledge. Retrieved from
http://ezproxy.rowan.edu/login?url=http://search.credoreference.com/content/entr
y/routsobk/total_revenue/0
Townsend, B. K. & Dougherty, K. J. (2006). Community college missions in the 21st
century. New directions for community colleges. San Francisco, CA: Jossey-Bass.
U.S. Department of Education (2017). College scorecard. Retrieved from:
https://collegescorecard.ed.gov/
U.S. Department of Education. (2014). Integrated Postsecondary Education Data System.
Retrieved April 2014 http://nces.ed.gov/ipeds/
U.S. Department of the Treasury and Department of Education. (2012). The economics of
higher education. Retrieved from:
http://www.treasury.gov/connect/blog/Documents/20121212_Economics%20of%
20Higher%20Ed_vFINAL.pdf

244
Umbricht, M. R., Fernandez, F., & Ortagus, J. C. (2017). An examination of the
(un)intended consequences of performance funding in higher education.
Educational Policy, 31(5), 643-673.
doi:10.1177/0895904815614398http://www.treasury.gov/connect/blog/Document
s/20121212_Economics of Higher Ed_vFINAL.pdf
Wood, B. L., “The impact of performance-based funding at Woodland Hills Community
College,” Ph.D. dissertation, Oklahoma State University, OK, 2007.
Yin, R. K. (2009). Case Study Research, Design & methods (4th ed.) Los Angeles:
SAGE.

245
Appendix A
Quantiative Data by Year by Case Institution
FY
14F
Y15
FY
16%
Cha
nge
FY
14F
Y15
FY
16F
Y14
FY
15F
Y16
AV
GF
Y14
FY
15F
Y16
Tot
alF
Y14
FY
15F
Y16
AV
G
C1
(Hig
h)4,
910
4,
910
5,
470
11
.41%
-13.
7%1.
7%-0
.8%
1.30
%0.
76%
0.30
%0.
8%$2
,312
.0$3
,093
.3$4
,030
.0$9
,435
.329
.8%
42.2
%55
.2%
42.4
%
C2
(Hig
h)4,
420
4,
750
5,
150
16
.52%
-5.4
%-4
.4%
2.3%
9.00
%7.
55%
7.60
%8.
1%-$
599.
2$6
64.7
$458
.2$5
23.7
-3.4
%3.
9%2.
4%1.
0%
C3
(Low
er)
5,74
0
5,95
0
6,10
0
6.27
%-2
.3%
-6.2
%3.
3%4.
30%
5.26
%5.
10%
4.9%
-$63
2.8
-$1,
006.
8-$
947.
6-$
2,58
7.2
-5.0
%-7
.2%
-6.2
%-6
.1%
C4
(Low
)4,
230
4,
230
4,
470
5.
67%
1.6%
-2.1
%1.
1%9.
50%
9.72
%9.
70%
9.6%
-$1,
324.
6-$
2,81
8.2
-$2,
872.
0-$
7,01
4.8
-6.3
%-1
1.3%
-10.
2%-9
.3%
Sour
ces:
MD
HE
HE
IRS,
IP
ED
S, M
AP
FF
Qua
ntit
ativ
e D
ata
by Y
ear
FT
E E
nrol
lmen
t C
hang
es (
%)
Sto
p L
oss
Impa
ct $
(00
0)M
AP
FF
Per
form
ance
Sha
re C
hang
es (
%)
Sto
p L
oss
Impa
ct %
Tui
tion
& F
ees
($)

246
Appendix B
Selection Variables 1, 2 and 3
Inst
itutio
n
Perfo
rman
ce
Shar
e %
2014
Perfo
rman
ce
Shar
e %
2015
Perfo
rman
ce
Shar
e %
2016
AV
G %
Cha
nge
in
Perfo
rman
ce
Shar
e
2016
-201
4
% C
hang
e in
Perf
Shar
e
Sect
or R
ank
[Sm
aest
Incr
ease
]
2014
- 2
016
(Asc
. Ord
er)
% D
iffer
ence
in S
tate
Fund
ing
Bef
ore
Stop
Loss
2014
-201
3
MA
PFF
Das
hboa
rd
% D
iffer
ence
in S
tate
Fund
ing
Bef
ore
Stop
Loss
2015
-201
4
MA
PFF
Das
hboa
rd
% D
iffer
ence
in S
tate
Fund
ing
Bef
ore
Stop
Loss
2016
-201
5
MA
PFF
Das
hboa
rd
Ave
rage
Cha
nge
in
Stat
e Fu
ndin
g
Bef
ore
Stop
Loss
(201
3 -
2016
)
% C
hang
e in
Stat
e Fu
ndin
g
Cha
nge
Bef
ore
the
Stop
Los
s
Sect
or R
ank
[Lar
gest
Dec
reas
e]
2013
-201
6
(Asc
. Ord
er)
FTE
2013
FTE
2014
FTE
2015
FTE
2016
% C
hang
e in
FTE
2016
-201
3
% C
hang
e in
FTE
Sect
or
Ran
k
[Lar
gest
Dec
reas
e]
2013
- 2
016
(Dec
. Ord
er)
12
3
Inst
itutio
n A
4.1%
4.6%
4.8%
4.5%
224
.5%
16.4
%12
.2%
17.7
%10
1,48
3
1,37
9
1,28
1
1,33
0
-10.
3%2
Inst
itutio
n B
8.8%
9.0%
9.0%
8.9%
32.5
%17
.5%
15.2
%21
.7%
5,70
7
5,96
7
5,72
4
5,58
1
2.2%
Inst
itutio
n C
-C4
9.5%
9.7%
9.7%
9.6%
1120
.1%
25.8
%17
.6%
21.1
%11
8,81
4
8,95
2
8,76
8
8,86
0
0.5%
12
Inst
itutio
n D
3.0%
4.0%
5.5%
4.2%
3.5%
9.9%
20.0
%11
.1%
2,49
1
2,34
6
2,12
8
2,11
4
15.1
%
Inst
itutio
n E
3.9%
2.6%
1.9%
2.8%
25.5
%-1
.1%
-13.
2%3.
7%1,
464
1,
338
1,
305
1,
259
14
.0%
Inst
itutio
n F-
C2
9.0%
7.6%
7.6%
8.0%
79.
9%0.
2%0.
1%3.
4%5
4,91
1
4,64
6
4,43
9
4,54
2
-7.5
%4
Inst
itutio
n G
7.7%
7.1%
6.8%
7.2%
528
.1%
10.9
%9.
2%16
.1%
83,
637
3,
549
3,
452
3,
500
-3
.8%
9
Inst
itutio
n H
6.6%
5.6%
6.5%
6.2%
4-4
.8%
-7.9
%-4
.7%
-5.8
%3
5,44
2
5,40
1
5,19
0
5,29
5
-2.7
%10
Inst
itutio
n I
9.3%
10.3
%10
.5%
10.0
%12
17.9
%16
.7%
15.6
%16
.7%
96,
040
6,
002
5,
786
5,
894
-2
.4%
11
Inst
itutio
n J-
C3
4.3%
5.3%
5.1%
4.9%
315
.3%
15.1
%10
.0%
13.5
%7
3,14
3
3,07
2
2,88
1
2,97
7
-5.3
%6
Inst
itutio
n K
8.0%
8.0%
8.1%
8.0%
8-1
.8%
-0.7
%-0
.1%
-0.9
%4
5,19
5
5,11
3
4,68
3
4,89
8
-5.7
%5
Inst
itutio
n L
7.8%
8.5%
9.3%
8.5%
10-1
.1%
4.9%
9.4%
4.4%
64,
635
4,
447
4,
121
4,
284
-7
.6%
3
Inst
itutio
n M
8.0%
8.8%
8.0%
8.3%
940
.5%
22.8
%8.
5%24
.0%
125,
879
5,
691
5,
546
5,
618
-4
.4%
7
Inst
itutio
n N
-C1
1.3%
0.8%
0.3%
0.8%
1-2
0.3%
-27.
2%-3
4.0%
-27.
1%1
1,76
5
1,52
3
1,55
0
1,53
7
-13.
0%1
Inst
itutio
n O
8.6%
8.1%
7.0%
7.9%
6-1
8.7%
-18.
2%-2
1.9%
-19.
6%2
4,74
6
4,68
2
4,44
7
4,56
5
-3.8
%8
Sect
or o
f 15
Ave
rage
6.7%
6.7%
6.7%
6.7%
11.4
%5.
7%2.
9%6.
7%4,
357
4,
274
4,
087
4,
150
-2
.3%
Sect
or o
f 15
Med
ian
7.8%
7.6%
7.0%
7.9%
15.3
%9.
9%9.
2%11
.1%
4,74
6
4,64
6
4,43
9
4,54
2
-3.8
%

247
Appendix C
Selection Variables 4 and 5
InstitutionT&F
2013
T&F
2014
T&F
2015
T&F
2016
% Change in
T&F
2016-2013
% Change in
T&F Sector
Rank
[Largest
Increase]
2013 - 2016
(Dec. Order)
FY16 State
Funding After
SL
4 5
Institution A 5,810 5,810 5,810 6,020 3.6% 12 10,748,446
Institution B 5,204 5,204 5,204 5,444 4.6%
Institution C-C4 4,230 4,230 4,230 4,470 5.7% 8 25,285,825
Institution D 5,090 5,090 5,266 5,266 3.5%
Institution E 6,018 6,018 6,168 6,482 7.7%
Institution F-C2 4,420 4,420 4,750 5,150 16.5% 2 19,793,771
Institution G 5,300 5,300 5,300 5,600 5.7% 9 15,816,954
Institution H 5,370 5,370 5,390 5,910 10.1% 5 20,733,056
Institution I 5,330 5,330 5,480 5,630 5.6% 10 22,925,199
Institution J-C3 5,740 5,740 5,950 6,100 6.3% 7 14,283,527
Institution K 5,070 5,070 5,670 5,670 11.8% 3 21,123,379
Institution L 4,710 4,860 5,720 5,860 23.7% 1 19,364,638
Institution M 6,140 6,140 6,140 6,400 4.2% 11 20,398,308
Institution N-C1 4,910 4,910 4,910 5,470 11.4% 4 11,333,247
Institution O 5,106 5,106 5,106 5,436 6.5% 6 24,775,119
Sector of 15 Average 5,230 5,240 5,406 5,661 8.2% 18,881,789
Sector of 15 Median 5,204 5,204 5,390 5,630 6.3% 20,096,039

248
Appendix D
Timeline for Dissertation
Days End Date
Quantitative Documentary and Administrative Data Collection 1/1/2017
Selection of Case Insitutions 4/1/2017
Preliminary Proposal Approval - BM II 8/14/2017
Complete Pilot Study 9/30/2017
IRB Approvals 11/20/2017
Survey Disseminated to Subjects 11/23/2017
Complete One-On-One Interviews 2/9/2018
Analyze Findings from all sources 2/15/2018
First Draft of Findings Chapter IV 2/17/2018
Final Proposal Approval - BM II 6/30/2018
Final Drafts of Chapter IV and Chapter V 3/28/2019
Symposium Scheduled 3/29/2019
Committee Feedback 4/14/2019
Revise Dissertation 4/21/2019
Symposium Completed 5/19/2019
Task

249
Appendix E
Alternative Explanations
Result Unrelated Cause(s) Elimination
Tuition & Fee Rate
Increases
1. Reasons unrelated to
Performance Funding.
Could be a regular
inflationary increase.
2. Increased costs due to
initiatives focused on
student enrollment.
1. Surveys and interviews
will address.
2. Survey and interview
questions will address.
Tuition & Fee Rates Not
Changed.
1. Could be mandate from
MA DHE, as it was in
2014.
2. Greater revenues
received from
alternative sources due
to “Academic
Capitalism”
1. Data from HEIRS is
available to verify.
2. Rigorous questioning
in both the surveys and
one-on-one interviews.
Salary & Benefit Costs Are
Unchanged or Changed
within the Collective
Bargaining COLAs.
1. Reasons could include
retirement accruals and
lower replacement
costs.
2. Reorganizations of staff
into positions to help
improve student
outcomes more directly.
1. Surveys and interviews
will address.
2. Surveys and interviews
will address.
Costs per FTE Increases. 1. Collective bargaining
COLA increases; non-
personnel expenditure
increases.
2. Enrollment decreases
related to demographic
shifts.
1. Audits, surveys and
interviews will
address.
2. HEIRS, surveys, and
interviews will
address.
State Appropriations
Reduced
1. Sector-wide reduction
from the state.
1. Data from MDHE is
available to verify.
Additional Full-Time/Part-
Time Faculty Added
1. New academic
programs added; new
campus opened.
1. Surveys and interviews
will address.
2. Surveys and interviews
will address.

250
2. Significant enrollment
increases.
Reduction in Full-Time
Faculty
1. Retirements and other
terminations.
1. Surveys and interviews
will address.
Student Services Staff
Increased
2. Significant enrollment
increases.
3. New campus opened.
2. Surveys and
Interviews will
address.
3. Surveys and
Interviews will
address.
Enrollment Decreases 1. Demographic changes.
2. Fewer high school
students graduating.
1. Surveys and interviews
will address.
2. Documentary data,
surveys and interviews
will address
Improved Retention and
Completions
1. Implementation of best
practices.
1. Surveys and interviews
will address.
Researcher Perception that
Decreased Affordability is
Due to Performance
Funding
1. Actions focused on
student success but
unrelated to the
outcomes of the
performance funding
formula.
1. Careful generation of
survey and interview
questions and fairly
reviewing all
quantitative and
qualitative data.
Perception that
Performance Funding Will
Not Continue into the
Future
1. Institutions not paying
much attention to the
results of the PF
formula in their
decision making.
1. Rigorous questioning
with senior
administrators,
multiple sources of
data, and peer review.

251
Appendix F
Survey
Performance Funding Impact Survey
The purpose of this survey is for a doctoral dissertation study only. I have received IRB approval from your institution to conduct this study.
Hello: Your College is one of only four community colleges in Massachusetts chosen for this study. Members of the leadership team of each of the four community colleges will be asked to complete this survey. You are invited to participate in a research study on the impact that performance funding has on the open access mission of community colleges in Massachusetts. Research conducted nationally has identified that the allocation of state appropriations using a funding formula, incentivizing institutions to improve student outcomes, has identified some positive and negative impacts on community colleges. The implementation of a performance funding program in Massachusetts (MAPFF) may or may not confirm these findings. Your participation will help me complete the requirements for my degree and inform future strategy and studies and add to the scholarly work in the field. In this survey, 28 people will be asked to complete a survey and it will take approximately 10-15 minutes to complete the questionnaire. Your participation in this study is completely voluntary. There are no foreseeable risks associated with this project. However, if you feel uncomfortable answering any questions, you can withdraw from the survey at any point. It is very important for me to learn your opinions. Your survey responses will be strictly confidential and data from this research will be reported only in the aggregate. Your information will be coded and will remain confidential. If you have questions at any time about the survey or the procedures, you may contact [Walter Brooks] by email at the email address specified below. Thank you very much for your time and support.
Please start with the survey now by clicking on the Continue button below.
Walter Brooks: [email protected]
The table above is a summary of your institution’s data from the MAPFF and the HERIS repository to help you recollect
the outcomes from the funding formula and assist you in answering the questions below.
Q1. The senior leadership reviews and discusses the results of the MAPFF at least
annually.
o Strongly Agree (1)
o Agree (2)
o Disagree (3)
o Strongly disagree (4)
o Not Sure (5)

252
Q2. My institution’s results from the MAPFF are shared with the staff and faculty
at least annually by the senior leadership:
o Strongly Agree (1)
o Agree (2)
o Disagree (3)
o Strongly disagree (4)
o Not Sure (5)
Q3. I believe that the MAPFF has provided the following level of incentives to
improve student success at my institution:
o Significant (1)
o Substantial (2)
o Somewhat (3)
o Not yet but may in the future (4)
o Not Sure (5)

253
Q4. The following actions were taken at my institution from 2014–2016: (Check all
that apply.)
▢ Hiring of additional FT/PT staff and/or faculty (1)
▢ Reduction of FT/PT staff and/or faculty (2)
▢ Additional or expansion of student services (advising, first year success, tutoring,
etc.) (3)
▢ Purchasing and use of additional tools to monitor student success and persistence
(4)
▢ Increases in tuition and fee rates (5)
▢ Additional student fees (6)
▢ Reductions/eliminations in course offerings (7)
▢ Changes in the college mission and goals (8)
▢ Organizational restructure (9)
▢ More stringent admission requirements (10)
▢ Changes in degree completion requirements (11)
▢ Other (please explain below) (12)
▢ No strategic decisions were influenced by the MAPFF (13)
▢ Not sure (14)
Q5. If you chose OTHER in Q4 above, please write your explanation here.

254
Q6. I believe that my institution’s results on the MAPFF, from 2014–2016, have
influenced some of the strategic planning and decisions made at my institution from
Question 4 above since the inception of the formula in 2014 to improve student
success and completion.
o Strongly Agree (1)
o Agree (2)
o Disagree (3)
o Strongly disagree (4)
o Not Sure (5)
Q7. If you disagree in Q6, what DID influence the strategic decisions made?

255
Q8. I believe that the following actions from Question 4 above were influenced by
my institution’s results on the MAPFF: (Check all that apply.)
▢ Hiring of additional FT/PT staff and/or faculty (1)
▢ Reduction of FT/PT staff and/or faculty (2)
▢ Additional or expansion of student services (advising, first year success, tutoring,
etc.) (3)
▢ Purchasing and use of additional tools to monitor student success and persistence
(4)
▢ Increases in tuition and fee rates (5)
▢ Additional student fees (6)
▢ Reductions/eliminations in course offerings (7)
▢ Changes in the college mission and goals (8)
▢ Organizational restructure (9)
▢ More stringent admission requirements (10)
▢ Changes in degree completion requirements (11)
▢ Other: (Please explain below) (12)
▢ No strategic decisions were influenced by the MAPFF (13)
▢ Not sure (14)
Q9. If you chose OTHER in Q8 above, please write your explanation here.

256
Q10. I believe that the MAPFF has negatively impacted my institution in the
following ways: (Check all that apply.)
▢ Larger increases to tuition & fee rates (1)
▢ Reduction in academic quality and rigor (2)
▢ Reduction in student services (3)
▢ Elimination/ reduction in program/course/section offerings (4)
▢ Reductions in staff/faculty (5)
▢ Lower staff/faculty morale (6)
▢ Additional costs of review and compliance (7)
▢ MAPFF has not negatively impacted my institution (8)
Q11. Please provide other examples not mentioned in Q10 above.

257
Q12. I believe that my institution’s results on the MAPFF have influenced my
institution’s tuition and fee rate increases from 2014–2016 at the following level:
o Significant (1)
o Substantial (2)
o Somewhat (3)
o None yet but may in the future (4)
o Not Sure (5)
Q13. If NOT SURE from Q12 above, what other factors DID influence your tuition
and fee rate increases?
Q14. I believe that ACCESS to higher education is one of the MOST important
missions of community colleges.
o Strongly Agree (1)
o Agree (2)
o Disagree (3)
o Strongly disagree (4)
o Not Sure (5)

258
Q15. If you disagree in Q14 above, what do you feel is the MOST important mission
of community colleges?
Q16. Research conducted in other states has shown that performance funding has
negatively impacted access through increased student costs, restricted admissions
and selective student recruitment. I believe that the implementation of the MAPFF
has negatively impacted student access through the following mechanisms: (Check
all that apply.)
▢ Increased student costs (1)
▢ Restricted admissions of less prepared students (2)
▢ Selective student recruitment (3)
▢ Elimination or reduced program/course/section offerings (4)
▢ Access has not been negatively impacted by the MAPFF (5)
▢ Not sure (6)
Q17. Please provide other examples not mentioned in Q16 above if applicable.
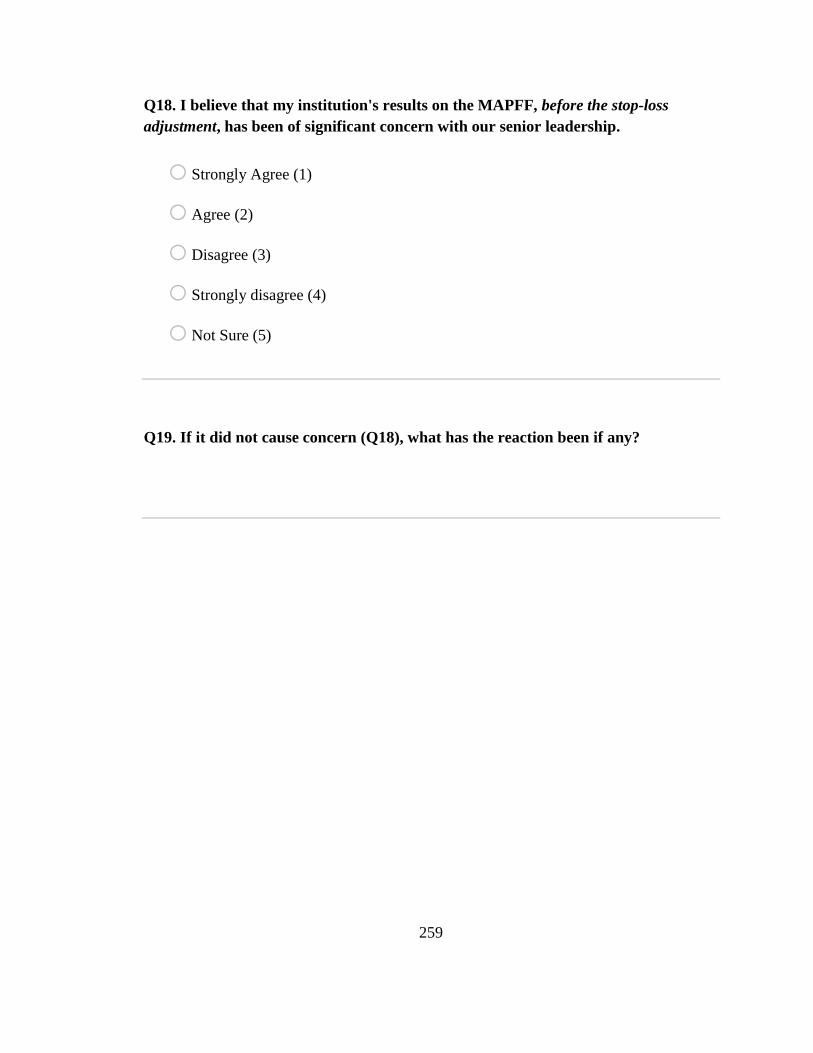
259
Q18. I believe that my institution's results on the MAPFF, before the stop-loss
adjustment, has been of significant concern with our senior leadership.
o Strongly Agree (1)
o Agree (2)
o Disagree (3)
o Strongly disagree (4)
o Not Sure (5)
Q19. If it did not cause concern (Q18), what has the reaction been if any?
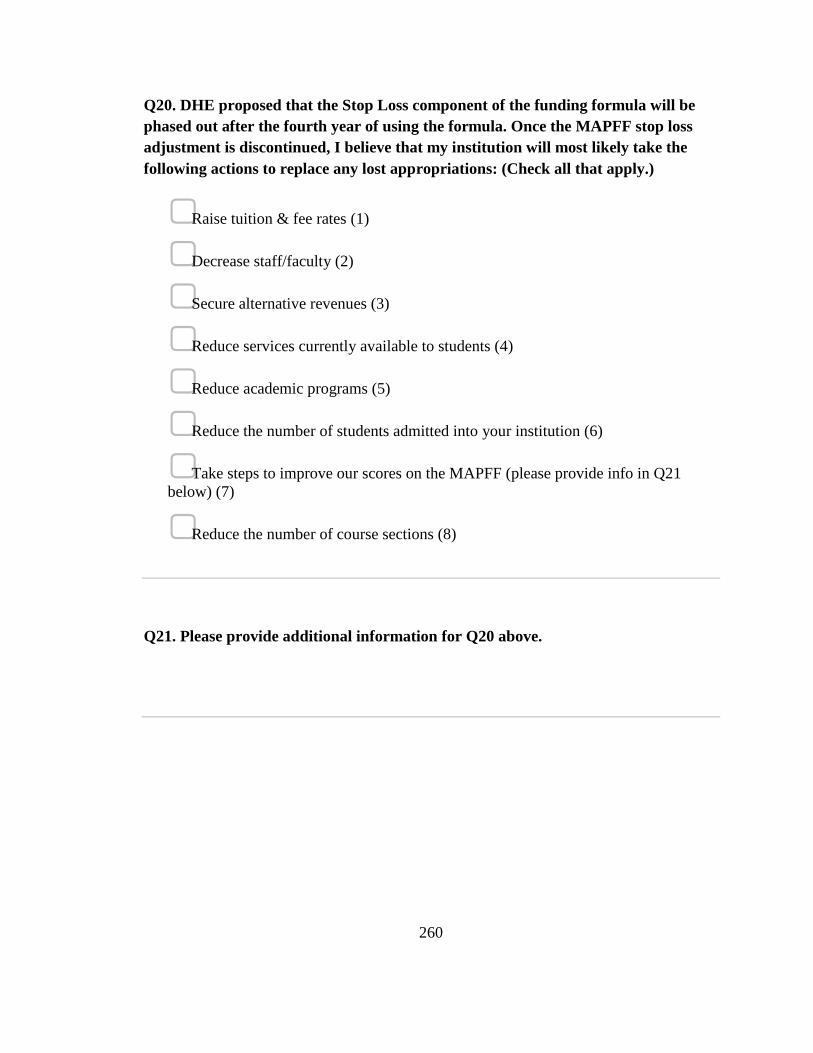
260
Q20. DHE proposed that the Stop Loss component of the funding formula will be
phased out after the fourth year of using the formula. Once the MAPFF stop loss
adjustment is discontinued, I believe that my institution will most likely take the
following actions to replace any lost appropriations: (Check all that apply.)
▢ Raise tuition & fee rates (1)
▢ Decrease staff/faculty (2)
▢ Secure alternative revenues (3)
▢ Reduce services currently available to students (4)
▢ Reduce academic programs (5)
▢ Reduce the number of students admitted into your institution (6)
▢ Take steps to improve our scores on the MAPFF (please provide info in Q21
below) (7)
▢ Reduce the number of course sections (8)
Q21. Please provide additional information for Q20 above.

261
Q22. With the decline in additional State appropriations since the implementation
of the MAPFF for the community college sector, I believe that the current funding
formula will be modified significantly or discontinued in the near future.
o Strongly Agree (1)
o Agree (2)
o Disagree (3)
o Strongly disagree (4)
o Not Sure (5)
Q23. I believe that the MAPFF has positively impacted my institution in the
following ways: (Check all that apply.)
▢ Improved student success and completion (1)
▢ Provided the needed incentive for my institution to improve student services and
instruction (2)
▢ Increased the number of graduates (3)
▢ Increased awareness of institutional performance (4)
▢ All of the above (5)
▢ None of the above (6)
Q24. What are other examples of positive impacts not mentioned in Q23?

262
Q25. I believe that my institution's outcomes on the MAPFF has had NO impact on
my institution either positively or negatively from 2014–2016.
o Strongly Agree (1)
o Agree (2)
o Disagree (3)
o Strongly disagree (4)
o Not Sure (5)
Q26. If you agree that the MAPFF has had NO impact on your institution from
question 15 above, what do you believe were the reasons: (Check all that apply.)
▢ The Stop Loss Adjustment; our institution still received appropriation increases
each year (1)
▢ I ignore the results because I don’t believe that the MAPFF will continue to be
used much longer (2)
▢ I am focused more on increasing tuition revenue through enrollment (3)
▢ Don’t understand the formula results (4)
▢ All of the above (5)
▢ None of the above (6)

263
Q27. Please provide other examples not mentioned in Q26 above.
Q28. What has surprised you most about the MAPFF and your institutions results?
Q29. Please add any additional comments on the MA Performance Funding
Program you feel will be pertinent to this study.
Q30. Select the title that most closely fits your position:
o President (2)
o Vice President (Academic) (3)
o Vice President (Financial) (4)
o Vice President/Dean of Student Services (5)
o Director/Manager of Admissions (6)
o Budget Director/Manager (7)
o Responsible for Institutional Research (8)
o Other (9)

264
Q31. If you selected other for Q30 above, please enter your title here.
Q32. Select your institution from the list. (Your name and institution's name will
remain anonymous in the report.)
Q33. How long have your worked in your position at your current institution?
(Round to closest # of years.)
End of Block

265
Appendix G
Overview of the Massachusetts Performance Funding Formula
50%
InstitutionalAppropriation
(Prior Year)
f
BaseAppropriation
Performance Appropriation
School Credit Hoursby Discipline
Visual &Performing Arts
Weights are applied to each SCH amount
The Base Allocation is determined by each institution's Base Share, which is driven off of their Weighted SCH amount as a percentage of the total Weighted SCH amount.
Outcome-Driven
Performance Formula
Transfers with 24School Credit Hours or greater accrued
Completions in College-Level
English Coursework
Weights are applied to each
performance lever
The Performance Allocation is
determined by each institution's
Performance Share, which is driven off of
their Weighted Performance Score as a percentage of
the total Weighted Performance Point
System.
InstitutionFundingAmount
AlternativeMinimum /Stop-Loss Calculation
(prevents any s ingle institution from los ing more than a set amount)
Fund Distribution
Funding Allocated to all
Community Colleges
Split as a defined percentage
Cost of Operation Subsidy(Distributes a fixed amount to
ins titutions at the end of performance
disbursement)
Ancillary Budget Amount (if applicable)
Alternative Maximum /Stop-Gain Calculation
(prevents any s ingle institution from gaining more than a set amount)

266
Appendix H
Data Use Diagram
Affordability
[AFFORD]
Tuition & Fee Increases
[HEIRS Data; Survey & Interviews]
State Appropriations before and After Stop Loss Adjustment
[MAPFF Model; Survey & Interviews]
Restricting Admissions
[R.A.E.R.]
FTE Enrollment Changes
[HEIRS Data; Survey & Interviews]
Performance Share Percentage Changes
[MAPFF Model; Survey & Interviews]
Threats to Access

267
Appendix I
Consent-to-Participate Form
My name is Walter Brooks and I’m a doctoral student attending Rowan
University in New Jersey and the former vice president of finance and
operations at Cape Cod Community College. I have received IRB approval
from your institution to conduct my research study.
The purpose of this study is to understand the impact that performance
funding has on the open-access mission of community colleges in
Massachusetts. The study will follow a multiple-case study design on nine
community colleges in the Commonwealth of Massachusetts. Several of the
original nine community colleges have been chosen to conduct the one -on-
one interviews.
The interview will consist of asking specific questions as a follow -up to your
responses to the survey you completed earlier. The purpose of the interview
is to get a deeper understanding of your professional views and thoughts on
the actions instituted at your institution in reaction to the implementation of
the performance funding formula that has been in use since fiscal year 2013
in Massachusetts. The interview will last not more than 60 minutes and will
be recorded using an audio device so that I may transcribe the information at
a later date. No one other than me will have access to the conversation audio
file.
There are no known risks and/or discomforts associated with this study. The
expected benefits with your participation are the information about the
impact that performance funding has on student access and the opportunity to
participate in a qualitative research study. The results of this study can
provide valuable information that can lead to further research and inform,
and potentially influence, performance funding programs across the nation.
The final paper will be submitted to my dissertation committee at Rowan
University as a final step in the pursuit of my doctoral degree. The
institution’s name and your name and personal information will not be used
in the report.
Please sign your consent with full knowledge of the nature and purpose of the
procedures. A copy of this consent form will be given to you to keep.
Printed Name Date:
Signature Date:

268
Appendix J
Interview Protocol
Time of Interview: Interviewer:
Date:
Interviewee:
Place:
Age of Interviewee:
Sex of Interviewee:
Title of Interviewee:
Brief Description of Proposal:
Examination of how states are tying funding to the success outcomes of students also
reveals that there may be a shift in emphasis from access to success in the missions of
community colleges. The implementation of a performance funding program (PFP) in
Massachusetts may demonstrate this shift as well. This study will examine the impact that
State Performance funding has on the open access mission of community colleges in
Massachusetts and inform future strategy and studies. Your participation will also add to
the scholarly work in the field.
Mission Statement of Institution:
Questions:
The documentary data and your survey responses indicate that the MA
Performance Funding Formula has influenced actions at your institution. I’d
like to explore this more deeply to fully understand the findings.
Decreased Affordability (C1) & (C2)
Main Questions (Probes and follow-up questions will be asked as the interview
progresses.)

269
1. Your institution’s fees have changed from xxx pch in FY2012 (before the
implementation of the PF formula) to xxx pch in FY2016. Explain how the decisions
were made that led to these changes.
2. In reviewing your institution’s appropriation amount BEFORE the application of the
stop loss amount in FY2016, your institution would have received [xxx less/more]
appropriation.
a. What do you perceive were the reason(s) for the loss of appropriation?
b. What changes have been made or discussed at your institution to improve
your results on the PF formula allocation?
c. How have your institution’s outcomes on the performance funding formula
been discussed with the leadership at your institution?
3. Your institution’s state appropriation percentage of total operating revenues has
changed from xx% in FY2012 (before the implementation of the PF formula) to xx%
in FY2016. What do you attribute this change to?
4. You [did or did not indicate] on the survey that the MA Performance Funding
Formula incentivizes colleges to increase student outcomes. In what ways, does it
accomplish this at your institution?
Declining Enrollments (C3) & (C4)
Your institution’s enrollment has changed (x%) between 2014 and 2016.
5. Explain what you attribute the enrollment declines to? (Probe to determine if any of
the decline is dues to the MAPFF.)
6. You indicated on the survey your institution (has or hasn’t) restricted admissions,
enrollments, or recruitment since the implementation of the MA Performance
Funding Formula. If it has, explain how. If hasn’t, explain what your institution is
doing to improve student outcomes as measured in the formula. [Probe: Has your
institution changed admission, enrollment, and recruitment practices as a result of
the MAPFF?]

270
7. What other actions has your institution instituted to improve your outcomes as
measured by the PF formula? (To probe for unintentional impacts to access.)
8. You indicated on the survey that the MA Performance Funding Formula has had
positive impacts on your institution. Explain what they are. (Follow-up based on their
examples given on the survey.)
9. You indicated on the survey that the MA Performance Funding Formula has had
negative impacts on your institution. Explain what they are. (Follow-up based on
their examples given on the survey.)
10. What suggestions would you make to improve the way the state allocates
appropriations?
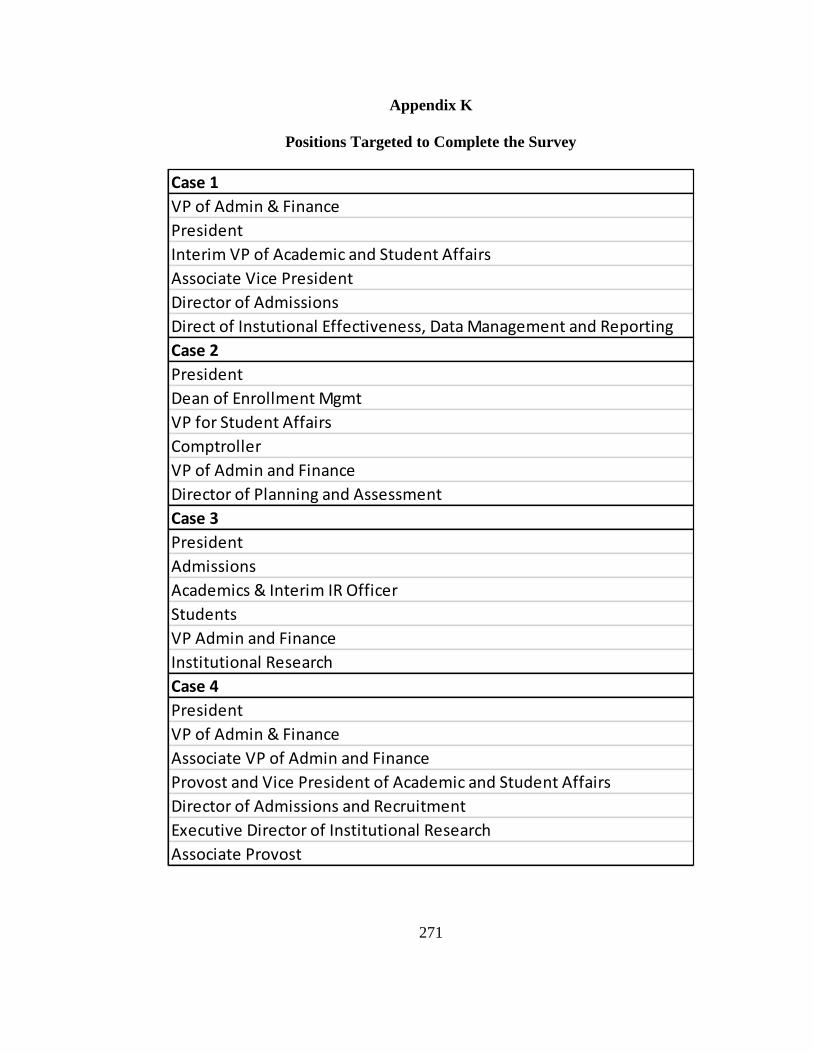
271
Appendix K
Positions Targeted to Complete the Survey
Case 1
VP of Admin & Finance
President
Interim VP of Academic and Student Affairs
Associate Vice President
Director of Admissions
Direct of Instutional Effectiveness, Data Management and Reporting
Case 2
President
Dean of Enrollment Mgmt
VP for Student Affairs
Comptroller
VP of Admin and Finance
Director of Planning and Assessment
Case 3
President
Admissions
Academics & Interim IR Officer
Students
VP Admin and Finance
Institutional Research
Case 4
President
VP of Admin & Finance
Associate VP of Admin and Finance
Provost and Vice President of Academic and Student Affairs
Director of Admissions and Recruitment
Executive Director of Institutional Research
Associate Provost

272
Appendix L
Survey Summary Findings Table
Qualitative Case 1 Case 2 Case 1 & 2 Codes Case 3 Case 4 Case 3 & 4 Codes Combined Coding
Surveys 1 Respondent 2 Respondents 7 Respondents 3 Respondents
SQ 1 -The senior leadership reviews and
discusses the results of the MAPFF at least
annually.
Strongly disagree (1) Agree (1)
Disagree (1)
Consistently
Disagree
Agree (6)
Strongly Agree (1)
Agree (2)
Strongly Agree (1)
Consistent Disagreement in
High Potential Cases
SQ 2 - My institution’s results from the
MAPFF are shared with the staff and faculty
at least annually by the senior leadership
Strongly disagree (1) Disagree (2) Unfamiliar,
non-transparent
below senior
leadership
Agree (2)
Not Sure (2)
Strongly Agree (1)
Disagree (2)
Disagree (2)
Agree (1)
Inconsistent Unfamiliar,
inconsistent,
non-transparent
SQ 3 - I believe that the MAPFF has
provided the following level of incentives to
improve student success at my institution
Not Sure (1) Somewhat (1)
Not Sure (1)
Small impact,
unsure, Unfamiliar
with MAPFF
Somewhat (5)
Not Sure (2)
Not yet but may in the
future (2)
Somewhat (1)
No impact, small
impact
Unfamiliar with
MAPFF, Small &
No MAPFF Impact
SQ 4 - The following actions were taken at
my institution from 2014 - 2016: (Check all
that apply)
Not Sure (1) Hiring of additional FT/PT
staff and/or faculty (2)
Additional or expansion of
student services (advising,
first year success, tutoring,
etc.) (2)
Purchasing and use of
additional tools to monitor
student success and
persistence (2)
Increases in tuition and fee
rates (2)
Hiring,
expansion,student
services, student
success,
affordability,
reduced offerings,
compliance costs,
restructure
Hiring of additional FT/PT
staff and/or faculty (6)
Reduction of FT/PT staff
and/or faculty (4)
Purchasing and use of
additional tools to monitor
student success and
persistence (2)
Increases in tuition and fee
rates (5)
Additional student fees (3)
Reductions/eliminations in
course offerings (3)
Org restructure (3)
Change in degree reqs (3)
Not Sure (1)
Hiring of additional FT/PT
staff and/or faculty (1)
Additional or expansion of
student services (advising,
first year success, tutoring,
etc.) (2)
Increases in tuition and fee
rates (3)
Additional student fees (1)
Org restructure (2)
Changes in degree
completion requirements (1)
purchasing and use of
additional tools to monitor
student success and
persistence (2)
changes in college mission
and goals (1)
Hiring,
expansion,student
services, student
success,
affordability,
reduced offerings,
compliance costs,
restructure, degree
req changes, change
in mission
Consistent,
compliance costs,
student success
costs, affordability
SQ 5 - If you chose OTHER in Q4 above,
please write your explanation here.
Blank Blank Blank Blank
SQ 6 - I believe that my institution’s results
on the MAPFF, from 2014 - 2016, have
influenced some of the strategic planning and
decisions made at my institution from question
4 above since the inception of the formula in
2014 to improve student success and
completion.
Disagree (1) Agree (2) Inconsistent,
disagreement
Disagree (1)
Not sure (2)
Agree (4)
Agree (1)
Disagree (2)
Inconsistent,
disagreement, not
important
Compliance costs,
student success
costs, Affordability,
no Impact, not
important
SQ 7 - If you disagree in Q6, what DID
influence the strategic decisions made?
Blank Environmental factors, such
as demographic shifts in our
service area (1)
Demographics The crisis du Jour, student
attainment data (1)
Student attainment data (1)
Six Year Strategic Plan (1)
Consistent MAPFF No impact
SQ 8 - I believe that the following actions
from question 4 above were influenced by my
institution’s results on the MAPFF: (Check all
that apply)
Not Sure (1) Additional or Expansion of
Std Svcs (1)
Purchasing and use of
additional tools to monitor
student success and
persistence (2)
Org restructure (1)
Increase Fees (1)
Addl Fees (1)
Reductions and Eliminations
of courses (1) change in
degree completion (1)
Neg impact Not Sure (6)
Inc T&F (1)
Add'l fees (1)
Change in mission (1)
Org restruct (1)
Change in degree reqs (1)
Inc in fees (1)
Add'l fees (1)
No decisions made b/c of
MAPFF (1)
Changes in degree
completion reqs (1)
Unimportance,
affordability
Neg impact,
affordability
SQ 9 - If you chose OTHER in Q8 above, please write your explanation here.Blank Blank Blank Blank
SQ 10 - I believe that the MAPFF has
negatively impacted my institution in the
following ways: (Check all that apply).
Add'l Compliance Costs (1) No neg impact (1)
Larger T&F inc (1)
Elim/Reduce courses (1)
reductions in staff/faculty (1)
lower staff morale (1)
Addl costs of compliance
(1)
Affordability,
morale, course
availability, cost
savings
No Neg Impact (1)
Larger fee inc (2)
reduc std svcs (2)
lower staff/fac morale (4)
Elim/Reduce courses (3)
staff reductions (2) reduct
in academic qual (1)
add'l cost of compliance
(1)
Redductions in staff/fac (1)
reduct in std svcs (1)
No Neg impact (2)
Inconsistent, cost
savings
Affordability, lower
morale, fewer
course offerings,
disagreement from
VP Fins, cost
savings
SQ 11 - Please provide other examples not
mentioned in Q10 above.
Blank Blank I have not seen this used at
all as an explanation for
funding decisions (1)
Blank
SQ 12 - I believe that my institution’s results
on the MAPFF have influenced my
institution’s tuition and fee rate increases from
2014 - 2016 at the following level.
Not Sure (1) Not yet (1)
Somewhat (1)
Affordability, No-
impact
Not yet (1)
Not sure (3)
Somewhat (2)
Substantial (1)
Not yet (2)
Somewhat (1)
Affordability, No-
impact
Inconsistent with
Q10, affordability,
neg impact
Lower PotentialHigh Potential
FY2014 - FY2016

273
Survey Summary Findings Table Continued
Qualitative Case 1 Case 2 Case 1 & 2 Codes Case 3 Case 4 Case 3 & 4 Codes Combined Coding
Surveys 1 Respondent 2 Respondents 7 Respondents 3 Respondents
SQ 13 - If NOT SURE from Q12 above, what
other factors DID influence your tuition and
fee rate increases?
Blank Blank Construction of new student
center (1)
Blank No impact MAPFF no impact
SQ 14 - I believe that ACCESS to higher
education is one of the MOST important
missions of community colleges.
Strongly Agree (1) Strongly Agree (2) Consistent Strongly Agree (7) Strongly Agree (3) Consistent Access importance
SQ 15 - If you disagree in Q14 above, what do
you feel is the MOST important mission of
community colleges?
Blank Blank Blank Blank
SQ 16 - Research conducted in other states has
shown that performance funding has negatively
impacted access through increased student
costs, restricted admissions and selective
student recruitment. I believe that the
implementation of the MAPFF has negatively
impacted student access through the following
mechanisms: (Check all that apply)
Not Sure (1) Access not negatively
impacted (1)
Increase std costs (1)
Elim/Reduction of courses
(1)
Affordability,
availability
Access not negatively
impacted (2)
Not sure (2) Inc
std costs (3) Elim/Reduce
courses (3)
Access has not been
negatively impacted (3)
Inconsistent, VPs Fin
agree
Inconsistent with
Q10, affordability,
neg impact, VP Fins
no impact
SQ 17 - Please provide other examples not
mentioned in Q16 above if applicable.
Blank Blank Blank Blank
SQ 18 - I believe that my institution's results on
the MAPFF, before the stop loss adjustment,
has been of significant concern with our senior
leadership.
Not Sure (1) Agree (2) Important Disagee (1)
Not sure (4)
Agree (1)
Strongly agree (1)
Disagree (1)
Strongly disagree (1) Agree
(1)
Inconsistent,
unimportant
Unfamiliar,
unimportant
SQ 19 - If it did not cause concern (Q18), what
has the reaction been if any?
Blank Blank None (1) We tend to lead in all
categories of the formula (1)
SQ 20 - DHE proposed that the Stop Loss
component of the funding formula will be
phased out after the fourth year of using the
formula. Once the MAPFF stop loss
adjustment is discontinued, I believe that my
institution will most likely take the following
actions to replace any lost appropriations:
(Check all that apply).
Take Steps to improve
scores on MAPFF (1)
Raise tuition & fee rates (2)
Decrease staff/faculty (1)
Secure alternative revenues
(1) Elim/
Reduce academic program
courses (2)
Take steps to improve our
scores on the MAPFF (1)
Stop Loss significant
impact
Raise tuition & fee rates (2)
Secure alternative revenues
(4) Reduce
services currently available
to students (2)
Take steps to improve our
scores on the MAPFF (2)
Decrease staff/faculty (3)
Reduce/Elim courses (2)
Raise tuition & fee rates (2)
Secure alternative revenues
(2)
Stop Loss significant
impact
Stop Loss significant
impact, caused
reaction delay
SQ 21 - Please provide additional information
for Q20 above.
Blank Blank I cannot Answer (1) We would have an increase
in funding (1)
SQ 22 - With the decline in additional State
appropriations since the implementation of the
MAPFF for the community college sector, I
believe that the current funding formula will be
modified significantly or discontinued in the
near future.
Agree (1) Agree (2) Unstable Agree (3)
Disagree (1)
Not Sure (3)
Agree (1)
Strongly Agree (1) Disagree
(1)
Inconsistent MAPFF not
important for State,
unstable
SQ 23 - I believe that the MAPFF has
positively impacted my institution in the
following ways: (Check all that apply).
None (1) Increased awareness (2) None (1)
Improved std success and
completion (1) Increased
awareness of institutional
performance (5)
Provided the needed
incentive to improve
student services and
instruction (1)
None (1)
Inc awareness of institutional
performance (2)
Consistent Majority said
Institutional
awareness
SQ 24 - What are other examples of positive
impacts not mentioned in Q23?
Blank Blank Blank Blank
SQ 25 - I believe that my institution's outcomes
on the MAPFF has had NO impact on my
institution either positively or negatively from
2014 - 2016.
Not Sure (1) Disagree (2) Impact Agree (2)
Not sure (3)
Disagree (3)
Agree (1)
Disagree (1) Not
sure (1)
Inconsistent,
unfamiliar
Unfamiliar
SQ 26 - If you agree that the MAPFF has had
NO impact on your institution from question 15
above, what do you believe were the reasons:
(Check all that apply)
None (1) None (2) Stop Loss (2)
None (3)
Inc tuition rev thru
enrollment (1)
Ignore results because
MAPFF will be
discontinued (1)
Gon't understand MAPFF
results (1)
Ignore results b/c MAPFF
will be discontinued (1)
Focused more on rev growth
thru enrollment (2) None (1)
Consistent,
unimportant,
insignificant
MAPFF
discontinued, focused
on enrollment, stop
loss impact
Lower PotentialHigh Potential
FY2014 - FY2016

274
Survey Summary Findings Table Continued
Qualitative Case 1 Case 2 Case 1 & 2 Codes Case 3 Case 4 Case 3 & 4 Codes Combined Coding
Surveys 1 Respondent 2 Respondents 7 Respondents 3 Respondents
SQ 27 - Please provide other examples not
mentioned in Q26 above.
Blank Blank The formula has only been
used to distrubute small
annual increases rather
than the whole pot of
money so the affect is
minimal (1)
Blank Insignificant
SQ 28 - What has surprised you most about
the MAPFF and your institutions results?
Blank MAPFF became irrelevant
suw to lack of funding (1)
How the institution
compares with the other
CCs (1)
Not always favorable and
we can't figure out why (1)
Blank Insignificant
SQ 29 - Please add any additional comments
on the MA Performance Funding Program
you feel will be pertinent to this study.
Blank Blank Other measures such as
the VFA seem to place the
CCs in a better light than
do the measures of the
DHE (1)
Blank Results of Vision
Project seen as
more important
SQ 30 - Select the title that most closely fits
your position.
IR Director VP Fin, Dean Enrol Mgmt VPFin, VP/Dean of std,
VPACA, President, Dean,
IR, Other
VPFIN, President Attribute
SQ 31 - If you selected other for Q30 above,
please enter your title here.
IR Financial & Dean Eroll
Mgmt
Blank Blank, Assoc Provost Attribute
SQ 32 - Select your institution from the list.
(Your name and institution's name will remain
anonymous in the report)
Masked Masked Masked Masked Attribute:
Confidential
SQ - Q33 How long have your worked in
your position at your current institution?
(Round to closest # of years)
2 Years 11,3 6,4,48,1,2,?,2 4,5 Attribute
Lower PotentialHigh Potential
FY2014 - FY2016
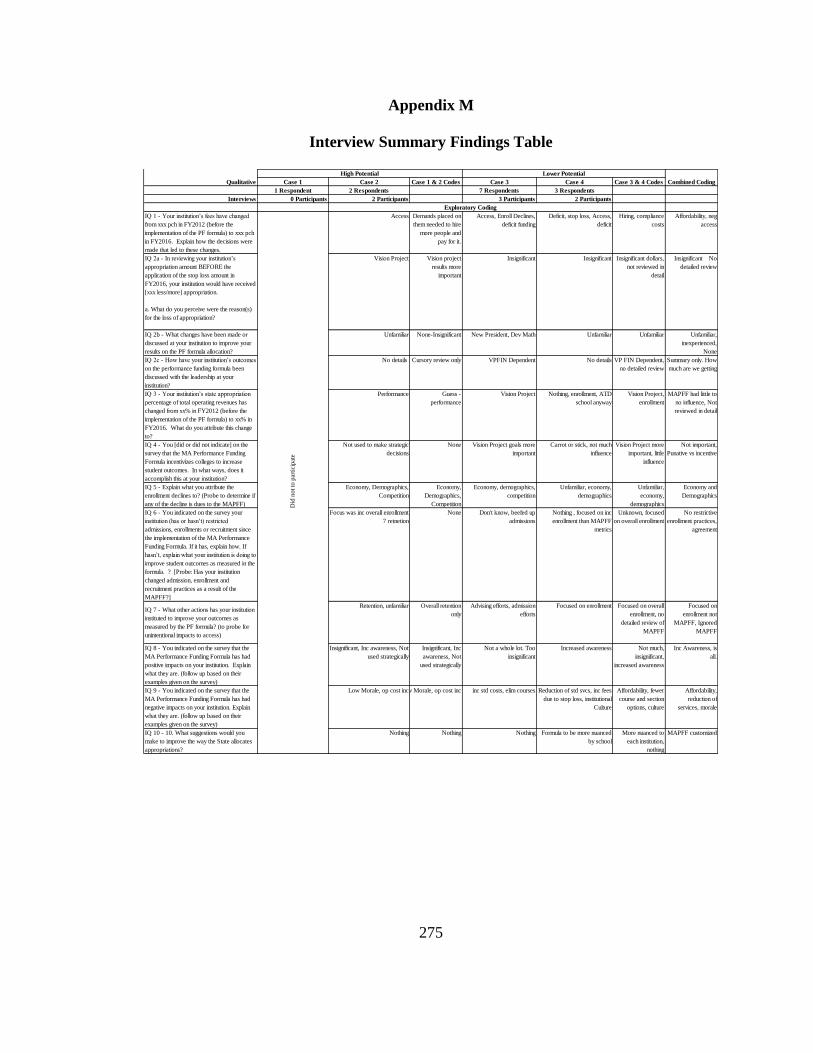
275
Appendix M
Interview Summary Findings Table
Qualitative Case 1 Case 2 Case 1 & 2 Codes Case 3 Case 4 Case 3 & 4 Codes Combined Coding
1 Respondent 2 Respondents 7 Respondents 3 Respondents
Interviews 0 Participants 2 Participants 3 Participants 2 Participants
IQ 1 - Your institution’s fees have changed
from xxx pch in FY2012 (before the
implementation of the PF formula) to xxx pch
in FY2016. Explain how the decisions were
made that led to these changes.
Access Demands placed on
them needed to hire
more people and
pay for it.
Access, Enroll Declines,
deficit funding
Deficit, stop loss, Access,
deficit
Hiring, compliance
costs
Affordability, neg
access
IQ 2a - In reviewing your institution’s
appropriation amount BEFORE the
application of the stop loss amount in
FY2016, your institution would have received
[xxx less/more] appropriation.
a. What do you perceive were the reason(s)
for the loss of appropriation?
Vision Project Vision project
results more
important
Insignificant Insignificant Insignificant dollars,
not reviewed in
detail
Insignificant No
detailed review
IQ 2b - What changes have been made or
discussed at your institution to improve your
results on the PF formula allocation?
Unfamiliar None-Insignificant New President, Dev Math Unfamiliar Unfamiliar Unfamiliar,
inexperienced,
None
IQ 2c - How have your institution’s outcomes
on the performance funding formula been
discussed with the leadership at your
institution?
No details Cursory review only VPFIN Dependent No details VP FIN Dependent,
no detailed review
Summary only. How
much are we getting
IQ 3 - Your institution’s state appropriation
percentage of total operating revenues has
changed from xx% in FY2012 (before the
implementation of the PF formula) to xx% in
FY2016. What do you attribute this change
to?
Performance Guess -
performance
Vision Project Nothing, enrollment, ATD
school anyway
Vision Project,
enrollment
MAPFF had little to
no influence, Not
reviewed in detail
IQ 4 - You [did or did not indicate] on the
survey that the MA Performance Funding
Formula incentivizes colleges to increase
student outcomes. In what ways, does it
accomplish this at your institution?
Not used to make strategic
decisions
None Vision Project goals more
important
Carrot or stick, not much
influence
Vision Project more
important, little
influence
Not important,
Punative vs incentive
IQ 5 - Explain what you attribute the
enrollment declines to? (Probe to determine if
any of the decline is dues to the MAPFF)
Economy, Demographics,
Competition
Economy,
Demographics,
Competition
Economy, demographics,
competition
Unfamiliar, economy,
demographics
Unfamiliar,
economy,
demographics
Economy and
Demographics
IQ 6 - You indicated on the survey your
institution (has or hasn’t) restricted
admissions, enrollments or recruitment since
the implementation of the MA Performance
Funding Formula. If it has, explain how. If
hasn’t, explain what your institution is doing to
improve student outcomes as measured in the
formula. ? [Probe: Has your institution
changed admission, enrollment and
recruitment practices as a result of the
MAPFF?]
Focus was inc overall enrollment
7 retnetion
None Don't know, beefed up
admissions
Nothing , focused on inc
enrollment than MAPFF
metrics
Unknown, focused
on overall enrollment
No restrictive
enrollment practices,
agreement
IQ 7 - What other actions has your institution
instituted to improve your outcomes as
measured by the PF formula? (to probe for
unintentional impacts to access)
Retention, unfamiliar Overall retention
only
Advising efforts, admission
efforts
Focused on enrollment Focused on overall
enrollment, no
detailed review of
MAPFF
Focused on
enrollment not
MAPFF, Ignored
MAPFF
IQ 8 - You indicated on the survey that the
MA Performance Funding Formula has had
positive impacts on your institution. Explain
what they are. (follow up based on their
examples given on the survey)
Insignificant, Inc awareness, Not
used strategically
Insignificant, Inc
awareness, Not
used strategically
Not a whole lot. Too
insignificant
Increased awareness Not much,
insignificant,
increased awareness
Inc Awareness, is
all.
IQ 9 - You indicated on the survey that the
MA Performance Funding Formula has had
negative impacts on your institution. Explain
what they are. (follow up based on their
examples given on the survey)
Low Morale, op cost incLow Morale, op cost inc inc std costs, elim courses Reduction of std svcs, inc fees
due to stop loss, institutional
Culture
Affordability, fewer
course and section
options, culture
Affordability,
reduction of
services, morale
IQ 10 - 10. What suggestions would you
make to improve the way the State allocates
appropriations?
Nothing Nothing Nothing Formula to be more nuanced
by school
More nuanced to
each institution,
nothing
MAPFF customized
Exploratory Coding
Did
no
t to
par
tici
pat
e
Lower PotentialHigh Potential