how does terms-of-trade behavior shape international finan
DESCRIPTION
Economía y desarrolloTRANSCRIPT

Int. Fin. Markets, Inst. and Money 33 (2014) 335–353
How does terms-of-trade behavior shape internationalfinancial integration in primary-commodity exportingeconomies?
Almukhtar Saif Al-Abri *Department of Economics and Finance Sultan Qaboos University, PO Box 20, Alkod, Muscat 123, Oman
A R T I C L E I N F O
Article history:Received 4 December 2013Received in revised form 29 June 2014Accepted 4 September 2014Available online 16 September 2014
JEL classification:F210F320
Keywords:Terms-of-tradeFinancial globalizationInternational investment positionsForeign direct investmentPortfolio investmentDeveloping countries
A B S T R A C T
This paper presents empirical evidence suggesting that the volatility, trend-growth, andshock-duration of terms-of-trade (TOT) are important drivers of the degree andcomposition of international financial integration (IFI). Our results are based on a panelof 55 primary-commodity exporting countries during 1980–2007. The findings reveal thatTOT trend-growth has larger impact on IFI compared to TOT volatility. Also, higher TOTvolatility is robustly associated with greater cross-holdings of foreign assets and lowercross-holdings of foreign liabilities. Another notable finding is that longer duration of TOTshocks seems to shift IFI towards equity assets.
ã 2014 Elsevier B.V. All rights reserved.
1. Introduction
Over the last three decades the developing countries have become more financially globalized1. However, the degree andspeed of this development is not uniform across the developing countries (Chinn and Ito, 2008; Kose et al., 2009a; Lane andMilesi-Ferretti, 2007). To date, little research has been done to understand the drivers of financial globalization across thedeveloping countries, as research investigating this issue has been largely confined to the developed countries (for example,Furceri et al., 2011; Lane, 2000; Lane and Milesi-Ferretti, 2008)2. The diversity of economic structures, institutionalenvironments, and level of country risk between developed and developing countries warrant a new consideration of thedeterminants of financial globalization.
* Tel.: +968 24142942; fax: +968 24414043.E-mail address: [email protected] (A. Saif Al-Abri).
1 The literature uses “financial openness” and “international financial integration” interchangeably with financial globalization. Financial opennessusually refers to de jure measures of legal restrictions of cross-border capital flows, while international financial integration refers to volume-based de factomeasures of stocks and flows of cross-border assets and liabilities (Chinn and Ito 2008; Lane and Milesi-Ferretti, 2007; Miniane, 2004; Quinn, 2003).
2 A related literature considers the determinants of international capital flows. Broto et al. (2011) has also examined the determinants of volatility ofcapital flows in emerging markets. Terms-of-trade volatility has also been found to affect changes in capital flows. Blattman et al. (2007) find a negativeeffect of terms-of-trade volatility on capital inflow during 1870–1940 for a large sample of developed and developing countries. Calvo et al. (2004) find thatnegative terms-of-trade shocks increase the likelihood of a sudden stop in capital inflows and financial crises.
http://dx.doi.org/10.1016/j.intfin.2014.09.002
Contents lists available at ScienceDirect
Journal of International FinancialMarkets, Institutions & Money
journal homepage: www.elsevier .com/ locat e/ int fin
1042-4431/ ã 2014 Elsevier B.V. All rights reserved.

336 A. Saif Al-Abri / Int. Fin. Markets, Inst. and Money 33 (2014) 335–353
A common feature of most developing countries is the dominance of a few primary commodities in their exports. Theempirical literature suggests that developing countries are fundamentally more exposed to TOT fluctuations (Cashin et al.,2004a; Hausmann et al., 2006). Adverse shocks to a country’s TOT not only disrupt the economy’s growth, but may alsointroduce some level of instability. For example, Mendoza (1995) and Kose (2002) find that TOT shocks account for at leasthalf of the output volatility in developing countries. Although TOT volatility is a key determinant of macroeconomicperformance in a majority of the developing countries, the empirical evidence suggests that there are wide differences acrossthese countries in terms of TOT volatility, trend, and shock persistence. For example, Cashin et al. (2004b) find the TOT shockpersistence to vary widely across 42 Sub-Saharan African countries.
In light of this inherent heterogeneity of TOT fluctuations and IFI in developing countries, it is important for trade andfinancial policy development to investigate the role of TOT fluctuations in shaping IFI. The anticipation is that the findings ofsuch a study would provide more meaningful and robust understanding of the response of cross-holdings of foreign assetsand liabilities to TOT fluctuations. This would help the developing countries determine the sustainability and likelihood offuture trends in IFI. In particular, the findings of this paper can be used as guidelines in designing more effective capitalcontrols and other domestic policies in order to enhance the stability of their international investment positions and attractmore productive financing.
Although the dynamics of TOT are often the centerpiece in open economy models of international adjustment, theoreticalmodels do not provide a clear guide to the effects of TOT volatility on IFI. We draw two hypotheses from the different strandsof the literature. One hypothesis suggests that, to smooth domestic consumption and investment, countries with morevolatile environments seek more financial integration with the rest of the world. In this case, greater fluctuations in TOTincrease the level of international risk-sharing and IFI (Svensson, 1988; Obstfeld and Rogoff, 1996; Lane, 2001). On thecontrary, international portfolio models suggest that higher volatility in TOT could result in fluctuations in real returns toforeign investment, which might deter foreign investors and, thus, lead to lower IFI (Devereux and Sutherland, 2009). Also,the classic risk-sharing model of Cole and Obstfeld (1991) suggests that TOT changes can act as an automatic stabilizer whenthey are negatively correlated to output fluctuations, reducing the motive for international risk-sharing. The empiricalliterature that attempted to verify the implications of these two hypotheses mostly concentrate on the effects of TOTvolatility on capital flows (for example, Blattman et al., 2007; Broto et al., 2011; Eichengreen, 1996; Mendoza and Terrones,2008). We deviate from this literature by examining the effects of TOT volatility, trend changes, and shock persistence on thesize of different forms of cross-holdings of foreign assets and liabilities. As discussed in Kose et al. (2009a), the use of grossstocks is preferable to annual capital flows in measuring international integration, as the latter tend to be more volatile andprone to measurement errors. In addition, the use of gross stocks, compared to net stocks, provides a better measure ofintegration and efficient risk-sharing as it captures two-way interactions between economies with different risk portfolios.
The paper contributes to the literature by addressing the TOT–IFI nexus in a number of distinct ways. First, the paperfocuses on a more homogenous panel and emphasizes the long-run nature of the relationship by taking 5-yearnon-overlapping windows of the data. Previous empirical studies were based on cross section samples (for example, Lane,2000). Second, the relationship is analyzed using sub-measures of financial integration, including foreign direct investment(FDI - hereafter), foreign portfolio equity, and foreign debt. The association is also analyzed separately with respect tocross-holdings of foreign assets and foreign liabilities for these sub-measures. These detailed investigations provide deeperinsights into the nature and channels of association of TOT movements and IFI. This is important because differences inthe composition of foreign assets and liabilities have important effects on real activity (Bosworth and Collins, 1999), on theprobability of sudden stops (Calvo, 2007), on banking and currency crises (Furceri et al., 2012), and on the real exchange ratevolatility (Al-Abri, 2013).
Third, while previous studies mainly used TOT volatility as their only measure of TOT fluctuations, this paper employs twoother measures of TOT fluctuations: trend-growth and shock-duration. The theoretical literature and the internationalevidence suggest that cross-country average growth rates depend on the mean and the variance of the rate of change of TOT(Blattman et al., 2007; Mendoza, 1997; Turnovsky and Chattopadhyay, 2003)3. Since the impact of TOT on cross holdings offoreign assets and liabilities should depend on the effects of the former on national income and savings (Devereux andSutherland, 2009; Obstfeld and Rogoff,1996), we include both the trend-growth and volatility of TOT in our empirical model.For the TOT shock-duration, the inter-temporal approach to the current account and the consumption smoothing behaviorpredict that if TOT shocks are short-lived then it is a sensible strategy to use external financing to smooth consumption.However, if TOT shocks are long-lived then relying on external financing is not sustainable and should eventually lead tolong-term changes in consumption and saving (Cashin and McDermott, 2003; Obstfeld, 1982; Ostry and Reinhart, 1992).Thus, these studies suggest that the impact of TOT on IFI depends crucially on the expected duration of the TOT shock. Thetrend-growth is calculated using the smoothing procedure of Hodrick–Prescott (HP) filters. The shock-duration is measuredusing the “half-life” of shocks, as proposed by Andrews (1993). To our knowledge, no previous study has analyzed the impactof TOT trend changes and shock persistence on IFI or its sub-components. Fourth, the paper analyzes the possibility ofnon-linearities by allowing the impact of TOT volatility on IFI to vary with a number of factors including: trade openness,export diversification, financial development, economic development, and nominal exchange rate flexibility.
3 Mendoza (1997) shows that TOT average growth and volatility are both needed for the model to be properly specified.
A. Saif Al-Abri / Int. Fin. Markets, Inst. and Money 33 (2014) 335–353 337
The paper also provides a notable contribution to the literature on international risk-sharing in the developing countries.The literature that examines the level of risk sharing focuses on the correlation of consumption and output. For example,Kose et al. (2009b) find that despite greater financial globalization, developing countries have little ability to share risk due tothe dominance of debt assets in their portfolio. Theoretically, greater financial integration would help a country stabilize itsnational consumption and investment against adverse shocks through international risk-sharing and inter-temporalsubstitution (Obstfeld and Rogoff, 1996). Our analysis provide an alternative examination of the degree of risk-sharingin the developing countries. Since TOT are dominant and exogenous to primary-commodity countries, the response ofcross-holdings of foreign assets to these exogenous idiosyncratic shocks reflects the degree of risk-sharing.
Using a sample of 55 primary commodity-exporting countries for the period 1980–2007, the results of this paper suggestthat TOT volatility, trend, and shock-duration are important long-term drivers of IFI in primary commodity-exportingcountries4,5. This is robust across the different components of foreign assets and foreign liabilities (FDI, debt, and portfolioequity investments) and different sub-samples of countries and time periods. The results are also robust to alternativeestimation methods, and to possible variations in the definitions of volatility and growth of TOT. The findings uncover anumber of interesting patterns. Although TOT has a negative impact on the aggregate IFI measure (consistent with Lane(2000)’s findings for developed counties), higher TOT volatility is robustly associated with greater holdings of foreign assetsand lower holdings of foreign liabilities. This evidence helps bridging the two hypotheses, outlined above, which predict theeffects of TOT changes on foreign cross-holdings. The size of parameter estimates suggests that TOT trend-growth has largerimpact on IFI compared to TOT volatility. In addition, cross-holdings of portfolio assets seem more responsive to TOTvolatility and trend changes compared to FDI. Furthermore, the findings suggest that the effects of TOT volatility on IFI areincreasing in the level of trade openness and financial development, and decreasing in the level of financial openness andeconomic development. Another notable finding is that longer duration of TOT shocks seems to shift financial globalizationtowards equity assets and away from debt assets.
The structure of the paper is as follows. Section 2 provides some salient features of IFI and TOT movements. Section 3discusses the conceptual frameworks linking IFI to TOT volatility. Section 4 describes the methodology and data. Section 5discusses the results, and Section 6 concludes.
0.6
0.8
1.0
1.2
1.4
1.6
1.8
2.0
-1.0
-0.8
-0.6
-0.4
-0.2
0.0
0.2
0.4
80 82 84 86 88 90 92 94 96 98 00 02 04 06
IFI KAOPEN
%of
GD
P IND
EX
Year
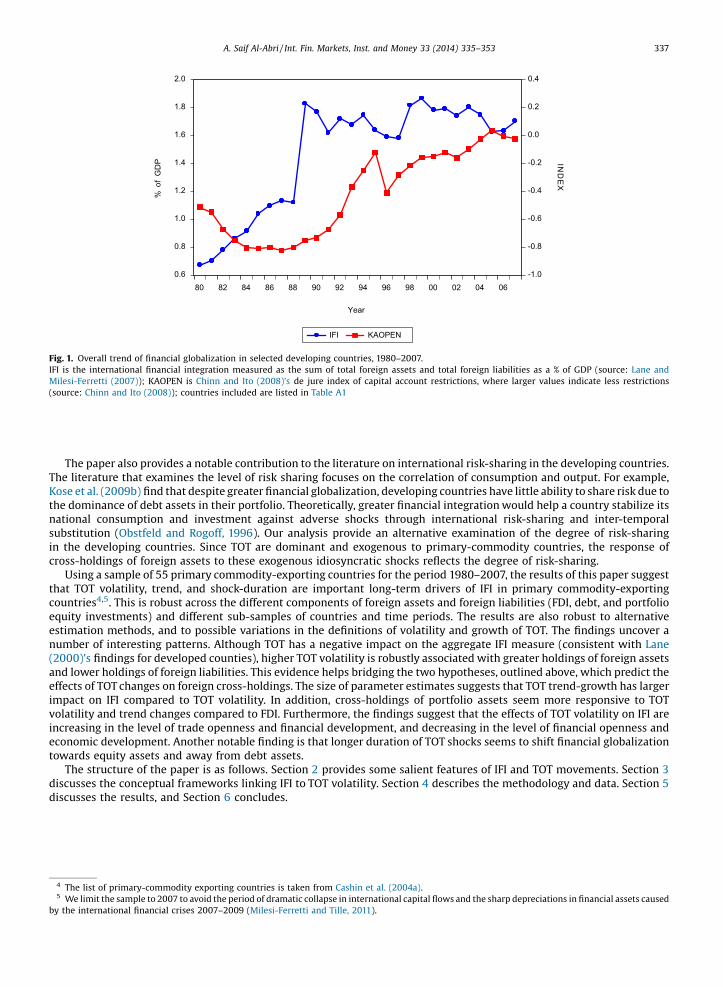
Fig. 1. Overall trend of financial globalization in selected developing countries, 1980–2007.IFI is the international financial integration measured as the sum of total foreign assets and total foreign liabilities as a % of GDP (source: Lane andMilesi-Ferretti (2007)); KAOPEN is Chinn and Ito (2008)’s de jure index of capital account restrictions, where larger values indicate less restrictions(source: Chinn and Ito (2008)); countries included are listed in Table A1
4 The list of primary-commodity exporting countries is taken from Cashin et al. (2004a).5 We limit the sample to 2007 to avoid the period of dramatic collapse in international capital flows and the sharp depreciations in financial assets caused
by the international financial crises 2007–2009 (Milesi-Ferretti and Tille, 2011).

338 A. Saif Al-Abri / Int. Fin. Markets, Inst. and Money 33 (2014) 335–353
2. Financial globalization and TOT volatility
The last three decades have witnessed significant changes in the financial globalization map of the developing countries.During the 1980s and 1990s, many developing countries had liberalized their capital accounts, experiencing dramaticgrowth in their gross cross-holdings of foreign assets and liabilities6. For a group of 55 developing countries, Fig.1 depicts theoverall trend in two measures of financial integration: a de facto volume-based measure of total foreign assets and totalforeign liabilities as a share of GDP (International financial integration – IFI) and a de jure index representing the degree ofcapital account liberalization (KAOPEN) of Chinn and Ito (2008). In both measures, larger values indicate higher degree offinancial globalization.
According to the patterns noted in Fig. 1, it is clear that the two measures do not follow the same pattern. The de juremeasure shows a progressive and steady relaxation of capital controls in these countries after 1987 (except for a short periodfollowing the Asian financial crisis of 1997). However, the volume-based measure of cross-holdings of foreign assets andliabilities (IFI) shows a substantial acceleration during 1980s, a mixed path during 1990s, and a negative trend during 2000s.
To gain further insights into the extent and composition of financial globalization in the developing countries, Fig. 2depicts the overall trend in gross cross-holdings of FDI (TFDI) and foreign debt (TD) for a group of 55 developing countries.Two notable patterns stand out. First, although debt assets (portfolio debt, bank loans and deposits, and other debtinstruments) are still the dominant form of cross-holdings of foreign assets and liabilities, it shows a downward trend after19907. Second, the share of FDI shows a steady increase throughout the period 1980–2007, with higher speed after 1990.These patterns indicate that financial globalization in the developing countries has increasingly been favoring long-termequity integration (i.e., FDI). Further decomposition of financial globalization in the developing countries is provided in thethree panels of Fig. 3. These depict the trend in aggregate foreign assets and foreign liabilities, FDI assets and liabilities, anddebt assets and liabilities, respectively. At the aggregate level, the share of foreign assets is increasing and the share of foreignliabilities is decreasing, suggesting that net foreign position in the developing countries is slowly improving. The samepattern is also observed in the changes of cross-holdings of debt assets and liabilities. However, this observation is notcarried forward to FDI as foreign assets have shown slower growth compared to foreign liabilities. In other words, the net FDI(FDI assets less FDI liabilities) of developing countries has decreased. These observations support the notion that developingcountries participate in cross country risk-sharing by accumulating debt assets claim on advanced countries, while alsoissuing claims in the form of FDI liabilities that are held by residents of advanced countries (Devereux and Sutherland, 2009;Lane and Milesi-Ferretti, 2007).
Despite these overall trends of financial globalization in the developing countries, it is important to note that countriesexhibit considerable heterogeneity in terms of the size and composition of their IFI. Table 1 reports the total foreign assetsand foreign liabilities for the aggregate measure of financial integration and its subcomponents, averaged for the period
0.0
0.4
0.8
1.2
1.6
2.0
80 82 84 86 88 90 92 94 96 98 00 02 04 06
TD TFDI IFI
% o
f GD
P
Year
Fig. 2. Overall trend of financial globalization for selected developing countries using different forms of foreign investment, 1980–2007.IFI is the international financial integration measured as the sum of total foreign assets and total foreign liabilities as a % of GDP; TFDI is the sum of foreigndirect investment assets and liabilities as a % of GDP; TD is the sum of foreign debt assets and liabilities as a % of GDP; source: Lane and Milesi-Ferretti(2007); countries included are listed in Table A1.
6 Capital flows to developing countries have also witnessed important changes in terms of size and composition. Capital flows to developing countrieshave become mostly private (compared to official flows-grants and loans from governments and multilateral institutions), have increased dramatically, andhave been dominated by foreign direct investment (Kose et al., 2009a).
7 As defined by Lane and Milesi-Ferretti, 2007 (pp. 228), the debt category is the sum of portfolio debt securities, bank loans and deposits, and other debt
instruments.
A. Saif Al-Abri / Int. Fin. Markets, Inst. and Money 33 (2014) 335–353 339
1980–2007 and grouped by geographic locations. As can be seen, for the aggregate measure, IFI, and its subcomponents, thedegree of financial globalization varies widely across these countries. In summary, there is clear evidence not just of anincrease in financial globalization for developing countries, but also of a movement in components of foreign cross-holdings.
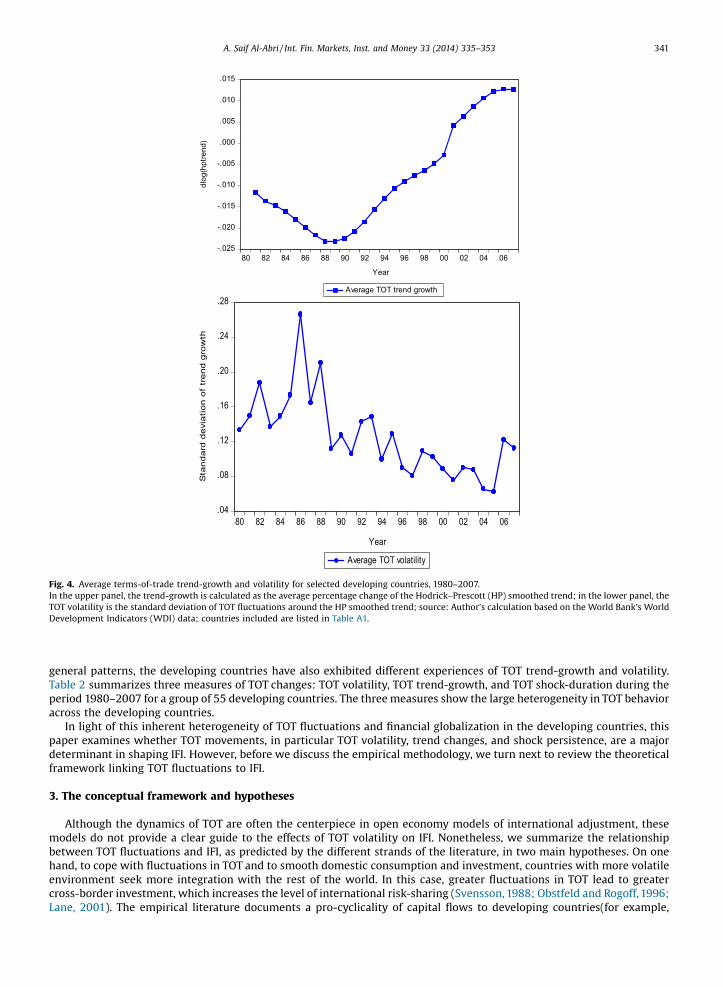
The trend and volatility of TOT in the developing countries have also showed dramatic changes over the past threedecades. In general, the TOT average volatility had peaked during 1985–1987, showed a downward trend subsequently,before it turned upward again after 2004 (Fig. 4, lower panel). On the other hand, the TOT average trend-growth showed adownward trend during the period 1980–1989 and a strong upward trend after 1990 (Fig. 4, upper panel). Despite these
-0.8
-0.4
0.0
0.4
0.8
1.2
1.6
2.0
80 82 84 86 88 90 92 94 96 98 00 02 04 06
IFI NFA TFA TFL
%of
GDP
Year
.0
.1
.2
.3
.4
.5
80 82 84 86 88 90 92 94 96 98 00 02 04 06
TFDI FDIL FDIA
%of
GDP
Year
0.0
0.4
0.8
1.2
1.6
2.0
80 82 84 86 88 90 92 94 96 98 00 02 04 06
TD DA DL
%of
GDP
Year
Fig. 3. Decomposition of different forms of international financial integration for selected developing countries, 1980–2007.In the upper panel, IFI is the international financial integration measured as the sum of total foreign assets (TFA) and total foreign liabilities (TFL); NFA is thenet foreign assets measured as total foreign assets minus total foreign liabilities; in the middle panel, TFDI is the sum of foreign direct investment assets(FDIA) and foreign direct investment liabilities (FDIL); in the lower panel, TD is the sum of foreign debt assets (DA) and debt liabilities (DL); all measures areexpressed as a % of GDP; source: Lane and Milesi-Ferretti (2007); countries included are listed in Table A1.

Table 1Different forms of cross-holdings of foreign assets and liabilities in selected developing countries, 1980–2007.
African countries IFI TFA TFL TD DA DL PEA TFDI FDIA FDIL
Burundi 1.294 0.300 0.994 1.152 0.208 0.943 0.000 0.052 0.001 0.051Cameroon 0.728 0.113 0.615 0.553 0.073 0.480 0.000 0.151 0.017 0.134Central African Republic 0.976 0.193 0.783 0.713 0.061 0.652 0.000 0.155 0.024 0.131Cote d’Ivoire 1.641 0.239 1.402 1.439 0.186 1.253 0.010 0.148 0.002 0.146Ethiopia 0.786 0.127 0.660 0.652 0.077 0.575 0.000 0.084 0.000 0.084Gabon 0.976 0.227 0.749 0.671 0.130 0.541 0.001 0.252 0.055 0.197Ghana 1.064 0.216 0.848 0.803 0.129 0.674 0.000 0.161 0.008 0.153Kenya 0.946 0.233 0.712 0.763 0.159 0.604 0.003 0.117 0.011 0.106Madagascar 1.160 0.166 0.995 1.046 0.110 0.937 0.000 0.058 0.001 0.056Malawi 1.296 0.155 1.141 1.080 0.090 0.990 0.000 0.151 0.002 0.149Mali 1.220 0.187 1.033 1.010 0.074 0.936 0.000 0.103 0.011 0.092Mauritania 2.230 0.245 1.985 1.882 0.169 1.712 0.000 0.274 0.001 0.273Mauritius 0.686 0.272 0.414 0.407 0.073 0.334 0.008 0.087 0.016 0.071Mozambique 1.685 0.237 1.448 1.424 0.130 1.294 0.002 0.152 0.000 0.152Niger 1.030 0.174 0.856 0.750 0.064 0.686 0.000 0.208 0.040 0.169Nigeria 1.444 0.324 1.120 0.912 0.147 0.764 0.000 0.403 0.052 0.351Senegal 1.050 0.202 0.848 0.846 0.127 0.719 0.004 0.140 0.018 0.122South Africa 0.867 0.345 0.522 0.298 0.067 0.231 0.103 0.328 0.148 0.180Sudan 1.323 0.096 1.227 1.221 0.083 1.138 0.000 0.087 0.000 0.087Tanzania 1.377 0.289 1.089 1.161 0.197 0.964 0.000 0.124 0.000 0.123Togo 1.744 0.375 1.369 1.192 0.194 0.998 0.004 0.339 0.012 0.326Uganda 0.835 0.182 0.653 0.663 0.104 0.558 0.000 0.094 0.000 0.094Zambia 2.375 0.205 2.170 1.834 0.150 1.684 0.000 0.483 0.000 0.483
Asian countriesBangladesh 0.505 0.074 0.431 0.404 0.034 0.370 0.000 0.061 0.001 0.061India 0.364 0.090 0.273 0.224 0.018 0.206 0.001 0.035 0.005 0.029Indonesia 0.901 0.185 0.716 0.679 0.080 0.600 0.001 0.093 0.009 0.084Malaysia 1.571 0.593 0.977 0.632 0.175 0.457 0.015 0.486 0.113 0.373Pakistan 0.612 0.096 0.515 0.493 0.048 0.445 0.001 0.062 0.005 0.056Papua New Guinea 1.397 0.278 1.119 0.751 0.107 0.644 0.005 0.440 0.039 0.401Philippines 1.109 0.270 0.839 0.829 0.149 0.680 0.008 0.130 0.018 0.112Sri Lanka 0.901 0.209 0.692 0.708 0.115 0.594 0.000 0.095 0.002 0.093Thailand 0.955 0.274 0.681 0.504 0.075 0.429 0.002 0.175 0.016 0.159
Latin American countriesArgentina 1.156 0.454 0.702 0.862 0.329 0.533 0.029 0.179 0.030 0.149Bolivia 1.285 0.249 1.036 0.923 0.164 0.759 0.000 0.279 0.003 0.276Brazil 0.657 0.160 0.497 0.384 0.060 0.323 0.004 0.166 0.044 0.122Chile 1.501 0.505 0.996 0.758 0.191 0.567 0.082 0.452 0.067 0.385Colombia 0.742 0.256 0.486 0.476 0.130 0.346 0.006 0.152 0.021 0.132Costa Rica 1.123 0.330 0.793 0.770 0.225 0.545 0.003 0.249 0.007 0.243Dominica 1.689 0.643 1.045 1.024 0.547 0.477 0.000 0.569 0.000 0.569Dominican Republic 0.660 0.097 0.564 0.423 0.060 0.364 0.002 0.201 0.002 0.200Ecuador 1.105 0.107 0.998 0.830 0.042 0.788 0.000 0.211 0.003 0.207Guatemala 0.575 0.228 0.348 0.408 0.156 0.253 0.000 0.097 0.003 0.095Honduras 1.406 0.347 1.059 1.081 0.246 0.835 0.000 0.223 0.001 0.222Mexico 0.779 0.177 0.602 0.500 0.104 0.396 0.007 0.155 0.012 0.143Nicaragua 3.422 0.319 3.103 3.119 0.223 2.896 0.000 0.212 0.005 0.206Paraguay 0.885 0.376 0.509 0.605 0.218 0.387 0.001 0.144 0.023 0.122Peru 1.072 0.246 0.826 0.729 0.095 0.634 0.024 0.165 0.007 0.159St. Vincent and the Grenadines 1.301 0.327 0.974 0.525 0.204 0.321 0.000 0.653 0.000 0.653Uruguay 1.355 0.563 0.792 1.201 0.502 0.699 0.003 0.129 0.005 0.124Venezuela, RB 1.284 0.607 0.677 0.905 0.409 0.496 0.015 0.196 0.042 0.154
Middle Eastern countriesAlgeria 0.758 0.261 0.497 0.511 0.074 0.437 0.000 0.064 0.005 0.059Morocco 1.083 0.264 0.819 0.784 0.132 0.652 0.004 0.165 0.009 0.156Saudi Arabia 1.390 1.051 0.340 1.025 0.890 0.135 0.005 0.229 0.027 0.202Tunisia 1.292 0.148 1.144 0.621 0.048 0.573 0.011 0.538 0.001 0.537Turkey 0.647 0.158 0.489 0.493 0.089 0.404 0.003 0.072 0.007 0.065
Notes: IFI is the international financial integration measured as the sum of total foreign assets (TFA) and total foreign liabilities (TFL); TFDI is the sum offoreign direct investment assets (FDIA) and foreign direct investment liabilities (FDIL); TD is the sum of foreign debt assets (DA) and debt liabilities (DL); allmeasures are expressed as a % of GDP; source: Lane and Milesi-Ferretti (2007).
340 A. Saif Al-Abri / Int. Fin. Markets, Inst. and Money 33 (2014) 335–353
A. Saif Al-Abri / Int. Fin. Markets, Inst. and Money 33 (2014) 335–353 341
general patterns, the developing countries have also exhibited different experiences of TOT trend-growth and volatility.Table 2 summarizes three measures of TOT changes: TOT volatility, TOT trend-growth, and TOT shock-duration during theperiod 1980–2007 for a group of 55 developing countries. The three measures show the large heterogeneity in TOT behavioracross the developing countries.
In light of this inherent heterogeneity of TOT fluctuations and financial globalization in the developing countries, thispaper examines whether TOT movements, in particular TOT volatility, trend changes, and shock persistence, are a majordeterminant in shaping IFI. However, before we discuss the empirical methodology, we turn next to review the theoreticalframework linking TOT fluctuations to IFI.
3. The conceptual framework and hypotheses
Although the dynamics of TOT are often the centerpiece in open economy models of international adjustment, thesemodels do not provide a clear guide to the effects of TOT volatility on IFI. Nonetheless, we summarize the relationshipbetween TOT fluctuations and IFI, as predicted by the different strands of the literature, in two main hypotheses. On onehand, to cope with fluctuations in TOT and to smooth domestic consumption and investment, countries with more volatileenvironment seek more integration with the rest of the world. In this case, greater fluctuations in TOT lead to greatercross-border investment, which increases the level of international risk-sharing (Svensson, 1988; Obstfeld and Rogoff, 1996;Lane, 2001). The empirical literature documents a pro-cyclicality of capital flows to developing countries(for example,
-.025
-.020
-.015
-.010
-.005
.000
.005
.010
.015
80 82 84 86 88 90 92 94 96 98 00 02 04 06
Average TOT trend growth
Year
dlog
(hpt
rend
)
.04
.08
.12
.16
.20
.24
.28
80 82 84 86 88 90 92 94 96 98 00 02 04 06
Average TOT volatility
Year
Sta
nd
ard
de
via
tio
no
ftr
en
dg
row
th
Fig. 4. Average terms-of-trade trend-growth and volatility for selected developing countries, 1980–2007.In the upper panel, the trend-growth is calculated as the average percentage change of the Hodrick–Prescott (HP) smoothed trend; in the lower panel, theTOT volatility is the standard deviation of TOT fluctuations around the HP smoothed trend; source: Author’s calculation based on the World Bank’s WorldDevelopment Indicators (WDI) data; countries included are listed in Table A1.

Table 2Terms-of-trade volatility, average trend-growth, and duration of shocks in selected developing countries, 1980–2007.
African countries TOT volatility Average TOT trend-growth TOT shock-duration
Burundi 0.290 �0.008 3.1Cameroon 0.104 0.018 0.7Central African Republic 0.190 �0.037 3.7Cote d'Ivoire 0.213 �0.005 2.4Ethiopia 0.139 0.000 1.1Gabon 0.282 �0.012 4.7Ghana NA 0.001 2.1Kenya 0.067 �0.002 2.6Madagascar 0.077 �0.009 1.6Malawi 0.123 -0.024 1.0Mali 0.079 0.011 3.6Mauritania 0.080 0.024 4.9Mauritius 0.046 �0.006 4.9Mozambique 0.104 �0.024 2.4Niger 0.145 �0.007 11.6Nigeria 0.186 0.005 4.4Senegal 0.096 �0.015 2.2South Africa 0.050 0.009 8.1Sudan 0.132 0.027 5.4Tanzania 0.070 �0.001 1.7Togo 0.145 �0.066 3.0Uganda 0.342 �0.027 1.6Zambia 0.363 0.008 2.2
Asian countriesBangladesh 0.063 �0.035 2.8India 0.078 0.022 1.4Indonesia 0.114 �0.012 4.1Malaysia 0.042 0.014 5.1Pakistan 0.091 �0.040 7.3Papua New Guinea 0.201 0.055 0.7Philippines 0.085 �0.009 2.1Sri Lanka 0.039 �0.034 2.1Thailand 0.050 �0.011 1.2
Latin American countriesArgentina 0.073 0.012 1.0Bolivia 0.109 �0.003 5.3Brazil 0.071 0.020 1.5Chile 0.142 0.000 14.7Colombia 0.081 0.009 3.1Costa Rica 0.072 �0.002 2.5Dominica 0.057 0.006 0.3Dominican Republic 0.101 �0.018 2.1Ecuador 0.118 �0.014 3.8Guatemala 0.135 �0.012 0.3Honduras 0.103 �0.009 1.3Mexico 0.134 �0.031 4.9Nicaragua 0.132 �0.022 0.3Paraguay 0.097 0.014 1.4Peru 0.127 �0.010 4.5St. Vincent and the Grenadines 0.097 0.016 4.0Uruguay 0.084 �0.007 1.0Venezuela, RB 0.180 0.015 7.3
Middle Eastern and North African countriesAlgeria 0.208 0.005 5.6Morocco 0.066 0.016 1.2Saudi Arabia 0.297 0.091 0.6Tunisia 0.039 �0.007 3.2Turkey 0.047 �0.004 1.7
Notes: TOT trend-growth and TOT volatility are defined in Table A2; TOT shock-duration is the half-life of TOT shocks. For an AR(1) process thehalf-life is calculated as TOT_hf = abs(ln (0.5)/ln (b)), where b is the autoregressive parameter obtained from the regression TOTt ¼ a þ bTOTt�1þ
ct þ Pp�1
t¼1diDTOTt�i þ et; source: author’s calculation based on the World Bank’s World Development Indicators (WDI) data.
342 A. Saif Al-Abri / Int. Fin. Markets, Inst. and Money 33 (2014) 335–353

A. Saif Al-Abri / Int. Fin. Markets, Inst. and Money 33 (2014) 335–353 343
Kaminsky et al., 2005; Gavin et al., 1996; Mendoza and Terrones, 2008). Also, the empirical evidence suggests that thecorrelation between TOT and business cycles in developing countries is lower with greater financial globalization(Bhattacharya et al., 2013). For example, foreign direct investment is seen to ease financing constraints, especially for thelow-income countries (Harrison et al., 2004). In addition, Blalock and Gertler (2005) find that FDI mitigates the effects ofadverse shocks by helping firms maintain continuous access to credit through their parent companies.
On the other hand, higher TOT volatility can work in the opposite direction and reduce the level of IFI. That is, highervolatility in terms-of-trade could result in fluctuations in real return to foreign investment, which might deter foreigninvestors and thus lead to lower IFI. For example, international portfolio models, such as Devereux and Sutherland (2009),postulate that relative price volatility would affect IFI negatively. In addition, the seminal two good-two country trade modelof risk-sharing of Cole and Obstfeld (1991) shows that TOT changes can act as an automatic stabilizer when they arenegatively correlated with output fluctuations, reducing the motive for international risk-sharing. In this case, TOTfluctuations provide insurance rather than being a source of risk and, in effect, reduce IFI. However, the empirical findingssuggest that TOT are only weakly correlated with output (Backus et al., 1994). Also, Coeurdacier et al. (2010) show that thelevel of international diversification does not strongly depend on countercyclical TOT. Further, Berka et al. (2012) find thatTOT fluctuations offset commodity-specific shocks, but not country-specific shocks, thus, leaving room for internationalasset accumulation to stabilize consumption. As for the empirics, Eichengreen (1996) finds that both negative trend andvolatility in the TOT depressed capital inflows for many developing countries.
Since the theoretical models do not provide a clear guide to the effects of TOT volatility on IFI, this is essentially anempirical question. The empirical literature that attempted to verify the implications of these two hypotheses mostlyconcentrate on the effects of TOT volatility on capital flows. We deviate from this literature by examining the effects of TOTvolatility, trend changes, and shock persistence on the size of different forms of cross-holdings of foreign assets andliabilities.
4. Data and methodology
4.1. Empirical model
The theoretical and empirical literature on IFI and international investment positions suggest a number of factors thatdetermine this relationship. These include the level of economic and financial development, capital account restrictions,trade openness, economic stability and policy environment, institutional quality, and the size of the market (Alfaro et al.,2008; Blattman et al., 2007; Lane, 2000; Lane and Milesi-Ferretti, 2008; Martin and Rey, 2004). The primary focus of thisstudy is to quantify the long-run association of patterns of TOT changes and IFI. Our baseline model takes the followingspecification:
IFIit ¼ c þ gTOTit þ dTOTGit þ fXit þ mi þ ut þ eit (1)
where i refers to each of the 55 countries in the sample and t refers to the time period from 1980 to 2007. In the estimations,IFIit represents either aggregate or a component of international financial integration: FDI, portfolio equity holdings, orforeign debt; each expressed as a percentage of the GDP. For a comprehensive examination, we analyze separately the stocksof foreign assets and the stocks of foreign liabilities for each of these components as well as for the aggregate level. TheTOTGit is the TOT trend-growth measured by the percentage change in the TOT trend over the 5-year interval, while TOTVit isthe TOT volatility measured by the standard deviation of departure from the trend over the 5-year interval. Xit is a vector ofother control variables including: initial real output per capita, inflation rate, level of trade openness, capital accountrestrictions, level of financial development, share of primary-commodities in total exports (export diversification), level ofinstitutional quality (policy and regulatory environment), education, and the degree of flexibility in the exchangerate regime. mt is unobserved country-specific effect, ut is unobserved period-specific effect, while eit is random error. Allvariable measures and sources are presented in the Appendix A. The model is estimated using OLS with country fixed effectsand time period dummies. All standard errors are heteroskedasticity-robust.
TOT is exogenous to the countries included in the sample as they are price-takers in the world market, they cannotinfluence the prices of the goods they import and the prices of commodities they export (Broda, 2004; Frankel, 2010)8. SinceTOT can be assumed exogenous to these countries, we do not need to include the other control variables beside the TOTvariables. In other words, the empirical model is not vulnerable to omitted variable bias. However, we find that the standarderrors are lower when we add independent variables.
The empirical estimations are carried out using 5-year non-overlapping windows to filter out business cycle fluctuationsand to mitigate the problem of reverse causality. We also find 5-year windows better account for the commodity cycles thatshape the behavior of TOT, as suggested by Cashin et al. (2004b). The results remain robust to using shorter or longertime-windows.
8 Saudi Arabia might be an exception given its large size in world crude oil markets. We address this issue in the “Diagnosis and robustness” part of
Section 5.
344 A. Saif Al-Abri / Int. Fin. Markets, Inst. and Money 33 (2014) 335–353
4.2. Data
The measures of IFI that we use are drawn from the dataset of Lane and Milesi-Ferretti (2007), which comprises stocks ofgross foreign liabilities and foreign assets categorized into foreign direct investment, portfolio equity investment, debt andother investment, and official reserves9. As discussed in Kose et al. (2009a), the use of gross stocks is preferable to annualcapital flows in measuring international integration, as the latter tend to be more volatile and prone to measurement errors.In addition, the use of gross stocks, compared to net stocks, provides a better measure of integration and efficientrisk-sharing as it captures two-way interactions between economies with different risk portfolios. All other variables aretaken from the World Bank’s World Development Indicators (WDI) database.
For economic development we use initial level of real GDP per capita (expressed relative to the US real GDP per capita).The GDP per capita controls also for market size. For capital account restrictions, we use the de jure index, KAOPEN, of Chinnand Ito (2008). This index embodies four binary dummy variables on restrictions taken from the IMF’s Annual Report onExchange Arrangements and Exchange Restrictions (AREAER). Due to the lack of a consistent measure of institutional qualitythat provides a good coverage for our sample period, we use the volatility of inflation to proxy the uncertainty about thepolicy environment and the institutional quality10. For education, we use high school enrollments as a percentage ofpopulation. Following the literature, education is a proxy for human capital (Alfaro et al., 2008). The flexibility of the nominalexchange rate is measured by the de facto categorical measure of Reinhart and Rogoff (2004). Devarajan and Rodrick (1991)show that countries faced with higher volatility in their TOT would benefit by having more flexible exchange rate regimes.Table 3 shows the descriptive statistics.
4.3. Decomposition of terms-of-trade fluctuations
We decompose TOT movements into two components, trend and volatility, using a Hodrick–Prescott (HP) filter toproduce a smoothed trend and stationary deviations. An alternative measure is to use the TOT growth rate and its standard
Table 3Descriptive statistics of the full sample, 5-year non-overlapping windows, 1980–2007, 55 countries.
Mean Median Maximum Minimum Std. Dev. Observations
Dependent variableInternational financial integration – IFI (logs) 0.062 0.053 3.238 �1.758 0.631 335Total foreign assets – TFA (logs) �1.437 �1.475 2.584 �3.455 0.892 335Total foreign liabilities – TFL (logs) �0.280 �0.287 2.504 �3.052 0.654 335Total debt – TD (logs) �0.339 �0.351 3.195 �2.193 0.689 335Debt assets – DA (logs) �2.103 �2.095 2.525 �5.027 1.001 335Debt liabilities – DL (logs) �0.637 �0.646 2.479 �3.232 0.746 335Portfolio equity assets – PEA (logs) �3.643 �3.904 0.385 �3.912 0.647 335Total foreign direct investment – TFDI (logs) �1.847 �1.817 0.920 �4.284 0.949 335Foreign direct investment assets – FDIA (logs) �3.387 �3.672 0.050 �3.913 0.691 335Foreign direct investment liabilities – FDIL (logs) �1.858 �1.858 0.405 �3.737 0.852 335
TOT variablesTOT volatility 0.094 0.063 0.714 0.003 0.093 329TOT average trend-growth �0.004 �0.003 0.137 �0.139 0.039 335
Other determinantsInitial GDP per capita 10.245 10.309 10.646 6.902 0.392 335Trade openness (logs) 4.080 4.095 6.065 2.481 0.567 335Private credit (logs) 3.195 3.168 5.012 0.643 0.784 335Exchange rate flexibility 2.321 2.000 6.000 1.000 1.142 335Financial openness �0.347 �0.949 2.456 �1.856 1.274 335Export diversification 2.320 2.460 4.596 �3.493 1.516 320Population 16.439 16.487 21.014 11.124 1.780 336Inflation volatility 8.786 5.229 775.468 0.000 41.834 320Education 3.606 3.805 4.697 1.037 0.781 325Real output volatility 0.031 0.018 1.501 0.003 0.094 335Real exchange rate volatility 0.127 0.074 5.624 0.006 0.326 320
Notes: for detailed description and sources of these variables, see Table A2.
9 Changes in international investment positions reflect both transactional and revaluation components. This is to say that changes in the position couldoccur without an accompanying change in the flow. The dataset of Lane and Milesi-Ferretti (2007) is adjusted for exchange rate fluctuations and changes instock market values.10 For example, the World Bank’s Country Policy Institutional Assessments (CPIA) and other World Bank’s governance indicators are only available from
2005 for most of the countries in our sample.
A. Saif Al-Abri / Int. Fin. Markets, Inst. and Money 33 (2014) 335–353 345
deviation. As discussed by Blattman et al. (2007), if the estimation is carried for separate intervals (e.g., 5-yearnon-overlapping windows), then such measures are sensitive to pronounced changes at the end points of the intervals,leading to measurement errors and biased estimates, especially for more volatile countries. Also, it is difficult to analyze theeffects of structural changes in the TOT or of discrete changes in its growth rate as they are reflected in the trend and thevolatility. Our results are robust to using alternative measures of TOT growth and volatility.
5. Results and discussion
5.1. Total foreign assets and total foreign liabilities
The estimations based on Eq. (1) with the aggregate measures of foreign cross-holdings: international financialintegration (IFI), total foreign assets (TFA), and total foreign liabilities (TFL) are reported for the full sample in Table 4(columns 1–3). The signs and magnitude of the parameter estimates for the other determinants are generally in line withsimilar studies (for example, Lane, 2000; Lane and Milesi-Ferretti, 2008; Martin and Rey, 2004)11.
More importantly, the parameter estimates of the TOT volatility is negatively related to the aggregate measure of IFI. Thepoint estimate is both statistically and economically significant, which indicates that raising one standard deviation in TOTvolatility (an increase from its average of 0.094–0.187) decreases the IFI position from its mean of 106% of GDP to 100%.However, the impact of TOT volatility is not the same across total foreign assets (TFA) and total foreign liabilities (TFL). Theparameter estimates associated with the TOT volatility for TFA (a parameter estimate of 0.344) and for TFL (a parameter
Table 4OLS panel regression of full sample, 1980–2007 dependent variable: the alternative measures of international financial integration.
(1) (2) (3) (4) (5) (6) (7) (8) (9) (10)
Dependent variable IFI TFA TFL TD DA DL PEAa TFDI FDIA FDILIndependent variablesTOT volatility �0.373 0.344 �0.707 �0.817 0.442 �1.083 0.418 �0.196 0.251 0.024
(0.112)*** (0.078)*** (0.165)*** (0.205)*** (0.226)* (0.224)*** (0.057)*** (0.059)*** (0.101)** (0.075)
TOT trend-growth �1.099 �0.645 �1.57 �2.066 �0.982 �2.398 �0.442 0.167 0.307 0.153(0.339)*** (0.317)** (0.391)*** (0.449)*** (0.474)** (0.576)*** (0.146)*** (0.197) (0.292) (0.311)
Economic development 0.581 1.725 0.163 0.110 1.353 �0.276 0.390 1.376 0.602 1.178(0.075)*** (0.062)*** (0.090)* (0.108) (0.098)*** (0.132)** (0.031)*** (0.092)*** (0.058)*** (0.071)***
Trade openness 0.265 0.402 0.28 �0.005 0.164 0.035 0.095 0.951 0.149 0.784(0.056)*** (0.057)*** (0.067)*** (0.088) (0.066)** (0.102) (0.028)*** (0.065)*** (0.055)*** (0.060)***
Financial development �0.098 0.028 �0.136 �0.168 �0.074 �0.197 0.022 �0.026 �0.022 0.021(0.034)*** (0.029) (0.040)*** (0.044)*** (0.036)** (0.055)*** (0.011)** (0.040) (0.023) (0.033)
Exchange rate flexibility 0.058 0.031 0.074 0.096 0.061 0.09 �0.017 0.019 �0.007 0.021(0.016)*** (0.018)* (0.020)*** (0.023)*** (0.016)*** (0.030)*** (0.008)** (0.022) (0.014) (0.018)
Financial openness �0.017 �0.042 �0.005 �0.042 �0.026 �0.055 0.036 0.121 0.003 0.126(0.012)* (0.015)*** (0.016) (0.019)** (0.017) (0.026)** (0.008)*** (0.019)*** (0.012) (0.016)***
Countries/Observations: 55/299 55/287 55/299 55/299 55/287 55/299 55/295 55/299 55/299 55/299R-squared: 0.821 0.868 0.787 0.769 0.810 0.795 0.802 0.846 0.852 0.811
Notes: the model is estimated using OLS with country fixed effects and time period dummies; robust standard errors are in brackets; regressions (1)–(10)correspond to using alternative measures of international financial integration for the dependent variable but the same set of independent variables; IFI isthe international financial integration measured as total foreign assets plus total foreign liabilities as share of GDP; TFA (TFL) is the ratio of total foreignassets (liabilities) to GDP; TD is the ratio of total foreign debt to GDP; DA (DL) is the ratio of foreign debt assets (liabilities) to GDP; PEA is the ratio of foreignportfolio equity assets to GDP; TFDI is the ratio of total foreign direct investment assets and liabilities to GDP; FDIA (FDIL) is the ratio of foreign directinvestment assets (liabilities) to GDP; the independent variables are defined in Table A2; the parameter estimates for the other control variables –
secondary schooling, export diversification, and inflation volatility – are not significant and not reported.* Significance at 10%.** Significance at 5%.*** Significance at 1%.a Portfolio equity liability is not estimated due to the lack of sufficient observations.
11 The effects of the control variables on the IFI and its subcomponents have theoretically the expected sign. The gross cross-foreign-asset-holdings arepositively associated with trade openness, economic development, and exchange rate flexibility. It is also negatively associated with capital accountrestrictions (financial openness) and financial development. Although the latter result contradicts those for advanced countries, Lane (2000) points out that
larger financial sector might not necessarily lead to greater IFI, especially for countries with capital restrictions and lower institutional quality.
346 A. Saif Al-Abri / Int. Fin. Markets, Inst. and Money 33 (2014) 335–353
estimate of �0.707), columns 2 and 3 of Table 4, indicate that greater TOT volatility leads to greater cross-holdings of foreignassets and lower cross-holdings of foreign liabilities (i.e., higher TOT volatility improves the aggregate net foreign assetsposition). On the other hand, positive TOT trend changes have larger impacts on IFI, TFA, and TFL compared to TOT volatility.This indicates that external assets and liabilities are responding more to trend changes compared to fluctuations around thetrend. Interestingly, the patterns we document here explain some of the stylized facts discussed in Section 2. That is, theparameter estimates (Table 4) and the observed behavior of the TOT trend and volatility (Fig. 4) can be reconciled to explainthe patterns observed in the IFI and the net foreign assets position (Fig. 3, upper panel).
5.2. Composition of gross foreign assets and liabilities
The estimates of Eq. (1) using various subcomponents of the IFI, namely: foreign debt, portfolio equity, and FDI, using thesame set of independent variables, are reported in columns 4–10 of Table 4. A number of interesting observations emerge.The first observation is that, in all cases, TOT volatility is associated with higher levels of foreign assets and lower levels offoreign liabilities. This finding reconciles the two hypotheses outlined in section 3. To cope with fluctuations in TOT and tosmooth domestic consumption and investment, domestic agents seek more integration with the rest of the world andacquire more foreign assets (consistent with the theoretical propositions of Lane, 2001; Obstfeld and Rogoff,1996; Svensson,1988). On the other hand, higher volatility in TOT results in fluctuations in real return to foreign investment, which detersforeign investors and lowers foreign liabilities (as suggested by the international portfolio models, such as, Devereux andSutherland, 2009).
A second notable observation is that, across the different forms of external assets and liabilities, the response of foreignliabilities is consistently larger than the response of foreign assets. A third observation is that the parameter estimatesassociated with foreign debt and portfolio equity are larger than those associated with FDI. The varying response of differentcomponents of international financial integration to TOT volatility can be explained in view of the nature of theseinvestments. That is, the higher responses of portfolio investments and bank debt is due to their greater volatility and theirbeing subject to sudden stops (Calvo, 2007), while the lower response of FDI to TOT volatility is due to its costly andpro-longed reversals. Along this line, Lane (2000) finds that the TOT volatility affects portfolio equity and not FDI. The fourthobservation is that the results for debt are very similar to those of aggregate cross-assets holdings discussed above. Thisobservation is due to the dominance of debt in cross asset holdings of developing countries (Figs. 2 and 3).
Table 5OLS panel regression of full sample with interaction effects, 1980–2007 dependent variable: the international financial integration (IFI).
Independent variables (1) (2) (3) (4)
TOT volatility �5.604 �1.513 �0.217 8.574(0.820)*** (0.389)*** (0.124)* (3.764)**
TOT trend-growth �1.664 �1.363 �1.209 �1.068(0.212)*** (0.316)*** (0.344)*** (0.337)***
TOT volatility � trade openness 1.403(0.184)***
TOT volatility � financial development 0.519(0.106)***
TOT volatility � financial openness �0.285(0.120)**
TOT volatility � economic development �0.855(0.359)**
Economic development 0.574 0.601 0.572 0.671(0.064)*** (0.072)*** (0.074)*** (0.085)***
Trade openness 0.195 0.306 0.288 0.27(0.058)*** (0.057)*** (0.055)*** (0.055)***
Financial development �0.114 �0.171 �0.108 �0.105(0.032)*** (0.035)*** (0.034)*** (0.033)***
Exchange rate flexibility 0.066 0.064 0.055 0.058(0.018)*** (0.017)*** (0.017)*** (0.016)***
Financial openness 0.006 0.002 0.015 �0.001(0.014) (0.014) (0.016) (0.012)
Countries/Observations 55/299 55/299 55/299 55/299R-squared 0.827 0.824 0.818 0.820
Notes: the dependent variable, IFI, is the same in all four regressions, (1)–(4), and measured as total foreign assets plus total foreign liabilities as share ofGDP; each regression corresponds to using alternative interaction effects; the model is estimated using OLS with country fixed effects and time perioddummies; robust standard errors are in brackets; the independent variables are defined in Table A2; the parameter estimates for the other control variables– secondary schooling, export diversification, and inflation volatility – are not significant and not reported.
* Significance at 10%.** Significance at 5%.*** Significance at 1%.

A. Saif Al-Abri / Int. Fin. Markets, Inst. and Money 33 (2014) 335–353 347
5.3. Examining the interaction effects
To capture possible non-linearities in the relationship between TOT fluctuations and IFI, we augment Eq. (1) withinteraction factors. The model takes the following specification:
0 2 4 6 8 10 12 14 16
AlgeriaArgenti na
BahrainBangladesh
BoliviaBrazil
Burun diCameroon
Central Afr ica n Repu blicChi le
ColombiaCosta Rica
Cote d'IvoireDomini ca
Dominica n Repu blicEcuadorEth iopi a
GabonGhana
Guatema laHonduras
IndiaIndonesia
KenyaMadagasc ar
MalawiMalaysia
MaliMaurit ania
Mauriti usMexico
Morocc oMozambiq ue
Nica raguaNiger
NigeriaPakistan
Papu a New Guin eaParaguay
PeruPhi lippin es
Saudi Arabi aSenegal
South Afr icaSri Lanka
St. Vincent and th e …Sudan
Surin ameTanzaniaThailand
TogoTuni siaTurkeyUganda
UruguayVenez uela, RB
Zambi aZimbabwe
Years
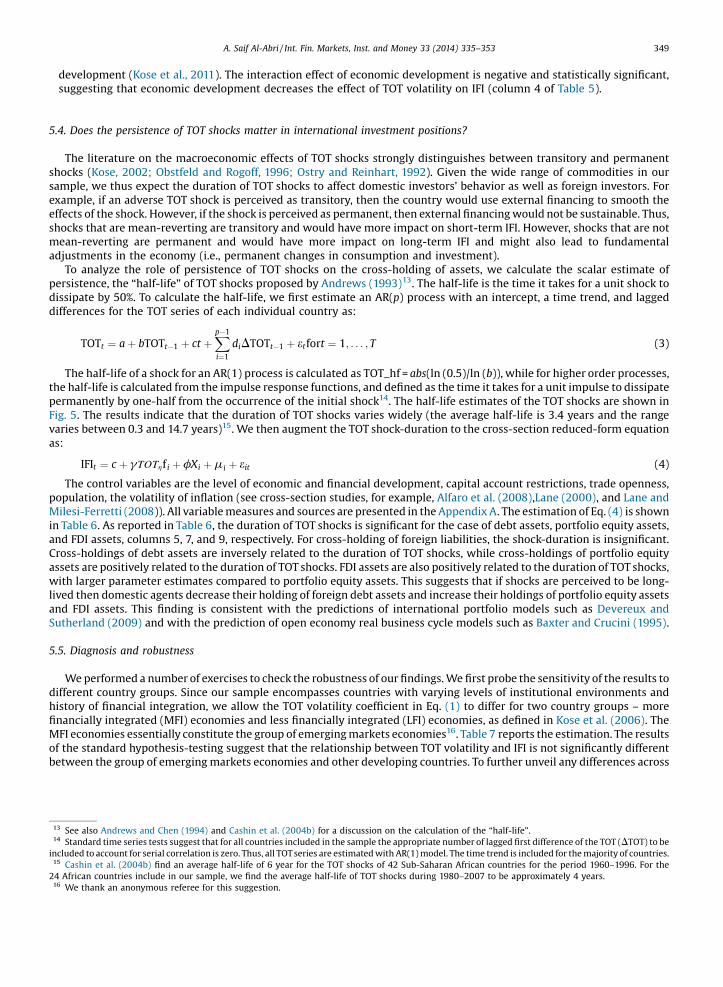
Fig. 5. The half-life of TOT shocks (years), selected developing countries, 1980–2007.Notes: For an AR(1) process, the half-life is calculated as TOT_hf = abs[ln (0.5)/ln (b)], where b is the autoregressive parameter estimated in the followingregression: TOTt ¼ a þ bTOTt�1 þ ct þ Pp�1
i¼1diTOTt�1 þ et; For higher order processes, the “half-life” is calculated from the impulse response function
as the length of time it takes for a unit impulse to dissipate by half (Andrews, 1993); source: author’s calculation based on the World Bank’sWorld Development Indicators (WDI) data.

348 A. Saif Al-Abri / Int. Fin. Markets, Inst. and Money 33 (2014) 335–353
IFIit ¼ c þ gTOTVit þ dTOTGit þ bðTOTV � FÞit þ fXit þ mi þ ut þ eit (2)
where variables and parameters are as defined before for Eq. (1) and F is the interaction factor. Eq. (2) is estimated withalternative interaction factors including: trade openness, financial sector development, financial openness (or capitalaccount restrictions), exchange rate flexibility, economic development, and export diversification. The results of theseestimations are reported in Table 5, where columns 1–4 denote alternative interaction effects. The following factors seem tomatter in the relationship between TOT volatility and IFI12.
� Trade openness. On theoretical grounds, and for a given negative TOT shock that requires current account adjustments,countries with higher trade openness are less likely to default on their debt (Calvo et al., 2004; Lane and Milesi-Ferretti,2008). That is, with more trade linkages, default risk is lower, which increases the propensity to invest in foreign assets. Theinteraction effect of trade openness (column 1 of Table 5) is positive and statistically significant, supporting thishypothesis. This finding also supports the notion that trade linkages may improve information flows and thereby increasethe willingness to invest in foreign assets.
� Financial development. Deeper domestic financial markets and banking sector facilitate asset trade among local residentsand could reduce the need of external financing. At the same time, domestic financial development facilitates foreigndemand for domestic liabilities, thus, increasing IFI. Kose et al. (2011) find empirically that there are certain thresholdlevels of financial development that an economy should attain before it can realize the benefits and reduce the risk offinancial openness. The interaction estimates of financial development (column 2 of Table 5) shows that TOT volatilityincreases the complementarity between domestic financial development and external asset holdings.
� Financial openness. Historical experiences of developing countries suggest that capital account restrictions has a negativeimpact on the accumulated stocks of foreign assets and liabilities (Chinn and Ito, 2008; Lane and Milesi-Ferretti, 2007;Quinn, 2003; Miniane, 2004). In view of the interaction estimates (column 3 Table 5), we find that greater financialopenness mitigates the effects of TOT volatility on IFI.
� Economic development. Theoretical propositions suggest that larger economies allow for more cross-border asset trade(Lane and Milesi-Ferretti, 2008). For example, the country risk is perceived to be lower with higher level of economicdevelopment. In addition, given the fixed costs and learning costs associated with foreign asset trade, the degree of IFI ispositively related to the level of income. Also, a country’s level of income can be used to proxy the overall institutional
Table 6Cross-section regression, full sample, 1980–2007 dependent variable: the alternative measures of international financial integration.
(1) (2) (3) (4) (5) (6) (7) (8) (9) (10)
Dependent variable IFI TFA TFL TD DA DL PEAa TFDI FDIA FDILIndependent variablesConstant �2.584 0.833 �6.876 �2.126 2.197 �8.439 �5.158 �4.898 �2.454 �5.661
(1.216)** (1.831) (1.399)*** (1.534) (2.560) (1.612)*** (0.953)*** (1.995)** (1.712) (1.861)***
TOT shock-duration 0.029 �0.086 0.071 �0.010 �0.247 0.089 0.091 �0.006 0.146 �0.052(0.054) (0.081) (0.062) (0.068) (0.113)*** (0.071) (0.042)*** (0.088) (0.075)* (0.082)
Trade openness 0.606 0.469 0.686 0.501 0.441 0.551 �0.071 1.010 0.002 0.957(0.107)*** (0.161)*** (0.123)*** (0.135)*** (0.225)* (0.142)*** (0.084) (0.175)*** (0.150) (0.164)***
Financial development �0.210 0.110 �0.315 �0.371 �0.080 �0.442 0.174 0.069 0.245 �0.000(0.062)*** (0.093) (0.071)*** (0.078)*** (0.130) (0.082)*** (0.048)*** (0.101) (0.087)*** (0.095)
Economic development 0.067 �0.467 0.463 0.082 �0.583 0.680 0.094 �0.146 �0.203 �0.021(0.115) (0.174)*** (0.133)*** (0.145) (0.243)** (0.153)*** (0.090) (0.189) (0.162) (0.176)
Real output volatility 1.170 1.575 0.883 1.081 1.384 1.078 3.684 0.211 2.750 0.132(0.497)** (0.748)** (0.571) (0.627)* (1.046) (0.658) (0.389)*** (0.815) (0.699)*** (0.760)
Inflation volatility 0.448 0.335 0.596 0.368 0.344 0.525 0.167 0.818 0.013 0.792(0.176)** (0.265) (0.203)*** (0.222) (0.371) (0.233)** (0.138) (0.289)*** (0.248) (0.269)***
Observations: 55 55 55 55 55 55 55 55 55 55R-squared: 0.577 0.588 0.552 0.442 0.428 0.548 0.776 0.583 0.544 0.552
Notes: the model is estimated using OLS; robust standard errors are in brackets; IFI is the international financial integration measured as total foreign assetsplus total foreign liabilities as share of GDP; TFA (TFL) is the ratio of total foreign assets (liabilities) to GDP; TD is the ratio of total foreign debt assets andliabilities to GDP; DA (DL) is the ratio of foreign debt assets (liabilities) to GDP; PEA is the ratio of foreign portfolio equity assets to GDP; TFDI is the ratio oftotal foreign direct investment assets and liabilities to GDP; FDIA (FDIL) is the ratio of foreign direct investment assets (liabilities) to GDP; the independentvariables are defined in Table A2; the parameter estimates for the other control variables – secondary schooling and export diversification – are notsignificant and not reported.
* Significance at 10%.** Significance at 5%.*** Significance at 1%.a Portfolio equity liability is not estimated due to the lack of sufficient observations.
12 The interaction terms of export diversification and exchange rate flexibility were insignificant and not reported in Table 5.
A. Saif Al-Abri / Int. Fin. Markets, Inst. and Money 33 (2014) 335–353 349
development (Kose et al., 2011). The interaction effect of economic development is negative and statistically significant,suggesting that economic development decreases the effect of TOT volatility on IFI (column 4 of Table 5).
5.4. Does the persistence of TOT shocks matter in international investment positions?
The literature on the macroeconomic effects of TOT shocks strongly distinguishes between transitory and permanentshocks (Kose, 2002; Obstfeld and Rogoff, 1996; Ostry and Reinhart, 1992). Given the wide range of commodities in oursample, we thus expect the duration of TOT shocks to affect domestic investors’ behavior as well as foreign investors. Forexample, if an adverse TOT shock is perceived as transitory, then the country would use external financing to smooth theeffects of the shock. However, if the shock is perceived as permanent, then external financing would not be sustainable. Thus,shocks that are mean-reverting are transitory and would have more impact on short-term IFI. However, shocks that are notmean-reverting are permanent and would have more impact on long-term IFI and might also lead to fundamentaladjustments in the economy (i.e., permanent changes in consumption and investment).
To analyze the role of persistence of TOT shocks on the cross-holding of assets, we calculate the scalar estimate ofpersistence, the “half-life” of TOT shocks proposed by Andrews (1993)13. The half-life is the time it takes for a unit shock todissipate by 50%. To calculate the half-life, we first estimate an AR(p) process with an intercept, a time trend, and laggeddifferences for the TOT series of each individual country as:
TOTt ¼ a þ bTOTt�1 þ ct þXp�1
i¼1
diDTOTt�1 þ etfort ¼ 1; . . . ; T (3)
The half-life of a shock for an AR(1) process is calculated as TOT_hf = abs(ln (0.5)/ln (b)), while for higher order processes,the half-life is calculated from the impulse response functions, and defined as the time it takes for a unit impulse to dissipatepermanently by one-half from the occurrence of the initial shock14. The half-life estimates of the TOT shocks are shown inFig. 5. The results indicate that the duration of TOT shocks varies widely (the average half-life is 3.4 years and the rangevaries between 0.3 and 14.7 years)15. We then augment the TOT shock-duration to the cross-section reduced-form equationas:
IFIt ¼ c þ gTOThf i þ fXi þ mi þ eit (4)
The control variables are the level of economic and financial development, capital account restrictions, trade openness,population, the volatility of inflation (see cross-section studies, for example, Alfaro et al. (2008),Lane (2000), and Lane andMilesi-Ferretti (2008)). All variable measures and sources are presented in the Appendix A. The estimation of Eq. (4) is shownin Table 6. As reported in Table 6, the duration of TOT shocks is significant for the case of debt assets, portfolio equity assets,and FDI assets, columns 5, 7, and 9, respectively. For cross-holding of foreign liabilities, the shock-duration is insignificant.Cross-holdings of debt assets are inversely related to the duration of TOT shocks, while cross-holdings of portfolio equityassets are positively related to the duration of TOT shocks. FDI assets are also positively related to the duration of TOT shocks,with larger parameter estimates compared to portfolio equity assets. This suggests that if shocks are perceived to be long-lived then domestic agents decrease their holding of foreign debt assets and increase their holdings of portfolio equity assetsand FDI assets. This finding is consistent with the predictions of international portfolio models such as Devereux andSutherland (2009) and with the prediction of open economy real business cycle models such as Baxter and Crucini (1995).
5.5. Diagnosis and robustness
We performed a number of exercises to check the robustness of our findings. We first probe the sensitivity of the results todifferent country groups. Since our sample encompasses countries with varying levels of institutional environments andhistory of financial integration, we allow the TOT volatility coefficient in Eq. (1) to differ for two country groups – morefinancially integrated (MFI) economies and less financially integrated (LFI) economies, as defined in Kose et al. (2006). TheMFI economies essentially constitute the group of emerging markets economies16. Table 7 reports the estimation. The resultsof the standard hypothesis-testing suggest that the relationship between TOT volatility and IFI is not significantly differentbetween the group of emerging markets economies and other developing countries. To further unveil any differences across
13 See also Andrews and Chen (1994) and Cashin et al. (2004b) for a discussion on the calculation of the “half-life”.14 Standard time series tests suggest that for all countries included in the sample the appropriate number of lagged first difference of the TOT (DTOT) to beincluded to account for serial correlation is zero. Thus, all TOT series are estimated with AR(1) model. The time trend is included for the majority of countries.15 Cashin et al. (2004b) find an average half-life of 6 year for the TOT shocks of 42 Sub-Saharan African countries for the period 1960–1996. For the24 African countries include in our sample, we find the average half-life of TOT shocks during 1980–2007 to be approximately 4 years.16 We thank an anonymous referee for this suggestion.

350 A. Saif Al-Abri / Int. Fin. Markets, Inst. and Money 33 (2014) 335–353
the geographic groups for our main analysis, we estimate Eq. (1) for three groups: Africa, Asia, and Latin America17.The results are generally within the same line of the full sample18.
For the sample construction, the results are robust to using 3-year and 7-year averages of variables instead of 5-yearaverages. We use the results of shock persistence as a guide to possible division of the sample into two groups: highpersistence and transitory. However, there is not much difference in the results between the two groups. In addition, theresults are robust to possible alterations in the control variables (additional control variables) and sample coverage. First,the results are robust to removing Chile and Nicaragua as outliers on the IFI measures. We also removed Saudi Arabia as theprice taking condition may not safely apply due to its large size in world crude oil markets. Second, beside the estimation forthe periods 1980–2007, estimation is also carried out for the period 1990–2007, which witness the dominance of privateflows to developing countries. The results are mostly preserved.
The results are also robust to using alternative estimation methods. For example, to address the issue of joint endogeneityof explanatory variables with the error term and the potential biases caused by country-specific effects and omittedvariables, we also estimated Eq. (1) using a generalized method of moments (GMM) dynamic panel data model. Our resultsare also robust to alternative methods of decomposing the TOT series into trend and fluctuations and alternative definitionsof TOT volatility.
6. Conclusions and extensions
This paper significantly contributes to the literature on the determinants of financial globalization. We examine theeffects of TOT movements on the size of different forms of cross-holdings of foreign assets and liabilities using a sample of55 primary-commodity exporting countries for the period 1980–2007. The findings of this paper suggest a robust andsignificant role of TOT volatility, trend-growth, and shock persistence in shaping the size and composition of financial
Table 7OLS panel regression, country-group dummies, 1980–2007 dependent variable: the alternative measures of international financial integration
(1) (2) (3) (4) (5) (6) (7) (8) (9) (10)
Dependent variable IFI TFA TFL TD DA DL PEAa TFDI FDIA FDILIndependent variablesTOT volatility � MFI �0.256 0.338 �0.876 �0.532 0.896 �1.197 0.113 �0.701 �0.025 0.113
(0.334) (0.222) (0.342)** (0.467) (0.080)*** (0.566)** (0.150) (0.411)* (0.193) (0.150)TOT volatility � LFI �0.365 0.249 �0.687 -0.877 0.076 �1.079 0.371 0.359 0.034 0.371
(0.127)*** (0.154)* (0.182)*** (0.216)*** (0.253) (0.240)*** (0.062)*** (0.101)*** (0.096) (0.062)***
TOT trend-growth �1.176 �0.662 �1.617 �2.03 �1.539 �2.419 �0.472 0.255 0.12 �0.472(0.338)*** (0.373)* (0.395)*** (0.455)*** (0.377)*** (0.573)*** (0.140)*** (0.317) (0.326) (0.140)***
Economic development 0.578 1.684 0.158 0.107 1.295 �0.282 0.371 0.615 1.171 0.371(0.075)*** (0.070)*** (0.090)* (0.111) (0.075)*** (0.133)** (0.032)*** (0.065)*** (0.082)*** (0.032)***
Trade openness 0.275 0.42 0.273 0.007 0.208 0.032 0.09 0.148 0.786 0.09(0.057)*** (0.060)*** (0.067)*** (0.090) (0.052)*** (0.103) (0.028)*** (0.055)*** (0.063)*** (0.028)***
Financial development �0.1 0.037 �0.138 �0.171 �0.055 �0.198 0.018 �0.016 0.022 0.018(0.033)*** (0.030) (0.040)*** (0.044)*** (0.025)** (0.055)*** (0.011) (0.023) (0.033) (0.011)
Exchange rate flexibility 0.055 0.027 0.074 0.094 0.048 0.09 �0.011 �0.004 0.021 �0.011(0.017)*** (0.018) (0.020)*** (0.024)*** (0.012)*** (0.029)*** (0.009) (0.013) (0.018) (0.009)
Financial openness �0.008 �0.027 �0.001 �0.043 �0.035 �0.053 0.042 0.000 0.126 0.042(0.013) (0.015)* (0.016) (0.019)** (0.012)*** (0.026)** (0.008)*** (0.012) (0.016)*** (0.008)***
Ho: is the TOT volatility coefficientequal between MFI and LFI? (p-values)
0.757 0.756 0.609 0.486 0.001 0.846 0.101 0.154 0.010 0.803
Countries/Observations: 55/299 55/287 55/299 55/299 55/287 55/299 55/295 55/299 55/299 55/299R-squared: 0.821 0.868 0.787 0.769 0.870 0.726 0.802 0.846 0.826 0.812
Notes: the model is estimated using OLS with country fixed effects and time period dummies; robust standard errors are in brackets; regressions (1)–(10)correspond to using alternative measures of international financial integration for the dependent variable but the same set of independent variables; MFI isa dummy for more financially integrated countries including Argentina, Brazil, Chile, Colombia, India, Indonesia, Malaysia, Mexico, Pakistan, Peru,Philippines, South Africa, Thailand, Turkey, and Venezuela; LFI is a dummy for less financial integrated countries which include all other countries in oursample; IFI is the international financial integration measured as total foreign assets plus total foreign liabilities as share of GDP; TFA (TFL) is the ratio of totalforeign assets (liabilities) to GDP; TD is the ratio of total foreign debt to GDP; DA (DL) is the ratio of foreign debt assets (liabilities) to GDP; PEA is the ratio offoreign portfolio equity assets to GDP; TFDI is the ratio of total foreign direct investment assets and liabilities to GDP; FDIA (FDIL) is the ratio of foreign directinvestment assets (liabilities) to GDP; the independent variables are defined in Table A2; the parameter estimates for the other control variables –
secondary schooling, export diversification, and inflation volatility – are not significant and not reported.* Significance at 10%.** Significance at 5%.*** Significance at 1%.a Portfolio equity liability is not estimated due to the lack of sufficient observations.
17 The model is not estimated for the Middle East and North Africa due to the lack of enough observations.
18 All results are available from the author upon request.
A. Saif Al-Abri / Int. Fin. Markets, Inst. and Money 33 (2014) 335–353 351
globalization of primary commodity-exporting countries. To provide deeper insights into the nature and channels ofassociation of TOT movements and IFI, we investigate different aspects of this relationship. First, beside the aggregatemeasures of gross external assets and liabilities, the relationship is analyzed using sub-measures of IFI, including foreigndirect investment, foreign portfolio equity, and foreign debt. The association is also analyzed separately with respect to grosscross-holdings of foreign assets and foreign liabilities for these sub-measures. Second, while previous studies mainly usedTOT volatility as their only measure of TOT fluctuations, this paper employs two other measures of TOT fluctuations: trend-growth and shock-duration. Our findings suggest that trend-growth is more important than volatility in explaining changesin IFI. Higher TOT volatility is robustly associated with greater cross-holdings of foreign assets and smaller cross-holdings offoreign liabilities. On the other hand, cross-holdings of portfolio assets seem more responsive to TOT volatility compared toFDI assets. A notable finding is that longer duration of terms-of-trade shocks seems to shift financial globalization towardsequity assets and away from debt assets.
The findings of this paper also contribute to the literature on international risk-sharing in the developing countries. Forexample, Kose et al. (2009b) find that, despite greater financial globalization, the degree of international risk-sharing indeveloping countries is limited. They attribute their findings to the fact that the developing countries rely more on less stableforeign cross-holdings, such as bank loans, that may not allow for efficient risk-sharing. Our analysis provides an alternativeexamination of the degree of risk-sharing in developing countries. Since TOT shocks are dominant and exogenous toprimary-commodity countries, the response of cross-holdings of foreign assets and liabilities to these exogenousidiosyncratic shocks reflects the degree of risk-sharing. Our results show that the TOT volatility and shock-duration havelarger impact on debt assets compared to other forms of foreign cross-holdings, supporting Kose et al. (2009b). Furtherinvestigation using dis-aggregated measures of IFI can contribute to the literature on international risk-sharing in thedeveloping countries. Another direction is to explore the effects of TOT on international financial integration and intra-national financial integration due to countries being a part of an economic grouping (e.g., The Association of Southeast AsianNations (ASEAN); The South Asian Association for Regional Cooperation (SAARC); The Southern African Customs Union(SACU)).
Acknowledgments
The comments and suggestions of an anonymous referee are gratefully acknowledged. The author also received usefulcomments on this paper from Narjess Boubakri, Arthur Denzau, Azmat Gani, and the participants at the Economics SeminarSeries of the Economics Department of the American University of Sharjah. The author is responsible for any remainingerrors.
Appendix A.
See Tables A1 and A2
Table A1List of countries included in the sample.
Algeria, Argentina, Bangladesh, Bolivia, Brazil, Burundi, Cameron, Central African Republic, Chile, Colombia, Costa Rica, Côte d'Ivoire, Dominica,Dominican Republic, Ecuador, Ethiopia, Gabon, Ghana, Guatemala, Honduras, India, Indonesia, Kenya, Madagascar, Malawi, Malaysia, Mali,Mauritania, Mauritius, Mexico, Morocco, Mozambique, Nicaragua, Niger, Nigeria, Pakistan, Papua New Guinea, Paraguay, Peru, Philippines, Saudi
Table A2List and definitions of variables.
Variable name Definition and construction Source
Terms-of-tradetrend-growth
Average growth rate of the Hodrick–Prescott (HP) smoothed trend of the net-barter-terms-of-trade during the 5-year interval
World Bank, WDI and author’scalculation
Terms-of-tradevolatility
Standard deviation of the log change in net-barter-terms-of-trade away from the Hodrick–Prescott (HP) smoothed trend
World Bank, WDI and author’scalculation
GDP growthvolatility
Standard deviation of the log change in real GDP World Bank, WDI
Inflation volatility Standard deviation of the log change in the CPI World Bank, WDIGDP per capita gap Country GDP per capita minus US GDP per capita, both in PPP terms (constant 2005
international $) and in logAuthor’s calculation based onWorld Bank, WDI
Financialdevelopment
Log total domestic credit to private sector (% of GDP) World Bank, WDI
Capital accountrestrictions
KAOPEN index of Chinn and Ito (2008) Chinn and Ito (2008)
Trade openness Log of exports plus imports (% of GDP) World Bank, WDIReinhart and Rogoff (2004)

352 A. Saif Al-Abri / Int. Fin. Markets, Inst. and Money 33 (2014) 335–353
References
Al-Abri, A., 2013. Real exchange volatility, terms-of-trade shocks, and financial integration in primary-commodity exporting countries. Econ. Lett. 120,126–129.
Alfaro, L., Kalemli-Ozcan, S., Volosovych, V., 2008. Why doesn’t capital flow from rich to poor countries? An empirical investigation. Rev. Econ. Stat. 90,347–368.
Andrews, D., 1993. Exactly median-unbiased estimation of first-order autoregressive/unit root models. Econometrica 61, 139–165.Andrews, D., Chen, H., 1994. Approximately median-unbiased estimation of autoregressive models. J. Bus. Econ. Stat. 12, 187–204.Backus, D., Kehoe, P., Kydland, F., 1994. Dynamics of the trade balance and the terms of trade: the J-curve. Am. Econ. Rev. 84, 84–103.Baxter, M., Crucini, M., 1995. Business cycles and the asset structure of foreign trade. Int. Econ. Rev. 36 (4), 821–854.Berka, M., Crucini, M., Wang, C.-W., 2012. International risk sharing and commodity prices. Can. J. Econ. 45 (2), 417–447.Bhattacharya, R., Patnaik, I., Pundit, M., 2013. Emerging economy business cycles: financial integration and terms of trade shocks. Working Papers 13/120,
National Institute of Public Finance and Policy.Blalock, G., Gertler, P., 2005. Foreign direct investment and externalities: the case of the public intervention. In: Moran, T.H., Graham, E.M., Blomstrom, M.
(Eds.), Does Foreign Direct Investment Prompt Development?. Institute of International Economics, Washington, DC, pp. 73–106.Blattman, C., Hwang, J., Williamson, J., 2007. Winners and losers in the commodity lottery: the impact of terms-of-trade growth and volatility in the
Periphery 1870–1939. J. Dev. Econ. 82, 156–179.Bosworth, B., Collins, S., 1999. Capital flows to developing economies: implications for saving and investment. Brookings Papers on Economic Activity, Vol.
30 (1. The Brookings Institution, pp. 143–180.Broda, C., 2004. Terms of trade and exchange rate regimes in developing countries. J. Int. Econ. 63 (1), 31–58.Broto, C., Díaz-Cassou, J., Erce, A., 2011. Measuring and explaining the volatility of capital flows to emerging countries. J. Bank. Financ. 35 (8), 1941–1953.Calvo, G., 2007. Crises in Emerging Market Economies: A Global Perspective. Working Papers, Central Bank of Chile, No. 441.Calvo, G., Izquierdo, A., Mejia, L.,2004. On the empirics of sudden stops: The relevance of balance sheet effects. NBER Working Papers 10520, National Bureau
of Economic Research, Inc.Cashin, P., Cespedes, L., Sahay, R., 2004a. Commodity currencies and the real exchange rate. J. Dev. Econ. 75, 239–268.Cashin, P., McDermott, C., 2003. Intertemporal substitution and terms-of-trade shocks. Rev. Int. Econ. 11 (4), 604–618.Cashin, P., McDermott, C., Pattillo, C., 2004b. Terms-of-trade shocks in Africa: are they short-lived or long-lived. J. Dev. Econ. 73, 727–744.Chinn, M., Ito, H., 2008. A new measure of financial openness. J. Comp. Policy Anal. 10 (3), 309–322.Coeurdacier, N., Kollmann, R., Martin, P., 2010. International portfolios, capital accumulation and foreign assets dynamics. J. Int. Econ. 80 (1), 100–112.Cole, H., Obstfeld, M., 1991. Commodity trade and international risk sharing: how much do financial markets matter. J. Monetary Econ. 28, 3–24.Devarajan, S., Rodrick, D., 1991 Do the benefits of fixed exchange rates outweigh their costs? The Franc Zone in Africa. Policy Research Working Paper Series
777, The World Bank.Devereux, M., Sutherland, A., 2009. A portfolio model of capital flows to emerging markets. J. Dev. Econ. 89 (2), 181–193.Eichengreen, B., 1996. Globalizing Capital: A History of the International Monetary System. Princeton University Press, Princeton.Frankel, J., 2010. The natural resource curse: A survey. NBER Working Papers 15836, National Bureau of Economic Research, Inc.Furceri, D., Guichard, S., Rusticelli, E., 2011. Medium-term determinants of international investment positions: The role of structural policies. OECD
Economics Department Working Papers, No. 863, OECD Publishing.Furceri, D., Guichard, S., Rusticelli, E., 2012. Episodes of large capital inflows, banking and currency crises, and sudden stops. Int. Financ. 15, 1–35.Gavin, M., Hausmann, R., Talvi, E.,1996. Saving behavior in Latin America: Overview and policy issues. Research Department Publications 4070,
Inter-American Development Bank, Research Department.Harrison, A., Love, I., McMillan, M., 2004. Global capital flows and financing constraints. J. Dev. Econ. 75 (1), 269–301.Hausmann, R., Panizza, U., Rigobon, R., 2006. The long-run volatility puzzle of the real exchange rate. J. Int. Money Financ. 25, 93–124.Kaminsky, G., Reinhart, C., Végh, C.-A., 2005. When it rains, it pours: pro-cyclical capital flows and policies. NBER Macroeconomics Annual 2004, Vol.19. MIT
Press, pp. 11–82.Kose, A., 2002. Explaining business cycles in small open economies: how much so world price matter. J. Int. Econ. 56 (2), 299–328.Kose, M., Prasad, E., Rogoff, K., Wei, S.-J., 2009a. Financial globalization: a reappraisal. IMF Staff Papers, Vol. 56 (1. Palgrave Macmillan, pp. 8–62.Kose, M., Prasad, E., Terrones, M., 2006. How do trade and financial integration affect the relationship between growth and volatility. J. Int. Econ. 69 (1),
176–202.Kose, M., Prasad, E., Terrones, M., 2009b. Does financial globalization promote risk sharing. J. Dev. Econ. 89, 258–270.Kose, M., Prasad, E., Taylor, A., 2011. Thresholds in the process of international financial integration. J. Int. Money Financ. 30, 147–179.Lane, P., 2000. International investment positions: a cross-sectional analysis. J. Int. Money Financ. 19, 513–534.Lane, P., 2001. The new open economy macroeconomics: a survey. J. Int. Econ. 54 (2), 235–266.Lane, P., Milesi-Ferretti, G., 2007. The external wealth of nations mark II: revised and extended estimates of foreign assets and liabilities, 1970–2004. J. Int.
Econ. 73 (2), 223–250.Lane, P., Milesi-Ferretti, G., 2008. The drivers of financial globalization. Am. Econ. Rev. 98 (2), 327–332.Martin, P., Rey, H., 2004. Financial super-markets: size matters for asset trade. J. Int. Econ. 64 (2), 335–361.
Table A2 (Continued)
Variable name Definition and construction Source
Exchange rateflexibility
A categorical measure of exchange rate regime flexibility; 1 = fix, 2 = peg, 3 = managed float,4 = float
Internationalfinancialintegration (IFI)
Log total foreign assets plus total foreign liabilities (% of GDP) Lane and Milesi-Ferretti (2007)
Total foreigndirect investment
Log total foreign direct investment, assets plus liabilities (% of GDP) Lane and Milesi-Ferretti (2007)
Portfolioequity assets
Log foreign portfolio equity assets (% of GDP) Lane and Milesi-Ferretti (2007)
Totaldebt investment
Log total foreign assets and liabilities of portfolio debt, bank loans and deposits, and otherdebt instruments (% of GDP)
Lane and Milesi-Ferretti (2007)
Education Total secondary enrollments (% of population) World Bank, WDIExportdiversification
Share of primary commodities (raw materials and crude oil) in total exports Author’s calculation based onWorld Bank, WDI

A. Saif Al-Abri / Int. Fin. Markets, Inst. and Money 33 (2014) 335–353 353
Mendoza, E., 1995. The terms-of-trade, the real exchange rate, and economic fluctuations. Int. Econ. Rev. 36 (1), 101–137.Mendoza, E., 1997. Terms-of-trade uncertainty and economic growth. J. Dev. Econ. 54, 323–356.Mendoza, E., Terrones, M., 2008. An anatomy of credit booms: Evidence from macro aggregates and micro data. NBER Working Papers 14049, National
Bureau of Economic Research, Inc.Milesi-Ferretti, G., Tille, C., 2011. The great retrenchment: international capital flows during the global financial crisis. Econ. Policy 26, 289–346.Miniane, J., 2004. A new set of measures on capital account restrictions. IMF Staff Pap. 51 (2) .Obstfeld, M., 1982. Aggregate spending and the terms of trade: is there a Laursen–Metzler effect. Q. J. Econ. 97 (1), 251–270.Obstfeld, M., Rogoff, K., 1996. Foundations of International Macroeconomics. MIT Press, Cambridge, MA.Ostry, J., Reinhart, C., 1992. Private saving and terms-of-trade shocks. IMF Staff Pap. 39 (September), 495–517.Quinn, D., 2003. Capital account liberalization and financial globalization, 1890–1999. Int. J. Financ. Econ. 8, 189–204.Reinhart, C., Rogoff, K., 2004. The modern history of exchange rate arrangements: a reinterpretation. Q. J. Econ. 119 (1), 1–48.Svensson, L., 1988. Trade in risky assets. Am. Econ. Rev. 78, 375–394.Turnovsky, S., Chattopadhyay, P., 2003. Volatility and growth in developing economies: some numerical results and empirical evidence. J. Int. Econ. 59,
267–295.