how does the sst variability over the western north atlantic …€“kara seas... · paolo davini,...
TRANSCRIPT

This content has been downloaded from IOPscience. Please scroll down to see the full text.
Download details:
IP Address: 182.73.193.34
This content was downloaded on 16/03/2017 at 09:19
Please note that terms and conditions apply.
How does the SST variability over the western North Atlantic Ocean control Arctic warming
over the Barents–Kara Seas?
View the table of contents for this issue, or go to the journal homepage for more
2017 Environ. Res. Lett. 12 034021
(http://iopscience.iop.org/1748-9326/12/3/034021)
Home Search Collections Journals About Contact us My IOPscience
You may also be interested in:
Arctic-North Pacific coupled impacts on the late autumn cold in North America
Mi-Kyung Sung, Baek-Min Kim, Eun-Hyuk Baek et al.
Influence of the Gulf Stream on the Barents Sea ice retreat and Eurasian coldness during early
winter
Kazutoshi Sato, Jun Inoue and Masahiro Watanabe
Physical characteristics of Eurasian winter temperature variability
Kwang-Yul Kim and Seok-Woo Son
Relationship between North American winter temperature and large-scale atmospheric circulation
anomalies and its decadal variation
B Yu, H Lin, Z W Wu et al.
Tropical origin for the impacts of the Atlantic Multidecadal Variability on the Euro-Atlantic
climate
Paolo Davini, Jost von Hardenberg and Susanna Corti
Summertime atmosphere–ocean preconditionings for the Bering Sea ice retreat and the following
severe winters in North America
Takuya Nakanowatari, Jun Inoue, Kazutoshi Sato et al.
A dipole pattern in the Indian and Pacific oceans and its relationship with the East Asian summer
monsoon
Jiayu Zheng, Jianping Li and Juan Feng
Arctic moisture source for Eurasian snow cover variations in autumn
Martin Wegmann, Yvan Orsolini, Marta Vázquez et al.

OPEN ACCESS
RECEIVED
21 August 2016
REVISED
8 December 2016
ACCEPTED FOR PUBLICATION
8 February 2017
PUBLISHED
13 March 2017
Original content fromthis work may be usedunder the terms of theCreative CommonsAttribution 3.0 licence.
Any further distributionof this work mustmaintain attribution tothe author(s) and thetitle of the work, journalcitation and DOI.
Environ. Res. Lett. 12 (2017) 034021 https://doi.org/10.1088/1748-9326/aa5f3b
LETTER
How does the SST variability over the western North AtlanticOcean control Arctic warming over the Barents–Kara Seas?
Ok Jung1, Mi-Kyung Sung1, Kazutoshi Sato2, Young-Kwon Lim3, Seong-Joong Kim4, Eun-Hyuk Baek4,Jee-Hoon Jeong5 and Baek-Min Kim4,6
1 Industry Collaboration Foundation, Seoul, Korea2 National Institute of Polar Research, Tachikawa, Japan3 NASA Goddard Space Flight Center/Global Modeling and Assimilation Office, Goddard Earth Sciences Technology and Research/I.
M. Systems Group, Greenbelt, MD, United States of America4 Korea Polar Research Institute, Incheon, Korea5 Chonnam National University, Gwangju, Korea6 Author to whom any correspondence should be addressed.
E-mail: [email protected]
Keywords: Arctic warming, Stationary Wave Model, transient eddy vorticity forcing, Western North Atlantic Ocean
Supplementary material for this article is available online
AbstractArctic warming over the Barents–Kara Seas and its impacts on the mid-latitude circulations havebeen widely discussed. However, the specific mechanism that brings the warming still remainsunclear. In this study, a possible cause of the regional Arctic warming over the Barents–Kara Seasduring early winter (October–December) is suggested. We found that warmer sea surfacetemperature anomalies over the western North Atlantic Ocean (WNAO) modulate the transienteddies overlying the oceanic frontal region. The altered transient eddy vorticity flux acts as asource for the Rossby wave straddling the western North Atlantic and the Barents–Kara Seas(Scandinavian pattern), and induces a significant warm advection, increasing surface and lower-level temperature over the Eurasian sector of the Arctic Ocean. The importance of the sea surfacetemperature anomalies over the WNAO and subsequent transient eddy forcing over the WNAOwas also supported by both specially designed simple model experiments and general circulationmodel experiments.
1. Introduction
The rapid increase in Arctic temperature and retreat ofsea ice have been reported and widely discussed in thescientific literatures (Comiso et al 2008, Stroeve et al2012, Vihma 2014). The increase in Arctic temperatureis most pronounced during early winter (October-–December) and is not spatially uniform, but exhibitsseveral particular regional warm cores (Screen andSimmonds 2010) including the Barents–Kara Seas,East Siberian–Chukchi Seas, and northeast Canadaand Greenland. Interestingly, the atmospheric warm-ing over each location in the Arctic is known to lead tomid-latitude cooling, but with quite different spatialpatterns (Mosley-Thompson et al 2005, Cohen et al2012, Francis and Vavrus 2012, Hanna et al 2014, Kimet al 2014, Mori et al 2014, Kug et al 2015,Nakanowatari et al 2015, Lim et al 2016). Therefore,
© 2017 IOP Publishing Ltd
the peculiar recent phenomena called ‘Warm Arctic-Cold Continents’ (Overland andWang 2010, Overlandet al 2015) can be effectively categorized by theregional warm cores in the Arctic.
Although there are many studies on how theabove-mentioned regional Arctic warming and re-duced sea ice cover over those regions could inducecold winter extremes in mid-latitudes, relatively fewstudies have been devoted to finding the drivingmechanism for those regional Arctic warming events.Recently, a linkage between the oceanic thermalcondition of the North Atlantic Ocean and Arcticsurface temperature has been suggested (Zhang et al2013, Nakanowatari et al 2014, Sato et al 2014, Luoet al 2016), which is supported by other findings thatshow both the surface air temperature over theBarents–Kara Seas (BKSAT) and sea surface tempera-ture (SST) over the western North Atlantic Ocean

Environ. Res. Lett. 12 (2017) 034021
(WNAO) have rapidly increased in recent decades(Wu et al 2012, Pershing et al 2015, Saba et al 2016). Itis also found that the warming over the WNAO is inassociation with the northward shift of SST front overthe Gulf Stream (Minobe et al 2008, Wu et al 2012).
Among these studies, we revisit Sato et al (2014)which provides a close observational link between theBarents–Kara Seas and the WNAO, over which thenorthern part of the Gulf Stream passes. Using linearbaroclinic model experiments, Sato et al (2014)suggested that the changes in the local diabaticheating in association with the poleward shift of theGulf Stream can induce a large-scale circulationpattern travelling into the Arctic inducing significantArctic warming. However, the linear response shownin figure 5(d) of their paper was quite weak and moreimportantly, missed a possible contribution from thelarge baroclinic eddy activities over the region, whichis amply noted by other studies (Sampe et al 2010,Frankignoul et al 2011, Sung et al 2014). As thetransient eddy forcing in the North Atlantic tends toinduce the large-scale teleconnection pattern, calledthe Scandinavian pattern (SCAND), travelling overthe north Atlantic and Arctic (Bueh and Nakamura2007), it is important to take into account barocliniceddy activities.
In this regard, Sato et al (2014)’s study isincomplete, although their finding casts considerablelight on the divergent perspectives about ‘WarmArctic-Cold Continents’ by revealing that apparentlinks between the Barents Sea ice cover and coldEurasian winters form just a sector of a tele-connection pattern that originates remotely in theNorth Atlantic Gulf Stream region (Simmonds andGovekar 2014). Therefore, it is worthwhile evaluatingwhether the warming over the WNAO induces asufficient transient eddy forcing for the large-scaleteleconnection pattern over the North Atlantic andArctic region.
In this study, we aim to provide a more plausibleexplanation on how the warm SST anomaly in theWNAO sector modulates the Eurasian teleconnectionsand affects warming over the Arctic, and in particular,the Barents–Kara Sea in early winter. Special attentionwill be devoted to the role of transient eddy forcing,which was not studied by Sato et al (2014). The relativeimportance of transient eddy forcing to the thermalforcing was assessed by a simple model speciallydesigned to treat each forcing separately. Generalcirculation model experiments were also conducted tosupport observational findings and simple modelresults.
2. Datasets and methods
The primary observational dataset used in this studyincludes Hadley Centre Sea Surface Temperature(HadISST) data with 1° � 1° horizontal resolution
2
(Rayner et al 2003) and the re-analysis dataset obtainedfrom the U.S. National Centers for EnvironmentalPrediction (NCEP)/National Center for AtmosphericResearch (NCAR), which has a 2.5° � 2.5° horizontalresolution (Kalnay et al 1996). Both the daily andmonthly mean dataset for the 1979–2013 period wereutilized in this study.
In order to investigate distinguishable influencesfrom several independent SST modes of the NorthAtlantic Ocean separately, Empirical OrthogonalFunction (EOF) analysis was applied for earlywinter (October–December) mean SST anomaliesover the North Atlantic Ocean domain (95°W∼15°E,20.5°N∼88°N). Latitude weighting was applied bymultiplying the square root of the cosine prior to theEOF analysis. North’s rule of thumb (North et al1982) was used to test the significance of EOF modes.Regression analysis was conducted using the obtainedEOF principal component (PC) time series to retrievethe associated circulation patterns.
In this study, interannual variability of surface airtemperature over the Atlantic sector of the Arcticregion in early winter is represented by thedetrended time series of area-averaged BKSAT.The boxed area indicated in figure 1(a) was usedas the area average.
The stationary wave model (hereafter SWM, Tingand Yu (1998)) was employed to examine thedominant forcing mechanism of stationary Rossbywaves. This SWM is the dry dynamical core of a fullynonlinear baroclinic model. The prognostic variablesinclude vorticity, divergence, temperature and log-surface pressure with R30 truncation in the horizontaland L14 vertical levels on sigma coordinates. The mainforcings in this model were diabatic heating, conver-gence of transient eddy vorticity fluxes and transienteddy heat fluxes. The forcing terms can be tested usingidealized distribution or diagnosed forcing fieldsderived from observations. In this study, the latterapproach was used (see supplementary informationavailable at stacks.iop.org/ERL/12/034021/mmedia).The three forcing terms can be defined as:
TFvor ¼ �DðV 0; j0 Þ ð1Þ
TF temp ¼ � P
P0
� �R=Cp∇· V
0u0� �
þ ∂ðv0u0 Þ
∂p
" #ð2Þ
Q1 ¼@T
@tþ VDT þ v
@T
@p� RT
Cpp
� �� TF temp ð3Þ
where j is the vorticity, V is the horizontal wind, p ispressure, v is the pressure vertical velocity, and TFvor
and TF temp indicate the non-linear transient eddyvorticity flux convergence and transient eddy heat fluxconvergence, respectively. Q1 indicates the monthlymean diabatic heating. Note that Q1 used in this studyis different from that in Sato et al (2014) because of the

(a) Reg(BKSAT,SST) (b) Reg(BKSAT,Z250hPa) (c) Normalized timeseries0.2
100W 50W 0 50E 100E 100W 50W 0 50E 100E 150E 1980 1985 19951990 2000 2005 2010
2
1
0
–1
–2
80N
60N
40N
20N
BKSAT SCAND
–0.2 –0.1 –0.05 0.05 0.1 0.2 0.3 0.4 0.5 –45 –35 –25 –15 –8 8 15 25 35 45
Figure 1. Regression of early winter mean (OND mean) (a) SST and (b) 250 hPa geopotential height and wave activity on thedetrended BKSATregion ( 30°∼70°E, 70°∼80°N), denoted by the black box in figure 1(a). (c) Normalized time series of Scandinavianteleconnection index (SCAND, green line) and detrended BKSAT (black line). Hatch represents significance at 95% level ofconfidence.
Environ. Res. Lett. 12 (2017) 034021
existence of TF temp in (3). The bar represents themonthly mean and prime shows the deviation fromthe monthly mean. Further details of the modelequations or information can be found in Ting and Yu(1998) and Wang and Ting (1999).
To investigate the impact of SSTwarming over theWNAO in a more realistic modelling framework, weused a fully coupled general circulation model (GCM),Climate Model Version 2.1 (CM2.1) developed by theGeophysical Fluid Dynamical Laboratory (GFDL)(Delworth et al 2006). As a control run, we conductedclimatological equilibrium simulations with 400 ppmCO2 for 100 years. In a forced simulation, SSTover theWNAO region (the box in figure 5(a), i.e. 38oN–48oN,55oW–75oW) was restored toward the prescribedwarm SST conditions with 5 day restoring time scale.According to Pershing et al (2015), the WNAO regionis the highest warming place on the earth and, in thelast decade, there was 2 °C increase of SST.Accordingly, we prepared the warm SST conditionover the WNAO region by adding the observed SSTtrend of the recent 11 years (2004–2014) to theclimatological SST fields of control run. Note that themodel freely evolves except for the boxed region infigure 5(a) in the forced run. To estimate the responseto the SST forcing over the WNAO, we will analyzedifferences between the results of the forced run andthe control run.
3. Results
3.1. Warming over Barents–Kara Seas and SCANDteleconnection patternAs suggested by Sato et al (2014), during early winter,changes in surface air temperature, especially over theBarents–Kara Seas in the Atlantic sector of the ArcticOcean, were closely related to changes in SSTvariability over the WNAO (figure 1(a)). In additionto the warming of WNAO, a colder regional SSTanomaly over the Labrador Sea was observed inassociation with the warmer BKSAT constituting thewarm–cold–warm tri-polar pattern over a large area of
3
the North Atlantic and European sector of the ArcticOcean.
The warming over the Barents–Kara Seas in earlywinter accompanies a well-defined upper-level circu-lation pattern (figure 1(b)). This upper level circula-tion pattern resembles the EU1 or the SCAND pattern(Barnston and Livezey 1987). In fact, among theteleconnection indices archived at the NationalOceanic and Atmospheric Administration (NOAA)/National Center for Environmental Prediction(NCEP)/Climate Prediction Center (CPC), theSCAND index shows the highest correlation withBKSAT. The correlation coefficient between the timeseries of BKSAT and the early winter mean SCANDindex is 0.4, with greater than 95% confidence (figure1(c)).
Interestingly, the wave activity flux vectors (Plumb1986) in figure 1(b) indicate that the wave sourceregion is over the WNAO, not over the Barents–KaraSeas where sea ice loss is pronounced. A large-scalewave pattern with an anticyclonic centre over theWNAO emanates and exhibits a travelling Rossbywave pattern toward eastern Europe, the Barents–KaraSeas, and eventually reaching northeast Asia. Inparticular, a strong positive upper level geopotentialheight anomaly over the western North Atlantic regionmatches the positive SST anomaly over the WNAO.Therefore, the warm SST in figure 1(a) over thewestern North Atlantic region seems to play animportant role in the teleconnection. Furthermore, thecold SST anomaly over the Labrador Sea and warmSST anomalies over the Barents–Kara Seas in figure 1(a) also match well with the geopotential heightanomalies in figure 1(b).
Combining the results displayed in figure 1, we seta series of working hypotheses that can be tested bysimple numerical modelling experiments: 1) interan-nual variability of the BKSAT is, in fact, largelyoriginated from theWNAO. 2) Awarmer SSTanomalyover the WNAO causes warm temperature anomaliesover the Barents–Kara Seas via upper-level planetarywave propagation, similar to SCAND and associatedwarm advection.

(a) EOF 1(36.6%)
(c) EOF 2(14.5%)
(e) EOF 3(8.6%)
(b) PC1 & BKSAT
(d) PC2 & BKSAT
(f) PC3 & BKSAT
corr=0.07
corr=0.03
corr=0.4*
60N
40N
60N
40N
60N
40N
90W 60W 30W 0
90W 60W 30W 0
90W 60W 30W 0 1980 1985 1990 1995 2000 20102005
1980 1985 1990 1995 2000 20102005
1980 1985 1990 1995 2000 20102005
PC1
PC2
PC3
BKSAT
BKSAT
BKSAT
0.7
0.5
0.3
0.2
0.1
–0.1
–0.2
–0.3
–0.5
–0.7
2
1
0
–1
–2
2
1
0
–1
–2
2
1
0
–1
–2
Figure 2. EOF analysis applied to SSTanomalies over the North Atlantic Ocean. (a) First EOF mode (EOF1) of the early winter mean(ONDmean) SSTanomaly (shading) and its climatology (contour). (c) and (e) are the same as (a) except for the second and third EOFmodes. (b) The corresponding PC1 time series for EOF1 (solid line). (d) and (f) are the same as (a) except for the PC time seriescorresponding to the second and third EOFs. Dashed line in (b), (d) and (f) denotes the time series of detrended BKSAT. Temporalcorrelation between each PC time series and BKSAT is provided in each panel at the upper-right corner. Box region (75°∼50°W,35°∼50°N) indicates the WNAO region.
Environ. Res. Lett. 12 (2017) 034021
3.2. EOF analysis on North Atlantic SST variabilitiesPrior to verifying the above hypotheses, we conductedEOF analysis to determine whether there exists anidentifiable North Atlantic SST variability linked to theArctic warming over the Barents–Kara Seas. The earlywinter averaged SST anomalies during the 1979–2013period were decomposed into three dominant modes:the first mode (EOF1) explains 36.6% of the totalvariance and exhibits a strong linear trend. Thespatial pattern of EOF1 shows apparent warmingover the entire North Atlantic basin. Although thepattern contains significant SST warming over theBarents–Kara Seas, the correlation between the PC1and BKSAT is low (0.07). Note that BKSAT is adetrended index.
The second mode explains 14.5% of the variance,and has three centres of action which are located overthe western North Atlantic Ocean, the northern NorthAtlantic Ocean, and the eastern North Atlantic (figure2(c)). The temporal correlation coefficient between thesecond PC and BKSAT time series is very low (0.03)indicating no significant relationship, as with EOF2showing no anomalies in the Arctic Sea region. The
4
most similar pattern to the regressed pattern depictedin figure 1(a) is described in EOF3, which shows a tri-polar pattern with warm SST anomaly over theWNAO; cold over the south of Greenland andLabrador Seas, and warm over the Barents–Kara Seas.The similarity is quite remarkable. As expected by thewarm centre over the Barents–Kara Seas in figure 2(e),the PC3 time series shows a significant correlationwith the BKSAT time series (corr. = 0.4) at 99%confidence level (figure 2(f)). The PC3 timeseries alsohas a high correlation coefficient with the SCANDindex (corr. = 0.57) (table 1). According to North’srule of thumb, the three EOF modes are well separated(North et al 1982).
It is notable that the SSTanomaly over the WNAOlies over the northern edge of the Gulf Stream, whichshows a strong SST gradient (see isotherms in figure 2(e)). The warm SST anomaly over this region mayrepresent the poleward shift of the Gulf Stream andintense baroclinic zone. Since it is well-known that theSST gradient associated with the western boundarycurrent is known to be a great source of baroclinicity(Minobe et al 2008), it is the source of available

Table 1. Correlation coefficients among the atmosphericteleconnection modes and the PC time series.
SCAND EAWR NAO
PC1 0.1 0.29 0.37
PC2 0.1 0.48a 0.02
PC3 0.57a 0.10 0.4
a Statistically significant at p < 0:01.
Environ. Res. Lett. 12 (2017) 034021
potential energy for the growth of transient eddies.This leads us to investigate the role of transient eddiesin the large-scale teleconnection pattern that links theNorth Atlantic and the Arctic regions.
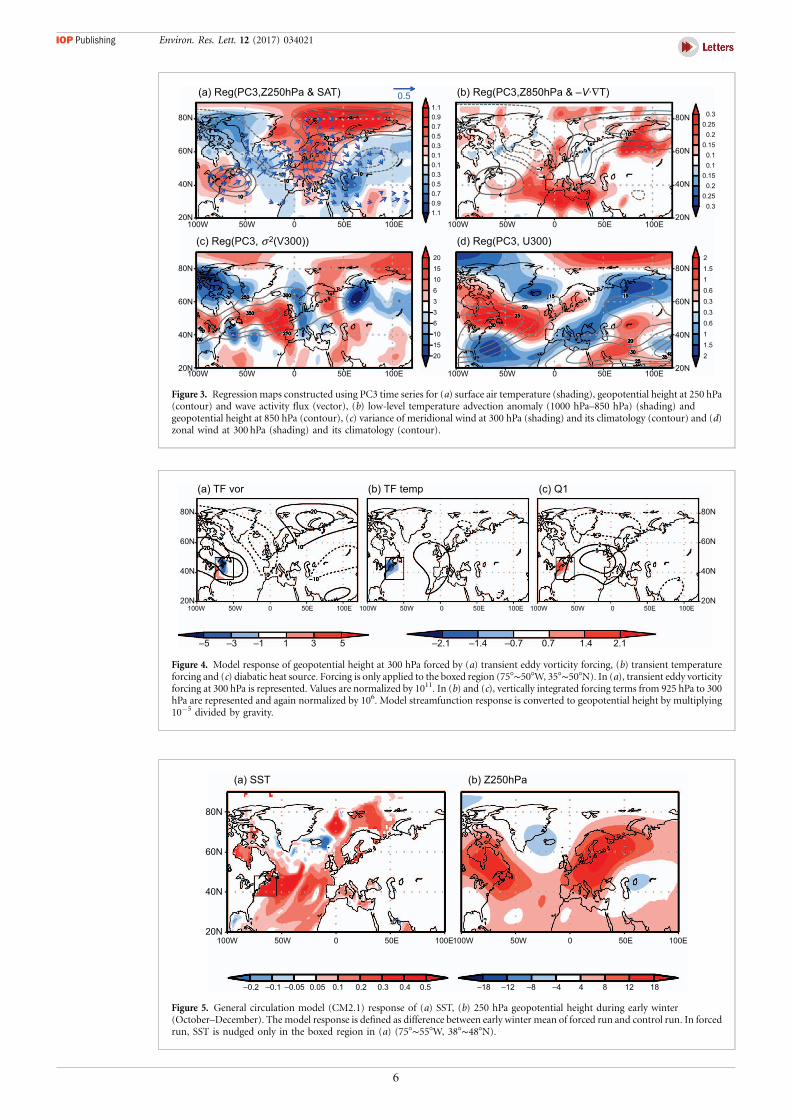
3.3. Physical mechanism of Atlantic origin of ArcticwarmingAtmospheric circulation features related with theEOF3 of SST variability are depicted in figure 3.Geopotential height anomaly at 250 hPa representingthe upper-level circulation features a wave trainpattern emanating from the WNAO towardEurasia across the north-eastern Atlantic and theBarents–Kara Seas (contour in figure 3(a)). Asexpected by the similarity between the SST anomalyregressed on to the BKSAT (figure 1(a)) and the EOFthird mode (figure 2(e)), this upper-level circulationpattern is similar to the SCAND pattern in figure 1(b). The response is equivalent barotropic (contour infigures 3(a) and (b)) and, therefore, the regressedsurface air temperature anomaly (shaded in figure 3(a)) is in general in phase with the upper-levelgeopotential height anomaly. The significant warm-ing over the Barents–Kara Seas can partly beexplained by the enhanced warm advection alongthe western edge of the anticyclonic anomaly overwestern Europe induced by this barotropic large-scaleanomaly at lower-levels (figure 3(b)).
In association with the downstream propagation ofSCAND toward East Asia, cold temperature anomaliesappear primarily over Central and East Asia, whereupper-level cyclonic response dominates (figure 1(b)).In this case, the upper-level cyclonic response reducesthe thickness of the air column over East Asia andtherefore, the column average temperature drops.Combined with the climatologically strong northerlyflow in this region, strongcoldadvection is induced.Thewarm and cold anomalies explained above resemble‘Warm Arctic-Cold Continents’ or ‘Warm Arctic-ColdSiberia’ pattern (Overland et al 2011, Inoue et al 2012,Kim et al 2014, Mori et al 2014, Kug et al 2015).
Returning to the North Atlantic, the source regionof the wave train seems to lie in the WNAO region(box in figure 2(e)). Compared with the EOF3 infigure 2(e), this wave activity source region coincideswith the warm SSTanomaly over theWNAO. Sato et al(2014) examined the possible role of the diabaticheating over the WNAO by calculating the apparentheat source and resultant linear stationary eddyresponse. In this work, we investigated another
5
possibility. The warm SST anomaly over the WNAOcan be interpreted as the northward extension of theGulf Stream (Wu et al 2012) indicating northwardshift of the ocean front. Since the WNAO regionexhibits strong SST gradients as shown in figure 2(e),we expect that the warm SST anomaly could alter theactivities of synoptic-scale eddies which are sensitive tothe temperature gradient and diabatic heat sources(Brayshaw et al 2008, Nakamura et al 2008). Indeed,the transient eddy activities estimated by the varianceof the 300 hPa daily meridional wind anomalyregressed to EOF3 also shifted eastward comparedwith its climatological position (figure 3(c)) and thenorthward shift of Atlantic sub-polar jet occurred atthe same time (figure 3(d)). These results areconsistent with the previous studies that addressedthe importance of the SST gradient in the alteration oftransient eddy activities (Sampe et al 2010, Frank-ignoul et al 2011, Sung et al 2014).
Combined changes in the transient eddy activitiesand Atlantic sub-polar jet in association with the SSTvariability over the WNAO hint at the possible role oftransient eddy activities on large-scale teleconnectionpatterns (Bueh and Nakamura 2007, Lim and Kim2016). To investigate the relative role of transienteddies linked to SST variability over the WNAO, weused the SWM alternatively forced by diabaticheating or transient eddy forcing and estimated therelative importance of each forcing term by compar-ing the SWM responses forced by each forcing termseparately (see supplementary information).
Forcings and associated responses of SWMexperiments are represented in figure 4. Within theboxed region of the WNAO, the negative TFvor infigure 4(a) was consistent with significant highanomalies shown in figure 1(b). Interestingly, thediabatic forcing in figure 4(c) and convergence oftransient eddy heat flux compensated each other,meaning that the diabatic heating was largely balancedby eddy heat transport.
As noted previously, the WNAO region is a keyregion of strong SST variability and is associated withthe large changes in SST gradient and in storm track.We examined the relative importance of these threeforcings in the excitation of large-scale circulation. Asshown in figure 4, a major response was obtained withtransient eddy vorticity forcing and this forcingreproduced the SCAND wave structure remarkably(compare figure 3(a) and figure 4(a)). In addition, thewave-like feature in the model response had a highpattern correlation with observed SCAND pattern(0.62). A relatively weaker contribution was obtainedfrom the transient eddy temperature forcing and totaldiabatic heating forcing. Considering that we onlyapplied the forcing in the restricted region (black boxin figure 4), the result is rather surprising and confirmsthe important role of the storm activities in large-scaleteleconnection patterns. These results provide evi-dence that transient vorticity flux related to the SST
(a) Reg(PC3,Z250hPa & SAT)
(c) Reg(PC3, σ 2(V300)) (d) Reg(PC3, U300)
(b) Reg(PC3,Z850hPa & –V∙∇T)
80N
60N
40N
20N
80N
60N
40N
20N
80N
60N
40N
20N
80N
60N
40N
20N
100W 50W 0 50E 100E 100W 50W 0 50E 100E
100W 50W 0 50E 100E100W 50W 0 50E 100E
0.51.10.90.70.50.30.10.10.30.50.70.91.1
2015106336101520
21.510.60.30.30.611.52
0.30.25
0.20.15
0.10.1
0.150.2
0.250.3
Figure 3. Regression maps constructed using PC3 time series for (a) surface air temperature (shading), geopotential height at 250 hPa(contour) and wave activity flux (vector), (b) low-level temperature advection anomaly (1000 hPa–850 hPa) (shading) andgeopotential height at 850 hPa (contour), (c) variance of meridional wind at 300 hPa (shading) and its climatology (contour) and (d)zonal wind at 300 hPa (shading) and its climatology (contour).
(a) TF vor (b) TF temp (c) Q1
80N
60N
40N
20N
80N
60N
40N
20N100W 50W 0 50E 100E 100W 50W 0 50E 100E 100W 50W 0 50E 100E
–5 –3 –1 1 3 5 –2.1 –1.4 –0.7 0.7 1.4 2.1
Figure 4. Model response of geopotential height at 300 hPa forced by (a) transient eddy vorticity forcing, (b) transient temperatureforcing and (c) diabatic heat source. Forcing is only applied to the boxed region (75°∼50°W, 35°∼50°N). In (a), transient eddy vorticityforcing at 300 hPa is represented. Values are normalized by 1011. In (b) and (c), vertically integrated forcing terms from 925 hPa to 300hPa are represented and again normalized by 106. Model streamfunction response is converted to geopotential height by multiplying10�5 divided by gravity.
(a) SST (b) Z250hPa
80N
60N
40N
20N100W 50W 0 50E 100E100W 50W 0 50E 100E
–0.2 –0.1 –0.05 0.05 0.1 0.2 0.3 0.4 0.5 –18 –12 –8 –4 4 8 12 18
Figure 5. General circulation model (CM2.1) response of (a) SST, (b) 250 hPa geopotential height during early winter(October–December). The model response is defined as difference between early winter mean of forced run and control run. In forcedrun, SST is nudged only in the boxed region in (a) (75°∼55°W, 38°∼48°N).
Environ. Res. Lett. 12 (2017) 034021
6

Environ. Res. Lett. 12 (2017) 034021
interannual variability over the WNAO is a key factorfor the SCAND teleconnection pattern.
The last evidence of the importance of SSTover theWNAO for the Arctic warming comes from fullycoupled model experiments (figure 5). In general,model experiments successfully capture variousfeatures depicted in the observational analysis results:Model SST response in figure 5(a) shows the warm-cold-warm SST pattern similar to the EOF3 pattern(figure 2(e)). Considering that the SST nudging wasonly applied to the boxed region in figure 5(a) in themodel simulation. Therefore, the warm SST anomalyover the Barents–Kara Seas was internally generated bythe fully coupled model as a response. The upper-levelresponse was also reproduced reasonably well (figure 5(b)). Therefore, the results from the regression analysis(figures 1 and 3) are supported by the fully coupledmodel experiments.
4. Summary and discussion
Sato et al (2014) showed that the poleward shift of theGulf Stream influences the increase (decrease) oftemperature (sea ice extent) over the Barents–KaraSeas and cooling over Eurasia through planetary wavestriggered over the Gulf Stream region. In this study,the origins of the planetary waves are investigated indetail.
First, we show that the variability in the surface airtemperature over the Barents–Kara Seas is largelycontrolled by two dominant SSTmodes in the domainincluding the North Atlantic Ocean and the Atlanticsector of Arctic Ocean. The warming trends in both theAtlantic Ocean and the Barents–Kara Seas are largelydepicted by EOF first mode and this pattern resemblesthe basin-wide warming pattern. On the other hand,interannual variability is controlled by the tri-polar SSTpattern depicted as EOF third mode in this study. Thethird SSTmode represents the poleward shift of theGulfStream and accompanying changes in storm track asindicated by Sato et al (2014).
Through a simple modelling study using SWM, weconcluded that the altered upper-level transient eddyvorticity forcing in association with the changes in thestorm track plays a major role in the generation of theSCAND pattern and therefore, plays a bridging rolebetween the North Atlantic Ocean and the Atlanticsector of Arctic in early winter at the interannual time-scale. We could reproduce an upper-level circulationpattern that was very similar to SCAND only withaltered transient eddy vorticity forcing in the upper-level.
The surface warm advection along the highpressure center of SCAND at the Barents–Kara Seas,which is essentially barotropic, is an important sourceof warming of BKSAT. The direct influence of thediabatic heating over the WNAO sector was relativelyminor compared to the transient forcing.
7
Although this study emphasizes the importance ofthe enhanced transient eddy forcing during the warmperiod of the WNAO, it should be noted that a largeportion of the warming is also contributed by thesubsequent reduction of sea ice concentration over theBarents–Kara Seas through the enhanced energy fluxesfrom the Arctic Ocean (figure A1 in supplementaryinformation). However, in this study, we did notconduct any quantitative assessments on that partsince we are only interested in the Atlantic origin of thewarming.
It is still unknown why the transient eddy activitiesshow those systematic behaviors responding to thespecific SST patterns over the North Atlantic Ocean.To deal with this issue, we need to understand howindividual Atlantic storms respond to warm SST overthe WNAO by tracking storm intensity and its passage(storm track) along the storm. Both systematicchanges in storm intensity and track in associationwith the particular SST pattern over the North Atlanticshould collectively contribute to the monthly-time-scale transient eddy forcing. We are currentlyinvestigating this problem by tracking individualAtlantic storms.
Acknowledgments
We thank the two reviewers for their helpfulcomments. This work is conducted to fulfill the taskassigned to the project of Korea Polar ResearchInstitute titled ‘Development and Application of theKorea Polar Prediction System (KPOPS) for ClimateChange and Disasterous Weather Events’. First author,Jung Ok, is partly supported by ‘Development ofcloud-precipitation Algorithms’ project, funded byETRI, which is a subproject of ‘Development ofGeostationary Meteorological Satellite Ground Seg-ment (NMSC-2016-01)’ program funded by NMSC(National Meteorological Satellite Center) of KMA(Korea Meteorological Administration). Jee-HoonJeong is supported by the Korea MeteorologicalAdministration Research and Development Program(KMIPA2015–2091).
References
Barnston A G and Livezey R E 1987 Classification, seasonalityand persistence of low-frequency atmospheric circulationpatterns Mon. Weather Re. 115 1083–126
Brayshaw D J, Hoskins B and Blackburn M 2008 The storm-track response to idealized SST perturbations in anAquaplanet GCM J. Atmos. Sci. 65 2842–60
Bueh C and Nakamura H 2007 Scandinavian pattern and itsclimatic impact Q. J. R. Meteorol. Soc. 133 2117–31
Cohen J L, Furtado J C, Barlow M A, Alexeev VA and Cherry J E2012 Arctic warming, increasing snow cover and widespreadboreal winter cooling Environ. Res. Lett. 7 014007
Comiso J C, Parkinson C L, Gersten R and Stock L 2008Accelerated decline in the Arctic sea ice cover Geophys.Res. Lett. 35 L01703

Environ. Res. Lett. 12 (2017) 034021
Delworth T L et al 2006 GFDL’s CM2 global coupled climatemodels. Part I: formulation and simulation characteristicsJ. Clim. 19 643–74
Francis J A and Vavrus S J 2012 Evidence linking Arcticamplification to extreme weather in mid-latitudes Geophys.Res. Lett. 39 L06801
Frankignoul C, Sennéchael N, Kwon Y-O and Alexander M A2011 Influence of the Meridional shifts of the Kuroshioand the Oyashio extensions on the atmospheric circulationJ. Clim. 24 762–77
Hanna E, Fettweis X, Mernild S H, Cappelen J, Ribergaard M H,Shuman C A, Steffen K, Wood L and Mote T L 2014Atmospheric and oceanic climate forcing of the exceptionalGreenland ice sheet surface melt in summer 2012 Int. J.Climatol. 34 1022–37
Inoue J, Hori M E and Takaya K 2012 The role of Barents Seaice in the wintertime cyclone track and emergence of awarm-arctic cold-Siberian anomaly J. Clim. 25 2561–8
Kalnay E et al 1996 The NCEP/NCAR 40-year reanalysis projectBull. Am. Meteorol. Soc. 77 437–71
Kim B-M, Son S-W, Min S-K, Jeong J-H, Kim S-J, Zhang X,Shim T-H and Yoon J-H 2014 Weakening of thestratospheric polar vortex by Arctic sea-ice loss Nat.Commun. 5 4646
Kug J-S, Jeong J-H, Jang Y-S, Kim B-M, Folland C K, Min S-Kand Son S-W 2015 Two distinct influences of Arcticwarming on cold winters over North America and EastAsia Nat. Geosci. 8 759–62
Lim Y K and Kim H D 2016 Comparison of the impact of theArctic Oscillation and Eurasian teleconnection oninterannual variation in East Asian winter temperaturesand monsoon Theor. Appl. Climatol. 124 267–79
Lim Y-K, Schubert S D, Nowicki S M, Lee J N, Molod A M,Cullather R I, Zhao B and Velicogna I 2016 Atmosphericsummer teleconnections and Greenland ice sheet surfacemass variations: Insights from MERRA-2 Environ. Res.Lett. 11 024002
Luo D, Xiao Y, Yao Y, Dai A, Simmonds I and Franzke C L E2016 Impact of Ural blocking on winter warm arctic-coldEurasian anomalies. Part I: blocking-induced amplificationJ. Clim. 29 3925–47
Minobe S, Yoshida-Kuwano A, Komori N, Xie S P and Small R J2008 Influence of the Gulf Stream on the troposphereNature 452 206–9
Mori M, Watanabe M, Shiogama H, Inoue J and Kimoto M 2014Robust Arctic sea-ice influence on the frequent Eurasian coldwinters in past decades Nat. Geosci. 7 869–73
Mosley-Thompson E, Readinger C R, Craigmile P, Thompson LG and Calder C A 2005 Regional sensitivity of Greenlandprecipitation to NAO variability Geophys. Res. Lett. 32L24707
Nakanowatari T, Sato K and Inoue J 2014 Predictability of theBarents Sea ice in early winter: remote effects of oceanicand atmospheric thermal conditions from the NorthAtlantic J. Clim. 27 8884–901
Nakanowatari T, Inoue J, Sato K and Kikuchi T 2015Summertime atmosphere-ocean preconditionings for theBering Sea ice retreat and the following severe winters inNorth America Environ. Res. Lett. 10 094023
Nakamura H, Sampe T, Goto A, Ohfuchi W and Xie S P 2008On the importance of midlatitude oceanic frontal zonesfor the mean state and dominant variability in thetropospheric circulation Geophys. Res. Lett. 35 L15709
8
North G R, Bell T L, Cahalan R F and Moenig F J 1982Sampling errors in the estimation of empirical orthogonalfunctions Mon. Weather Rev. 110 669–706
Overland J E and Wang M 2010 Large scale atmosphericcirculation changes are associated with the recent loss ofArctic sea ice Tellus A 62 1–9
Overland J E, Wood K R and Wang M 2011 Warm Arctic-coldcontinents: climate impacts of the newly open Arctic seaPolar Res. 30 15787
Overland J E, Francis J A, Hall R, Hanna E, Kim S-J and VihmaT 2015 The melting Arctic and mid-latitude weatherpatterns: are they connected? J. Clim. 28 7917–32
Pershing A J et al 2015 Slow adaptation in the face of rapidwarming leads to collapse of the Gulf of Maine cod fisheryScience 350 809–12
Plumb R A 1986 Three-dimensional propagation of TransientQuasi-geostrophic Eddies and its relationship with theEddy forcing of the time mean flow J. Atmos. Sci. 431657–78
Rayner N A, Parker D E, Horton E B, Folland C K, Alexander LV, Rowell D P, Kent E C and Kaplan A 2003 Globalanalyses of sea surface temperature, sea ice, and nightmarine air temperature since the late nineteenth century J.Geophys. Res. Atmos. 108 002670
Saba V S et al 2016 Enhanced warming of the NorthwestAtlantic Ocean under climate change J. Geophys. Res.Oceans 121 118–32
Sampe T, Nakamura H, Goto A and Ohfuchi W 2010Significance of a Midlatitude SST Frontal Zone in theformation of a Storm Track and an Eddy-Driven WesterlyJet� J. Clim. 23 1793–814
Sato K, Inoue J and Watanabe M 2014 Influence of the GulfStream on the Barents Sea ice retreat and Eurasiancoldness during early winter Environ. Res. Lett. 9084009
Screen J A and Simmonds I 2010 Increasing fall-winter energyloss from the Arctic Ocean and its role in Arctictemperature amplification Geophys. Res. Lett. 37 L16707
Simmonds I and Govekar P D 2014 What are the physical linksbetween Arctic sea ice loss and Eurasian winter climate?Environ. Res. Lett. 9 101003
Stroeve J C, Kattsov V, Barrett A, Serreze M, Pavlova T, HollandM and Meier W N 2012 Trends in Arctic sea ice extentfrom CMIP5, CMIP3 and observations Geophys. Res. Lett.39 L16502
Sung M-K, An S-I, Kim B-M and Woo S-H 2014 A physicalmechanism of the precipitation dipole in the westernUnited States based on PDO-storm track relationshipGeophys. Res. Lett. 41 4719–26
Ting M and Yu L 1998 Steady response to tropical heating inwavy linear and nonlinear baroclinic models J. Atmos. Sci.55 3565–82
Vihma T 2014 Effects of Arctic sea ice decline on weather andclimate: a review Surv. Geophys. 35 1175–214
Wang H and Ting M 1999 Seasonal cycle of the climatologicalstationary waves in the NCEP-NCAR reanalysis J. Atmos.Sci. 56 3892–919
Wu L et al 2012 Enhanced warming over the global subtropicalwestern boundary currents Nat. Clim. Change 2 161–6
Zhang X, He J, Zhang J, Polyakov I, Gerdes R, Inoue J and WuP 2013 Enhanced poleward moisture transport andamplified northern high-latitude wetting trend Nat. Clim.Change 3 47–51