how does the sun's spectrum vary? - nasa · how does the sun's spectrum vary? judith l....
TRANSCRIPT

How Does the Sun's Spectrum Vary?
Judith L. Lean
Space Science Division, Naval Research Laboratory, Washington, DC 20375 USA
Matthew T. DeLand
Science Systems and Applications, Inc., Lanham, MD 20706 USA
for Submission to Journal of Climate, Expedited Contribution
Draft: September 8,2011
https://ntrs.nasa.gov/search.jsp?R=20110023421 2020-01-03T18:19:10+00:00Z

Abstract
Recent observations made by the Spectral Irradiance Monitor (SIM) on the Solar
Radiation and Climate Experiment (SORCE) spacecraft suggest that the Sun's visible and
infrared spectral irradiance increased from 2004 to 2008, even as the total solar irradiance
measured simultaneously by SORCE's Total Irradiance Monitor (TIM) decreased. As well,
solar ultraviolet (UV) irradiance decreased 3 to 10 times more than expected from prior
observations and model calculations of the known effects of sunspot and facular solar
features. Analysis of the SIM spectral irradiance observations during the solar minimum
epoch of 2008, when solar activity was essentially invariant, exposes trends in the SIM
observations relative to both total solar irradiance and solar activity that are unlikely solar
in origin. We suggest that the SIM's radically different solar variability characterization is a
consequence of undetected instrument sensitivity drifts, not true solar spectrum changes.
It is thus doubtful that simulations of climate and atmospheric change using SIM
measurements are indicative of real behavior in the Earth's climate and atmosphere.
1. Introduction
Since incoming solar radiation supplies the energy that powers Earth's climate and
atmosphere, reliable knowledge of the spectral distribution of this radiation and of
wavelength-dependent long-term irradiance variations is critical for assessing solar
induced climate and ozone change. Multiple space-based measurements made in the past
30 years show that total solar irradiance (TSI), the radiant energy integrated over all
wavelengths, increased ~0.1 % at peaks of the Sun's recent 11-year cycles (Kopp and Lean
2011) and middle ultraviolet spectral energy increased by at least an order of magnitude
more and Woods 2010). But Irradiance Monitor (SIM) on the Solar

Radiation and Climate Experiment (SORCE) has observed spectral irradiance
simultaneously at the ultraviolet, visible and infrared wavelengths that compose the bulk of
TSI changes. SIM measured solar spectral irradiance variations at wavelengths between
240 and 1630 nm from the 2004 to 2008, during a portion of the descending phase of solar
cycle 23, reporting a 0.3 Wm-2 (2%) decrease in UV energy at 250 to 300 nm and a
corresponding 0.3 Wm-2 (0.2%) increase in visible energy at 600 to 700 (Harder et al.
2005). Figure 1 shows these changes in the context of the spectral irradiance database.
In lieu of direct, continuous solar spectral irradiance observations on climatological
time scales, models such as the Naval Research Laboratory Solar Spectral Irradiance
(NRLSSI) variability model have been developed to calculate the variations arising from the
wavelength-dependent effects of sunspots and faculae, the two primary known sources of
solar irradiance variations (e.g., Lean and Woods 2010). NRLSSI reproduces short term
spectral irradiance changes (time scale of days) associated with the Sun's nominal 27-day
rotation on its axis observed simultaneously throughout the UV, visible and infrared
spectrum but suggest much smaller solar cycle changes (time scale of years) than SIM
reports, and a solar cycle change in the visible spectrum both smaller in amplitude and in
phase (rather than out-of-phase) with solar activity. Analagous models that utilize
bolometric (spectrally weighted and integrated) sunspot and facular parameterizations
account for a high fraction (92%) of the total solar irradiance variance that TIM measured
simultaneously with SIM's spectral irradiance measurements, on both solar rotation and
solar cycle time scales (Kopp and Lean 2010).
A recent simulation of climate and atmospheric responses to solar spectrum changes
using the SIM measurements reported that "the effects of solar variability on temperature
2

throughout the atmosphere may be contrary to current expectations" (Haigh et al. 2010),
concluding that higher solar activity cools, rather than warms, the Earth. Specifically,
because the solar visible spectral energy is less during high solar activity, according to the
SIM measurements, the effect of the solar activity cycle is to cool the Earth's surface
temperature. This statement contradicts numerous empirical analyses that relate
increased global surface temperature with higher solar activity (Lean 2010). Indeed, the
combination of global surface cooling produced by decreasing solar irradiance from 2002
to 2008 and greenhouse gaS-induced warming is an explanation for the minimal upward
trend in the University of East Anglia Climate Research Unit (CRU) surface temperature
record between 2002 and 2009.
During the 2008 minimum between solar cycles 23 and 24 trends in solar activity and
total solar irradiance were negligible. We analyze SIM measurements during this period
with the goal of clarifying causes of the severe discrepancies between the spectral
irradiance changes that SIM measures and NRLSSI models, and averting misleading
inferences from climate model simulations.
2. Measured Spectrallrradiance Variations
Multiple measurements and analyses indicate that high solar activity produces high
solar UV irradiance, with shorter UV wavelengths increasing more (Lean and Woods 2010;
DeLand and Cebula 2011). The databases of the HI Lyman a emission line at 121.6 nm and
the irradiance in a band from 250-300 nm in Figures 1a and 1b illustrate this; during times
of recent solar activity maxima (1980, 1990, 2000) the UV irradiance increased ~60% at
Lyman a and -2% in the 250-300 nm band. In the visible and near infrared spectrum,

irradiance changes during the solar cycle are an order of magnitude smaller than in the UV
spectrum and, according to the SIM observations shown in Figure lc, opposite in phase.
Figure 2, which shows spectral irradiance changes from April 2004 to December 2008,
indicates that SIM's measurements are out of phase with solar activity at all wavelengths
longer than 400 nm, and in phase with solar activity at all shorter wavelengths.
The significant differences evident among overlapping measurements in UV irradiance
at 250 to 300 nm, such as from 1992 to 1995 in Figure Ib, point to instrumental effects in
the database. Because the relative long-term accuracies of the measurements made prior to
the SIM are of order 2% (Woods et al. 1997) separating solar cycle changes from
instrumental drifts in the middle ultraviolet spectral irradiance database is a challenging
task. The much larger cycle amplitudes of far ultraviolet spectral irradiance, as exemplified
by the Lyman a data in Figure la, are measured with greater certainty and evident in the
general agreement among the multiple measurements (allowing for different calibration
offsets arising from absolute uncertainties in individual datasets).
Harder et al (2009) report that the -2% decrease in the 250-300 nm band in Figure Ib
and the middle and near UV spectral irradiance changes in Figure 2 characterize real solar
variability because the magnitudes of the variations exceed the long-term relative accuracy
of the SIM instrument, reported to be 0.5% to 0.1% at wavelengths from 200 to 300 nm
and 0.2% to 0.05% at wavelengths from 300 to 400 nm. That the decrease in SIM's UV
irradiances occurs during only one third of cycle 23's full dynamic range suggests a solar
cycle amplitude two to three times larger than derived from previous observations after
careful scrutiny ofin-flight instrumental behavior (DeLand and Cebula 2011).
4
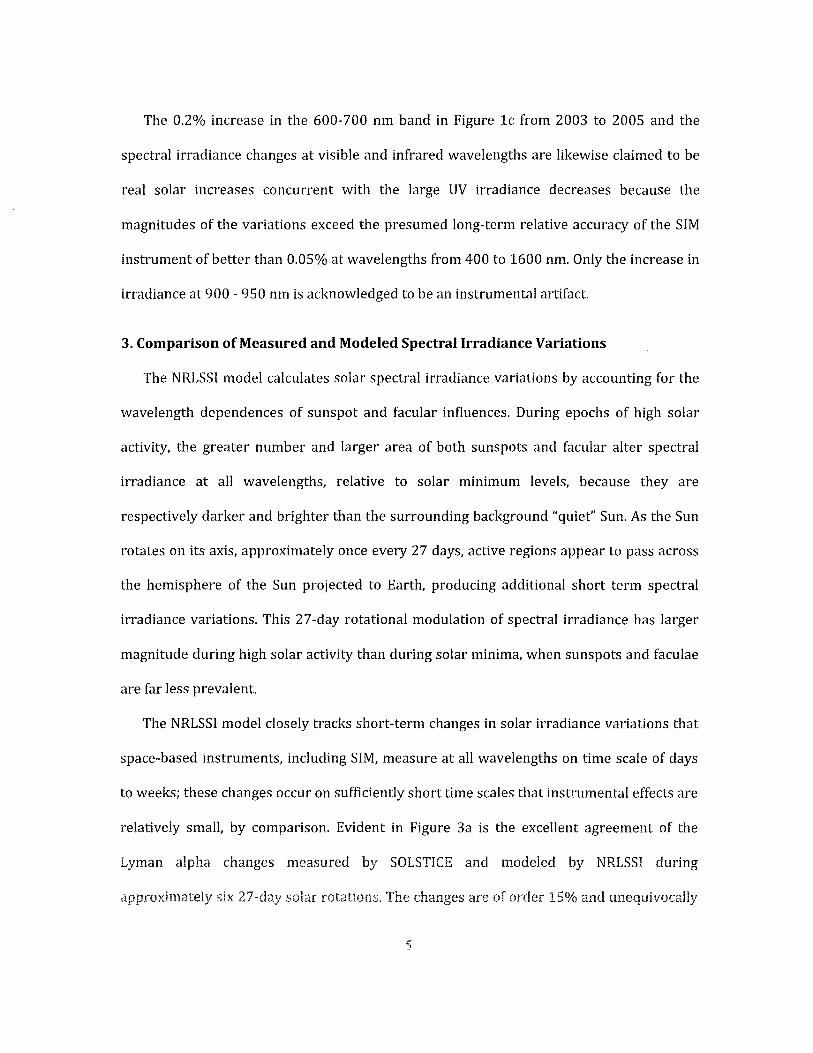
The 0.2% increase in the 600-700 nm band in Figure lc from 2003 to 2005 and the
spectral irradiance changes at visible and infrared wavelengths are likewise claimed to be
real solar increases concurrent with the large UV irradiance decreases because the
magnitudes of the variations exceed the presumed long-term relative accuracy of the SIM
instrument of better than 0.05% at wavelengths from 400 to 1600 nm. Only the increase in
irradiance at 900 - 950 nm is acknowledged to be an instrumental artifact.
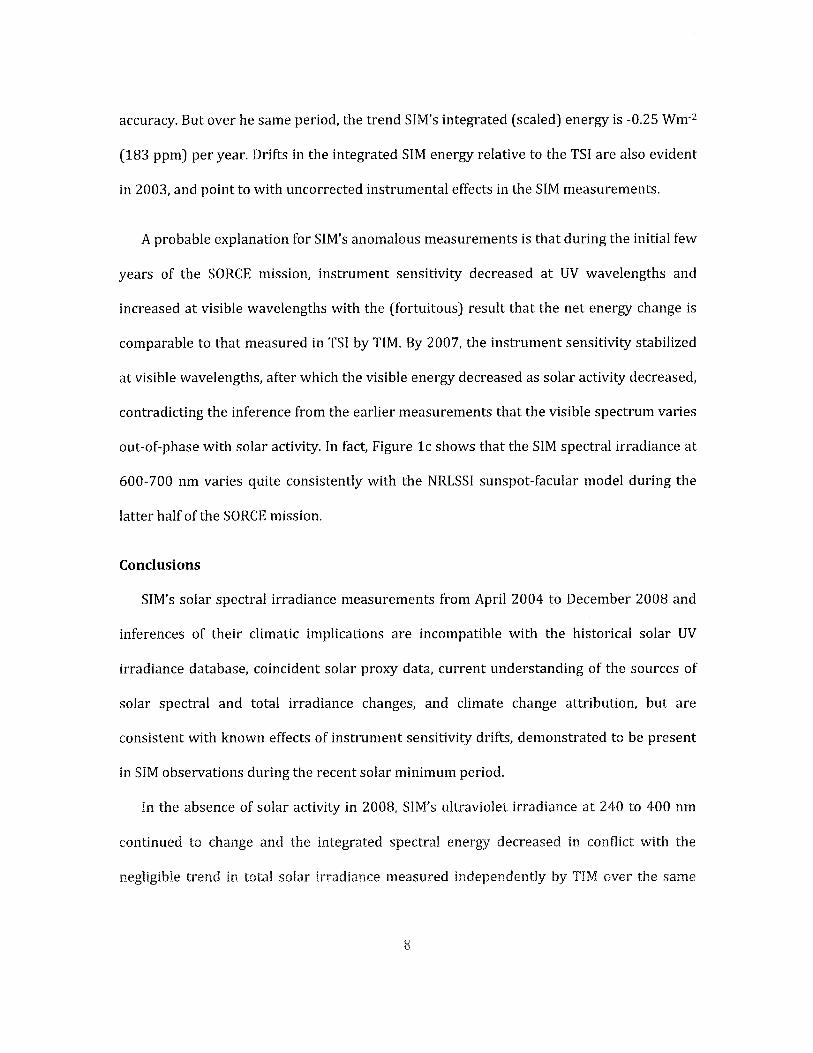
3. Comparison of Measured and Modeled Spectral Irradiance Variations
The NRLSSI model calculates solar spectral irradiance variations by accounting for the
wavelength dependences of sunspot and facular influences. During epochs of high solar
activity, the greater number and larger area of both sunspots and facular alter spectral
irradiance at all wavelengths, relative to solar minimum levels, because they are
respectively darker and brighter than the surrounding background "quiet" Sun. As the Sun
rotates on its axis, approximately once every 27 days, active regions appear to pass across
the hemisphere of the Sun projected to Earth, producing additional short term spectral
irradiance variations. This 27 -day rotational modulation of spectral irradiance has larger
magnitude during high solar activity than during solar minima, when sunspots and faculae
are far less prevalent.
The NRLSSI model closely tracks short-term changes in solar irradiance variations that
space-based instruments, including SIM, measure at all wavelengths on time scale of days
to weeks; these changes occur on sufficiently short time scales that instrumental effects are
relatively small, by comparison. Evident in Figure 3a is the excellent agreement of the
Lyman alpha changes measured by SOLSTICE and modeled by NRLSSI during
six rotations. The changes are of 15% and unequivocally
5

of solar origin. Even though the variability is an order of magnitude smaller at middle UV
wavelengths, there is good agreement in Figure 3b between rotational modulation of the
250-300 nm band that SIM measures and NRLSSI models. Aside from an underlying trend
in the SIM observations, the measured and modeled irradiance decreases evident in the
600-700 nm band, of order 0.5%, also agree well. This good agreement of the SIM
observations and the NRLSSI model of rotationally modulated solar spectral irradiance
extends to all wavelengths, during both solar minimum and maximum epochs, and
indicates that the sunspot and facular parameterizations in the NRLSSI model are robust.
The fundamental differences between the SIM measurements and the NRLSSI model on
time scales of months to years, evident in Figures 1b and 1c and Figure 2, must therefore
arise from a mechanism that dominates on solar cycle time scales, but differs from, and is of
greater strength than, the direct effects of sunspots and faculae. In the absence of solar
activity, spectral irradiance is expected to neither increase nor decrease. During the
quiescent period from May to December 2008 when sunspots were absent from the disk
for extended periods and other indicators of solar activity flux essentially invariant, the
NRLSSI model indicates negligible irradiance trends at all wavelengths. Figure 4a shows
that during this time the trend in the Lyman a observations was indeed minimal (-0.016
mW m-2 per year, less than 0.5% of the cycle amplitude) and equal to the NRLSSI model
trend (-0.004 mW m-2 per year) to within the 2% measurement instability (±0.14 mW m-2).
The SIM measurements, however, diverge markedly from the NRLSSI model in 2008,
which Figures 4b ad 4c illustrate for the UV and visible bands. The most likely explanation
for this divergence is not solar variability, which was essentially absent, but uncorrected
instrument changes. Solar exposure is known to decreases the sensitivity of solar
6

UV instruments by degrading the performance of the optical elements and to initially
increase the sensitivity of bolometric detectors by enhanced cavity blackening. Assuming
that trends in the SIM measurements from May to December 2008 are instrumental allows
an estimate of uncertainties associated with SIM's measurements. Figure 5 shows the
wavelength dependence of SIM measurement uncertainties over the mission duration from
April 2004 to December 2008 estimated from the absolute value of the trend during solar
minimum, compared with the generally (much) smaller uncertainties that Harder et al
(2009) report. Since instrumental changes are typically larger during the beginning of a
space mission, the uncertainties in Figure 5 estimated during 2008 (the 6th year of SORCE
mission) likely underrepresent the instrumental instabilities in prior years.
The uncertainty in the SIM UV spectral irradiance measurements during the SORCE
mission is as large as 2% at some wavelengths, and typically a factor of 2 to 5 larger than
Harder et al. (2009) report (but quite typical of uncertainties reported for prior UV
irradiance measurements). Because of these larger uncertainties, is not possible to claim
that the UV spectral irradiance variations that SIM measures are entirely real solar
variations rather than, at least partly, uncorrected instrumental changes.
4. Total Irradiance Constraints on Spectral Irradiance Variations
An immutable constraint on solar spectral irradiance is that the integral over
wavelength equals the total solar irradiance. Yet there are notable differences between
SIM's summed and scaled (by 1.11) energy from 240 to 1630 nm and the total solar
irradiance measured independently by TIM, shown together Figure 6. During solar
minimum, from May to December 2008, TIM measured a long-term TSI trend of -0.01 W m-
2 per year, which is effectively zero iUs than TIM's 10 per year
7
accuracy. But over he same period, the trend SIM's integrated (scaled) energy is -0.25 Wm-2
(183 ppm) per year. Drifts in the integrated SIM energy relative to the TSI are also evident
in 2003, and point to with uncorrected instrumental effects in the SIM measurements.
A probable explanation for SIM's anomalous measurements is that during the initial few
years of the SORCE mission, instrument sensitivity decreased at UV wavelengths and
increased at visible wavelengths with the (fortuitous) result that the net energy change is
comparable to that measured in TSI by TIM. By 2007, the instrument sensitivity stabilized
at visible wavelengths, after which the visible energy decreased as solar activity decreased,
contradicting the inference from the earlier measurements that the visible spectrum varies
out-of-phase with solar activity. In fact, Figure 1c shows that the SIM spectral irradiance at
600-700 nm varies quite consistently with the NRLSSI sunspot-facular model during the
latter half of the SORCE mission.
Conclusions
SIM's solar spectral irradiance measurements from April 2004 to December 2008 and
inferences of their climatic implications are incompatible with the historical solar UV
irradiance database, coincident solar proxy data, current understanding of the sources of
solar spectral and total irradiance changes, and climate change attribution, but are
consistent with known effects of instrument sensitivity drifts, demonstrated to be present
in SIM observations during the recent solar minimum period.
In the absence of solar activity in 2008, SIM's ultraviolet irradiance at 240 to 400 nm
continued to change and the integrated spectral energy decreased in conflict with the
negligible trend in total solar irradiance measured independently by TIM over the same
8

period. The anomalously large decrease in UV energy is likely a result of uncorrected
instrumental changes compensating an anomalously large energy increase in the visible
and infrared spectrum, also of instrumental origin. Both the UV and visible anomalies are
consistent with know changes in instrument sensitivities. There trends in SIM observations
independent of solar activity (in 2008) suggest UV measurements uncertainties larger by a
factor of 2 to 5 than Harder et al. (2009) report.
Rather than revising current understanding of solar physics and solar variability effects
on climate, improved characterization of the SIM observations themselves is needed. Work
is in progress to reassess the spectral irradiance variations measured by SORCE SIM and a
new, advanced SIM has been designed and is under construction for flight on the Joint Polar
Satellite System (P. Pilewskie, private communication, 2011). To prevent future research
following a path of unrealistic solar-terrestrial behavior, the SORCE SIM observations
should be used with extreme caution in studies of climate and atmospheric change until
additional validation and uncertainty estimates of these observations are available.
Acknowledgements
NASA funded this work. Jerry Harder provided the SIM spectral irradiance data. In
preparing this article we appreciate the encouragement of Edouard Bard and Gavin
Schmidt, and discussions with Peter Pilewskie.
9

References
DeLand, M. T., and R. P. Cebula (2011), Solar UV variations during the decline of cycle 23. In
preparation for submission to J. Atmos. Terrestr. Phys.
Haigh, J. D., A. R. Winning, R. Toumi, and J. W. Harder (2010), An influence of solar spectral
variations on radiative forcing of climate, Nature, 467,696-699.
Harder, J. W., J. M. Fontenla, P. Pilewskie, E. C. Richard, and T. N. Woods (2009), Trends in
solar spectral irradiance variability in the visible and infrared, Geophys. Res. Lett., 36,
L07801, doi:10.1029 j2008GL036797.
Kopp, G., and J. L. Lean (2011), A new, lower value of total solar irradiance: Evidence and
climate significance, Geophys. Res. Lett., dOi:10.1029j2010GL045777
Lean, J. L. (2010), Cycles and trends in solar irradiance and climate, Wiley Interdisciplinary
Reviews - Climate Change, 1, doi:10.1002jwcc.18, 111-122.
Lean, J. L., and T. N. Woods (2010), Solar Spectral Irradiance Measurements and Models, in
Evolving Solar Physics and the Climates of Earth and Space, Karel Schrijver and
George Siscoe (Eds), Cambridge Univ. Press.

Figures
1. Assorted space-based observations made of solar spectral irradiance during the past three solar
cycles are compared for a) the Ly a emission line at 121.6 nm, b) the middle ultraviolet band
from 250 to 300 nm, and c) the visible band from 600 to 700 nm, after making offset
adjustments to account for their different absolute calibration scales. Also shown, as the grey
time series, is the NRLSSI model of the irradiance variations in the same wavelength bands,
derived by scaling the observed rotational modulation variations to the Mg facular proxy and
sunspot blocking, using multiple linear regression to determine their relative contributions. Lean
and Woods (2010) and DeLand and Cebula (2011) provide additional details about individual
measurements and model.
2. Shown are the (monthly average) solar spectral irradiance changes from April 2004 to
December 2008 measured by SIM and modeled by NRLSSI at a) 200 to 400 nm, b) 400 to 800
nm, c) 800 to 1200 nm, and d) 1200-1600 nm.
3. Compared are the solar spectral irradiance changes in a) the Ly a emission line at 121.6 nm,
b) the middle ultraviolet band from 250 to 300 nm, and c) the visible band from 600 to 700 nm,
measured during six solar rotations in 2004, a period of moderately high solar activity, compared
with the changes arising from sunspot and facular influences, as modeled by the NLSSI.
4. Compared are the solar spectral irradiance changes in a) the Ly a emission line at 121.6 nm,
b) the middle ultraviolet band from 250 to 300 nm, and c) the visible band from 600 to 700 nm,
11
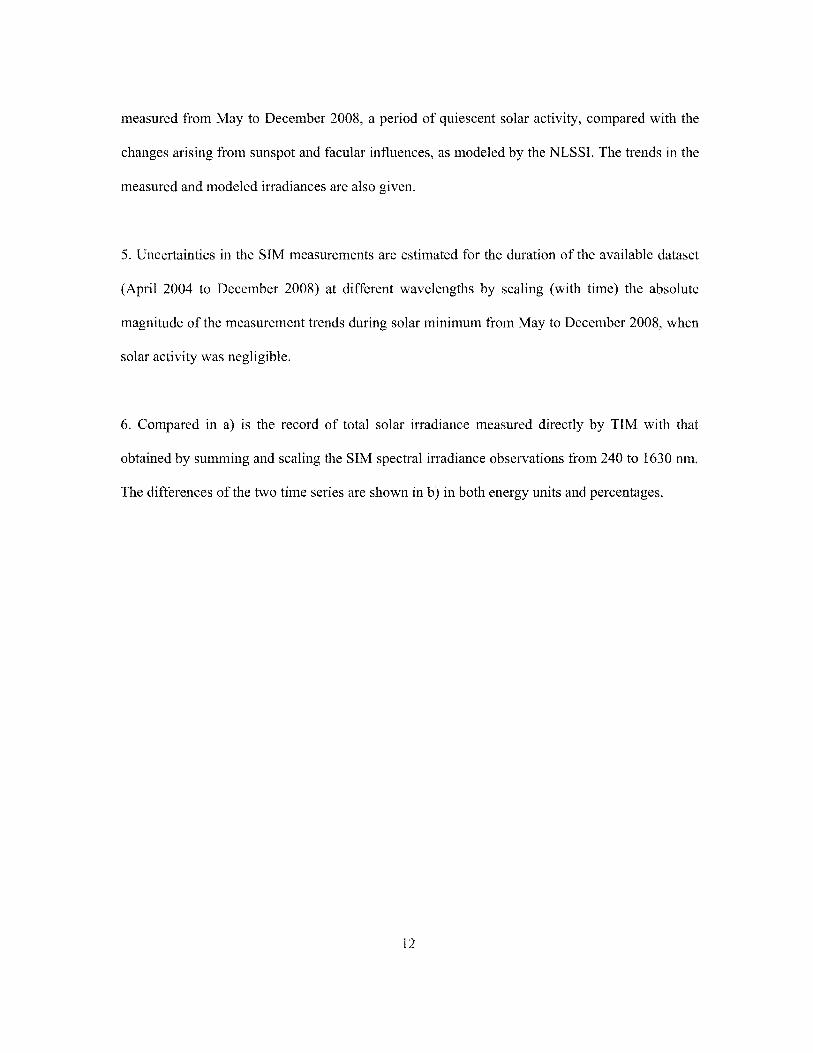
measured from May to December 2008, a period of quiescent solar activity, compared with the
changes arising from sunspot and facular influences, as modeled by the NLSSI. The trends in the
measured and modeled irradiances are also given.
5. Uncertainties in the SIM measurements are estimated for the duration of the available dataset
(April 2004 to December 2008) at different wavelengths by scaling (with time) the absolute
magnitude of the measurement trends during solar minimum from May to December 2008, when
solar activity was negligible.
6. Compared in a) is the record of total solar irradiance measured directly by TIM with that
obtained by summing and scaling the SIM spectral irradiance observations from 240 to 1630 nm.
The differences of the two time series are shown in b) in both energy units and percentages.
12
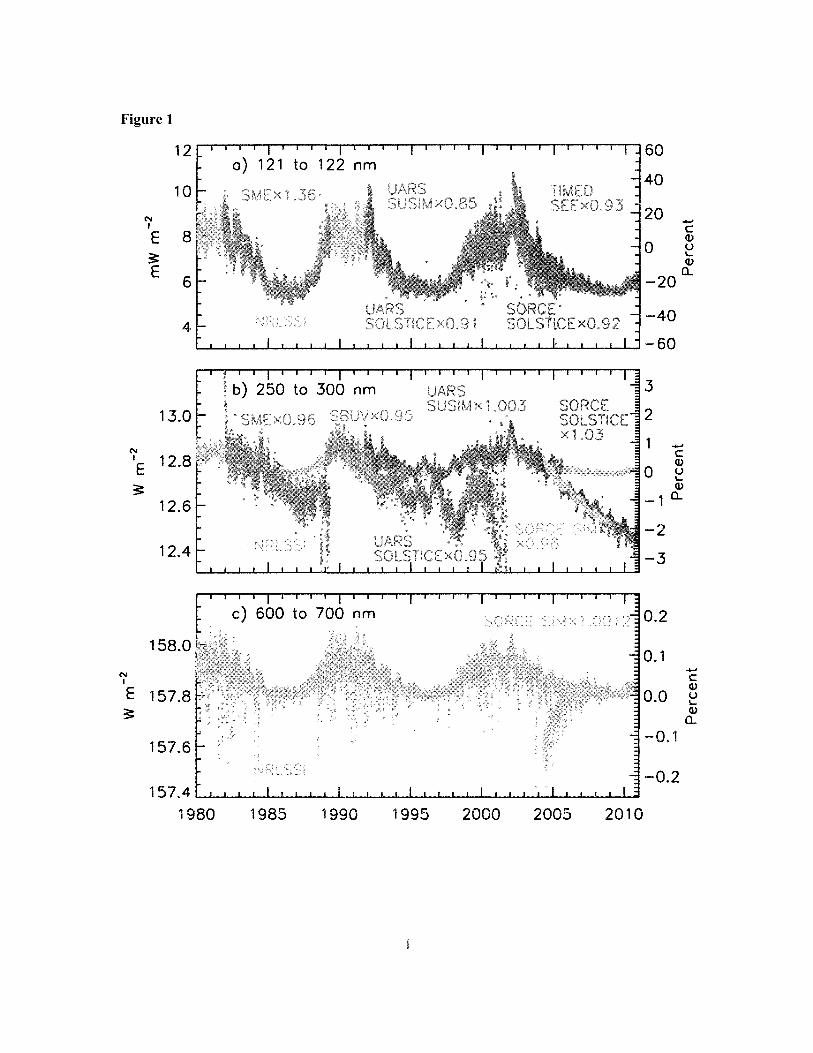
Figure 1
12 60
10 40
N 20 ...... I C E 8
0 (I) ()
3: \.. (I)
E 0.. 6 -20
4 -40
-60
3
13.0 2
N ...... C I 12.8 (I)
E 0 () \..
3: (I)
12.6 _10..
-2 12.4 -3
0.2
158.0 0.1
N ..... C I (I)
E 157.8 0.0 () \..
3: (I)
0..
157.6 -0.1
-0.2 157.4
1980 1985 1990 1995 2000 2005 2010

Figure 2
Spectrum Change: Apr 2004 - Dec 2008
0.012 I 0.010
a)
E 0.008 c
0.006 N I 0.004 E ~ 0.002 NRLSSI
0.000
200 250 300 350 400
0.002 I
0.001 E 0.000 -
rv----------____ ....,..,~ ..... . c -0.001
N
-0.002 I
E -0.003 ~ -0.004
-0.005 400 500 600 700 800
0.004 c) I 0.002 E c
N 0.000 I
NRLSSI jr"----v--~.'"\o-... ~~~ ...... ~ __ ,~~~~=--
E ~
-0.002
-0.004 600 700 800 900 1000 1100 1200
0.0004 d) I 0.0002 E 0.0000 c:
NRLSSI
N -0.0002 I
E -0.0004 ~
-0.0006
1200 1300 1400 1500 1600 Wavelength (nm)
2

Figure 3
N I
E
7.5
7.0
3: 6.5 E
6.0
12.aOr 7E 12.78~t
3: 12.76
158.0
157.9 N I
E 3: 157.8
157.7
0) 121 to 122 nm
b) 250 to 300 nm
c) 600 to 700 nm
2004.5 2004.6 2004.7 2004.8 2004.9
3
10
5 ..... c:
0 Q) 0 \.. Q)
0.. -5
-10
0.3
0.2
0.1 ..... c: Q)
0.0 ~ Q)
-0.1 a.
0.10
0.05 ..... c: Q)
0.00 ~
-0.05
-0.10
2005.0
Q)
0..

Figure 4
5.9
5.8
N 5.7 I
E 5.6 ;:
E 5.5
5.4
5.3
12.76
12.75
N
IE 12.74
12.73
12.72
157.86
157.84
7 157.82 E ;: 157.80
157.78
a) 121 to 122 nm
NRLSSI trend=-0.0038 mWm-2 per yr
6
4
2 ...... c (\)
o ~ (\)
a.. -2
-4
0.15 b) 250 to 300 nm , NRLSSI trend=-0.0002 Wm-2 per yr 0.10
;r\ 1 0.05 ......
,L,~i~Vh.I-Itac-...pq..A-++n'-~I-+-f--\oo1~~~~~ 0.00 ~ r >V/f'<~1}1 -0.05 cf
!
,""'1"",,\>,= -0.10
-0.15
0.03
0.02
0.01 c
f#l,t1~ ~·~~1 j -0.02
157.76~~~~~~~~~~~~~~~~~~~~
2008.4 2008.5 2008.6 2008.7 2008.8 2008.9 2009.0
4

Figure 5
SIM Uncertainty: Apr 2004 - Dec 2008 Estimated from Solar Minimum Trends
2.5 a) 2.0 ......
Harder et 01. e: 1.5 (J) 2009 u L.
1.0 (J)
0-0.5 -----0.0 --------
200 250 300 350 400
0.4
...... 0.3 e: (J) u 0.2 L. (J)
0-0.1
-------0.0
400 500 600 700 800
c 0.15!C)
(J) 0.10 ~ / ,:
~ O.05~-\T~if- ~ J~:,-rr.,-~'--~ri~i.~.--/7C-J"- - ~~
......
0.00 L, , , , , ,', ·,i I, , , , , , , , , I , , , , " ,', ,1, , , , , , , , , Ii, ',', ii, , , , I , , , , , , , , , I
600 700 800 900 1000 1100 1200
0.10 d) 0.08
ai 0.06 !
--".(--!j-;--~~, ~ ---,--- o \ t u - -:- ~ "!""'" ""!'" - ..... - ..,.,
Qi 0.04 0-
0.02 O.OO~~~~~~~~~~~~~~~~~~~~
1200 1 300 1400 1 500 1600 Wavelength (nm)
5

Figure 6
a) Total Solar Irradiance 1362.0
1361.5
N 1361.0 I
E 1360.5
1360.0
1359.5
1359.0
SORCE TIM
~~~~~~~~~~~~~~~~~
2004 2005 2006 2007 2008 2009
1.0 b) ESIM-TIM
0.05 0.5
'7 0.0 E
0.00 c
~ -0.5 -0.05
-1.0
-1.5 ~~.I...\-L..I...\-L.~~~~~~~u..J...L..L..L..~~~.&..&...I...I -0.10 2004 2005 2006 2007 2008 2009
6
Q) U \.. Q)
a..