how effective are the nsse benchmarks in predicting ......please direct questions regarding this...
TRANSCRIPT

How Effective are the NSSE Benchmarks in Predicting Important Educational Outcomes?
Ernest T. Pascarella The University of Iowa
Tricia A. Seifert The University of Toronto
Charles Blaich Center of Inquiry in the Liberal Arts at Wabash College
Please direct questions regarding this paper to: Ernest T. Pascarella, The University of Iowa, College of Education, N491 Lindquist Center, Iowa City, IA 52242, [email protected]; Phone: 319/335-5369; Fax: 319/384-0587 This research was supported by a generous grant from the Center of Inquiry in the Liberal Arts at Wabash College to the Center for Research on Undergraduate Education at The University of Iowa.
IAE (Iowa Academy of Education) 210 Lindquist Center, University of Iowa
Iowa City, IA 52242
The Iowa Academy of Education The Iowa Academy of Education publishes an Occasional Research Paper Series designed to promote informed discussion and debate among educational scholars, leaders, and policy makers in Iowa on topics of importance to the future of education in Iowa, from preschool through the community college years. The Academy regards itself as a non-partisan broker of ideas and intends no collective endorsement or promotion by the Academy of the theories, ideas, findings, or recommended actions contained in its series papers. By choosing authors and topics for papers, however, the Academy does seek to inform and to provoke serious discussion and debate about significant educational topics.
NSSE Validation
2
One of the long-standing conversations in postsecondary education over the
last three decades has focused on the need to hold colleges and universities
accountable for the quality of undergraduate education. Although focused on K-12
education, “A Nation at Risk” launched this concern in earnest. In the same year as
“A Nation at Risk” was published, the U.S. News and World Report began its annual
rankings – substantially influencing the public’s perception of college quality. The
release of the 2006 Spellings Commission Report and its clear emphasis on student
learning provided a new sense of urgency for defining a quality undergraduate
education in terms of student cognitive and personal development. Starting with a
conversation held among a concerned group of higher education stakeholders, the
scope enlarged to engage, not only higher education faculty and administrators, but
also parents, employers, and the general public. Put simply, beyond simply knowing
the characteristics of entering students and graduation statistics, a growing segment of
the population has become interested in knowing what students actually learn in
college.
The Voluntary System of Accountability (VSA), a project sponsored by the
American Association of Colleges and Universities (AAC&U) and the National
Association of State Universities and Land Grant Colleges (NASULGC) was created
for the purpose of helping postsecondary institutions demonstrate accountability and
stewardship to the public by measuring educational outcomes, identifying effective
educational practices, and assembling information in an accessible, understandable,

NSSE Validation
3
and comparable manner. Through the College Portrait, participating institutions
provide information on student and campus characteristics, cost, success and progress
rates, as well as student educational experiences on campus using one of four student
engagement surveys, and student learning outcomes on one of three instruments
measuring broad cognitive skills. With 70% of four-year college students attending
one of AAC&U or NASULGC’s member institutions, the VSA has the potential to
reach an extensive audience and create a market in which information about student
experiences and learning inform students’ and parents’ college decisions.
Other college experience surveys are acceptable for institutions’ completion of
the “Student Experiences and Perceptions” portion of the College Portrait. None,
however, reach the number of students as the National Survey of Student
Engagement (NSSE), which is clearly one of the most widely used annual surveys of
undergraduates in the country. According to the NSSE 2007 Annual Report
(“Experiences That Matter: Enhancing Student Learning and Success,” 2008), the
NSSE survey has been completed by nearly 1.5 million students at nearly 1,200
different colleges and universities in the last decade. In 2008 alone, 774 different
colleges and universities are participating in the annual spring administration of the
15-20 minute survey. The NSSE is specifically designed to measure the extent to
which college students are engaged in empirically-vetted good practices in
undergraduate education. Indeed, one of the major assumptions of the NSSE is that
in measuring such good practices, one is essentially measuring experiences which yield
NSSE Validation
4
desired student cognitive and personal development during college. Thus, other things
being equal, the greater one’s engagement in, or exposure to these good practices the
more developmentally influential one’s undergraduate education—or so the logic
goes.
Over time, NSSE has developed various scales or indexes underlying the
individual items in the survey instrument. The most prominent and frequently
reported are the five NSSE Benchmarks of Effective Educational Practice (hereafter
referred to as benchmarks). These are: Level of Academic Challenge, Active and Collaborative
Learning, Student-Faculty Interaction, Enriching Educational Experiences, and Supportive
Campus Environment (The College Student Report, 2006 Codebook). Level of Academic
Challenge is an eleven-item scale that measures time spent preparing for class, amount
of reading and writing, deep learning, and institutional expectations for academic
performance. Active and Collaborative Learning is a seven-item scale that measures extent
of class participation, working collaboratively with other students inside and outside
of class, tutoring and involvement with a community-based project. The Student-
Faculty Interaction scale consists of six items and measures extent of interaction with
faculty members and advisors, discussing ideas from classes with faculty members
outside of class, getting prompt feedback on academic performance, and working
with faculty on a research project. Enriching Educational Experiences is a scale with
twelve items that measures extent of interaction with students of different racial or
ethnic backgrounds or with different values or political opinions, using information

NSSE Validation
5
technology, and participating in activities such as internships, community service,
study abroad, and co-curricular activities. Finally, Supportive Campus Environment is a six-
item scale measuring the extent to which students perceive the campus helps them
succeed academically and socially, assists them in coping with nonacademic
responsibilities, and promotes supportive relations among students and their peers,
faculty members, and administrative personnel and offices. [The above descriptions of
the five benchmark scales were taken from the College Student Report, 2006
Codebook (2006) developed by NSSE.]
Despite their broad-based national, and even international, use it seems
reasonable to ask if good practices in undergraduate education as measured by the
rather brief NSSE benchmarks actually do predict important educational outcomes.
With some narrowly focused exceptions (Carini, Kuh, & Klein, 2006; LaNasa, Olson,
& Alleman, 2007), however, nearly all the predictive validity evidence in this regard is
based on studies that link the various NSSE measures of good practices to student
self-reported gains in intellectual and personal development that are assessed by a set
of 16 items near the end of the NSSE instrument itself. [For a review of these studies
see Pascarella, Seifert, and Blaich (2008), Validation of the NSSE benchmarks and deep
approaches to learning against liberal arts outcomes; available from
http://www.education.uiowa.edu/crue/publications/index.htm.]
Although such self-reported gains can be formed into psychometrically reliable
scales, serious problems exist with the internal validity of any findings in which self-
NSSE Validation
6
reported gains are employed as an outcome or criterion measure for the effects of the
NSSE benchmark scales. In a 2001 article in the Journal of College Student Development
Pascarella (2001) notes that the key problem lies in the cross-sectional nature of the
data collection. Students complete the self-reported gains part of the NSSE only
once—at the same time they complete the items of the benchmarks. When
researchers do not have a precollege measure of an individual student’s receptiveness
to educational experiences, it is difficult—if not impossible—to distinguish how much
of that student’s self-reported “gain” on some outcome is due to the added value of
college from how much is simply due to his or her disproportionate openness and
receptivity to the college experience. Two students having the same educational
experience could report substantially different gains because they enter college
differentially open or receptive to the effects of postsecondary education. Absent a
precollege measure of the students’ response propensities on self-reported gains items
(e.g., self-reported gains during high school), it is nearly impossible to take this
differential receptiveness to educational experiences into account. Thus, using the
NSSE self-reported gains in college as a criterion for good practices runs a high risk
of confounding the effects of exposure to good practices as measured by the NSSE
benchmarks with the particular individual characteristics of the students an institution
attracts and admits (Astin & Lee, 2003; Pascarella, 2001). Furthermore, recent
evidence reported by Bowman (2009) indicates little or no overlap between self-
reported gains and longitudinal (pretest-posttest) gains made on standardized, more

NSSE Validation
7
objectively-measured instruments. Such evidence would seemingly raise a reasonable
question about what self-reported gains are actually measuring.
The bottom line is that we have, at present, very little internally valid evidence
with respect to the actual predictive validity of the NSSE. This is a serious concern if
participating postsecondary institutions are asked to consider the NSSE benchmark
scales as a proxy for institutional practices in undergraduate education that facilitate
student growth in important educational outcomes. Consequently, pursuant to a
subcontract from the Center of Inquiry in the Liberal Arts at Wabash College, the
Center for Research on Undergraduate Education at The University of Iowa analyzed
institutional-level data from the first year of the Wabash National Study of Liberal
Arts Education (hereafter WNSLAE) to estimate the validity of the NSSE
benchmarks in predicting seven standardized traits and skills thought to be the
outcomes of a general liberal arts education. In addition to measuring outcomes other
than self-reported gains, our study addresses the limitations of past research on the
NSSE by using a longitudinal, pretest-posttest approach. No other investigation of
which we are aware is configured to conduct such a comprehensive validation of the
benchmark scales with institutions as the focus.
The Wabash National Study of Liberal Arts Education
The WNSLAE is a longitudinal investigation of the institutional experiences
that enhance growth in important educational outcomes. Using a pretest-posttest
design, it measured first-year student change on a range of dimensions derived from a
NSSE Validation
8
model of college outcomes historically associated with a liberal arts education
developed by King, Kendall Brown, Lindsay, and VanHecke (2007). The five liberal
arts outcome dimensions addressed in our analyses were as follows. 1) Effective
Reasoning and Problem Solving: To tap this dimension we used the 32-item Critical
Thinking Test of the Collegiate Assessment of Academic Proficiency (CAAP), which
is one of the learning outcome measures recommended by the VSA. The Critical
Thinking Test was developed by the American College Testing Program and measures
a student’s ability to clarify, analyze, evaluate, and extend arguments. 2) Moral
Character: This was measured by the N2 score of the Defining Issues Test (DIT). The
N2 score measures the extent to which a student uses high order (principled/post-
conventional) moral reasoning in resolving moral issues. It also reflects the extent to
which one rejects ideas because they are biased or simplistic. 3) Inclination to Inquire and
Lifelong Learning: This dimension was measured by the 18-item Need for Cognition
Scale and the 6-item Positive Attitude Toward Literacy Scale. The Need for Cognition
Scale measures a student’s tendency to engage in and enjoy effortful cognitive activity,
while the Positive Attitude Toward Literacy Scale assesses one’s enjoyment of such
literacy-oriented activities as reading poetry and literature, reading scientific and
historical material, and expressing ideas in writing. 4) Intercultural Effectiveness: This
dimension was tapped by the total score of the 15-item Miville-Guzman Universality-
Diversity Scale and the 7-item Openness to Diversity/Challenge Scale. The Miville-
Guzman measures an attitude of awareness and acceptance of both similarities and

NSSE Validation
9
differences among people, while the Openness to Diversity Scale measures a student’s
openness to cultural and racial diversity as well as the extent to which one enjoys
being challenged by different perspectives, values, and ideas. 5) Personal Well-Being:
This was measured by the total score of the 54-item Ryff Scales of Psychological
Well-Being (SPWB). The SPWB is a theoretically grounded instrument that assesses
six dimensions of psychological well-being: self-acceptance, personal growth, purpose
in life, positive relations with others, environmental mastery and autonomy, from
which we created a total scale. The reliabilities of the seven measures ranged from .71
to .91 and averaged .82. [Detailed descriptions of the reliability and predictive validity
of each measure, as well as an extensive technical description of the conduct of the
WNSLAE can be found in Pascarella, Seifert, and Blaich (2008), Validation of the
NSSE benchmarks and deep approaches to learning against liberal arts outcomes; available from
http://www.education.uiowa.edu/crue.]
Nineteen institutions from eleven different states participated in the WNSLAE.
The institutions included a mix of liberal arts colleges, regional institutions, research
universities, and community colleges. The analyses reported here are based on data
from 1,426 first-year students at these 19 institutions who took the Critical Thinking
Test, 1,446 different first-year students who took the Defining Issues Test, and 2,861
first-year students (including both previous samples) who completed all other
measures.

NSSE Validation
10
Data were collected from these first-year students when they entered college in
the fall of 2006 and again at the end of their first year of postsecondary education in
early spring 2007. As the students entered the 19 participating institutions in the fall of
2006, they completed the 7 liberal arts outcome measures. In the follow-up data
collection in spring 2007, these same students first completed the National Survey of
Student Engagement on which the five benchmark scales are based, and then
subsequently they once again completed the posttests of the seven liberal arts
outcome measures.
Analysis of the WNSLAE Data
Since the NSSE benchmarks are designed to provide an institutional-level
assessment of exposure to good practices, institutions were our unit of analysis.
Therefore, we aggregated the responses of the sample at each institution to obtain an
average institution-level score. This provided each institution’s average assessed score
on each of the seven liberal arts outcomes (assessed in fall 2006 and spring 2007), and
each institution’s average score on each of the five NSSE benchmark scales. With a
sample of only 19 institutions, we were somewhat limited, not only in terms of
statistical power to uncover significant findings, but also with respect to the
sophistication of our analytic approach. However, the longitudinal nature of the
WNSLAE data did permit us to estimate the associations between the average NSSE
benchmarks and the average of each liberal arts outcome in spring 2007 while taking
into account arguably the most important confounding influence—the average
NSSE Validation
11
institutional-level score of the entering students in fall 2006 on each liberal arts
outcome measure. Thus, with average institution-level scores as the unit of analysis,
we estimated the partial correlation between each NSSE benchmark and each posttest
liberal arts outcome measured in spring 2007, while statistically controlling for the
pretest score on the corresponding instrument measured in fall 2006.
What We Found
Our analyses led us to compute 35 partial correlations (five NSSE benchmarks
× seven liberal arts outcomes) with average institution scores as the unit of analysis.
The first thing we did was to treat these 35 partial correlations as a distribution and
determine if the average partial correlation in the distribution was statistically
significant. The partial correlation distribution ranged from .02 to .73 with a mean of
.34 and a standard deviation of .15. The 99.9% confidence band around the mean
partial correlation of .34 ranged from .26 to .42. Since the confidence band did not
include zero, the mean partial correlation of the distribution was statistically
significant at p < .001 (t-test degrees of freedom = 33). This suggests that
institutional-level NSSE benchmark scores have an overall positive association with
the seven end of first-year liberal arts outcomes that is independent of differences
across the 19 institutions in the average score of their entering student population on
each liberal arts outcome. Therefore, any individually significant partial correlations
uncovered between specific benchmarks and specific outcomes would not appear to
NSSE Validation
12
be merely fortuitous individual findings in an overall pattern of chance or non-
significant associations.
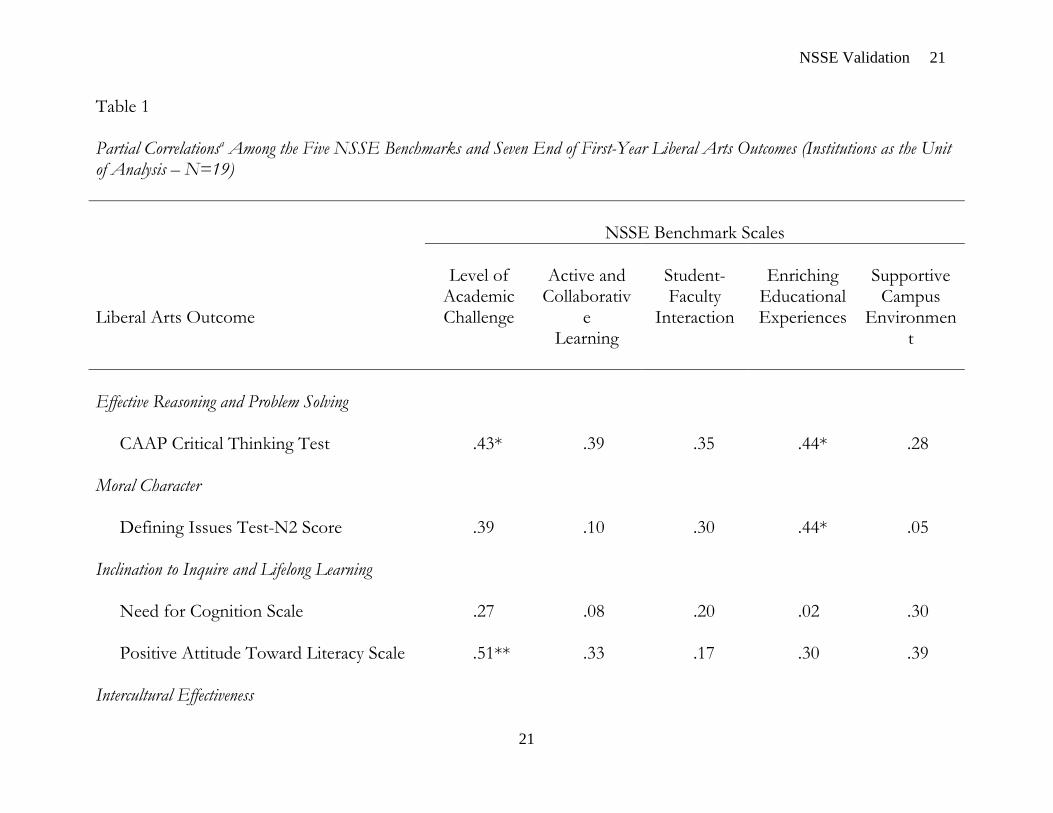
In Table 1, we show the individual partial correlations between each NSSE
benchmark scale and each of the seven liberal arts outcomes. Because average
institutional scores (N = 19 institutions) were the unit of analysis, we were afforded
very limited statistical power to uncover significant associations (t-test degrees of
freedom = 16). Consequently, we used a more relaxed level (p < .10) to determine
statistical significance. Even at this level, an individual partial correlation greater than
.40 was required for statistical significance.
As Table 1 indicates, with presence of controls for the average institutional
precollege score, at least one of the NSSE benchmarks had a significant partial
association with each of the end of first-year liberal arts outcomes except the Need
for Cognition Scale. Across all liberal arts outcomes, the most influential NSSE
benchmark appeared to be the Enriching Educational Experiences Scale, having
significant partial associations with four of the seven outcomes: the Critical Thinking
Test of the Collegiate Assessment of Academic proficiency, the N2 score of the
Defining Issues Test, the Miville-Guzman Universality-Diversity Scale, and the
Openness to Diversity/Challenge Scale. The Supportive Campus Environment
benchmark also had significant partial correlations with the Miville-Guzman and
Openness to Diversity/Challenge Scale, as well as with the total score of the Ryff
Scales of Psychological Well-Being. The Level of Academic Challenge benchmark had
NSSE Validation
13
significant partial associations with Critical Thinking and the Positive Attitude Toward
Literacy Scale, while the Active and Collaborative Learning benchmark had a
significant partial correlation with Openness to Diversity/Challenge. Only the
Student/Faculty Interaction benchmark failed to have a significant partial correlation
with at least one of the seven liberal arts outcomes.
Why the Student/Faculty Interaction benchmark had no significant net
associations with any of our six outcomes is not totally clear. One possibility is that
the influence of Student/Faculty Interaction is conditional rather than general. That
is, rather than having the same effect for all students (i.e., a general effect), it may
enhance first-year growth for some students but not others (i.e., a conditional effect).
Another possibility is that the Student/Faculty Interaction benchmark essentially
measures the frequency of interaction in different contexts (e.g., discussion of grades,
assignments, class readings, career, and the like). It does not really tap students’
perceptions of the quality or personal importance of those interactions with faculty.
As a fairly large body of evidence indicates, it may be that the quality and perceived
importance of students’ interactions with faculty have more developmental impact
than the frequency with which such interactions occur (Pascarella & Terenzini, 2005).
Whatever the reason, however, our findings suggest that, in its present form, the
Student/Faculty Interaction scale may be the least predictive benchmark and might
benefit from additional reworking and analysis by NSSE.
NSSE Validation
14
Clearly our institution-level results are limited by the small sample (19
institutions). Although the sample contained a wide variety of institutional types, it
certainly cannot be considered a statistically representative national sample of colleges
and universities. This small sample, and its attendant limiting effect on statistical
power, also limited the sophistication of the analytic procedures we employed and led
us to rely on rather straightforward partial correlations. However, the longitudinal
nature of the WNSLAE data permitted us to control for institution-level precollege
scores on each first-year liberal arts outcome, yielding a more valid estimate of the
“value added” by the college experience. Moreover, the WNSLAE allowed us to look
at first-year student development on a wide range of liberal arts outcomes that were
measured with objective, standardized instruments of vetted reliability and validity.
We know of no other data that would permit such a comprehensive institutional-level
assessment of the predictive validity of the NSSE benchmark scales.
Implications for Policy
One cannot make strict causal claims with correlational data, even in the best
case scenario (such as the WNSLAE) when the study design is longitudinal. Although
we controlled for the average institution precollege score on each outcome, this is
certainly not the only possible source of confounding influence. Moreover, our
sample cannot be said to be a representative national sample of institutions. Thus, our
results need to be considered with caution. That said, our findings nevertheless lend
support to the claim that the NSSE benchmarks do in fact measure institutional

NSSE Validation
15
practices and student experiences that are precursors to growth in important
educational outcomes such as critical thinking, moral reasoning, intercultural
effectiveness, personal well-being, and positive orientation toward literacy activities.
Even with controls for the average institutional-level precollege score, there were
discernible differences among institutions in the average end of first-year educational
outcomes specified above that were significantly and positively linked to average
institutional scores on the NSSE benchmarks. Thus, our findings suggest that
institutions using the NSSE can have reasonable confidence that the benchmark
scales do, in fact, measure exposure to experiences that predict student progress on
important educational outcomes, independent of the level on these outcomes at
which an institution’s student body enters college.
Such findings may have non-trivial implications for institutional assessment
expenditures. In the present economic climate, the institutional costs incurred in
gathering all the measures needed to complete the VSA College Portrait, particularly
in terms of the Student Experiences and Perceptions and the Student Learning
Outcomes, are considerable. Not all colleges may be able to absorb these costs. For
institutions forced to cut costs, our findings suggest that increases on institutional
NSSE benchmarks can be considered as reasonable proxies for increases across a
range of important educational outcomes. Thus, if an institutional can only afford to
focus on the “process” of undergraduate education, as measured by the NSSE

NSSE Validation
16
benchmarks, this nevertheless seems likely to have substantial implications for the
“product.”
Of additional importance, perhaps, is the fact that these significant partial
associations between the NSSE benchmarks and liberal arts outcomes were
uncovered in the face of a small sample with very low statistical power and were
detectable as early as the first year of postsecondary education. Although institutional
use of the NSSE is usually oriented toward a broader sample of students from all
undergraduate classes, our findings suggest that the NSSE may also be used to focus
on the effectiveness of the first year of college—a period of time in which some
multi-institutional evidence suggests that the greatest developmental impact of
postsecondary education occurs (Flowers et al., 2001; Pascarella & Terenzini, 2005).
From a somewhat different perspective, it is also possible that our first-year findings
underestimate the institutional-level links between the NSSE benchmarks and our
various outcome measures. One might reasonably expect good practices in
undergraduate education to demonstrate somewhat stronger impacts on student
development during the subsequent years of college when such practices have had
longer periods of time to exert their influence.
Our findings also provide additional evidence to the ongoing national debate
over what constitutes quality in undergraduate education. The U.S. News and World
Report (USNWR) annual ranking of postsecondary institutions has strongly shaped
public notions of a quality undergraduate education in the U.S. These rankings,

NSSE Validation
17
however, operationally define “quality” largely in terms of resources, reputation, and,
particularly, the academic selectivity of an institution’s undergraduate student body.
Indeed, there is sound evidence to suggest that the USNWR rankings can be
essentially reproduced simply by knowing the average ACT/SAT score of each
institution’s entering first year class (Pascarella, Cruce, Umbach, Wolniak, Kuh, Carini,
Hayek, Gonyea and Zhao, 2006). This means that, insofar as the USNWR rankings
shape public understanding of what constitutes a quality undergraduate education, it
will be defined by the characteristics students bring to college and not by the actual
effectiveness of the academic and non-academic experiences students have after they
arrive on campus. The NSSE benchmark scales were designed specifically to measure
these effective academic and non-academic experiences, and there is little evidence
that such experiences are substantially linked to the academic selectivity of the college
one attends (Pascarella et al., 2006). Our findings suggest the dimensions of
undergraduate experience measured by the NSSE benchmarks are, in fact, precursors
to important educational outcomes and therefore arguably a more valid conception of
what truly constitutes a quality undergraduate education than the measures used by
USNWR.
Furthermore, the NSSE benchmark scales point to areas of effective academic
and non-academic experiences that may be amenable to improvement through
purposeful changes in institutional policies and practices. On the other hand,
resources and academic selectivity—measures frequently used by USNWR to rank

NSSE Validation
18
colleges—may be much harder to change and therefore may form a much more
deterministic or stable context in which an institution must learn to function. For
example, state legislatures often set the admissions standards, and therefore the
selectivity, of many public institutions. To the extent an institution is actually
concerned with the quality and effectiveness of the undergraduate education it
provides, the existing evidence (bolstered by our findings) suggests that it probably
makes more sense to focus on implementing practices and experiences measured by
the NSSE benchmarks than on those factors measured by USNWR. A dynamic
context, grounded in an institution’s commitment to improvement, may be able to
create an institutional culture that continuously strives to engage students in the
practices and experiences of the NSSE benchmark scales, thereby increasing the
likelihood of improved institutional effectiveness and increased student learning and
development.

NSSE Validation
19
RESOURCES
Astin, A., & Lee, J. (2003). How risky are one-shot cross-sectional assessments of
undergraduate students? Research in Higher Education, 44, 657-672.
Bowman, N. (2009). Can first-year college students accurately report their learning and
development? Manuscript submitted for publication.
Carini, R., Kuh, G., & Klein, S. (2006). Student engagement and student learning:
Testing the linkages. Research in Higher Education, 47, 1-32.
Flowers, L., Osterlind, S., Pascarella, E., & Pierson, C. (2001). How much do students
learn in college? Cross-sectional estimates using the College Basic Academic
Subjects Examination. Journal of Higher Education, 72(5), 565-583.
King, P., Kendall Brown, M., Lindsay, N., & VanHecke, J. (2007). Liberal arts student
learning outcomes: An integrated approach. About Campus, 12(4), 2-9.
LaNasa, S., Olson, E., & Alleman, N. (2007). The impact of on-campus student
growth on first-year student engagement and success. Research in Higher
Education, 48, 941-966.
National Survey of Student Engagement. (2007). Experiences that matter: Enhancing
student learning and success. Bloomington, IN: Indiana University Center for
Postsecondary Research.
Pascarella, E. (2001). Using student self-reported gains to estimate college impact: A
cautionary tale. Journal of College Student Development, 42(5), 488-492.
NSSE Validation
20
Pascarella, E., Cruce, T., Umbach, P., Wolniak, G., Kuh, G., Carini, R., Hayek, J.,
Gonyea, R., & Zhao, C. (2006). Institutional selectivity and good practices in
undergraduate education: How strong is the link? Journal of Higher Education, 77,
251-285.
Pascarella, E., Seifert, T., & Blaich, C. (2008, November).Validation of the NSSE
benchmarks and deep approaches to learning against liberal arts outcomes. Paper presented
at the annual meeting of the Association for the Study of Higher Education,
Jacksonville, FL. Available from:
http://www.education.uiowa.edu/crue/publications/index.htm.
Pascarella, E., & Terenzini, P. (2005). How college affects students (Vol. 2): A third decade of
research. San Francisco: Jossey-Bass.
21
Table 1 Partial Correlationsa Among the Five NSSE Benchmarks and Seven End of First-Year Liberal Arts Outcomes (Institutions as the Unit of Analysis – N=19) NSSE Benchmark Scales Liberal Arts Outcome
Level of
Academic Challenge
Active and Student- Enriching
Collaborativ Faculty Educational e Interaction Experiences
Learning
Supportive
Campus Environmen
t
Effective Reasoning and Problem Solving CAAP Critical Thinking Test Moral Character Defining Issues Test-N2 Score Inclination to Inquire and Lifelong Learning Need for Cognition Scale Positive Attitude Toward Literacy Scale Intercultural Effectiveness
.43* .39 .27 .51**
.39
.10
.08
.33
.35
.30
.20
.17
.44* .44* .02 .30
.28
.05
.30
.39
NSSE Validation 21

22
Miville-Guzman Universality-Diversity Scale
.33 .35 .28 .57** .48*
Openness to Diversity/Challenge Scale .30 .56** .36 .41* .43*
NSSE Validation 22

23
Table 1 (continued) NSSE Benchmark Scales Liberal Arts Outcome
Level of
Academic Challenge
Active and Student- Enriching
Collaborativ Faculty Educational e Interaction Experiences
Learning
Supportive
Campus Environmen
t
Personal Well-Being Ryff Scales of Psychological Well-Being (Total Score)
.31
.31
.31
.39
.73***
aControlling for the average score of each institution’s entering student population on each liberal arts outcome (t-test degrees of freedom = 16). *p < .10. **p < .05. ***p < .01.
NSSE Validation 23