how good is what are we doing to what else should ... · the water we drink: ... mishawaka water is...
TRANSCRIPT
This report is provided annually as a public service by
Mishawaka Utilities so that our consumers
may have confidence in the quality of our water.
If you have questions about this report, call our
Water Division, Water Quality Department
(574) 258-1652. Learn more about Mishawaka Utilities
from our web site at www.mishawakautilities.in.gov.
Further information may be obtained from
U.S. Environmental Protection Agency(EPA) Water Informatioin
at www.epa.gov/safewater/
Safe Drinking Water Hotline 800-426-4791
Mishawaka Utilities PWSID #: IN5271009
is a member of:American Water Works Association
What ElsE should I KnoW? In order to ensure that tap water is safe to drink, the Environmental Protection Agency (EPA) established regulations which limit the amount of certain contaminants in water provided by public water systems. Food and Drug Administration (FDA) regulations establish limits for contaminants in bottled water which must provide the same protection for public health.
hoW Good Is MIshaWaKa WatER? Mishawaka Utilities is proud of your water system and is pleased to issue this Annual Drinking Water Quality Report for 2013. This brochure is a summary of the quality of our drinking water provided to our customers.
Mishawaka drinking water has exceeded the strict standards set forth by the United States Environmental Protection Agency and the Indiana Department of Environmental Management. In this report, you will find where your water comes from along with data about your water quality. You will also learn where you can receive more information about your drinking water.
The bottom line: The water is safe to drink! We encourage public interest and participation in our community’s decisions affecting drink-ing water. Call us for information about the next opportunity for public participation in decisions about our drinking water.
WhERE doEs MIshaWaKa’s WatER CoME FRoM? Mishawaka Utilities pumps groundwater from twenty-two wells that tap the St. Joseph Aquifer, and transmits it to our treatment plants.
In 2012, the Mishawaka Utilities Water Division supplied to our customers an average of 8,480,000 gallons of water per day. Did you know it takes approximately 39,900 gallons of water to produce a new car and four tires? In one day we produce enough water to manufacture 192 cars.
What aRE WE doInG to MaKE thInGs bEttER? Mishawaka Utilities is constantly striving to improve the quality of drinking water delivered to Mishawaka residents. To keep a check on water quality, we contract an independent laboratory to test our water. The results of this analytical testing let us know if any problems occur, and how effective our water treatment is.
Mishawaka Utilities also has an interactive Web site to allow quick and easy access for our customers.
we test drinking water every day of the year,
seven days a week for an average of over
50 drinking water samples tested each day to help ensure the quality of our
drinking water.
in 2012 our customersconsumed an average
of 200 gallons per day,per person.
mishawaka utilities maintains over 296
miles of distribution pipes within our
water system.
Questions What is the sampling schedule for testing Mishawaka’s water?
Regular sampling and testing of our water is important for the assurance of the quality of water. Our sampling schedule is as follows:
Daily — We test the following for each of our treatment plants and one distribution site: Chlorine residuals, pH, temperature, iron, manganese, fluoride, conductivity and hardness.
Monthly — We check a minimum of 50 samples throughout our water system for total coliform and E. coli bacteria.
Quarterly — We test for Trihalomethanes and Haloacetic Acids.
Yearly — We test for nitrates. The EPA establishes a schedule of yearly or alternate year testing for the following; Inorganics, Volatile Organic Contaminants, Synthetic Organic Chemicals and Lead and Copper.
Our daily testing is done by a team of highly trained, state-certified water treatment professionals. Our monthly, quarterly and yearly testing is done by independent certified chemists and technicians which follow precise procedures established by the U.S. EPA and the Indiana Department of Environmental Management.
How much water did the Mishawaka Water Division produce in 2012?
In 2012 the Mishawaka Water Division produced 3.1 billion gallons of water for our consumers. Almost 40 billion gallons of tap water is produced each day for domestic consumption (homes, restaurants, hotels and small businesses) in the United States, 60 percent from surface water and 40 percent from ground water.
hoW to REad thIs tablEIt’s easy! Our water is tested to assure that it is safe to drink. The results of tests performed in 2012 or the most recent testing available are presented in the table.
The testing data presented in this current report represents the results from the last required testing date for that contaminant. Testing dates may vary depending on contaminant and requirements. The strictly regulated testing schedule is set and under the guidance of the EPA and IDEM. We test for numerous contaminants, but only contaminants that are detected are reported.
The column marked GOAL shows the Maximum Contaminant Level Goal or MCLG. This is the level of a contaminant in drinking water below which there is no known or expected risk to health. MCLGs allow for a margin of safety.
The column marked MAXIMUM ALLOWED is the Maximum Contaminant Level or MCL. This is the highest level of a contaminant that is allowed in drinking water. MCLs are set as close to the MCLGs as feasible using the best available treatment technology.
SOURCE OF CONTAMINANTS provides an explanation of the typical natural or man-made origins of the contaminant. Footnotes below the chart are provided to explain important details.
ACTION LEVEL is the concentration of a contaminant which, if exceeded, triggers treatment or other requirements which a water system must follow.
IMpoRtant hEalth InFoRMatIon Drinking water, including bottled water, may reasonably be expected to contain at least small amounts of some contaminants. The presence of contaminants does not necessarily indicate that water poses a health risk.
Some people may be more vulnerable to contaminants in drinking water than the general population. Immuno-compromised persons such as persons with cancer undergoing chemotherapy, persons who have undergone organ transplants, people with HIV/AIDS or other immune system disorders, some elderly, and infants can be particularly at risk from infections. These people should seek advice about drinking water from their health care providers. EPA/CDC guidelines on appropriate means to lessen the risk of infection by Cryptosporidium and other microbial contaminants are available from the Safe Drinking Water Hotline.
WhERE doEs WatER CoME FRoM?The sources of drinking water (both tap water and bottled water) include rivers, lakes, streams, ponds, reservoirs, springs, and wells. As water travels over the surface of the land or through the ground, it dissolves naturally-occurring minerals and, in some cases, radioactive material, and can pick up substances resulting from the presence of animals or from human activity. Contaminants that may be present in source water include:
(A) Microbial contaminants, such as viruses and bacteria, which may come from sewage treatment plants, septic systems, agricultural livestock operations, and wildlife.
(B) Inorganic contaminants, such as salts and metals, which can be naturally-occurring or result from urban stormwater runoff, industrial or domestic wastewater discharges, oil and gas production, mining, or farming.
(C) Pesticides and herbicides, which may come from a variety of sources such as agriculture, urban stormwater runoff, and residential uses.
(D) Organic chemical contaminants, including synthetic and volatile organic chemicals, which are by-products of industrial processes and petroleum production, and can also come from gas stations, urban stormwater runoff, and septic systems.
(E) Radioactive contaminants, which can be naturally-occurring or be the result of oil and gas production and mining activities.
Testing for the above classes of contamination is performed in accordance with a testing schedule provided by IDEM in accordance with Federal regulations.
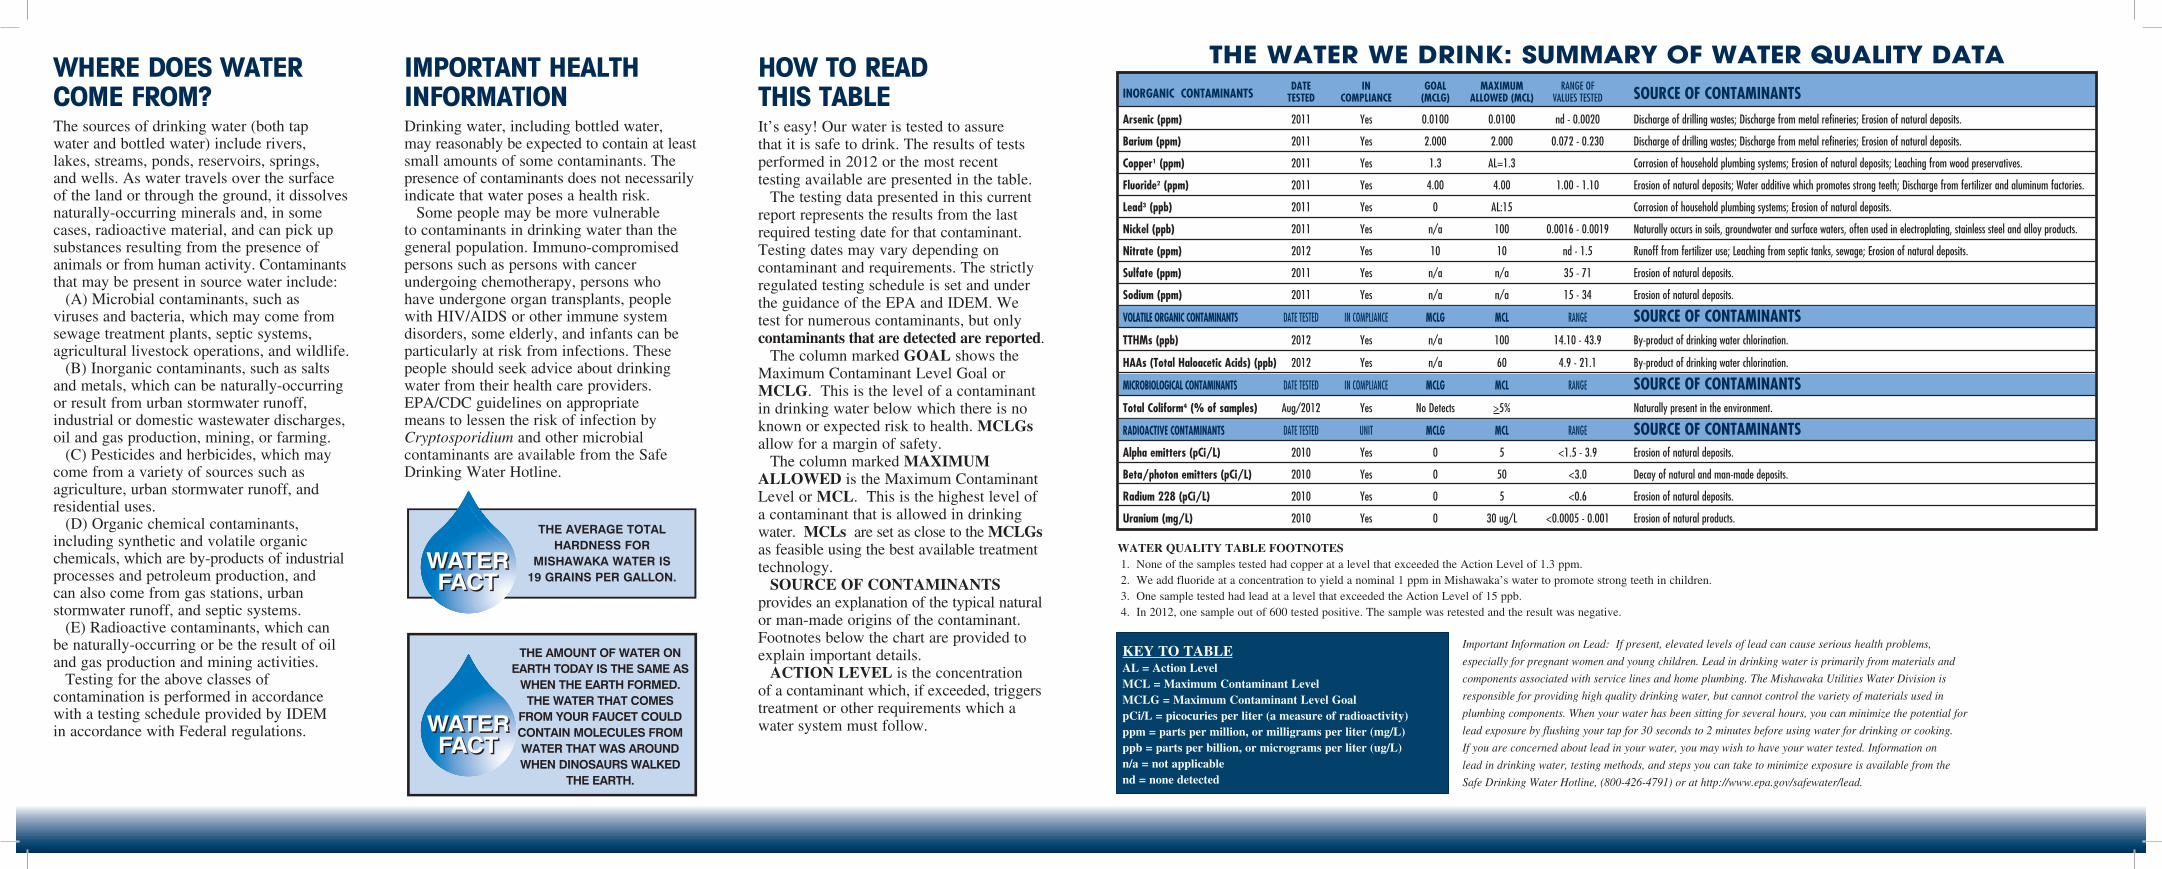
KEY TO TAbLEAL = Action LevelMCL = Maximum Contaminant LevelMCLG = Maximum Contaminant Level GoalpCi/L = picocuries per liter (a measure of radioactivity)ppm = parts per million, or milligrams per liter (mg/L)ppb = parts per billion, or micrograms per liter (ug/L)n/a = not applicablend = none detected
WATER QUALITY TAbLE FOOTNOTES 1. None of the samples tested had copper at a level that exceeded the Action Level of 1.3 ppm. 2. We add fluoride at a concentration to yield a nominal 1 ppm in Mishawaka’s water to promote strong teeth in children. 3. One sample tested had lead at a level that exceeded the Action Level of 15 ppb. 4. In 2012, one sample out of 600 tested positive. The sample was retested and the result was negative.
Important Information on Lead: If present, elevated levels of lead can cause serious health problems,
especially for pregnant women and young children. Lead in drinking water is primarily from materials and
components associated with service lines and home plumbing. The Mishawaka Utilities Water Division is
responsible for providing high quality drinking water, but cannot control the variety of materials used in
plumbing components. When your water has been sitting for several hours, you can minimize the potential for
lead exposure by flushing your tap for 30 seconds to 2 minutes before using water for drinking or cooking.
If you are concerned about lead in your water, you may wish to have your water tested. Information on
lead in drinking water, testing methods, and steps you can take to minimize exposure is available from the
Safe Drinking Water Hotline, (800-426-4791) or at http://www.epa.gov/safewater/lead.
The WaTer We Drink: Summary of WaTer QualiTy DaTa InorganIc contamInants
DatE In goaL maXImUm RANGE OF soUrcE of contamInants tEstED comPLIancE (mcLg) aLLoWED (mcL) VALUES TESTED
arsenic (ppm) 2011 Yes 0.0100 0.0100 nd - 0.0020 Discharge of drilling wastes; Discharge from metal refineries; Erosion of natural deposits.
Barium (ppm) 2011 Yes 2.000 2.000 0.072 - 0.230 Discharge of drilling wastes; Discharge from metal refineries; Erosion of natural deposits.
copper1 (ppm) 2011 Yes 1.3 AL=1.3 Corrosion of household plumbing systems; Erosion of natural deposits; Leaching from wood preservatives.
fluoride2 (ppm) 2011 Yes 4.00 4.00 1.00 - 1.10 Erosion of natural deposits; Water additive which promotes strong teeth; Discharge from fertilizer and aluminum factories.
Lead3 (ppb) 2011 Yes 0 AL:15 Corrosion of household plumbing systems; Erosion of natural deposits.
nickel (ppb) 2011 Yes n/a 100 0.0016 - 0.0019 Naturally occurs in soils, groundwater and surface waters, often used in electroplating, stainless steel and alloy products.
nitrate (ppm) 2012 Yes 10 10 nd - 1.5 Runoff from fertilizer use; Leaching from septic tanks, sewage; Erosion of natural deposits.
sulfate (ppm) 2011 Yes n/a n/a 35 - 71 Erosion of natural deposits.
sodium (ppm) 2011 Yes n/a n/a 15 - 34 Erosion of natural deposits.
VoLatILE organIc contamInants DATE TESTED IN COMPLIANCE mcLg mcL RANGE soUrcE of contamInants ttHms (ppb) 2012 Yes n/a 100 14.10 - 43.9 By-product of drinking water chlorination.
Haas (total Haloacetic acids) (ppb) 2012 Yes n/a 60 4.9 - 21.1 By-product of drinking water chlorination.
mIcroBIoLogIcaL contamInants DATE TESTED IN COMPLIANCE mcLg mcL RANGE soUrcE of contamInants total coliform4 (% of samples) Aug/2012 Yes No Detects >5% Naturally present in the environment.
raDIoactIVE contamInants DATE TESTED UNIT mcLg mcL RANGE soUrcE of contamInants alpha emitters (pci/L) 2010 Yes 0 5 <1.5 - 3.9 Erosion of natural deposits.
Beta/photon emitters (pci/L) 2010 Yes 0 50 <3.0 Decay of natural and man-made deposits.
radium 228 (pci/L) 2010 Yes 0 5 <0.6 Erosion of natural deposits.
Uranium (mg/L) 2010 Yes 0 30 ug/L <0.0005 - 0.001 Erosion of natural products.the average total
hardness formishawaka water is
19 grains per gallon.
the amount of water on earth today is the same as
when the earth formed. the water that comes
from your faucet could contain molecules from water that was around when dinosaurs walked
the earth.