how has the valuation of technology ipos changed since …
TRANSCRIPT
University of Central Florida University of Central Florida
STARS STARS
Honors Undergraduate Theses UCF Theses and Dissertations
2017
How Has the Valuation of Technology IPOs Changed Since the How Has the Valuation of Technology IPOs Changed Since the
Dot-Com Bubble? Dot-Com Bubble?
Andrew Rush University of Central Florida
Part of the Finance Commons
Find similar works at: https://stars.library.ucf.edu/honorstheses
University of Central Florida Libraries http://library.ucf.edu
This Open Access is brought to you for free and open access by the UCF Theses and Dissertations at STARS. It has
been accepted for inclusion in Honors Undergraduate Theses by an authorized administrator of STARS. For more
information, please contact [email protected].
Recommended Citation Recommended Citation Rush, Andrew, "How Has the Valuation of Technology IPOs Changed Since the Dot-Com Bubble?" (2017). Honors Undergraduate Theses. 174. https://stars.library.ucf.edu/honorstheses/174
HOW HAS THE VALUATION OF TECHNOLOGY
IPOS CHANGED SINCE THE
DOT-COM BUBBLE?
by
ANDREW RUSH
A thesis submitted in partial fulfillment of the requirements
for the Honors in the Major Program in Finance
in the College of Business Administration
and in The Burnett Honors College
at the University of Central Florida
Orlando, Florida
Spring Term 2017
Thesis Chair: Melissa Frye

ii
© 2017 Andrew Rush
iii
Abstract In my paper, I extended Aggarwal, Bhagat and Rangan’s “The Impact of Fundamentals
on IPO Valuation”. I examine IPO valuations over three time periods: 2002-2006, 2007-2011
and 2012-2016. In these time periods, I analyze the first day returns these firms experience along
with testing the significance of four variables on their valuations: Total Assets, Previous Year’s
Sales, Previous Year’s R&D Expense, and Sales-to-Assets Multiple. The results point to a shift
in valuation tactics from valuing in line with investors’ expectations in the early years to
undervaluing them in more recent years. Also, Sales and R&D have statistical significance for
firm’s valuations over recent years while Total Assets remains constant and the Sales-to-Assets
multiple does not have significance.

iv
Table of Contents
1. Introduction ............................................................................................................................. 1
1.1. Forms of Financing .......................................................................................................... 1
1.2. Initial Public Offerings ......................................................................................................... 2
1.3. Financial Crisis ..................................................................................................................... 4
2. Literature Review .................................................................................................................... 5
2.1. Previous Studies on IPO Fundamentals ........................................................................... 5
2.2. Differences Between This Study and Previous Research ................................................ 6
3. Methodology ............................................................................................................................ 8
4. Hypothesis ............................................................................................................................... 9
5. Data ........................................................................................................................................ 10
5.1. Data Gathering ............................................................................................................... 10
5.2. Data Calculations ........................................................................................................... 11
5.3. Average Data .................................................................................................................. 11
5.4. Multiple Regression Model ............................................................................................ 12
6. Results ................................................................................................................................... 14
6.1. Return Calculations ........................................................................................................ 14
6.2. Regression Calculations ................................................................................................. 14
7. Conclusion ............................................................................................................................. 15
Appendix: Tables .......................................................................................................................... 16
Bibliography ................................................................................................................................. 30

1
1. Introduction Companies are continuously looking for areas of growth for their business. A good way
to achieve that growth is to invest in long-term capital ventures that can benefit the company for
years to come rather than have a short-term impact. These long-term projects typically require a
larger initial outlay but have the potential to provide the company with a reliable series of cash
flows for many years. Finding capital to invest in these projects is not difficult, but allocating the
right amount to various areas is. This is known as the companies financing structure.
1.1. Forms of Financing
There are two forms of financing for a company: debt and equity. Debt financing is when
a company receives funds from outside investors without turning over ownership to the lender.
Debt financing is typically in the form of bonds or loans, with both following the same premise
of having terms that define their structure. The first defining term is their duration, as a lender
will want to have a set date that determines when the borrower will have to pay back the
borrowed amount by. This can define the investment as being either short-term (under twelve
months) or long-term (greater than twelve months). The longer the duration, the riskier an
investment becomes as it gives a larger time frame for uncertain factors to play a role. The
second term is the stated interest rate, because a lender will forfeit the opportunity of investing
their own capital and have a more secure profit by investing in risk-free assets that will mature
over time only when their opportunity cost is greater. A stated rate on a bond takes into account
many factors to determine a rate at which the borrower should pay the lender to utilize their
assets. This rate will take into account the risk-free rate and add in several other factors to imbed
a premium. These premiums are used to cover uncertain risks that may prevent the borrower

2
from repaying the lender. Some common risks include the default risk of the company and the
risk of the project being invested in failing.
The second form of financing is through equity, where an individual will invest funds to a
company and in return, the company will give the investor a partial stake in their business.
Equity financing can take two forms: private and public. Private equity differs substantially from
public equity. Private equity is not publicly available or publicly traded, therefore only certain
investor groups can take part in private equity. These investors are typically coined as “Angel
Investors” or “Venture Capitalists”. This is in large part due to the fact their clientele is primarily
new companies looking to gain financing but do not have the credibility or desire to go public
just yet. This investment class has positives and negatives. It is beneficial for both parties in that
they do not have the governing body of the Securities Exchange Commission (SEC) watching
over them and examining their financials. However, for the investor, they may feel
uncomfortable investing in a company that is not governed on strict terms. This results in the
investor weighing their risks to their returns, and will typically only take part in the venture if it
seems profitable. This brings up a second positive, as investing in such young companies gives
one the opportunity to experience large returns. The profit sharing aspect is another positive for
the investor in that they will receive a larger cut of the pie given that there are fewer investors.
1.2. Initial Public Offerings
When a company has been private for so long and believes they have exhausted all other
financing options, or feel they have a greater potential for success, they then decide to go public.
This brings us to the second type of equity financing and the one that this paper will focus on,
which is public equity. When a company decides to go public they approach an underwriting
firm that specializes in taking companies public. They will then analyze the company’s situation,

3
its reasoning for going public, and eventually determine which type of security they should offer,
how much of it and at what price it should be offered. This process is called the Initial Public
Offering (IPO) of a company. When a company is publicly traded at this point, they are more
susceptible to valuation fluctuations due to their valuations being done based on their stock price.
Since publicly traded securities are traded on organized exchanges, like the New York Stock
Exchange (NYSE) or NASDAQ, they are extremely liquid assets and can be traded very easily.
That being said, any publicity or news stories relating to the company can cause large shifts in
the company’s stock price in either direction. In addition to news stories, the SEC requires
companies to release quarterly results of their financials that can help guide investors in which
direction these companies are going in the year. This is referred to as “earnings” for the company
and stock prices have the potential to make large shifts based on this information.
The IPO of a company is a pivotal moment for the company’s existence. Now that they
are publicly traded, they have strict laws and regulations they must follow. They are also more
prone to having media coverage of their company affect company valuation. During the 1990s,
company valuation for publicly traded tech companies was astronomically high. They were
trading at historic multiples that seemed quite excessive. This overvaluation was due to the
speculative success of technology in society. Technology related companies experienced a period
of unexplainable growth which eventually came crashing down in early 2000. This crash was fed
by irrational valuation tactics which led to the questioning of these analysts and investors who
thought having such high multiples was acceptable. This paper analyzes the new valuation tactics
taken right after the crash and to see if anything has changed.
4
1.3. Financial Crisis
The time frame that I analyze is 2002 through 2016, which was a volatile time frame. The
market’s recovery from the burst of the Dot-Com Bubble was then crushed by the Financial
Crisis of 2008 and 2009. The Financial Crisis will have significant effects on the scope of this
paper as the recessionary period following the crisis resulted in very minimal activity in the IPO
market.
The Financial Crisis was the worst economic crisis to occur in the US since the Great
Depression. In large part, it was caused by several factors that ranged from subprime lending
programs to a financial system that was too interconnected. Its crash was felt worldwide as all
global financial systems had some tie to the US markets. During the crash, major stock market
indices lost nearly 30% of their market value. This crash resulted in increased regulation on the
financial systems which had adverse effects on the IPO market. With the economy crashing, no
company was looking to go public as it was an awful time to do so. During the recovery,
companies began coming out of the rubble and seeking to go public again, but this new
regulation would begin affecting them as well, which will be considered for the analysis during
that time frame.

5
2. Literature Review
2.1. Previous Studies on IPO Fundamentals
For this paper, I extend the study of Aggarwal, Bhagat and Rangan (2009). Their research
analyzes IPOs specifically between 1986 – 2001. They break this timeframe down into three
periods. The first being 1986-1990, to get an idea of IPO valuation during a typical market time
frame. The second time period is January 1997 – March 2000, noted as the “boom period” for
the Dot-Com Bubble. The last time frame is April 2000 – December 2001, which is known as the
“crash period” as the bubble burst. The purpose of their research is to analyze how IPOs during
this period were valued and what went into their valuations. They conclude that speculation led
to overvaluation. This is seen when companies with negative earnings were valued higher than
companies with positive earnings. In my research, I examine whether valuations have shifted
since this bubble burst.
Seeing that the internet was just being introduced during the late 1990s and early 2000s,
it was difficult for these new firms to be valued given how much upward potential there was for
the internet. Several papers examine IPOs during this time frame to try and understand how the
valuations of internet companies differed from non-internet companies.
Hand (2003) acknowledges that internet stocks had extreme price valuations during the
Dot-Com bubble and investigates their valuation trends between 1997 and 1999. His research
targets 167 internet firms and evaluates their investor related valuation for the period and the
impact of certain fundamentals on their pricing. The research concludes that revenue results are
not an indicator of price valuation rather it is based more on selling and marketing expenses
which investors find valuable. This is due to the fact most of these firms experienced negative
6
earnings for the period as most internet companies did so they used additional fundamentals to
value the respective firms.
Bartov, Mohanram, and Seethamraju (2002) noted the trend in internet related companies
and how well their performance was in the equity market. They back-tested the results of 98
internet and 98 non-internet IPOs listed between 1996-1999 to identify their valuation trends.
Their results found a substantially high valuation for internet related companies even though they
did not prove to be profitable. With the growing popularity and usage of the internet during this
time period, investors speculations drove these firm’s values through the roof.
Morris and Perviaz (2002) investigated the IPO process more extensively for these
internet related companies in comparison to non-internet companies. They looked at the various
stages of the firm’s IPO and where they differed in terms of relative valuation. The non-internet
IPOs exhibited the typical trend of higher positive earnings, higher valuation and negative
earnings, lower valuations during the pricing phase in the prospectus. A second conclusion
though they found was that internet firms experienced more of a valuation increase from the
prospectus price to the offer price and first day opening price in comparison to non-internet
firms. A potential catalyst they saw was that these firms were viewed more of an investment as
they will have a higher value in later years when the internet reaches its full potential.
2.2. Differences Between This Study and Previous Research
Previous studies conducted on IPO matters for technology was more focused on internet
firms rather than the sector seeing that was the area with the most growth potential. Now that
investors recognize the internet’s actual potential and technology is becoming more and more
prevalent today, I chose to evaluate the whole sector.

7
In addition to the sector change, previous studies have eluded to before the Dot-Com
bubble and building up to it where as I continue the research on and investigate the aftermath of
the period. This study also has another market event with the Financial Crisis playing a role on
the data as it falls in the middle of the period. This allows for analysis of a recovery period, 2002
to 2006, as the market recovers from the Dot-Com Bubble. A bust period, 2007 to 2011, as the
market sold off from the Financial Crisis. And a second recovery period noted as being a
historical bull market, 2012-2016.
The last difference for this study is the variables chosen to regress against. Previous
studies included sales, assets and R&D but for this study, I will include an additional variable,
sales-to-assets multiple at time of going public. This will be a relative valuation measure which
determines productivity of the firm and will extend the valuation scope.
8
3. Methodology The question I look to answer now is: How has valuation of technology IPOs changed
since the Dot-Com Bubble? Seeing how speculation has led to such an over-valued market, have
things changed? Seeing how far technology has progressed since the pioneering of the internet,
are these newly listed companies having the proper valuation before going public? Several recent
technology related IPOs have had huge run-ups on their IPO date, so are they being undervalued
now?
To examine these factors, I look specifically at technology companies that went public
between the date range, January 2002-August 2016. I take the initial listing price of the company
and examine the total return they experienced on their first trading day. I will then graph out the
average first day returns on an annual basis and see how investor valuations compared to IPO
valuations.
In addition to the first day return data, I perform regression tests between offer value and
certain fundamentals. These include, previous year’s Sales, Total Assets, Research and
Development expense and their Sales-to-Assets Multiple. Taking the natural log of these
variables over time will smooth the data and allow for an easier comparison and analysis.

9
4. Hypothesis Based on my preliminary research, I see that technology IPOs were far to overvalued in the
late 1990s and early 2000s, but now investment banks taking these companies public are being
more cautious and undervaluing them to avoid another Dot-Com Bubble. I hope to see a shift in
the average return data as investment banks and investors valuations become more in-line.
In terms of the regression test, I expect to see a strengthening in significance of the Sales-
to-Assets multiple and Research and Development variables over time as I suspect they lead to a
better understanding of future profits for a new technology company. I chose these variables
because the Sales-to-Assets multiple points to a higher productivity level for the firm and
Research and Development spending is critical for a firm to stay one step ahead of their
competition.
10
5. Data
5.1. Data Gathering
For this study, data will be extracted from Bloomberg and manipulated in Excel. In the
Bloomberg database, the Security Screener function will be used to find which U.S. technology
companies went public in the 2002-2016 date range. The screen parameters and their
specifications are displayed in Table 1.
After this screen, a list of 216 securities was created which presented company name and
ticker. This list was exported to excel and used as a reference point for the second part of data
gathering. A Bloomberg plugin in excel allowed for extraction of data that linked to the
individual company ticker. Table 2 displays the pieces of information extracted from Bloomberg
and their reference code.
Once all this information is compiled, it is formatted into a pivot table to allow for ease
when sorting and calculating various metrics. The data is in chronological order and broken into
three date ranges which are displayed in Table 3.
With these time periods, it allows for comparisons over multiple years to see changes in
valuation tactics. Period one is a sample of recovery after the Dot-Com bubble, period two is a
sample of a recessionary period with the financial crisis and period three is a sample of the
second recovery after the financial crisis.

11
5.2.Data Calculations After extracting all the company data, some calculations are performed before running the
regression tests. These calculations are displayed in Table 5.
Once all the calculations were performed, I take the natural log of the following variables:
Offer Value, Previous Year’s Sales, Previous Year’s Total Assets, Previous Year’s R&D
Expense, and Previous Year’s Sales-to-Assets Multiple. This calculation reduces the effect of
outliers on the data set.
5.3. Average Data
After gathering all the data for this research, I constructed a table displaying how many IPOs
occurred in each year along with the average for each of the other variables I will be testing to
get a rough idea of where this research would be headed. Here is the constructed table displaying
these findings.
After an initial analysis on the number of IPOs each year, I recognized two groups of
relatively concentrated years for the IPO market, 2004-2007 and 2010-2015. The years outside
these date ranges experienced a relatively stagnated IPO market. In addition, first day returns
seemed to be consistently high in later years in comparison to earlier years.
Table 5 displays each IPO in chronological order. This provides a way to observe trends in
larger IPO for technology related firms in terms of the given time horizon. Based on the chart,
we can see more high market cap firms going public in more recent years in comparison to
earlier years.

12
5.4.Multiple Regression Model
This data set encompasses 216 technology companies who went public between 2002 and
2016. To test the significance of the five variables chosen (previous year’s sales, previous year’s
R&D expense, previous year’s total assets and sales-to-assets multiple), a multiple regression
model will be used.
For this test, the natural log of each variable is taken to eliminate any bias towards outliers in
the data set. The natural log will be calculated in excel via the LN( ) function.
The following multiple regression model will be used to test the hypothesis of changing
variables’ significance over the three time periods:
𝑀𝐴𝑅𝐾𝐸𝑇 𝐶𝐴𝑃𝐽 = 𝛼 + 𝛽1(𝑆𝐴𝐿𝐸𝑆) + 𝛽2(𝑇𝑂𝑇𝐴𝑆𝑆𝐸𝑇𝑆) + 𝛽3(𝑅𝐷𝐸𝑋𝑃) +
𝛽4(𝑆𝐴𝐿𝐸𝑆𝑇𝑂𝐴𝑆𝑆𝐸𝑇𝑆) + 𝑒𝑗
Where:
MARKET CAPj = This variable is a measure of the investment banks implied
value of the firm they’re taking public. This is calculated as
shares outstanding times the offer price to give an overall
market value
SALESj = This variable is the previous year sales data for the firm going
public. The sales information will provide insight into how
the firms product/service offerings are performing in the
market.

13
TOTASSETSj = This variable will display the firm’s previous year total assets
carried on their balance sheet before going public. This will
provide insight into how large the firm is relative to their
market valuations.
RDEXPj = This variable will show how much the firm invests into
research and development for the previous year before going
public. This is a strong indicator of future growth but too
much could utilize all of the firm’s funds too fast.
SALESTOASSETSj = This variable will measure the productivity of the firm by
looking at how well their sales stack up against their total
assets. A higher number will indicate the firm is highly
productive and vice versa.
ej = A random error term
After running the multiple regression model for each time period, the data is compiled
and examined to see any trends in methods of valuation.

14
6. Results
6.1. Return Calculations
The first test to be run on the data was to calculate the first day returns for each of the
following 216 securities. This was done in excel by calculating the percent change from the
offering price to the first day close. The offering price is the investment banks valuation for the
specific firm and the closing price is the valuation the market (the investment community) finds
for the security. The percent change between the two prices shows the discrepancy in valuation
measures between the two groups. Table 6 displays the average first day returns for each year.
Any positive percent change for the first day return goes to show an undervaluation on the
side of the investment bankers and a negative percent change for the first day return shows an
overvaluation from the investment bankers.
6.2. Regression Calculations
The second test to be performed was the regression tests for each period. This tests was to see
the significance of certain variables on valuation measures for these firms being taken public.
From the regression results for each period, the P-Value and coefficients were to be analyzed to
determine relative significance. This test was conducted in excel and the results were compiled
into Table 7.
From these results, we can see a growing trend of significance in both the previous year’s
sales and previous year’s R&D expense as the coefficients are seen growing with a deteriorating
P-Value. Previous year’s total assets remained relatively constant in significance throughout the
tests and the sales-to-assets multiple lost significance over the three periods.

15
7. Conclusion In conclusion, we can see that investment banks gave relatively higher valuations that were
closer to being in line with investors valuations. This conclusion is drawn from the low returns
these firms experienced on their first trading days indicating very minimal valuation discrepancy
from investment banks to traders. This is seen shifting over the years and regressing more
recently to more inline valuations. A potential catalyst for this current regression is a more
stagnant IPO market over the recent years as the number of IPOs has been relatively low.
A second conclusion to be drawn from the multiple regression model is that my
hypothesis did not hold true for the growing importance of sales-to-assets multiple but did hold
true for the increasing significance of R&D expense. Another variable that proved to be
statistically significant was the previous year’s sales which displayed how well the firm’s
products were performing in the market currently.

16
Appendix: Tables
Table One
Bloomberg Security Screener Parameters

17
Table 1: Bloomberg Security Screener Parameters
This list displays each of the parameters used in the security screener to compile the data for this
research project. The overall goal was to compile all technology related companies that went
public on a U.S. exchange between January 1st, 2002 to August 31st, 2016.
Parameter Specification
Date Range 01/01/2002 through 08/31/2016
Type of Offering Initial Public Offering
Sector Technology
Exchange United States Exchanges

18
Table Two
Bloomberg Terminal Codes and Variables Extracted

19
Table 2: Bloomberg Terminal Codes and Variables Extracted
The following list is the excel codes used with the Bloomberg Plug-In to extract certain pieces of
data rather than compiling the information manually. Each code would be in a respective column
aligned with company tickers and then they would reference the listed ticker and extract the
following pieces of data.
Company Information Bloomberg Code
Company Name LONG_COMPANY_NAME
IPO Price EQY_INIT_PO_SH_PX
# of Shares Issued EQY_INIT_PO_SH_OFFER
Listing Date EQY_INIT_PO_DT
Previous Year’s Sales SALES_REV_TURN (Reference Listing Year – 1)
Previous Year’s Total Assets BS_TOT_ASSET (Reference Listing Year – 1)
Previous Year’s R&D Expense IS_RD_EXP (Reference Listing Year – 1)
First Day Closing Value PX_CLOSE (Reference Listing Date)

20
Table Three
Period’s Date Ranges
21
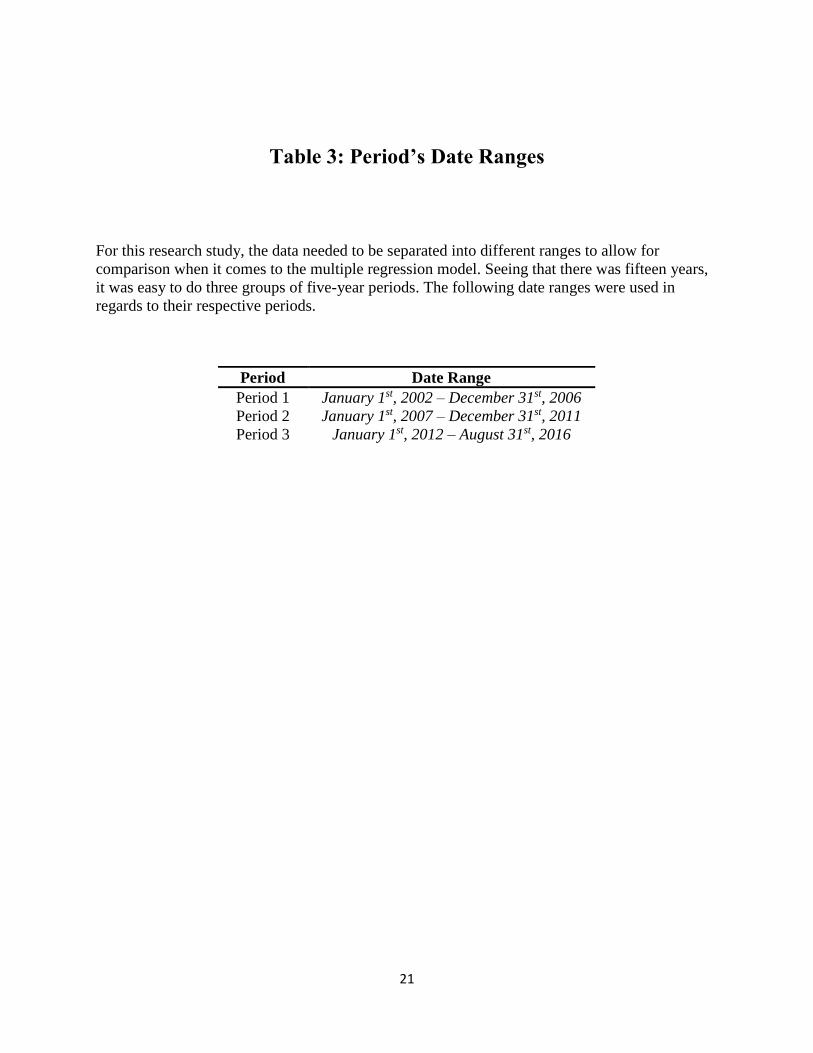
Table 3: Period’s Date Ranges
For this research study, the data needed to be separated into different ranges to allow for
comparison when it comes to the multiple regression model. Seeing that there was fifteen years,
it was easy to do three groups of five-year periods. The following date ranges were used in
regards to their respective periods.
Period Date Range
Period 1 January 1st, 2002 – December 31st, 2006
Period 2 January 1st, 2007 – December 31st, 2011
Period 3 January 1st, 2012 – August 31st, 2016

22
Table Four
Calculations Used and Their Respective Formulas

23
Table 4: Calculations Used and Their Respective Formulas
After all the data was collected, a few calculations needed to have the final form needed for the
various tests. Each calculation was performed in excel and uniform for each company. The
following table displays each calculation and its respective formula.
The first is total offer value which provides insight into how investment banks value firms. The
second is first day change which measures the discrepancy investors found with the investment
banks valuation and theirs. The third is a sales-to-assets multiple which is a measure of
productivity for each firm before going public which will be a variable in the multiple regression
model.
Calculation Formula
Total Offer Value 𝑇𝑜𝑡𝑎𝑙 𝑂𝑓𝑓𝑒𝑟 𝑉𝑎𝑙𝑢𝑒 = 𝐼𝑃𝑂 𝑃𝑟𝑖𝑐𝑒 𝑝𝑒𝑟 𝑆ℎ𝑎𝑟𝑒 𝑥 𝑇𝑜𝑡𝑎𝑙 𝑆ℎ𝑎𝑟𝑒𝑠 𝐼𝑠𝑠𝑢𝑒𝑑
First Day Change 𝐹𝑖𝑟𝑠𝑡 𝐷𝑎𝑦 𝐶ℎ𝑎𝑛𝑔𝑒 = 𝐹𝑖𝑟𝑠𝑡 𝐷𝑎𝑦 𝐶𝑙𝑜𝑠𝑖𝑛𝑔 𝑀𝑎𝑟𝑘𝑒𝑡 𝑃𝑟𝑖𝑐𝑒 𝑝𝑒𝑟 𝑆ℎ𝑎𝑟𝑒
𝐼𝑃𝑂 𝑂𝑓𝑓𝑒𝑟 𝑃𝑟𝑖𝑐𝑒 𝑝𝑒𝑟 𝑆ℎ𝑎𝑟𝑒− 1
Sales-to-Assets
Multiple
𝑆𝑎𝑙𝑒𝑠 𝑡𝑜 𝐴𝑠𝑠𝑒𝑡𝑠 𝑀𝑢𝑙𝑡𝑖𝑝𝑙𝑒 =
𝑃𝑟𝑒𝑣𝑖𝑜𝑢𝑠 𝑌𝑒𝑎𝑟′𝑠 𝑆𝑎𝑙𝑒𝑠
𝑃𝑟𝑒𝑣𝑖𝑜𝑢𝑠 𝑌𝑒𝑎𝑟′𝑠 𝑇𝑜𝑡𝑎𝑙 𝐴𝑠𝑠𝑒𝑡𝑠

24
Table Five
IPO Offering Values in Chronological Order

25
Table 5: IPO Offering Values in Chronological Order
The following table displays each individual IPO offering value and lists them in chronological
order. This provides a graphical representation of the results to see where there were periods of
high value IPOs and if there was any periods of high/low value firms going public. Based on the
graph, we can see higher value firms went public in more recent years (2011-2016) in
comparison to earlier years (2002-2010).
$-
$5,000.00
$10,000.00
$15,000.00
$20,000.00
$25,000.00
$30,000.00
$35,000.00
1/2
8/2
00
21
1/1
2/2
00
21
1/2
0/2
00
33
/25
/20
04
7/9
/20
04
8/4
/20
04
11
/19
/20
04
7/2
2/2
00
51
0/2
4/2
00
56
/15
/20
06
9/2
2/2
00
61
2/1
3/2
00
63
/29
/20
07
7/1
9/2
00
79
/20
/20
07
11
/16
/20
07
8/8
/20
08
3/2
4/2
01
04
/29
/20
10
9/2
4/2
01
05
/26
/20
11
12
/13
/20
11
2/8
/20
12
6/2
8/2
01
21
0/1
2/2
01
27
/26
/20
13
11
/7/2
01
33
/28
/20
14
6/1
2/2
01
41
2/1
2/2
01
45
/21
/20
15
10
/27
/20
15
5/2
6/2
01
6Mar
ket
Cap
(in
th
ou
san
ds)
Date of IPOs
IPO Offering Values (Market Cap)

26
Table Six
Average First Day Returns for Each Year
27
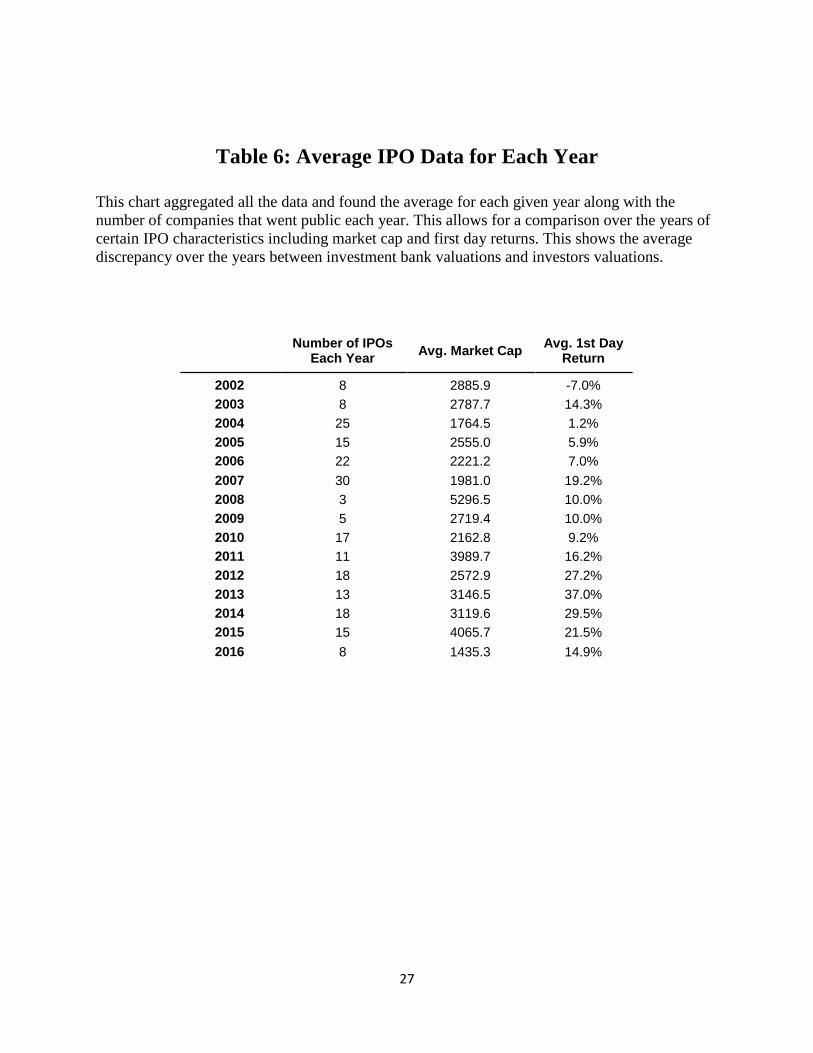
Table 6: Average IPO Data for Each Year
This chart aggregated all the data and found the average for each given year along with the
number of companies that went public each year. This allows for a comparison over the years of
certain IPO characteristics including market cap and first day returns. This shows the average
discrepancy over the years between investment bank valuations and investors valuations.
Number of IPOs Each Year
Avg. Market Cap Avg. 1st Day
Return
2002 8 2885.9 -7.0%
2003 8 2787.7 14.3%
2004 25 1764.5 1.2%
2005 15 2555.0 5.9%
2006 22 2221.2 7.0%
2007 30 1981.0 19.2%
2008 3 5296.5 10.0%
2009 5 2719.4 10.0%
2010 17 2162.8 9.2%
2011 11 3989.7 16.2%
2012 18 2572.9 27.2%
2013 13 3146.5 37.0%
2014 18 3119.6 29.5%
2015 15 4065.7 21.5%
2016 8 1435.3 14.9%

28
Table Seven
Multiple Regression Model Results

29
Table 7: Multiple Regression Model Results
The following table displays the multiple regression model results for all three time periods. For
each time period, SALES is the previous year’s sales amount the firm had. ASSETS is total
assets for the firm the year prior to going public. RDEXP is the previous year’s R&D expense for
the previous year before going public. SALESTOASSETS is the Sales-to-Assets multiple for the
firm before going public to determine productivity.
Variables Coefficient P-Value
2002 - 2006
SALES -0.01302704 0.951980214
ASSETS 0.502119776 0.020630553
RDEXP 0.075476061 0.330103601
SALESTOASSETS -0.382658487 0.336809067
R Square 0.480010672
Number of Observations 69
Variables Coefficient P-Value
2007 - 2011
SALES -0.01302704 0.435481125
ASSETS 0.502119776 0.114863561
RDEXP 0.075476061 0.848609927
SALESTOASSETS -0.382658487 0.319718402
R Square 0.511455597
Number of Observations 60
Variables Coefficient P-Value
2012 - 2016
SALES 0.268883811 0.197966565
ASSETS 0.362407166 0.06935713
RDEXP 0.234900674 0.027119425
SALESTOASSETS -0.166365055 0.575753449
R Square 0.554473869
Number of Observations 71

30
Bibliography Aggarwal, Rajesh, Sanjai Bhagat, and Srinivasan Rangan. "The Impact of Fundamentals on IPO
Valuation." Financial Management 2009: 253. JSTOR Journals. Web. 22 Nov. 2016.
Bartov, Eli, Partha Mohanram, and Chandrakanth Seethamraju. "Valuation of Internet Stocks:
An IPO Perspective." Journal of Accounting Research 2002: 321. JSTOR Journals. Web.
22 Nov. 2016.
Bloomberg. (2017) Bloomberg Professional. [Online]. Available at: Subscription Service
(Accessed: 15 January 2017)
Dua, Pami, and Divya Tuteja. "Financial Crises And Dynamic Linkages Across International
Stock And Currency Markets." Economic Modelling 59.(2016): 249-261. ScienceDirect.
Web. 13 Nov. 2016.
Hand, J.R.M., 2003, “Profits, Losses and the Non-Linear Pricing of Internet Stocks,” in J.R.M.
Hand and B. Lev, Eds., Intangible Assets: Values, Measures and Risks, New York, NY,
Oxford University Press.
Morris, John J., and Pervaiz Alam. "Value Relevance And The Dot-Com Bubble Of The 1990S."
Quarterly Review Of Economics And Finance 52.(2012): 243-255. ScienceDirect. Web.
13 Nov. 2016.