how has/is/will climate change impact(ed)/ing people living in the western us?
Post on 19-Dec-2015
214 views
TRANSCRIPT
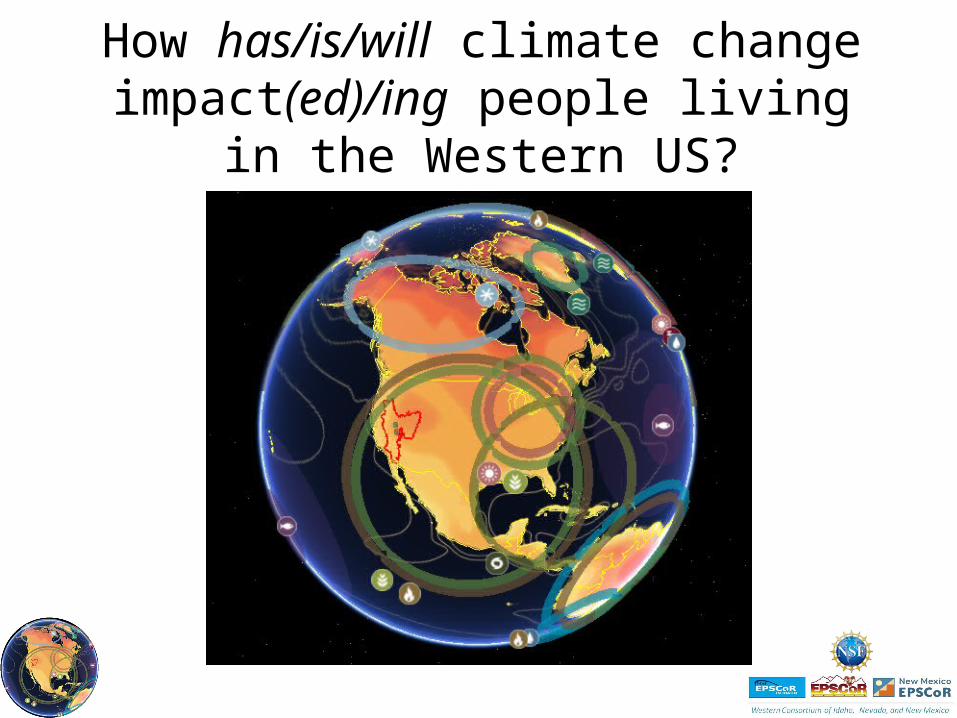
How has/is/will climate changeimpact(ed)/ing people living
in the Western US?

What’s the Problem?


Lake Mead

Urban Sprawl in the LV Valley
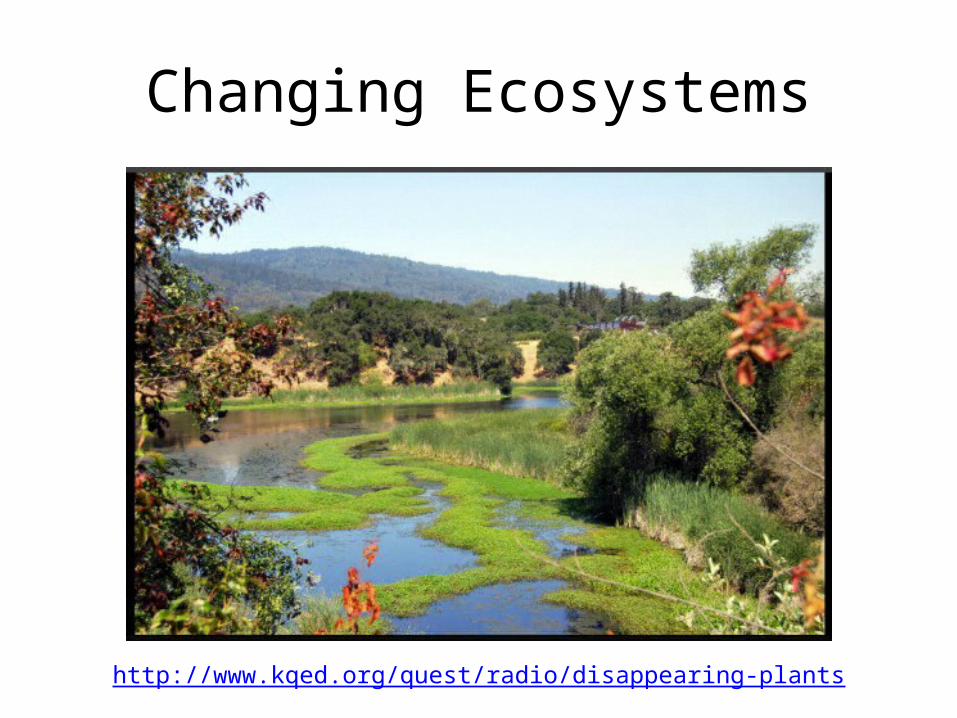
Changing Ecosystems
http://www.kqed.org/quest/radio/disappearing-plants

How has/is/will climate changeimpact(ed)/ing people living
in the Western US?

What’s the Question?
Has Is WillHistoric Current Future
Knowing and Predicting
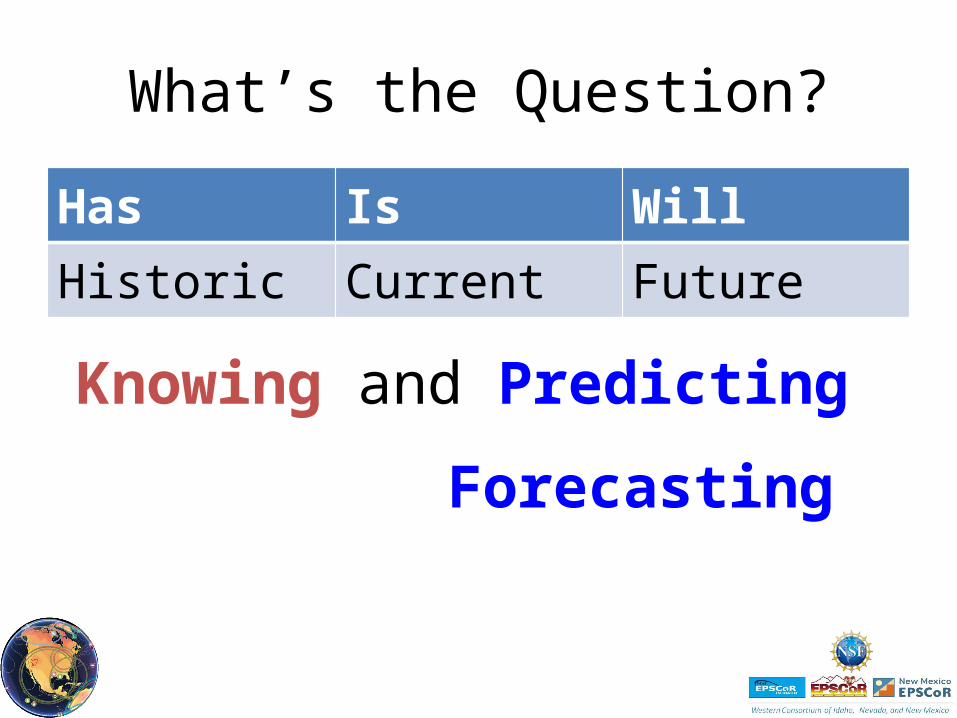
What’s the Question?
Has Is WillHistoric Current Future
Knowing and Predicting
Forecasting

Weather vs. Climate
• Weather - a set of all the phenomena occurring in a given atmosphere at a given time.
• Climate – the average set of all phenomena occurring in a given atmosphere over periods of at least 30 years.

Can we?
Knowing PredictingWeather Good So-So (7-10 days)Climate Somewhat ?????

Scientific Issues• Systems Thinking
– Human nature– Silos– Socio-political influences– Power
• Modeling– Consensus– Tools
• Data– Quality and Integrity– Storage
• Complexity

Data vs. Information
• Data - Raw, unprocessed measurements.• Information - Data + Context

Spatial vs. Temporal
• Spatial data - Data that that is linked to locations in geographic space, usually via features on a map.
• Temporal data - Data that can be linked to a certain time or period between two moments in time.

What does this tell us?Precipitation (inches)
0.716
0.493
1.591
0.388
0.570
1.708
0.903
0.739
0.881
0.876

Average Precipitation in Nevada During March (1895-1940)
YearMonth
Precipitation (inches)
1895 3 0.716
1900 3 0.493
1905 3 1.591
1910 3 0.388
1915 3 0.570
1920 3 1.708
1925 3 0.903
1930 3 0.739
1935 3 0.881
1940 3 0.876
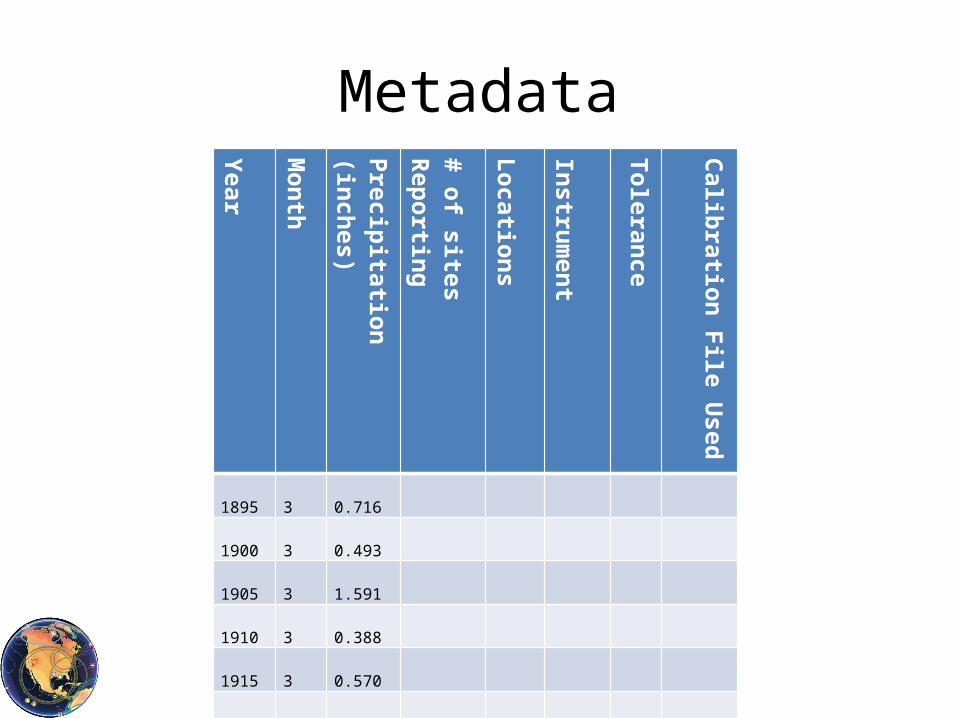
Metadata
YearMonth
Precipitation (inches)
# of sitesReporting
Locations
Instrument
Tolerance
Calibration File Used
1895 3 0.716
1900 3 0.493
1905 3 1.591
1910 3 0.388
1915 3 0.570
1920 3 1.708
1925 3 0.903
1930 3 0.739
1935 3 0.881
1940 3 0.876

Inscriptions as Data
1890 1900 1910 1920 1930 1940 19500
0.2
0.4
0.6
0.8
1
1.2
1.4
1.6
1.8
Average Annual Precipitation in Nevada during March (1895-1940)
Year
Prec
ipita
tion
in In
ches
How has/is/will climate changeimpact(ed)/ing people living
in the Western US?