how important are non-tariff barriers? complementarity of...
TRANSCRIPT
How important are non-tariff barriers? Complementarity of infrastructure and
institutions of trading partners
Zsoka Koczan and Alexander Plekhanov
Summary
The paper provides an empirical analysis of the importance of infrastructure for bilateral trade flows using an augmented gravity model of trade. The estimates suggest that potential gains from improvements in infrastructure are large and far exceed the effects of lowering tariff barriers. Moreover, the effect of improving hard infrastructure on trade flows in a particular country increases with the quality of infrastructure of trading partners. Similar complementarity is observed for control of corruption, with a large asymmetry of effects, where institutions in the destination market seem to be considerably more important.
Keywords: infrastructure, imports, exports, tariffs, regional integration
JEL Classification Number: F14, F15
Contact details: Alexander Plekhanov, European Bank for Reconstruction and Development, One Exchange Square, London, EC2A 2JN, UK. Email: [email protected]
Zsoka Koczan is at the University of Cambridge; Alexander Plekhanov is a senior economist at the European Bank for Reconstruction and Development.
The paper benefited from early discussions with Veronika Zavacka. The authors are also grateful to Erik Berglöf, Marek Dabrowski, Ralph de Haas, Asset Irgaliyev, Oleg Karachun, Yevgeniya Korniyenko, Mykhailo Oliinyk, Nienke Oomes, Alexander Pivovarsky and Helena Schweiger for valuable comments and suggestions and to Teodora Tsankova for excellent research assistance.
The findings, interpretations and conclusions expressed in this working paper are those of the authors and do not necessarily reflect the official position of the organisations the authors belong to.
Working Paper No. 159 Prepared in July 2013

2
1. Introduction
This paper examines the widely held view that the value of modern trade agreements derives primarily from investment, service liberalisation and the removal of non-tariff barriers rather than changes in rules governing movement of goods such as tariffs and quotas (Baldwin 2011; Schiff and Winters, 2003). Non-tariff and beyond border barriers take various forms, from rent seeking of customs officials to inadequate transport infrastructure to poor overall business environment. While they are less visible and thus harder to measure than tariff barriers, they are no less important. For example, a recent study estimated that one extra day spent by goods in transit is equivalent to an additional tariff of between 0.6 per cent and 2.3 per cent (Hummels and Schaur, 2012).
This paper contributes to the existing literature by looking at the impact of hard infrastructure as well as institutional factors proxied by corruption measure control on trade flows and by particularly focusing on the joint effects of the quality of infrastructure of trading partners as well as joint effects of the quality of institutions in exporter and importer countries.
A global gravity model of trade is adopted in this paper to explain exports from a large number of developed and developing economies to individual trading partners across the world. The analysis confirms that there are large potential gains from improvements in cross-border infrastructure that far exceed the effects of lowering tariff barriers to trade.
The estimates further suggest that such gains depend crucially on the infrastructure capacity of trading partners. In particular, trade returns to improving infrastructure are greatest where the infrastructure of trading partners is highly developed. Similar complementarity is observed for quality of institutions. The marginal effect of improving institutions (reducing corruption) on exports from any given country is lower for trade with countries where corruption is more prevalent, and higher for trade with countries where there is less corruption. The results point to importance of coordinated improvements in trade infrastructure such as cross-border transport corridors.
Section 2 of this paper provides a brief review of the vast literature on the role of non-tariff barriers, focusing on infrastructure and corruption. Section 3 outlines the theoretical microfoundations of the empirical estimation strategy. Section 4 discusses the empirical approach and presents the results.
2. Importance of non-tariff barriers to trade
This study is part of the vast literature attempting to explain bilateral trade flows using gravity models. Gravity equations explain bilateral international trade flows using controls such as GDP, distance and a variety of other factors affecting trade barriers. It has been widely used to infer trade flow effects of institutions such as customs unions, exchange-rate mechanisms, ethnic ties, linguistic identity and international borders.
2.1. Infrastructure measures in gravity models
Numerous papers have examined the role of infrastructure in gravity models – for a recent review of empirical studies see, for instance, Kepaptsoglou, Karlaftis and Tsamboulas (2010).
3
The following section provides a brief summary of some of the recent work in this area, though the list is by no means exhaustive.
Most of the existing literature looks at the role of infrastructure by augmenting gravity models with various measures of infrastructure, often alongside institutions, and concludes that these have significant positive effects. Jansen and Nordas (2004) analysed the effects of trade policy restrictiveness, the quality of institutions and the quality of infrastructure on trade flows, focusing both on the size of total trade flows and on bilateral trade patterns. They found that the quality of roads and the rule of law have a significant and positive effect on the ratio of trade to GDP and that lower tariffs only increase this ratio in countries where the rule of law is considered to be strong. In a similar vein, Martínez-Zarzoso and Márquez-Ramos (2005) estimated a gravity equation augmented with technological innovation and transport infrastructure and found that investing in transport infrastructure and technological innovation leads to the level of competitiveness being maintained or improved.
Shepherd and Wilson (2006) used detailed overland transit information from an original road network database to assess the importance of regional infrastructure externalities. Gravity model simulations suggested that an ambitious but feasible road upgrade could increase trade by far more than tariff reductions or trade facilitation programmes of comparable scope. Cross-country spillovers due to overland transit were found to be very large, bolstering the case for regional coordination of infrastructure investments.
These results were also reproduced on various subsets of countries. Martinez-Zarzoso and Nowak-Lehmann (2003) applied the gravity trade model to assess Mercosur-European Union trade relying on panel data analysis and found that infrastructure, along with income differences and exchange rates, was an important determinant of bilateral trade flows. Acosta Rojas, Calfat and Flores (2005) presented evidence on the key role of infrastructure in the trade patterns of the Andean community. They found that while trade liberalisation eliminates most of the distortions a protectionist tariff system imposes on international business, transportation costs represent a considerably larger barrier to trade nowadays than in past decades. De (2006) found that transaction costs are a greater barrier to trade integration than import tariffs for most Asian countries. Fujimura and Edmonds (2006) investigated the impact of cross-border transport infrastructure on the economies of the Greater Mekong Subregion and concluded that cross-border and domestic transport infrastructure together could reduce trade costs and lead directly to increased trade and investment.1
Felipe and Kumar (2010) used a gravity model to examine the relationship between bilateral trade flows and trade facilitation (measured using the World Bank’s Logistic Performance Index, LPI) for Central Asian countries. They found significant gains in trade as a result of improving trade facilitation in these countries, varying from 28 per cent in the case of Azerbaijan to as much as 63 per cent in the case of Tajikistan. Among the different components of LPI, they found that the greatest increase in total trade was from improvement in infrastructure followed by logistics and efficiency of customs and other border agencies. Furthermore, they showed that the increase in bilateral trade, due to an improvement in the exporting country’s LPI, was greater in more sophisticated high-tech products compared with the impact on trade in less sophisticated low-tech products – suggesting that improvements in
1 Greater Mekong Subregion includes Cambodia, Laos, Myanmar, Thailand, Vietnam and the Yunnan Province of China.

4
infrastructure become particularly important as Central Asian countries seek to reduce their dependence on exports of natural resources and diversify their manufacturing base by shifting to more sophisticated goods.
The importance of infrastructure was also highlighted by several papers focusing on particular sectors. For instance, Nordas and Piermartini (2004) estimated a gravity model that incorporated bilateral tariffs and a number of indicators for the quality of infrastructure (road, airport, port and telecommunication, as well as the time required for customs clearance) on total bilateral trade and on trade in the automotive, clothing and textile sectors. They found that bilateral tariffs, generally neglected in gravity regressions of bilateral flows, have a significant negative impact on trade; the quality of infrastructure is an important determinant of trade performance; port efficiency appears to have the largest impact on trade among all indicators of infrastructure; and timeliness and access to telecommunication are relatively more important for export competitiveness in the clothing and automotive sector respectively. Further, using an adapted gravity trade model of bilateral agro-food trade between OECD countries, Bojnec and Ferto (2010) found a positive association between information and communication infrastructure development and bilateral agro-food trade.
Most of these studies used augmented standard gravity models, explaining trade flows by the size of countries, their GDP, the distance between them, whether they share a border and a landlocked dummy variable as well as various measures of infrastructure quality. Very few papers introduced interaction terms between various characteristics of a country. Notable exceptions include Francois and Manchin (2007) who examined the influence of institutions, geographic context and infrastructure on trade, focusing on threshold effects, emphasising cases where bilateral pairs do not trade. They found that infrastructure and, to a lesser extent, institutional quality are significant determinants not only of export levels but also of the probability that exports will take place at all. They concluded that for the least developed countries, there is evidence of a broad three-part complementarity between greater involvement of the government in the economy, domestic communication infrastructure and domestic transport infrastructure in terms of their impact on export performance.
Similarly, Iwanow and Kirkpatrick (2007) applied a gravity model augmented with trade facilitation, regulatory quality and infrastructure and showed that while trade facilitation can indeed contribute to improved export performance, improvements in the quality of the regulatory environment and the basic transport and communications infrastructure are equally or perhaps even more important in facilitating export growth. Examining interactions between contract enforcement and trade facilitation, as well as between regulatory quality and trade facilitation, they concluded that most benefits would stem from an integrated programme of strategic investments aimed at relaxing the supply side constraints that limit an economy’s responsiveness to improved market opportunities.
To our knowledge, none of the gravity model papers so far have examined interactions between exporter and importer infrastructure measures. We therefore aim to contribute to this literature by allowing marginal benefits of improving infrastructure to depend on the trade partner’s infrastructural quality.

5
2.2 Corruption measures in gravity models
Corruption is not new to the gravity literature on trade flows. Trade may be reduced in response to hidden transactions costs associated with the insecurity of international exchange. Contracts may not be enforced. Bribes may be extorted. Shipments may be hijacked. Abundant evidence suggests that transactions costs associated with insecure exchange significantly impede international trade. They result in a price mark-up equivalent to a hidden tax or tariff. These price mark-ups significantly constrain trade where legal systems poorly enforce commercial contracts and where economic policy lacks transparency and impartiality.
However, most of the literature notes that there could be two opposing effects and tries to determine which of them is more important. On the one hand, corruption effectively acts as a tax on trade when corrupt customs officials in the importing country extort bribes from exporters (the extortion effect discussed above). Conversely, if tariffs are high corruption may be trade- enhancing (conditional on prevailing tariffs) when corrupt officials allow exporters to evade tariff barriers (the evasion effect).
Most papers found some evidence for both effects, with the extortion effect dominating in most cases. Dutt and Traca (2010) derived and estimated a corruption-augmented gravity model and examined opposing effects in greater detail by interacting corruption measures with nominal tariffs. They hypothesised that while corruption taxes trade in an environment of low tariffs, it may create trade-enhancing effects when nominal tariffs are high, thus creating an inverted-U shape. Their predictions were borne out in the data - corruption taxes trade in the majority of cases, but in high tariff environments (covering 5-14 per cent of the observations in their sample) its marginal effect is trade-enhancing. Lavallee (2005) tested a gravity model on a sample of 21 OECD countries and 95 developing countries over the period 1984-1997 and used a non-linear approximation to show that the two traditional views of the consequences of corruption on trade co-exist. The estimation results showed that corruption could act both as an obstacle and as beneficial ‘grease’ for international trade. Horsewood and Voicu (2011) relied on a data set comprising OECD economies, new EU members and developing nations, finding that reducing a country's corruption increases trade flows.
Anderson and Marcouiller (2002) estimated the effects of corruption on trade using a structural model of import demand in which insecurity acts as a hidden tax on trade and found that inadequate institutions constrain trade as much as tariffs do. On the other hand, trade was implied to expand dramatically when supported by a legal system capable of enforcing commercial contracts and transparent and impartial government economic policy. Corruption could also account for the fact that high-income, capital-abundant countries trade disproportionately with each other (despite similar factor endowments) as good institutional support for trade among high-income countries lowers transactions costs. This argument does not imply, however, that low-income countries should also trade disproportionately with each another.
On a related note, Tingvall (2010) analysed how firms’ choices of country and the volume of offshored material inputs are affected by corruption in target economies. Based on the gravity model of trade, the analysis suggested that corruption is a deterrent for offshoring at both the extensive and the intensive margins – firms avoid corrupt countries and, conditional on the
6
choice of country, corruption reduces the volume of offshored inputs. The negative impact of corruption is largest in poor countries.
As in the case of infrastructure, we aim to contribute to the existing literature by examining interaction effects between the control of corruption in the exporting and the importing country. We thus hope to allow for varying marginal effects of improvements in the quality of institutions depending on the institutions of the trading partners.
3. Theoretical framework
The gravity model of trade has been widely used in empirical work to study the role of various factors. These include border effects2, internal and external conflicts,3 currency unions,4 General Agreements on Tariffs and Trade (GATT)/ World Trade Organisation (WTO) membership,5 security of property rights and the quality of institutions.6 Anderson (2011) provides a review of the recent developments in the gravity models literature (see also Anderson and Van Wincoop (2004) for a survey of the literature on trade costs).
Anderson (1979) offered one of the first attempts to provide clear microfoundations for the gravity model.7 This theory suggested that, after controlling for size, trade between two regions is decreasing in their bilateral trade barrier measured relative to the average barrier to trade between the two regions and all their other trade partners. Intuitively, the more resistant a region is to trade with others, the more it is pushed to trade with a given bilateral partner. More recently, Anderson and Van Wincoop (2003) showed that most of the estimated gravity equations do not have a theoretical foundation due to “multilateral resistance” terms (or rather lack thereof) and offered a theoretical framework that can be easily estimated.
A sketch of the theoretical framework is provided below to motivate our empirical specification. What follows is largely based on Anderson and Van Wincoop (2003, 2004) and Baldwin and Taglioni (2007).
Assume that only one single differentiated good is produced in each country. Preferences are of a constant elasticity of substitution (CES) functional form. Let be the consumption by country consumers of goods imported from country . Consumers in country maximise
2 McCallum (1995). 3 Blomberg and Hess (2006); Glick and Taylor (2010); Martin et al. (2008); Rohner et al. (2011). 4 Glick and Rose (2002); Rose (2000); Rose and van Wincoop (2001). 5 Rose, 2004. 6 Anderson and Marcouiller (2002); Berkowitz et al. (2006); de Groot et al. (2004); Nunn, 2007). 7 Bergstrand (1985) is another early attempt to theoretically justify gravity equations. Anderson (1979) provides a theoretical foundation for the gravity model under perfect competition based on constant elasticity of substitution (CES) preferences and goods that are unique to their production origin and are imperfectly substitutable with other countries’ goods. Further theoretical extensions, for instance, Bergstrand (1989, 1990) have preserved the CES preference structure and added monopolistic competition or a Heckscher-Ohlin structure.

7
subject to the budget constraint
where is the elasticity of substitution between goods, is a positive distribution parameter, is the nominal expenditure of country on imported goods, and is the price of country
goods inside the importing country , also known as the ‘landing price’.
Then, from the maximisation problem, the nominal import expenditure on country ’s good can be written as a function of relative prices and the income level:
where is country ’s CES price index:
Prices differ among partner countries due to trade costs. The ‘landed price’ of country ’s good in country depends on the exporter’s supply price and trade costs . Exporters in country pass on bilateral trade costs to importers via the following pass-through equation:
resulting in the following price index, where reflects all bilateral trade costs between country and country :
In addition to transportation costs, these trade costs reflect information costs, legal costs, regulatory costs and so on. This is where institutional variables, such as control of corruption and infrastructure measures come into play.
The value of imports, , can be derived from the expression defining the nominal import expenditure on imports as well as the pass-through equation as

8
Imposing a market clearing condition guarantees that the total income from exports of country is equal to the sum of import expenditure on good in all markets:
which can be expressed for each country as
, ∀
using the import expenditure equation. Multiplying both sides by world nominal income ∑ and solving for gives
Ω
where Ω ≡ ∑ and ≡ . Substituting into the expression for the value of
imports obtained above, we can now rewrite the value of imports as
Ω
This is the gravity equation (it can be rearranged to look similar to the gravitational force equation):
where ≡ . In log-linear form it can also be written as:
1 1 Ω
This expression thus relates bilateral imports positively to the size of the countries and negatively to the trade barriers between countries (since 1). Bilateral trade barriers, , also referred to as “bilateral resistance” include tariff as well as non-tariff barriers, but also factors such as transportation costs and distance. The term includes the price indices of the two countries – it should however be noted that while Ω and can be interpreted as price indices in the model, they should not be interpreted as price indices in general, rather should be thought of as nonpecuniary trade costs that a country has with all its trading partners. These “multilateral” resistance terms are often unobservable but could be subsumed by country fixed effects (Anderson and Van Wincoop, 2003).
Feenstra (2002) also showed that an estimation strategy with exporting and importing country fixed effects produces consistent estimates of the average border effect across countries. In
9
practice, however, quality of infrastructure may in part represent a fixed effect (characteristics of a country) and in part represent an obstacle specific to trade with a particular partner, as discussed further below.
4. Data
Systematic cross-country or cross-product data on overall non-tariff barriers are hard to obtain. The analysis below uses import data from the UN Comtrade WITS (World Integrated Trade Solution) database. The average effective tariffs are taken from Trade Analysis and Information System (TRAINS) UNCTAD database. They are computed for individual industries at the two-digit level of disaggregation – this includes industries such as processed food or durable goods.
Information on GDP and populations is taken from the IMF World Economic Outlook. The average distance between countries as well as data on common borders and access to sea is taken from CEPII (Centre d'Etudes Prospectives et d'Informations Internationales) distance dataset.
Hard infrastructure is measured using World Economic Forum data that assesses the quality of roads, air transportation, railways, ports and electricity supply in each country. The variable is expressed as an index and rescaled to vary from -3 to 3, where higher values correspond to better infrastructure.
Institutions are proxied by the control of corruption index taken from the World Bank Governance Indicators (see Kaufmann et al. 2009). It varies from -2.5 to 2.5 with higher values corresponding to lower perceived corruption.
We have constructed a panel dataset for the years 2000-11 however, as the infrastructural quality measures were only available for the period 2006-10, regressions including these variables refer to a shorter time period. For list of countries see Annex 1.
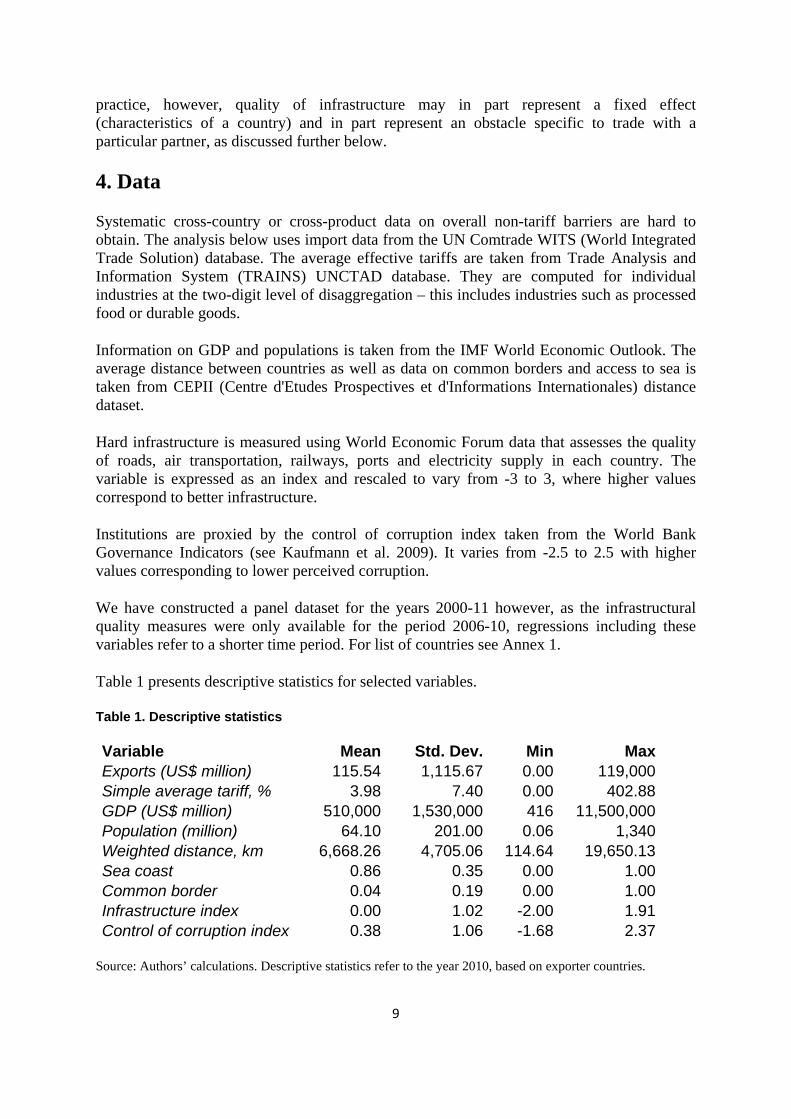
Table 1 presents descriptive statistics for selected variables.
Table 1. Descriptive statistics
Variable Mean Std. Dev. Min MaxExports (US$ million) 115.54 1,115.67 0.00 119,000Simple average tariff, % 3.98 7.40 0.00 402.88GDP (US$ million) 510,000 1,530,000 416 11,500,000Population (million) 64.10 201.00 0.06 1,340Weighted distance, km 6,668.26 4,705.06 114.64 19,650.13Sea coast 0.86 0.35 0.00 1.00Common border 0.04 0.19 0.00 1.00Infrastructure index 0.00 1.02 -2.00 1.91Control of corruption index 0.38 1.06 -1.68 2.37
Source: Authors’ calculations. Descriptive statistics refer to the year 2010, based on exporter countries.
10
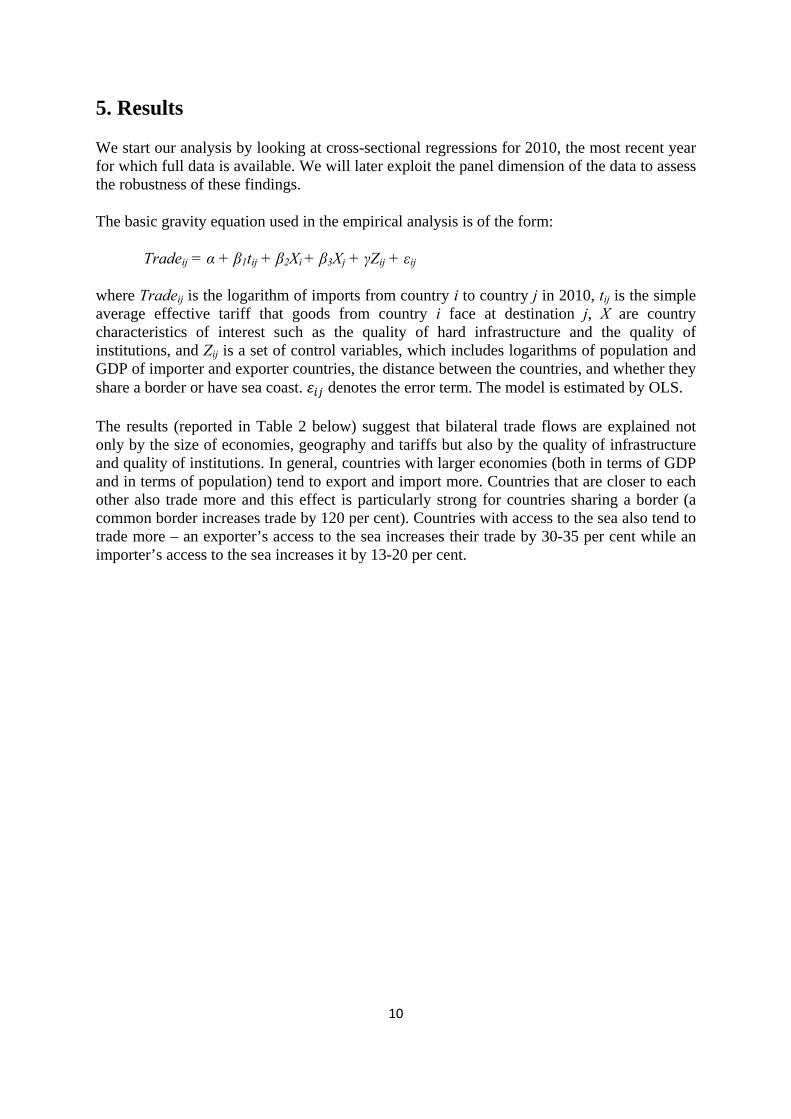
5. Results
We start our analysis by looking at cross-sectional regressions for 2010, the most recent year for which full data is available. We will later exploit the panel dimension of the data to assess the robustness of these findings.
The basic gravity equation used in the empirical analysis is of the form:
Tradeij = α + β1tij + β2Xi + β3Xj + γZij + εij
where Tradeij is the logarithm of imports from country i to country j in 2010, tij is the simple average effective tariff that goods from country i face at destination j, X are country characteristics of interest such as the quality of hard infrastructure and the quality of institutions, and Zij is a set of control variables, which includes logarithms of population and GDP of importer and exporter countries, the distance between the countries, and whether they share a border or have sea coast. denotes the error term. The model is estimated by OLS.
The results (reported in Table 2 below) suggest that bilateral trade flows are explained not only by the size of economies, geography and tariffs but also by the quality of infrastructure and quality of institutions. In general, countries with larger economies (both in terms of GDP and in terms of population) tend to export and import more. Countries that are closer to each other also trade more and this effect is particularly strong for countries sharing a border (a common border increases trade by 120 per cent). Countries with access to the sea also tend to trade more – an exporter’s access to the sea increases their trade by 30-35 per cent while an importer’s access to the sea increases it by 13-20 per cent.

11
Table 2. Determinants of bilateral trade flows, 2010
Dependent variable: Bilateral trade flow, log
(1) (2) (3) (4) (5)
Simple average tariff -0.028***-
0.024***-
0.024***-
0.017*** -
0.017***(0.003) (0.003) (0.003) (0.003) (0.003)
Exporter GDP, log 0.592*** 0.435*** 0.431*** 0.473*** 0.469***(0.010) (0.020) (0.020) (0.019) (0.019)
Importer GDP, log 1.044*** 0.617*** 0.614*** 0.815*** 0.815***(0.009) (0.019) (0.019) (0.018) (0.018)
Exporter population, log 0.249*** 0.432*** 0.437*** 0.418*** 0.422***(0.013) (0.023) (0.023) (0.021) (0.021)
Importer population, log 0.046*** 0.502*** 0.504*** 0.222*** 0.222***(0.011) (0.020) (0.020) (0.018) (0.018)
Weighted distance, log -1.219***-
1.249***-
1.234***-
1.225*** -
1.218***(0.013) (0.013) (0.013) (0.015) (0.015)
Sea coast (exporter) 0.349*** 0.370*** 0.365*** 0.293*** 0.286***(0.031) (0.031) (0.031) (0.035) (0.035)
Sea coast (importer) 0.135*** 0.181*** 0.168*** 0.209*** 0.198***(0.035) (0.035) (0.035) (0.040) (0.040)
Common border 1.212*** 1.220*** 1.162*** 1.188*** 1.147***(0.055) (0.056) (0.056) (0.059) (0.060)
Control of corruption, exporter 0.227*** 0.184***
(0.024) (0.024)Control of corruption, importer 0.604*** 0.534***
(0.022) (0.023)Control of corruption, exp*imp 0.119***
(0.010)Infrastructure, exporter 0.263*** 0.264***
(0.023) (0.023)Infrastructure, importer 0.362*** 0.354***
(0.022) (0.022)Infrastructures, exp*imp 0.067***
(0.012)Number of observations 69,606 69,606 69,606 54,086 54,086R-squared 0.4272 0.4343 0.4354 0.4244 0.4247
Source: Author’s calculations.
Note: Constant not reported. Robust standard errors in parentheses. Values significant at the 10 per cent level are marked with *; at the 5 per cent level, with **; at the 1 per cent level, with ***.
12
As expected, tariff barriers have a negative impact on trade. A one percentage point reduction in the tariff faced by country’s exports of a particular type of goods at the destination border is associated with 2-3 per cent higher exports to that country. As exports in the sample face an effective average tariff of around 4 per cent (non-weighted), total gains from reducing tariff barriers, while sizable, are ultimately limited.
Indeed, estimates suggest that trade is affected to a greater extent by corruption and poor infrastructure. Apart from its general impact on the economy, corruption often directly determines the severity of non-tariff obstacles to trade. Lower corruption, among other things, means better functioning customs and more effective processing of tax refunds – issues that often affect operations of both exporters and importers. The results suggest that while the institutional quality of both exporters and importers is important for trade, the latter has a much larger effect, therefore suggesting that conditions in the destination market matter more. This makes sense as this side is likely to carry the bulk of the administrative and institutional burden. A one standard deviation improvement in the exporter’s control of corruption index (roughly a one unit improvement) is associated with a 20 per cent increase in exports while a similar improvement on the importer side increases trade by 50-60 per cent.
A similar effect can be seen in the quality of infrastructure. Half a notch improvement in infrastructure on the exporter side (less than one standard deviation) is associated with a 13 per cent increase in trade; a similar improvement on the importer side is associated with a further 18 per cent increase in bilateral trade flows. The effects are of similar magnitude on both sides of the border, although the destination market seems to also matter somewhat more.
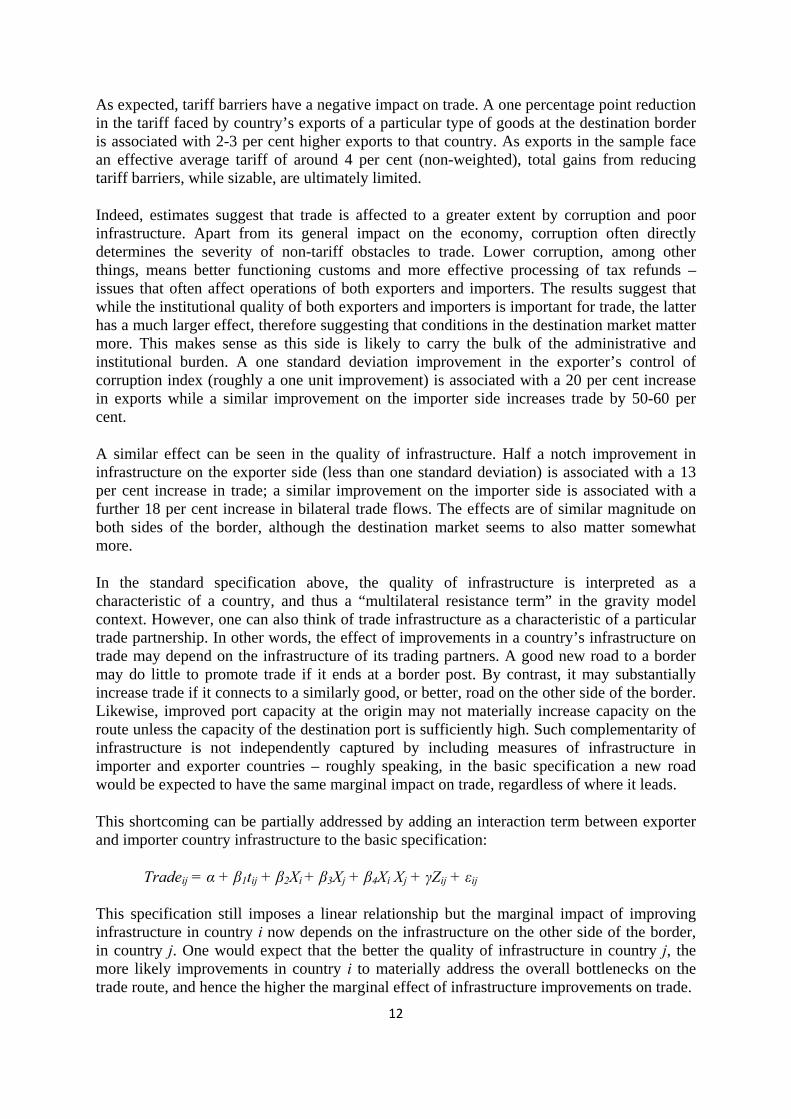
In the standard specification above, the quality of infrastructure is interpreted as a characteristic of a country, and thus a “multilateral resistance term” in the gravity model context. However, one can also think of trade infrastructure as a characteristic of a particular trade partnership. In other words, the effect of improvements in a country’s infrastructure on trade may depend on the infrastructure of its trading partners. A good new road to a border may do little to promote trade if it ends at a border post. By contrast, it may substantially increase trade if it connects to a similarly good, or better, road on the other side of the border. Likewise, improved port capacity at the origin may not materially increase capacity on the route unless the capacity of the destination port is sufficiently high. Such complementarity of infrastructure is not independently captured by including measures of infrastructure in importer and exporter countries – roughly speaking, in the basic specification a new road would be expected to have the same marginal impact on trade, regardless of where it leads.
This shortcoming can be partially addressed by adding an interaction term between exporter and importer country infrastructure to the basic specification:
Tradeij = α + β1tij + β2Xi + β3Xj + β4Xi Xj + γZij + εij
This specification still imposes a linear relationship but the marginal impact of improving infrastructure in country i now depends on the infrastructure on the other side of the border, in country j. One would expect that the better the quality of infrastructure in country j, the more likely improvements in country i to materially address the overall bottlenecks on the trade route, and hence the higher the marginal effect of infrastructure improvements on trade.
13
The results for this augmented specification are reported in column (5) of Table 3. The coefficient on the interaction term is indeed positive and statistically significant. The coefficients imply that if a partner country has a poor infrastructure, unilateral improvements in infrastructure will have virtually no impact on trade. By contrast, if infrastructure in the partner country is already of high quality, the additional benefits from improving infrastructure are large: a one standard deviation improvement is associated with more than doubling of trade flows.
Similarly, corruption may also have qualities of a bilateral resistance term as much as a multilateral resistance term. Corruption creates bottlenecks on a trade route and uncertainty for buyers and sellers. Returns to lowering corruption on one side of the route may be higher if institutions are already strong on the other side. If they are not, bottlenecks and uncertainty would still remain, resulting in a lower marginal effect on trade flows.
Estimation reveals a similar pattern for control of corruption. The coefficient on the interaction term between control of corruption on the exporter side and on the importer side in column (3) of Table 3 is positive and statistically significant. It is also large in economic terms given that countries with strong institutions have control of corruption indices of around 2. The positive effect of controlling corruption on exports is effectively doubled if the destination country has a low level of corruption.
While the above results only used a single cross-section, we wish to examine the robustness of our results when exploiting the panel dimension. Table 3 reports a simple pooled OLS specification with year dummy variables to account for aggregate time trends and standard errors clustered at the country pair level to account for the repeated nature of observations over time.

14
Table 3: Determinants of bilateral trade flows, pooled data
Dependent variable: Bilateral trade flow, log
(1) (2) (3) (4) (5)
Simple average tariff -0.020***-
0.020***-
0.021***-
0.022*** -
0.022***(0.002) (0.002) (0.002) (0.003) (0.003)
Exporter GDP, log 0.634*** 0.537*** 0.532*** 0.515*** 0.511***(0.012) (0.020) (0.020) (0.020) (0.020)
Importer GDP, log 1.027*** 0.630*** 0.627*** 0.841*** 0.839***(0.010) (0.020) (0.020) (0.021) (0.021)
Exporter population, log 0.158*** 0.260*** 0.266*** 0.315*** 0.319***(0.013) (0.021) (0.021) (0.020) (0.020)
Importer population, log 0.022** 0.438*** 0.440*** 0.217*** 0.218***(0.012) (0.022) (0.021) (0.020) (0.019)
Weighted distance, log -1.158***-
1.174***-
1.157***-
1.216*** -
1.208***(0.016) (0.015) (0.015) (0.017) (0.017)
Sea coast (exporter) 0.421*** 0.449*** 0.442*** 0.397*** 0.388***(0.039) (0.039) (0.039) (0.042) (0.042)
Sea coast (importer) 0.113*** 0.175*** 0.160*** 0.151*** 0.140***(0.036) (0.036) (0.036) (0.043) (0.044)
Common border 1.151*** 1.149*** 1.091*** 1.144*** 1.100***(0.070) (0.074) (0.075) (0.083) (0.084)
Control of corruption, exporter 0.144*** 0.098***(0.024) (0.025)
Control of corruption, importer 0.582*** 0.514***(0.024) (0.025)
Control of corruption, exp*imp 0.111***(0.011)
Infrastructure, exporter 0.236*** 0.244***(0.023) (0.023)
Infrastructure, importer 0.328*** 0.328***(0.024) (0.024)
Infrastructures, exp*imp 0.069***(0.012)
Number of observations 793,870 681,963 681,963 356,617 356,617Number of clusters 13,393 13,303 13,303 9,720 9,720R-squared 0.4275 0.4336 0.4346 0.426 0.4264
Source: Author’s calculations.
Note: Year dummy variables included, but not reported. Standard errors in parentheses, clustered at the country pair level. Values significant at the 10 per cent level are marked with *; at the 5 per cent level, with **; at the 1 per cent level, with ***.
15
The results are very similar: larger countries and countries that are geographically closer still trade more and, as before, we find a small (about 2 per cent) effect of lowering tariff barriers. Exporter’s access to the sea increases trade by about 40 per cent, importers access to the sea increases it between 11-18 per cent. The asymmetry in the effect of corruption on trade is even more pronounced than before: a one unit improvement in the control of corruption index on the exporter side is associated with a 10 per cent increase in exports, while a similar improvement on the importer side increases trade by 50-60 per cent. Half a notch improvement in infrastructure on the exporter side is associated with an 11 per cent increase in trade; a similar improvement on the importer side results in a 15 per cent increase. As before, both corruption and infrastructure show strong trade partner complementarity properties.
Table 4 examines the robustness of our results further by looking at a between panel estimator. Whereas the pooled OLS estimator reported above used variation over both time and cross-sectional units, the between estimator in short panels uses only between or cross-sectional variation in the data (in this case, variation between country pairs) and is the OLS estimator from the regression of on an intercept and . In this case it is preferable to the standard fixed effects estimator as the infrastructure and institutions variables have very little meaningful time variation, while the between estimator exploits the time dimension to account for country pair time invariant unobservables and uses the cross-sectional variation for estimation.

16
Table 4: Determinants of bilateral trade flows, between estimator
Dependent variable: Bilateral trade flow, log
(1) (2) (3) (4) (5) Simple average tariff -0.014*** -0.017*** -0.017*** -0.018*** -0.019*** (0.002) (0.002) (0.002) (0.002) (0.002)Exporter GDP, log 0.639*** 0.574*** 0.570*** 0.535*** 0.531*** (0.008) (0.014) (0.014) (0.015) (0.015)Importer GDP, log 1.067*** 0.618*** 0.615*** 0.838*** 0.835*** (0.007) (0.013) (0.013) (0.014) (0.014)Exporter population, log 0.122*** 0.197*** 0.202*** 0.257*** 0.261*** (0.008) (0.014) (0.014) (0.014) (0.014)Importer population, log -0.021*** 0.452*** 0.455*** 0.251*** 0.253*** (0.007) (0.014) (0.014) (0.013) (0.013)Weighted distance, log -1.220*** -1.240*** -1.224*** -1.277*** -1.268*** (0.010) (0.010) (0.010) (0.012) (0.012)Sea coast (exporter) 0.345*** 0.356*** 0.346*** 0.416*** 0.405*** (0.024) (0.025) (0.024) (0.029) (0.029)Sea coast (importer) 0.152*** 0.220*** 0.205*** 0.208*** 0.196*** (0.025) (0.025) (0.025) (0.030) (0.030)Common border 1.355*** 1.338*** 1.265*** 1.263*** 1.213*** (0.051) (0.051) (0.051) (0.058) (0.059)Control of corruption, exporter
0.097*** 0.053***
(0.017) (0.017) Control of corruption, importer
0.667*** 0.612***
(0.016) (0.017) Control of corruption, exp*imp
0.139***
(0.008) Infrastructure, exporter 0.239*** 0.255*** (0.018) (0.018)Infrastructure, importer 0.412*** 0.422*** (0.017) (0.018)Infrastructures, exp*imp 0.087*** (0.010)Number of observations 793,870 681,963 681,963 356,617 356,617Number of groups 122,716 120,213 120,213 92,149 92,149R-squared within 0.0782 0.0514 0.0484 0.0166 0.0156R-squared between 0.4483 0.4555 0.457 0.4342 0.4347R-squared overall 0.426 0.4313 0.4319 0.4246 0.4249
Source: Author’s calculations.
Note: Standard errors in parentheses. Values significant at the 10 per cent level are marked with *; at the 5 per cent level, with **; at the 1 per cent level, with ***.
17
The between estimator confirms our earlier findings on the positive effects on trade of a larger GDP or population, a negative effect of distance, a small (about 1.5-2 per cent) effect of decreasing tariff barriers and a sizeable (about 15-40 per cent) effect of having access to the sea. As with the simple pooled OLS estimator there is a strong asymmetry in the effects of corruption, with a one unit improvement on the exporter side increasing trade by 8 per cent and a similar improvement on the importer side increasing it by over 60 per cent. As before, half a notch improvement in the exporter's infrastructure increases trade by 11-12 per cent, a similar improvement in the importer's infrastructure increases it by 20 per cent. Again, both infrastructural and institutional improvements are more beneficial when synchronized across trading partners.
6. Conclusion
This paper has looked at the effects of infrastructure and quality of institutions on bilateral trade flows, paying particular attention to the joint effects of the quality of infrastructure in importing and exporting countries and similar joint effects of control of corruption on the importer and the exporter side. The quality of infrastructure and quality of institutions were thus treated as both country characteristics and characteristics of a particular trade relationship.
Overall, the analysis suggests that potential trade gains from improvements in infrastructure are large and far exceed the effects of lowering tariff barriers to trade. Moreover, such gains depend on the infrastructure capacity of trading partners and are largest where the infrastructure of trading partners is highly developed, as in these cases where improvements in the country’s infrastructure helped to resolve important bottlenecks on respective trade routes. This suggests that simultaneous and complementary improvements in infrastructure can be most effective in facilitating trade. At the same time, coordinating infrastructure improvements is notoriously difficult. In this regard regional economic integration projects may provide the necessary framework for coordinating upgrades to the capacity of transport corridors, improvements in customs infrastructure and enhancement of other infrastructure links. Regional unions such as the EU and GCC have had encouraging experiences in such projects. Given the asymmetry in the effects of institutions and the large role of corruption control in the destination market, cooperation facilitated by regional integration could bring significant gains in this area as well.

18
Annex 1: List of countries
Afghanistan, Albania, Antigua and Barbuda, Argentina, Armenia, Australia, Austria, Azerbaijan, The Bahamas, Bahrain, Bangladesh, Barbados, Belarus, Belgium, Belize, Bermuda, Bhutan, Bolivia, Bonaire, Bosnia and Herzegovina, Botswana, Brazil, Brunei, Bulgaria, Cambodia, Canada, Cayman Islands, Chile, China, Colombia, Costa Rica, Croatia, Cuba, Cyprus, Czech Republic, Denmark, Dominica, Dominican Republic, Ecuador, Egypt, El Salvador, Estonia, Fiji, Finland, France, Georgia, Germany, Greece, Grenada, Guatemala, Guyana, Haiti, Honduras, Hong Kong, Hungary, Iceland, India, Indonesia, Iran, Iraq, Ireland, Israel, Italy, Jamaica, Japan, Jordan, Kazakhstan, Democratic People's Republic of Korea (North Korea), Republic of Korea (South Korea), Kuwait, Kyrgyz Republic, Latvia, Lebanon, Lithuania, Luxembourg, Macao, FYR Macedonia, Malaysia, Maldives, Malta, Mauritius, Mexico, Moldova, Monaco, Mongolia, Montenegro, Morocco, Myanmar, Nepal, Netherlands, New Zealand, Nicaragua, Norway, Oman, Pakistan, Panama, Papua New Guinea, Paraguay, Peru, Philippines, Poland, Portugal, Qatar, Romania, Russian Federation, Saudi Arabia, Singapore, Sint Maarten, Slovak Republic, Slovenia, South Africa, Spain, Sri Lanka, Suriname, Sweden, Switzerland, Syrian Arab Republic, Tajikistan, Thailand, Trinidad and Tobago, Tunisia, Turkey, Turkmenistan, Ukraine, United Arab Emirates, United Kingdom, United States, Uruguay, Uzbekistan, Venezuela, Vietnam, Yemen, Yugoslavia.

19
References
G. Acosta Rojas, G. Calfat and R. Flores (2005), Trade and Infrastructure: Evidences from the Andean Community, Fundação Getulio Vargas.
J. Anderson (1979), “A theoretical foundation for the gravity equation", American Economic Review, Vol. 69, pp. 106-16.
J. Anderson (2011), “The Gravity Model”, Annual Review of Economics, Vol. 3, pp. 133-60.
J. Anderson and D. Marcouiller (2002), “Insecurity and the pattern of trade: An empirical investigation”, Review of Economics and Statistics, Vol. 84, pp. 342-52.
J. Anderson and E. van Wincoop (2004), “Trade Costs", Journal of Economic Literature, Vol. 42, pp. 691-751.
J. Anderson and E. van Wincoop (2003), “Gravity with Gravitas", American Economic Review, Vol. 93, pp. 170-92.
R. Baldwin (2011), “21st Century Regionalism: Filling the Gap between 21st Century Trade and 20th Century Trade Rules”, WTO Staff Working Paper ERSD-2011-08.
R. Baldwin and D. Taglioni (2007), "Trade effects of the euro: A comparison of estimators”, Journal of Economic Integration, Vol. 22, No 4, pp. 780–818.
J. Bergstrand (1985), “The Gravity Equation in International Trade: Some Microeconomic Foundations and Empirical Evidence", Review of Economics and Statistics, Vol. 67, No. 3, pp. 474-81.
J. Bergstrand (1989), “The Generalized Gravity Equation, Monopolistic Competition, and the Factor-Proportions Theory in International Trade", Review of Economics and Statistics, Vol. 71, No. 1, pp. 143-53.
J. Bergstrand (1990), “The Heckscher-Ohlin-Samuelson Model, the Linder Hypothesis, and the Determinants of Bilateral Intra-industry Trade”, Economic Journal Vol. 100, No 403, pp. 1216–29.
D. Berkowitz, J. Moenius and K. Pistor (2006), "Trade, Law, and Product Complexity", Review of Economics and Statistics, Vol. 88, No 2, pp. 363-73.
B. Blomberg and G. Hess (2006), "How Much Does Violence Tax Trade?", Review of Economics and Statistics, Vol. 88, No 4, pp. 599-612.
S. Bojnec and I. Ferto (2010), “Internet and international food industry trade”, Industrial Management and Data Systems, Vol. 110, No 5.
P. De (2006), “Trade, Infrastructure and Transaction Costs: The Imperatives for Asian Economic Cooperation”, Journal of Economic Integration, Vol. 21, No. 4, pp. 708-35.
H. de Groot, G. Linders, P. Rietveld and U. Subramanian (2004), “The Institutional Determinants of Bilateral Trade Patterns”, Kyklos, Vol. 57, No 1, pp. 103-23.
20
P. Dutt and D. Traca (2005), "Trade and the Skill-Bias - It's Not How Much, But With Whom You Trade", CEPR Discussion Paper 5263.
P. Dutt and D. Traca (2010), "Corruption and Bilateral Trade Flows: Extortion or Evasion?", Review of Economics and Statistics, Vol. 92, No 4, pp. 843-60.
EBRD (2012), Transition Report 2012, Chapter 4, pp.62-79.
R. Feenstra (2002), "Border Effects and the Gravity Equation: Consistent Methods for Estimation", Scottish Journal of Political Economy, Vol. 49, No 5, pp. 491-506.
R. Glick and A. Rose (2002), "Does a currency union affect trade? The time-series evidence", European Economic Review, Vol. 46, No 6, pp. 1125-51.
R. Glick and A. Taylor (2010), "Collateral Damage: Trade Disruption and the Economic Impact of War", Review of Economics and Statistics, Vol. 92, No 1, pp. 102-27.
J. Felipe and U. Kumar (2010), "The Role of Trade Facilitation in Central Asia: A Gravity Model," Levy Economics Institute Working Paper 628.
J. Francois and M. Manchin (2007), “Institutions, Infrastructure and Trade", CEPR Discussion Paper 6068.
M. Fujimura and C. Edmonds (2006), "Road Infrastructure and Regional Trade: Evidence from the GMS", IDB Publication 42298.
N. Horsewood and A. Voicu (2011), “Does Corruption Facilitate Trade for the New EU Members?”, Kiel Institute for the World Economy Economics Discussion Paper 2011-53.
D. Hummels and G. Schaur (2012), “Time as a Trade Barrier”, NBER Working Paper 17758.
T. Iwanow and C. Kirkpatrick, 2007, “Trade facilitation, regulatory, quality and export performance”, Journal of International Development, Vol. 19, No 6, pp. 735-53.
M. Jansen and H. Nordås, 2004, "Institutions, Trade Policy and Trade Flows", CEPR Discussion Paper 4418.
D. Kaufmann, A. Kraay and M. Mastruzzi (2009), "Governance Matters VIII: Governance Indicators for 1996–2008", World Bank Policy Research Working Paper 4978.
K. Kepaptsoglou, M. Karlaftis and D. Tsamboulas (2010), “The Gravity Model Specification for Modeling International Trade Flows and Free Trade Agreement Effects: A 10-Year Review of Empirical Studies”, Open Economics Journal, Vol. 3, pp. 1-13.
E. Lavallée (2005), "Governance, Corruption and Trade: A North-South Approach”, Université Paris-Dauphine, Mimeo.
P. Martin, T. Mayer and M. Thoenig (2008), “Civil Wars and International Trade”, Journal of the European Economic Association, Vol. 6, No 2-3, pp. 541-50.
21
I. Martínez Zarzoso and L. Márquez Ramos (2005), "International Trade, Technological Innovation and Income: A Gravity Model Approach", Instituto Valenciano de Investigaciones Económicas Working Paper EC 2005-15.
I. Martínez-Zarzoso and F. Nowak-Lehmann (2003), "Augmented gravity model: An empirical application to Mercosur-European trade flows", International Trade Working Paper 0309019.
J. McCallum (1995), “National Borders Matter: Canada-U.S. Regional Trade Patterns", American Economic Review, Vol. 85, No 3, pp. 615-23.
H. Nordås and R. Piermartini (2004), “Infrastructure and Trade”, WTO Working Paper ERSD-2004-04.
N. Nunn (2007), "Relationship-Specificity, Incomplete Contracts and the Pattern of Trade", Quarterly Journal of Economics, Vol. 122, No 2, pp. 569-600.
D. Rohner, M. Thoenig and F. Zilibotti (2011), “War Signals: A Theory of Trade, Trust and Conflict”, University of Zurich, Mimeo.
A. Rose (2000), “One Money, One Market: Estimating the Effect of Common Currency on Trade”, Economic Policy: A European Forum, Vol. 30, pp. 7–33.
A. Rose (2004), “A Meta-Analysis of the Effect of Common Currencies on International Trade”, NBER Working Paper 10373.
A. Rose and E. van Wincoop (2001), “National Money as a Barrier to International Trade: The Real Case for Currency Union”, American Economic Review, Papers and Proceedings, Vol. 91, No 2, pp. 386-90.
M. Schiff and A. Winters (2003), Regional Integration and Development, Oxford: Oxford University Press.
B. Shepherd and J. Wilson (2006), “Road Infrastructure in Europe and Central Asia: Does Network Quality Affect Trade?”, World Bank Policy Research Working Paper 4104.
P. Tingvall (2010), "Offshoring and Corruption: Does Corruption Matter", Royal Institute of Technology Working Paper in Economics and Institutions of Innovation 237.