how long does a firework stay in the air?. what is the hang time of a football?
TRANSCRIPT
How long does a firework stay in the air?

What is the hangtime of afootball?
How does a satellite dish work?

Chapter 10 Quadratic Functions
Quadratic Functions are used to simulate real-life situations. A quadratic function is an equation in the form:
y = ax2 + bx + c
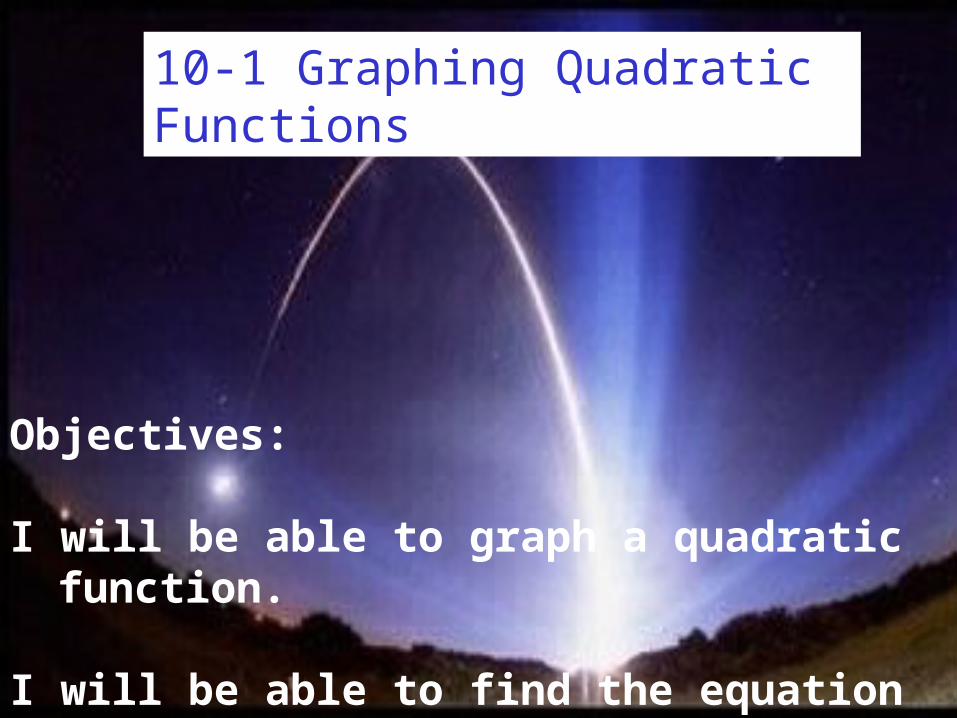
10-1 Graphing Quadratic Functions
Objectives:
I will be able to graph a quadratic function.
I will be able to find the equation of the axis of symmetry and the coordinates of the vertex.


The graph of a quadratic function is called a parabola. It looks like a U or an upside down U.
4
2
-2
-4
-5 5
f x = x2-2x-34
2
-2
-4
-5 5
f x = -x2-2x +3

Gallileo was the first to show that the path of an object thrown in space is a parabola.
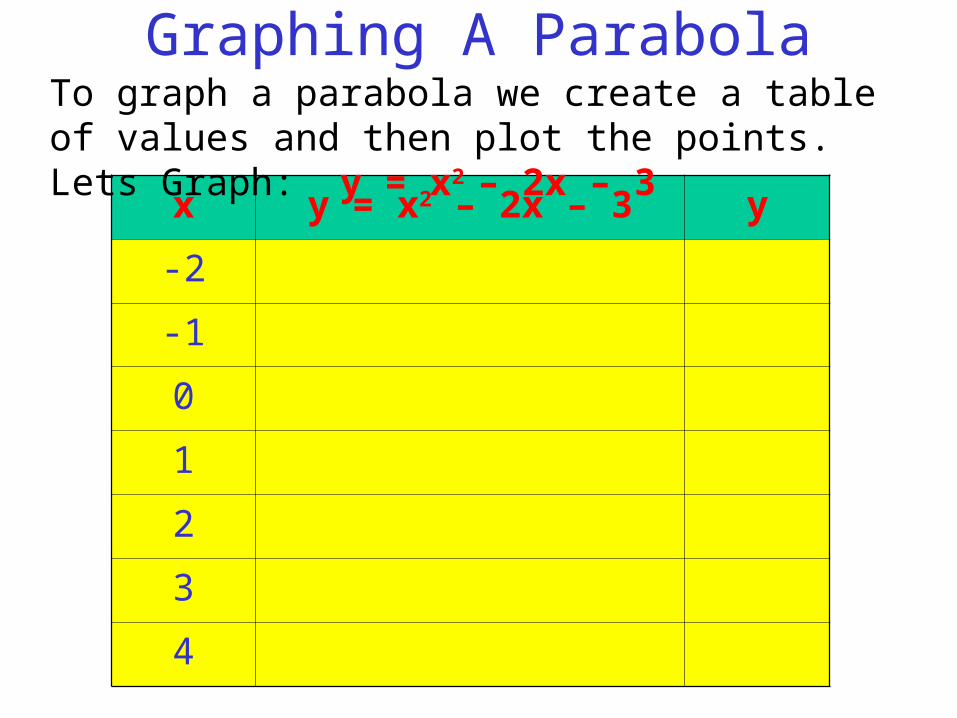
Graphing A Parabola
x y = x2 – 2x – 3 y
-2
-1
0
1
2
3
4
To graph a parabola we create a table of values and then plot the points. Lets Graph: y = x2 – 2x – 3
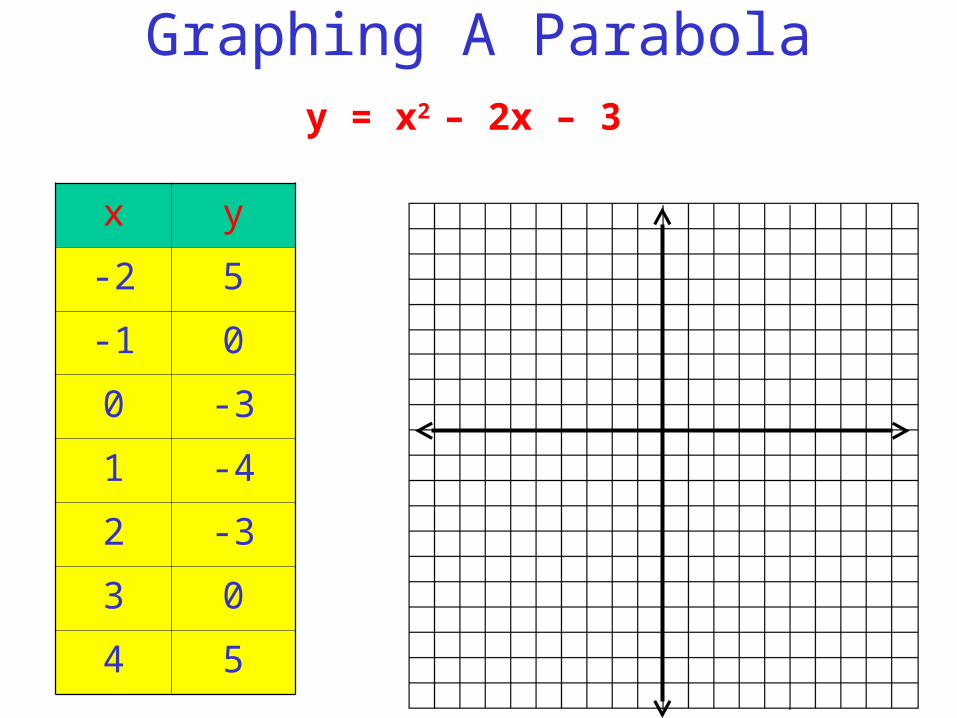
Graphing A Parabolay = x2 – 2x – 3
x y
-2 5
-1 0
0 -3
1 -4
2 -3
3 0
4 5
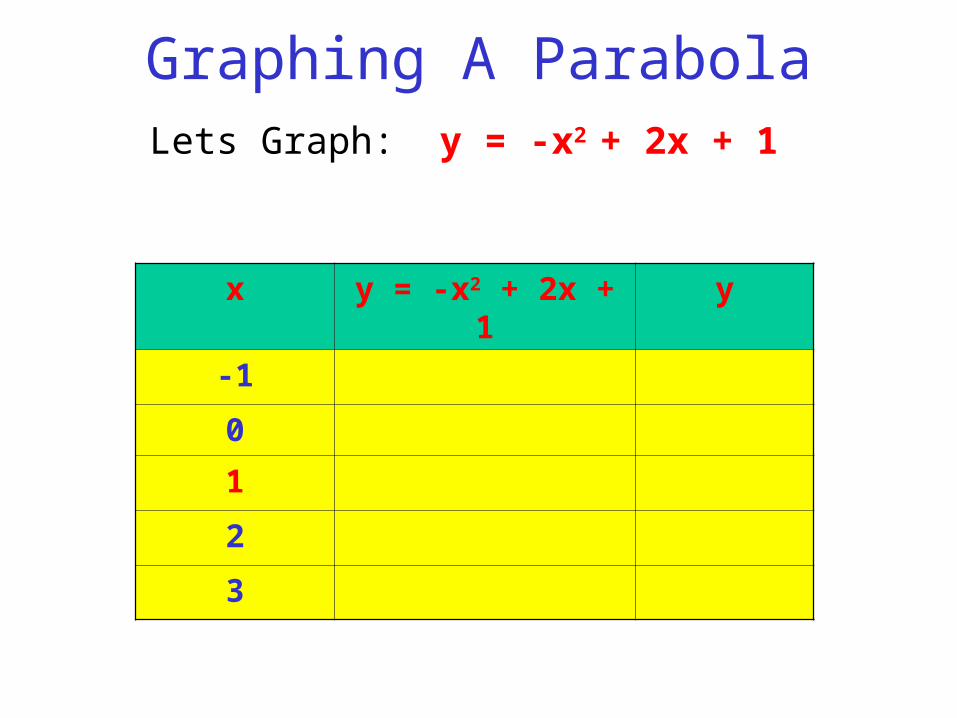
Graphing A ParabolaLets Graph: y = -x2 + 2x + 1
x y = -x2 + 2x + 1 y
-1
0
1
2
3

y = -x2 + 2x +1
x y
-1 -2
0 1
1 2
2 1
3 -2
Graph It!

Parabola CharacteristicsQuadratic Equation: y = ax2 + bx + c
– The maximum or minimum point is called the vertex.
– If a is positive the graph opens up. (Minimum)– If a is negative the graph opens down.(Maximum)– The line that divides a parabola directly in half is
called its axis of symmetry.– The axis of symmetry and vertex (turning point)
can be found using the equation
a
bx
2
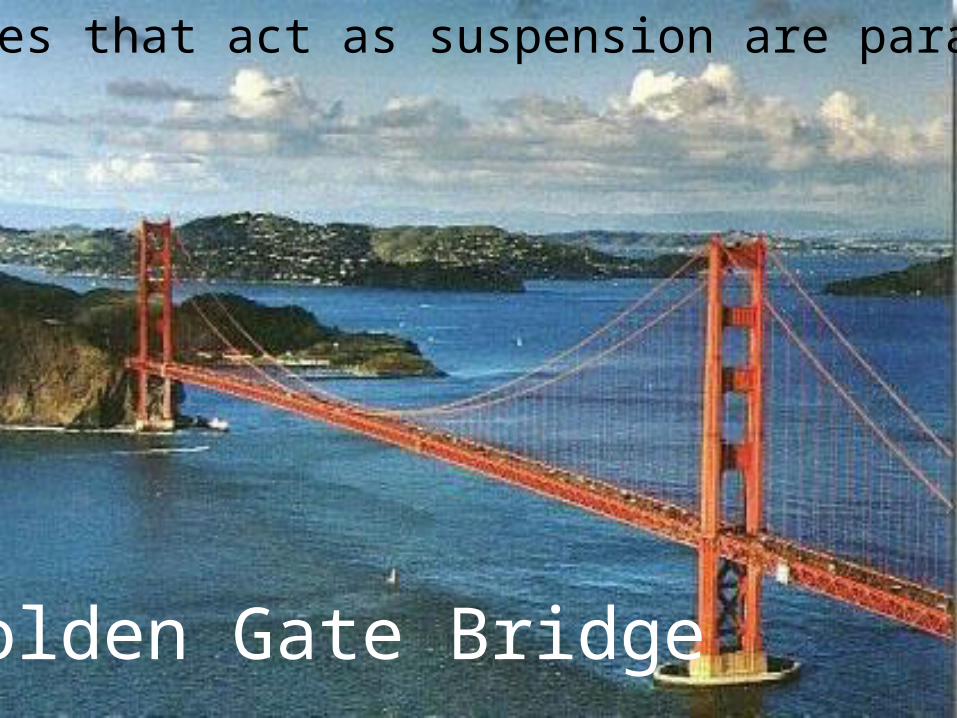
Golden Gate Bridge
The cables that act as suspension are parabolas.
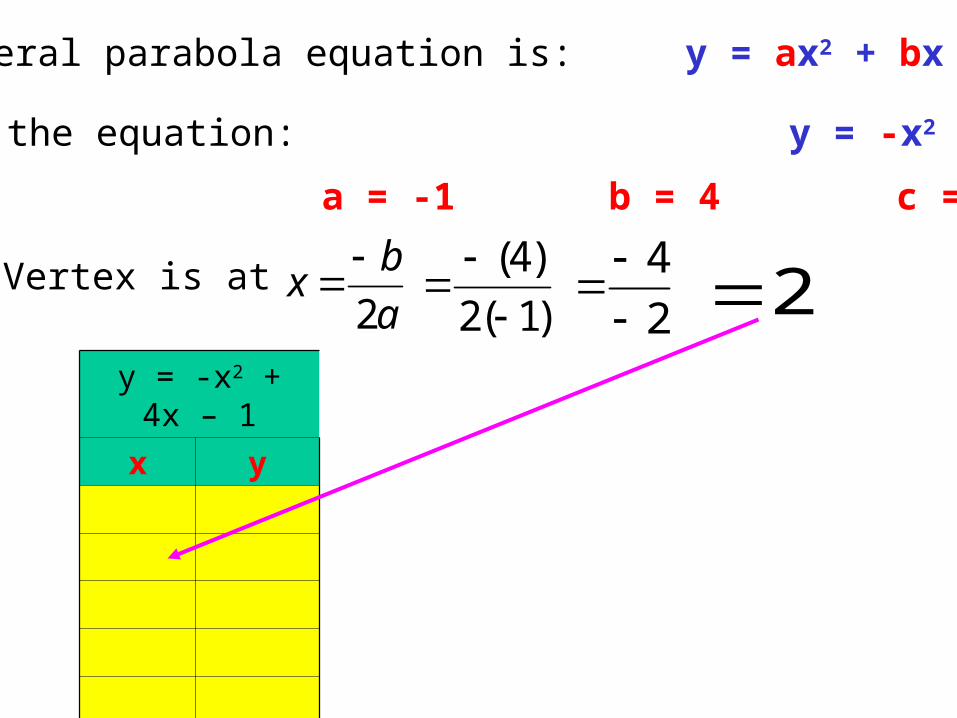
Lets look at the equation: y = -x2 + 4x – 1
a = -1 b = 4 c = -1
Vertex is at a
bx
2
y = -x2 + 4x – 1
x y
The general parabola equation is: y = ax2 + bx + c
)1(2
)4(
2
4
2

y = -x2 + 4x – 1
x y
0 -1
1 2
2 3
3 2
4 -1
Vertex?
Max or Min?
Axis of Symmetry?

Lets look at the equation: y = x2 – 2x – 8
a = 1 b = -2 c = - 8
Vertex is at a
bx
2
y = x2 – 2x – 8
x y
The general parabola equation is: y = ax2 + bx + c
)1(2
)2(
2
2 1

y = x2 – 2x – 8
x y
- 1 - 5
0 - 8
1 - 9
2 - 8
3 - 5
Vertex?
Max or Min?
Axis of Symmetry?
Homework
Graphing Parabolas Homework #1