how oracle bi publisher serves your peoplesoft reporting needs
TRANSCRIPT

Prepared by:
Session ID:
How Oracle BI Publisher Serves
Your PeopleSoft Reporting Needs
John Beretz
Senior Developer and Instructor
SpearMC Consulting
@SpearMC
101790

Agenda
• Introduction
• Reporting Tools Overview
• BI Publisher Overview
• Connected Query for Complex Reports
• Programming BI Publisher
• Questions and Answers
2

Your Presenter
• PeopleTools Technical Consultant – 12 Years
• PeopleTools Instructor – BI Publisher, Web Services, PeopleTools/PeopleCode
• Formerly a Developer at PeopleSoft – 8 Years
John Beretz Senior Developer and Instructor
866-SPEARMC x816
www.SpearMC.com
3

About SpearMC

About SpearMC Founded in 2004, SpearMC is a technology and professional services firm specializing in
PeopleSoft FSCM, HCM, ESA
PeopleTools Development and System Administration
PeopleSoft Test Framework
Oracle Cloud ERP and HCM
PeopleSoft Training
Project Management
Oracle Public Cloud
QA & Test Automation
Host Analytics EPM


Reporting Tools
Overview

The PeopleTools Reporting Family
Crystal Reports (supported pre 8.55 only)
SQR
nVision
Query
BI Publisher
PS/nVision
Crystal Reports
PS Query

Crystal Reports
• GUI Report Designer
– Drag-and-drop
– Preview look and feel
• Query used as the data source
• Support has been discontinued as of PeopleTools 8.55
• No delivered Crystal Reports as of application version 9.2

Crystal Reports
When to use it
Presentation matters
A PS Query can generate the data
But…
External migration
Non-Oracle solution
Support has ended

SQR
• Old-school procedural programming language similar to COBOL
• Data extracted using embedded SQL statements
• Character-based report formatting
• Powerful! Full database access within a "report"
• Lots of knowledge in the PeopleSoft community
• Logic can be organized into
reusable building-blocks
• Part of the Oracle family
• Built-in support for debugging
• Programmer-centric
– Quick to build and run
– Requires a technical resource

SQR
When to use it
You have lots of SQR talent
Data more important than
presentation
Report output requires complex
preprocessing
High performance requirements
But…
Buried business logic
External migration
Report layouts are hard to
create/maintain

nVision
• Power of Excel
• Excel add-in
• Allows users to leverage power of Excel
• Tightly connected to PeopleSoft data
– Ledgers
– Trees
• Matrix layout plus nPlosion provides quick access to details
• Drill-down into additional reports

nVision
When to use it
Financial/ledger data
Power users; want interactive
analysis
But…
Steep learning curve; nVision talent
is essential
Challenging setup and
maintenance

Query
• Browser-based tool for creating and executing SQL SELECTs
• Empowers business users – Solve their own problems
– Explore data
• Built-in features include – Table and row level security
– Translate descriptions
– Output to Excel
– Effective Date handling
– “In Tree” WHERE clause operator
– Embedded URLs
• Several other tools leverage Query – E.g. BI Publisher (like Crystal before it) uses Queries as data source

Query
When to use
Need tabular output
Limited IT involvement
Users want spreadsheet output
No need for fancy formatting
Query authors know the data model
But…
Ever-growing collection of
redundant and obsolete Queries
Poorly designed Queries can have
serious performance consequences

BI Publisher
• Data comes from Query, Application
Engine, or anything else that can
generate XML
• Any pre-processing done in AE
• Report layout is created using special
Microsoft Word plug-in
• Supports complex, multi-level data and
nested sections
• Leverages PeopleSoft metadata
• All pieces live in PeopleSoft
• Built on industry-standard technologies
(e.g. XSL, XML)
• Modular: built from re-usable building
blocks

BI Publisher
When to use it
Presentation matters
Simple data/output
Complex data/output
Limited IT involvement (for simple
reports)
But…
Performance issues for high
volume output
Complex formatting requires
mastery of Word
Complex reports require
programming
Report templates are easy to break
and hard to troubleshoot

BI Publisher
Overview

BI Publisher Background
• Reporting tool introduced as “XML Publisher” in PeopleTools 8.48
• Renamed to “BI Publisher” in PeopleTools 8.52
o “BI” as in “Business Intelligence”, aka “Reporting and Analytics”
• Positioned as a reporting tool that:
o Replaces Crystal
o Alternative to SQR
o Better integrated with PeopleSoft
o Architected for better maintenance and extensibility

What does a BI Publisher Report look like?
• Demo: Delivered Report List of Valid Currency Codes
1. Reporting Tools > BI Publisher > Query Report Viewer
2. Report Name: FSX0035 (List of Valid Currency Codes)
3. Click View Report link.
– Popup appears with prompts
4. Enter As Of Date: current date
5. Click OK
6. Review output
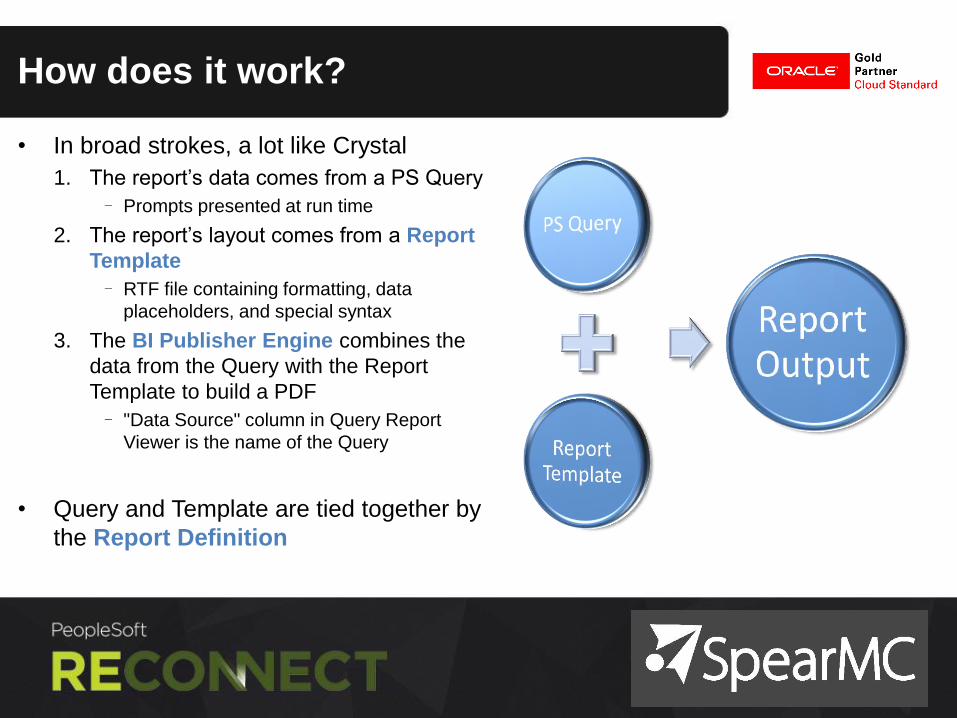
How does it work?
• In broad strokes, a lot like Crystal
1. The report’s data comes from a PS Query
– Prompts presented at run time
2. The report’s layout comes from a Report
Template
– RTF file containing formatting, data
placeholders, and special syntax
3. The BI Publisher Engine combines the
data from the Query with the Report
Template to build a PDF
– "Data Source" column in Query Report
Viewer is the name of the Query
• Query and Template are tied together by
the Report Definition

Introducing the Report Definition
• Each BI Publisher Report has a Report Definition
• Reporting Tools > BI Publisher > Report Definition
• Most important properties
o Data Source
– This is how it knows about the Query
o Template tab > Template File
– Open in Word
• Have a Query but not sure what reports use it?
o Find References link (new in 8.54)
• Demo: Delivered Report List of Valid Currency Codes
o Report Definition FSX0035
o Query FSX0035_CURRENCY_CODES
o Template FSX0035.rtf

Introducing Template Builder
• Microsoft Word is the BI Publisher design-time environment
o Instead of having Crystal installed on your machine, you need
– Microsoft Word
– Java Runtime
– Oracle’s BI Publisher Template Builder Add-In for Microsoft Word (aka “Design Helper”)
–Windows only (no Mac support)
• BI Publisher Word Add-In
o Download installer from any PeopleSoft environment!
o Reporting Tools > BI Publisher > Setup > Design Helper
o Now there's a new "BI Publisher" ribbon in Word
• Completed report templates consist of
o Standard Word Formatting (tables, text, etc.)
o Special placeholders to indicate where data should go, and more

1. Open the BI Publisher Template file
2. Import XML file containing appropriate sample data (Load Data > Sample XML) o Typically generated from Query using Download to XML link on results page
3. Test Template using Preview tool o Allows for rapid, iterative, trial-and-error report building
• Demo: Currency Codes Report Template o Run Query FSX0035_CURRENCY_CODES to XML
o Import sample XML into FSX0035.rtf
o Preview to PDF
Running Report in Template Builder

Creating a Tabular Report
• Demo: Asset Costs
1. Create a Query that returns a list of Asset Costs
– Record COST
– Include any Fields that we want to include on the report
– Criteria: ACCOUNTING_DT >= prompt value
– Save it as Public Query named Z_ASSET_COST
2. Create a sample data file
– Run the Query to XML
3. Create the template in Word
• BUSINESS_UNIT • CATEGORY
• ASSET_ID • TRANS_TYPE
• BOOK • ACCOUNTING_DT
• DEPTID • COST

• Best way to start a new report!
• Choose which fields get added to the table
• Choose Grouping options
o Grouping sorts your rows that have same value in the group field
o Grouping displays the grouping field value only once for each group
o “Group above” adds a “table break” when the value in that field changes
o “Group left” adds the group field as left-most column
• Choose Sorting options
• Demo: Creating the Asset Costs Template
Template Builder – Table Wizard

Basic Tabular Report Formatting
• Works just like Microsoft Word…because it IS Microsoft Word!
• Examples
o Add report title by typing text at top of page
o Add report date: Ribbon Insert > Text > Date & Time
o Add page numbers: Ribbon Insert > Header & Footer > Page Number
o Change column titles by directly editing text
o Change column alignment
– Select cell (hover over lower-left corner until mouse cursor is up-right arrow
– Ribbon Layout > Alignment
o Remove unwanted columns
– Select the column to delete by hovering near the top of the column until the mouse cursor
becomes a down arrow, then click
– Right-click the column and select Delete Columns
– E.g. Remove the row number column from the report

Template Builder is not dummy proof!
• Report broken?
o Deleting the Row Number column inadvertently deleted an essential BI Publisher tag
• Making changes in Word can break your report!
o The structure of the report is controlled by the tags on it
o Deleting or rearranging the report tags can have unexpected consequences
o Template Builder is not at all dummy proof!
• Recommendation:
o When editing a report template, only change one thing at a time
o Test each change before saving the template
o Periodically make sure Validate Template finds no errors
o When in doubt, undo!

Repeating Groups
• Parts of the report template that should be repeated at runtime based on data
(typically once per row of data)
• Everything between For-Each and End-for-each tags gets repeated
• Most commonly used with Word tables
o A for-each tag must be the first thing in the left-most column
o An end-for-each tag should be the last thing in the right-most column
• The Table Wizard tool automatically sets row 2 as a Repeating Group
• Adding a Repeating Group manually
1. Select the area of document to repeat (e.g. table body row)
2. Choose Insert > Repeating Group from the BI Publisher ribbon
3. Select For Each row (for more complex data sets, pick the element that represents
the “rows” to loop through)
4. Click OK

Multi-Level
Data and Reports

Tabular vs. Hierarchical Reports
• The simplest reports are tabular
o Look like simple extracts of data from a database table
o Maybe include grand totals
o Example: FSX0035 – Currency Code Report
o Queries are perfect for generating tabular data
• Most real-world reports are hierarchical
o Organized like a data model diagram
– e.g. Assets, Asset Costs, and Asset Locations
o Parent-child relationships
o Queries can’t generate this type of data
o But multiple Queries could…
Asset
(ASSET)
Asset Cost
(COST)
Asset Location
(ASSET_LOC_VW)

Connected Query and BI Publisher
• Connected Query gives you a way to “join” PS Queries that have a logical parent-child relationship
• Allows you to create XML with hierarchical data
• Can be used as a BI Publisher Data Source
• Introduced in PeopleTools 8.50
• Reporting Tools > Connected Query > Connected Query Manager
• First create PS Queries, then connect them in Connected Query
• Include key fields in each Query

Connected Query and BI Publisher
• Demo: Create an Asset Connected Query
o Name: Z_ASSETS_BY_UNIT
o Parent Query: Z_ASSET (over Record.ASSET)
o Child Query 1: Z_ASSET_LOC (over Record.ASSET_LOC_VW)
o Child Query 2: Z_ASSET_COST (over Record.COST)
Query Z_ASSET
Record ASSET • BUSINESS_UNIT • ASSET_ID • ASSET_TYPE • DESCR • ACQUISITION_DT • ASSET_CLASS • MANUFACTURER • MODEL • SERIAL_ID
Query Z_ASSET_LOC
Record ASSET_LOC_VW • BUSINESS_UNIT • ASSET_ID • LOCATION • AREA_ID
Record LOCATION_TBL • DESCR • COUNTRY • CITY • STATE
Asset
(ASSET)
Asset Cost
(COST)
Asset Location
(ASSET_LOC_VW)
✓

Creating a Connected Query
1. Create PS Queries that will be part of Connected Query
o Include key fields in each Query
2. Go to Connected Query Manager: Reporting Tools > Connected Query > Connected Query Manager > Add a New Value
3. Name the new Connected Query
4. Add Top-Level “Parent Query” to new Connected Query definition
5. Add descendent Queries
a. Click name of a Query to display tool icons
b. Use Child and Sibling icons
6. “Join” each child Query to parent
o Click Select Related Fields, check fields, click Map Fields
7. Set Status to “Active”
8. Click Save button to save the Connected Query
9. Use Preview to test
✓

Connected Query and BI Publisher
• Query Prompts
o Supported for all Queries in a Connected Query
o User prompted at run/schedule time
o Recommendation: When possible, only use with top-level Query
o Queries with In-Tree prompt cannot be used in Connected Query
• Advantages
o Leverage existing Queries (Query reuse)
o Easier to develop and maintain
– Multiple bite size Queries instead of one, big, complex one
– Alternative to outer joins
o Very different data sets can be included in same report
o Alternative to creating an App Engine to generate XML for BI Publisher
• Disadvantages
o Performance not great with large amounts of data

Connected Query and BI Publisher
• Generating Sample XML for Template Builder
o Option 1: Use Preview in Connected Query Viewer or Connected Query Manager
– Must specify upper limit on number of rows
– Do save-as on XML file that gets opened in browser
o Option 2: Schedule Connected Query
– Reporting Tools > Connected Query > Schedule Connected Query
– Also available from Connected Query Viewer / Manager search results
– Create run control specifying Connected Query name and parameter values
– Exports complete results to XML file
– Retrieve XML file from Process Monitor View Log/Trace
• Demo: Connected Query Sample XML
o Create an XML File containing a large data sample from your Connected Query using
Preview in Connected Query Viewer/Manager

Building Templates with Multi-Level XML
• Typically end up with one Repeating Group for each Query in a Connected Query
• Word Tables can be nested
o Put cursor in a cell (a cell big enough to hold a table; use Word’s cell merge)
o Use Table Wizard > Table
o Adds complexity, so use with caution! Overuse can become confusing to maintain, ugly
for end users, and can even break BI Publisher. Simple is best!
• The repeating portion of a Word table can be more than one row
o For-Each tag in upper left cell of region
o End-For-Each tag in lower right cell of region
o Useful for form-style appearing beneath each row of parent data
• Repeating data is NOT limited to Word tables

Building Templates with Multi-Level XML
• Demo: Connected Query Based Report
o Build a new BI Publisher report
o Template Name: Z_ASSETS_BY_UNIT.rtf
o Use Connected Query (and sample XML file) from previous example

Building Templates – Tips
• Use the Word Table Tools ribbons o Only visible if cursor is in a table
o Central location for all table formatting tools
• Explore Word Table Properties o Available on right-click when cursor in
a table
o Advanced, precise control over table/row/column/cell sizing
o Example: Allows you to control padding at cell level
• Not getting formatting you expected? o Try Previewing to RTF
o Sometimes is easier to troubleshoot than a PDF because you can see the table borders and special characters

Programming
BI Publisher

• BI Publisher templates are computer programs in disguise!
• Form Field Tags inserted by the BI Publisher ribbon tools contain code
o Code is on BI Publisher Properties > Advanced tab
o This is the code that actually runs when the report gets generated
o BI Publisher ribbon tools are “code generators”
• This code can be edited!
o Once code is edited, “Properties” tab may become read-only
• See XDOUserGuide.pdf (Chapter 17) installed with the Word plug-in
o Note: Most of this document is not applicable to PeopleSoft!
BI Publisher Template Syntax

BI Publisher Template Syntax
• Command syntax
o <?command: expression?> …
<?end command?>
o Functionality depends on the
command
• Display expression syntax
o <?expression?>
o Displays the result of the expression
• Comments o Standard XML style (<!-- and -->)
• Data Types
o String, Number, Logical, Node Set
• Logical operators
o and, or, =, !=, etc.
• Looping (“Repeating Groups”)
o <?for-each:nodeSetExpression?>…
<?end for-each?>
• Conditional (“Conditional Regions”)
o <?if:logicalExpression?>…<?end if?>
• Choose command
<?choose:?>
<?when:logicalExpression1?> …
<?end when?>
<?when:logicalExpression2?> …
<?end when?>
…
<?otherwise:?>…<?end otherwise?>
<?end choose?>

BI Publisher Template Syntax
• Most of the supported BI Publisher functionality is not even available through the
BI Publisher ribbon!
o The appropriate syntax must be coded manually
• Demo
o Modify report so that asset costs meeting the following criteria appear in red
1. Have cost > $50,000
2. Belong to Business Unit BLG01
• What happened?
o BIP ribbon Conditional Format tool only supports logic on a single field
• Solution
<?if:number(A.COST)>50000 and A.BUSINESS_UNIT='BLG01'?> <?attribute@incontext:color;'red'?> <?end if?>

BI Publisher Template Syntax
• Demo
o Modify report so that asset costs meeting the following criteria appear in red
1. Have cost > $50,000
2. Belong to Business Unit BLG01
3. Belong to an asset with an Asset Type of 020
• What happened?
✓ ✓

BI Publisher Expressions: XPath
• BI Publisher ribbon only supports references to data at same or lower level
• Example: Conditional expression cannot reference field in parent Query
• BI Publisher expressions use XPath syntax
• Industry standard language for precisely specifying subset of data in XML file
• Like file system paths but use XML element/node names instead of folder names
• Expressions are relative to “current node”, i.e. the XML element the for-each is on
• XPath expression syntax includes:
• Use Insert > Field tool to see structure of your data
target Elements tagged as target that are descendants of current node (BIP default)
.//target Same as above
./target Values of elements tagged as target that are children of the current node
../target Siblings of the current node tagged as target
//target Elements tagged as target anywhere in XML

BI Publisher Template Syntax
• Demo
o Modify report so that asset costs meeting the following criteria appear in red
1. Have cost > $50,000
2. Belong to Business Unit BLG01
3. Belong to an asset with an Asset Type of 020
• What happened?
o Plain field references in XPath assume field is at or below current level
o A.ASSET_TYPE is at parent level
• Solution
o Use XPath expression ../A.ASSET_TYPE
✓ ✓

XPath Node Set Predicates
• Predicates
o Syntax for adding data filtering to an XPath node set expression
o Enclosed in square brackets
o Consist of a logical expression
o Only elements passing that test are included in final XPath result
o Similar to a SQL WHERE clause
• Examples, from this business unit level
o All the asset cost field values
./Z_ASSET/Z_ASSET_COST/A.COST
o All the asset cost field values associated with department 50000
./Z_ASSET/ZZZ_ASSET_COST[./A.DEPTID="50000"]/A.COST
o All the type 010 asset cost amounts associated with department 50000
./Z_ASSET[./A.ASSET_TYPE="010"]/ZZZ_ASSET_COST[./A.DEPTID="50000"]/A.COST

XPath Node Set Predicates
• Demo: Totals and XPath Predicates
o Add a subtotal to the business unit level that shows the total asset cost for assets of
type 020.
o Example:
BLG01 Total for 020 Assets: $1,025,954.50

Tuesday, July 18 @ 10:15 – 11:15 am
• PeopleSoft on Oracle Public Cloud
• Session ID: 101690
• Presented by David Pigman
• Location: Paris
Wednesday, July 19 @ 8:00 – 9:00 am
• PeopleSoft Clear Benefits (eBenefits)
• Session ID: 101810
• Presented by John Beretz
• Location: Tegal
Wednesday, July 19@ 9:15 – 10:45 am
• How Oracle BI Publisher Serves Your
PeopleSoft Reporting Needs
• Session ID: 101790
• Presented by John Beretz
• Location: International Ballroom F
Wednesday, July 19 @ 11:15 am – 12:15 pm
• Powerful PeopleSoft Composite & Connected Query
• Session ID: 101710
• Presented by Randy Johnson
• Location: Narita AB
Wednesday, July 19 @ 1:30 – 2:30 pm
• Extending PeopleSoft WorkCenters
• Session ID: 101730
• Presented by Randy Johnson
• Location: International Ballroom E
Wednesday, July 19 @ 4:30 – 5:30 pm
• PeopleSoft Mobile Expenses – your modern, fluid
expense management and reporting tool
• Session ID: 101700
• Presented by Randy Johnson
• Location: International Ballroom F
SpearMC Presentations at Reconnect

Session ID:
Please complete the session evaluation 101790
