how persistent is the impact of market timing on capital...
TRANSCRIPT

THE JOURNAL OF FINANCE • VOL. LXI, NO. 4 • AUGUST 2006
How Persistent Is the Impact of MarketTiming on Capital Structure?
AYDOGAN ALTI∗
ABSTRACT
This paper examines the capital structure implications of market timing. I isolate tim-ing attempts in a single major financing event, the initial public offering, by identify-ing market timers as firms that go public in hot issue markets. I find that hot-marketIPO firms issue substantially more equity, and lower their leverage ratios by more,than cold-market firms do. However, immediately after going public, hot-market firmsincrease their leverage ratios by issuing more debt and less equity relative to cold-market firms. At the end of the second year following the IPO, the impact of markettiming on leverage completely vanishes.
EQUITY MARKET TIMING IS ONE OF THE PRIMARY FACTORS that shape corporate fi-nancing decisions. A large body of work documents the tendency of firms toissue equity when the cost of equity capital appears to be temporarily low. Theevidence is convincing. Studies on market valuations around equity issues arecomplemented by other findings such as the long-run underperformance of is-suers and by survey results of managers (see Sec. I for a detailed review ofprior evidence on market timing). While the collective evidence makes a strongcase for the presence of market timing attempts, quantifying their impact onfinancing activity is difficult. Most direct tests of market timing are based onthe positive relationship between firms’ market valuations and their equityissues. However, a host of other factors that affect financing policy are likelyto contribute to this relationship. For example, firms with growth opportuni-ties, which typically have high market values relative to book assets, may userelatively more equity financing to maintain financial flexibility. Answeringquantitative questions about market timing requires a market timing measurethat is not so closely tied to other determinants of financing policy.
A research question that has recently received considerable attention is thelong-term impact of market timing on capital structure. The importance ofthis issue cannot be overstated: if true, high persistence of market timing ef-fects would imply very loose leverage targets, suggesting a minimal role fortraditional determinants of capital structure. In their influential study, Bakerand Wurgler (2002) raise the persistence question and offer a striking answer.
∗University of Texas at Austin. I would like to thank Andres Almazan, Rick Green, CharlieHadlock, Burton Hollifield, Jay Ritter, Ronnie Shah, Sheridan Titman, Jeffrey Wurgler, an anony-mous referee, and the seminar participants at the 2004 Texas Finance Festival, 2005 AFA meetings,and University of Virginia for their helpful comments and suggestions.
1681

1682 The Journal of Finance
Identifying market timers as those firms that have a history of raising capitalat high market-to-book ratios, Baker and Wurgler find persistent timing effectson leverage that extend beyond 10 years. However, their market timing mea-sure is subject to the same criticism that applies to previous studies. A historyof concurrent increases in external funding needs and the market-to-book ratiois likely to proxy for underlying firm characteristics, most notably the long-term growth traits, that dictate low optimal leverage ratios. To the extent thatcontemporaneous control variables are noisy proxies for these characteristics, aspurious relation between history and capital structure may obtain. The need toisolate market timing is especially important in analyzing its long-term effectson leverage.
In this paper, I focus on a single financing event, the initial public offering,in an attempt to capture market timing and its impact on capital structure.The IPO market constitutes a natural laboratory to analyze market timing fora number of reasons. First, going public is arguably the single most importantfinancing event in the life of a public firm. Therefore, the payoff from correctlytiming the IPO, whether real or as perceived by the issuer, is potentially quitehigh. Second, investors face more uncertainty and a higher degree of asymmet-ric information when valuing IPO firms than they face in the case of maturepublic companies. Hence, IPOs offer more room for misvaluation, which is atthe root of timing considerations. Third, and most important, timing attemptsare nowhere more apparent than in the IPO market. Perhaps as a result of thefirst two reasons suggested above, cycles in IPO volume are much more pro-nounced and pervasive than cycles for other types of financing activity.1 Hence,the IPO sample is likely to be highly revealing of pure market timing motivesthat are distinct from long-range financing policy requirements.
My measure of market timing is direct and very simple: whether the IPOtakes place in a hot issue market, characterized by high IPO volume in termsof the number of issuers, or a cold issue market. The rationale is as follows. Ifissuers regard hot markets as windows of opportunity with a temporarily lowcost of equity capital, they should react by issuing more equity than they wouldotherwise do. Conversely, cold-market IPOs are likely to keep their equity issuesto a necessary minimum, as market conditions are less favorable than average.Accordingly, I attempt to capture this market timing behavior by linking theamount of equity an IPO firm issues to whether the market is hot or cold atthe time of its offering. Quantifying market timing attempts this way has theadvantage of not picking up firm-level characteristics; the timing measure isinstead a function of market conditions. If there is a significant hot-marketeffect on equity issues, it is likely to depress the leverage ratio in the short run.The main question of interest is whether the impact persists, that is, whetherhot-market firms continue to exhibit low leverage ratios in years subsequentto their IPOs.
1 Ibbotson and Jaffe (1975), Ritter (1984), and Ibbotson, Sindelar, and Ritter (1988, 1994) docu-ment the sharp hot–cold market cycle in IPOs. Helwege and Liang (2004) show that hot marketsattract firms from a variety of industries with different characteristics.

The Impact of Market Timing on Capital Structure 1683
I find a substantial hot-market effect on the amount of equity issued by IPOfirms. The average cold-market firm’s IPO proceeds amount to 54% of its pre-IPO asset value. The same ratio for the average hot-market firm is 76%, a 40%increase over cold markets. More important, the hot-market effect is almostcompletely orthogonal to other factors that are known to affect equity issues.The difference in the equity issue amounts of hot- and cold-market firms re-mains virtually the same in size and statistical significance after controllingfor industry effects and various firm characteristics that previous studies iden-tify as important determinants of financing policy. Thus, focusing directly onmarket conditions proves to be highly effective in isolating the timing behavior.
Further findings support this view. Hot- and cold-market firms do not dif-fer in their pre-IPO leverage levels, so avoiding financial distress is not thelikely cause of issuing more equity in hot markets. Differences in growth char-acteristics do not explain the hot-market effect either; if anything, hot-marketfirms invest less than their cold-market counterparts in the IPO year, and theyinvest in similar ways in subsequent years. The additional equity hot-marketfirms issue mainly adds to their cash balances. This is consistent with the ideathat market timers issue more equity than their capital needs dictate. The twogroups of issuers also differ in their profitability rates. Hot markets seem toattract relatively low-profitability firms, which may find it difficult or too riskyto go public at times of low IPO activity.2
Surprisingly, there is a substantial difference in the IPO-year dividend payoutratios of hot- and cold-market firms. As one would expect, IPO firms have no orvery low dividend payout for several years after going public; the same is truefor most cold-market issuers in the IPO year as well. The exception is a sizeablefraction of hot-market firms that pay their pre-IPO shareholders large specialdividends financed out of the IPO proceeds. This finding reflects the issuers’perception of hot markets as windows of opportunity that allow shareholdersto liquidate their positions relatively easily.
After establishing the hot–cold market classification as a timing measure, Iturn to the capital structure implications of market timing. Not surprisingly,market timing depresses leverage in the very short run. While leverage ratiosdecline substantially at the time of an IPO in both hot and cold markets, thedecline is significantly larger for hot-market firms. After controlling for firmand industry characteristics, hot-market firms appear to be about 3.7 percent-age points more underleveraged than cold-market firms as of the end of theIPO year.
The negative impact of market timing on leverage has very low persistence.One year after an IPO, less than one-half of the effect remains. Two years afterthe IPO, the hot-market effect is completely reversed. Hence, market timingappears to have only a short-term impact on capital structure. An analysisof financing activity in these 2 years reveals that hot-market firms follow anactive policy of reversing the timing effect on leverage, whereas cold-market
2 The leverage ratios of hot-market firms could potentially increase in the post-IPO period dueto low profitability. Section III.D below considers this possibility.

1684 The Journal of Finance
issuers are more content with the leverage ratios they attain at the IPO, notsignificantly changing leverage thereafter. Both debt and equity issues accountfor this reversal, with hot-market firms issuing significantly more debt and lessequity relative to their cold-market counterparts. At the end of the second yearafter the IPO, hot- and cold-market firms become indistinguishable in theirleverage ratios. Accordingly, differences in equity and debt issuance activitydisappear from that point onwards.
Overall, the results are consistent with a modified version of the traditionaltrade-off view on capital structure, one that includes market timing as a short-term factor. Market timing plays a very important role in shaping financingactivity and as a result leads to short-term deviations from leverage targets.However, these deviations quickly reverse, suggesting that the tradeoffs under-lying the targets have non-negligible effects on firm value. The results do notsupport the view in Baker and Wurgler (2002) that capital structure is largelythe cumulative outcome of past attempts to time the equity market.
The remainder of the paper is organized as follows. Section I provides anoverview of prior research on market timing. Section II describes the data. Theempirical analyses of market timing and its impact on capital structure arepresented in Section III. Section IV concludes.
I. Measures of Market Timing
Evidence for market timing comes from a variety of different sources. Start-ing with Taggart (1977), several studies demonstrate the tendency of firms toissue equity when their market valuations are high relative to book valuesor past market values.3 This line of research utilizes forward-looking markettiming measures. As discussed above, however, proper interpretation of thefindings is made difficult by the confounding effects of other determinants offinancing policy. An alternative approach to detecting overvalued equity salesis to analyze the subsequent stock return performance of issuers. Ritter (1991)and Loughran and Ritter (1995) document that IPOs and seasoned equity is-sues underperform their benchmarks in the long run. Underperformance ismore pronounced for hot-market IPOs (Ritter (1991)) and the IPOs of firmsfor which analysts initially forecast high growth (Rajan and Servaes (1997)).These findings provide further justification for focusing on hot–cold marketdifferences to capture timing effects.4 Finally, survey evidence in Graham andHarvey (2001) reveals that market timing is a primary concern of corporate
3 Market timing is detected on the basis of the past stock returns in the earlier studies of Taggart(1977), Marsh (1982), Jalilvand and Harris (1984), and Asquith and Mullins (1986). More recentstudies such as Rajan and Zingales (1995), Jung, Kim, and Stulz (1996), Pagano, Panetta, andZingales (1998), and Hovakimian, Opler, and Titman (2001) focus on the market-to-book ratio tocapture timing attempts.
4 It should be emphasized, however, that the current analysis does not make use of any post-issue information in identifying market timers. It may also be the case that a positive payoff totiming exists only in the perception of issuers. Therefore, my focus is on the identification, not thesuccess, of market timing attempts.
The Impact of Market Timing on Capital Structure 1685
executives: CFOs admit that timing considerations play a very important rolein their financing decisions.
Given their emphasis on the persistence of timing effects, Baker and Wurgler(2002) attempt to capture market timing by focusing on the historical market-to-book time series. Specifically, their timing measure is a weighted average ofthe firm’s past market-to-book ratios, where the weights are the past amountsof external capital raised by the firm. The idea is to identify as market timersthose firms that raise most of their capital at high market valuations. Baker andWurgler show that their historical timing variable predicts current and futureleverage ratios. To prevent a spurious link due to correlation between the timingmeasure and investment opportunities, Baker and Wurgler detect this predic-tive power in regressions that control for the market-to-book ratio at the timeleverage is observed. However, this control is likely to be very noisy. In additionto growth prospects, the market-to-book ratio is affected by a number of otherfactors, such as the current state of the economy or the capital intensivenessof the firm’s technology. As a result, two firms with identical market-to-bookratios may differ substantially in their growth potential. If one of these firmshas a repeat history of raising capital at high market-to-book ratios, it is morelikely to be a growth firm, as the past financing activity is consistent with agrowth trend. Even if the firm’s current investment prospects are dim, such afirm may keep its leverage ratio low in order to maintain financial flexibilityfor the future.
In recent work, Kayhan and Titman (2006) also make the point that the sig-nificance of the historical market-to-book series in leverage regressions may bedue to the noise in the current market-to-book ratio. Specifically, Kayhan andTitman decompose the external finance weighted average market-to-book ratiointo the mean market-to-book ratio and the covariance between the market-to-book ratio and the financing deficit. They show that the persistence result ofBaker and Wurgler is mainly driven by the persistence of the average market-to-book ratio rather than the covariance between the market-to-book ratio andthe financing deficit. Similarly, Leary and Roberts (2005) argue against his-tory effects by providing evidence that firms attempt to rebalance leverage tostay within an optimal range. Developing a different line of criticism, Hennessyand Whited (2004) question the interpretation, rather than the robustness, ofhistory effects on capital structure. Hennessy and Whited (2004) show that a dy-namic trade-off model with no market timing opportunities is able to replicatethe empirically observed link between the historical market-to-book series andcurrent leverage. In their model, a high market-to-book firm finances growthwith equity to avoid financial distress. Once profitable, such a firm finds a lever-age increase unattractive for personal tax reasons, as issuing debt necessitatesincreasing payout to equity holders.
By identifying hot-market IPO firms as market timers, this paper attempts toavoid the concerns surrounding the use of the market-to-book ratio. There aretwo versions of the market timing hypothesis that appear in previous studies—the idea that hot markets reflect timing attempts is consistent with both. Thefirst version of the hypothesis obtains under time-varying mispricing in the

1686 The Journal of Finance
equity market. Whether real or perceived to be present only by the issuer, theopportunity to sell overvalued stock induces firms to use more equity capitalthan usual. Under this interpretation, hot markets are periods of high marketvaluations relative to fundamentals, at least from the viewpoint of the firms,and this leads to a clustering of equity issues. The second version of markettiming is based on the adverse selection problem of Myers and Majluf (1984)extended to a dynamic framework. Lucas and McDonald (1990) and Korajczyk,Lucas, and McDonald (1992) examine the timing of equity issues when adverseselection costs vary across both firms and time. In these analyses, investorsand managers are rational, but timing opportunities arise nevertheless as thedegree of asymmetric information changes. Under this interpretation, hot mar-kets correspond to periods of low adverse selection costs.5
The hot–cold market classification clearly does not capture the full extentof market timing. While both systematic and idiosyncratic valuation factorsaffect firms’ timing decisions, clustering of issuance activity is more likely tobe related to the former set of factors. Furthermore, one could argue that tim-ing is an important consideration even for cold-market IPOs, and hence thehot-market activity represents only an incremental aspect of market timing. Itshould be emphasized, however, that the primary objective of the paper is toanalyze market timing in a setting that is isolated from the confounding effectsof other determinants of financing policy. In this regard, the hot–cold mar-ket classification serves as an instrument for the more general market timingphenomenon.
Potentially, measuring market timing through hot-market clustering couldbe subject to concerns similar to those that arise for measures based on marketvaluations, though possibly to a lesser extent. For example, hot-market firmsmay have high growth potential that is not fully reflected by widely used con-trol variables for target leverage. Prior evidence shows that this is not likelyto be a concern; there are few differences in the operating characteristics ofhot- versus cold-market firms (Helwege and Liang (2004)). Nevertheless, theanalysis below evaluates alternative hypotheses in this regard and providescomparative results for the hot-market–based and the market-to-book–basedidentifications of market timers.
II. Data
A. Sample Construction and Summary Statistics
The initial sample consists of all IPOs between January 1, 1971, andDecember 31, 1999, reported by the Securities Data Company (SDC). I restrictthe sample to exclude spinoffs, unit offers, financial firms with SIC codes be-tween 6000 and 6999, and firms with book values of assets below $10 millionin 1999 dollars at the end of the IPO year. I further restrict the sample to those
5 Loughran and Ritter (1995) compare these two explanations for market timing and favor theone based on mispricing. They argue that there is too little time variation in adverse selection coststo induce the observed timing behavior.
The Impact of Market Timing on Capital Structure 1687
firms for which COMPUSTAT data are available for the last fiscal year beforethe IPO.6 Firms are included in the sample until the first year in which theyexit COMPUSTAT. The data end with fiscal year 2002. Firm-year observationsthat are outliers with regard to various firm characteristics are dropped; theserestrictions are described below.7
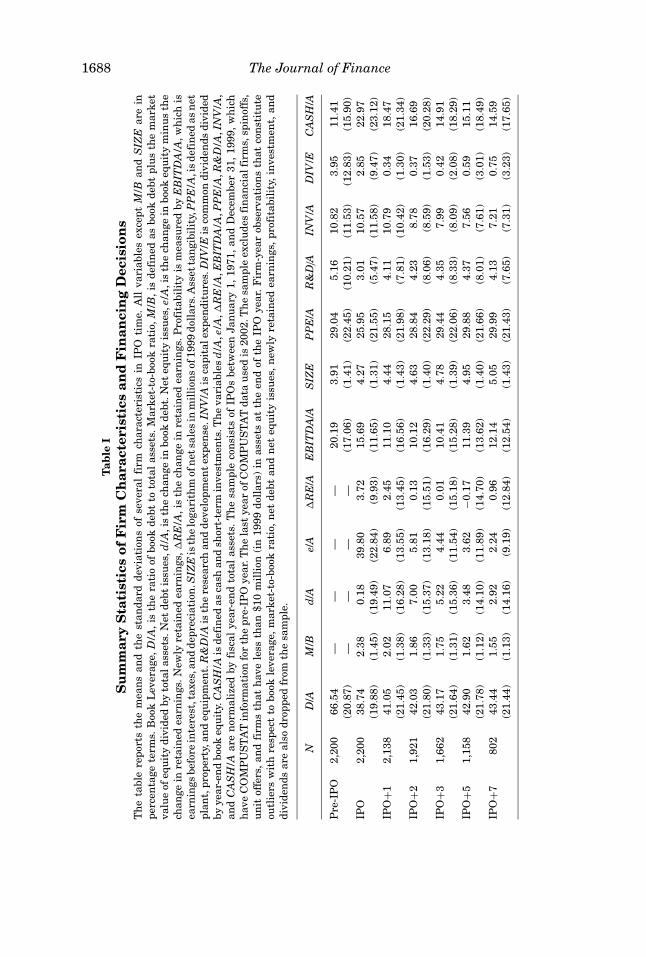
Variable definitions are as follows. Book debt, D, is defined as total liabilities(COMPUSTAT Annual Item 181) and preferred stock (Item 10, replaced by theredemption value of preferred stock (Item 56) when missing) minus deferredtaxes (Item 35) and convertible debt (Item 79). Book equity, E, is total assets(Item 6) minus book debt. Book leverage, D/A, is then defined as book debtdivided by total assets. Firm-year observations such that book leverage exceeds100% are dropped. Market-to-book ratio, M/B, is book debt plus market equity(common shares outstanding (Item 25) times share price (Item 199)) dividedby total assets. As in Baker and Wurgler (2002), I drop observations for whichM/B exceeds 10.0.
Net debt issues, d/A, is the change in book debt. Net equity issues, e/A, is thechange in book equity minus the change in retained earnings (Item 36). Newlyretained earnings, �RE/A, is the change in retained earnings. Profitability ismeasured by EBITDA/A, which is earnings before interest, taxes, and depre-ciation (Item 13). SIZE is the logarithm of net sales (Item 12) in millions of1999 dollars. Asset tangibility, PPE/A, is defined as net plant, property, andequipment (Item 8). R&D/A is research and development expense (Item 46, re-placed by zero when missing). In regression analyses below, a dummy variableRDD takes the value of one when Item 46 is missing. INV/A denotes capitalexpenditures (Item 128). DIV/E is common dividends (Item 21) divided by year-end book equity. CASH/A is defined as cash and short-term investments (Item1). The variables d/A, e/A, �RE/A, EBITDA/A, PPE/A, R&D/A, INV/A, andCASH/A are normalized by fiscal year-end total assets. I drop firm-year obser-vations for which d/A, e/A, �RE/A, EBITDA/A, INV/A, or DIV/E exceed 100%in absolute value.
Table I summarizes firm characteristics and financing decisions. All vari-ables except M/B and SIZE are expressed in percentage terms. The analysisis conducted in IPO time. I define the IPO year as the fiscal year in which theIPO takes place. Year IPO + k is then the kth fiscal year after the IPO. Thepatterns displayed in Table I are consistent with findings in previous studies.Book leverage declines substantially in the IPO year, and slightly increasesthereafter. Size increases with age, whereas the investment rate and market-to-book ratio decrease. As documented by Jain and Kini (1994) and Mikkelson,Partch, and Shah (1997), there is a significant reduction in profitability aroundthe IPO year. Cash balances double with the infusion of new capital in the IPOyear, and steadily decline in subsequent years.
6 The requirement of pre–IPO-year COMPUSTAT data may potentially cause a selection bias.However, this data is available for most of the firms that meet the book assets screen.
7 The final sample is almost identical to that used by Baker and Wurgler (2002). The onlydifference is that their sample starts in 1968.
1688 The Journal of Finance
Tab
leI
Su
mm
ary
Sta
tist
ics
ofF
irm
Ch
arac
teri
stic
san
dF
inan
cin
gD
ecis
ion
sT
he
tabl
ere
port
sth
em
ean
san
dth
est
anda
rdde
viat
ion
sof
seve
ral
firm
char
acte
rist
ics
inIP
Oti
me.
All
vari
able
sex
cept
M/B
and
SIZ
Ear
ein
perc
enta
gete
rms.
Boo
kL
ever
age,
D/A
,is
the
rati
oof
book
debt
toto
tal
asse
ts.M
arke
t-to
-boo
kra
tio,
M/B
,is
defi
ned
asbo
okde
btpl
us
the
mar
ket
valu
eof
equ
ity
divi
ded
byto
tala
sset
s.N
etde
btis
sues
,d/A
,is
the
chan
gein
book
debt
.Net
equ
ity
issu
es,e
/A,i
sth
ech
ange
inbo
okeq
uit
ym
inu
sth
ech
ange
inre
tain
edea
rnin
gs.N
ewly
reta
ined
earn
ings
,�R
E/A
,is
the
chan
gein
reta
ined
earn
ings
.Pro
fita
bili
tyis
mea
sure
dby
EB
ITD
A/A
,wh
ich
isea
rnin
gsbe
fore
inte
rest
,tax
es,a
nd
depr
ecia
tion
.SIZ
Eis
the
loga
rith
mof
net
sale
sin
mil
lion
sof
1999
doll
ars.
Ass
etta
ngi
bili
ty,P
PE
/A,i
sde
fin
edas
net
plan
t,pr
oper
ty,a
nd
equ
ipm
ent.
R&
D/A
isth
ere
sear
chan
dde
velo
pmen
tex
pen
se.I
NV/
Ais
capi
tale
xpen
ditu
res.
DIV
/Eis
com
mon
divi
den
dsdi
vide
dby
year
-en
dbo
okeq
uit
y.C
AS
H/A
isde
fin
edas
cash
and
shor
t-te
rmin
vest
men
ts.T
he
vari
able
sd/
A,e
/A,�
RE
/A,E
BIT
DA
/A,P
PE
/A,R
&D
/A,I
NV
/A,
and
CA
SH
/Aar
en
orm
aliz
edby
fisc
alye
ar-e
nd
tota
las
sets
.Th
esa
mpl
eco
nsi
sts
ofIP
Os
betw
een
Jan
uar
y1,
1971
,an
dD
ecem
ber
31,1
999,
wh
ich
hav
eC
OM
PU
ST
AT
info
rmat
ion
for
the
pre-
IPO
year
.Th
ela
stye
arof
CO
MP
US
TA
Tda
tau
sed
is20
02.T
he
sam
ple
excl
ude
sfi
nan
cial
firm
s,sp
inof
fs,
un
itof
fers
,an
dfi
rms
that
hav
ele
ssth
an$1
0m
illi
on(i
n19
99do
llar
s)in
asse
tsat
the
end
ofth
eIP
Oye
ar.F
irm
-yea
rob
serv
atio
ns
that
con
stit
ute
outl
iers
wit
hre
spec
tto
book
leve
rage
,mar
ket-
to-b
ook
rati
o,n
etde
btan
dn
eteq
uit
yis
sues
,new
lyre
tain
edea
rnin
gs,p
rofi
tabi
lity
,in
vest
men
t,an
ddi
vide
nds
are
also
drop
ped
from
the
sam
ple.
ND
/AM
/Bd
/Ae/
A�
RE
/AE
BIT
DA
/AS
IZE
PP
E/A
R&
D/A
INV
/AD
IV/E
CA
SH
/A
Pre
-IP
O2,
200
66.5
4—
——
—20
.19
3.91
29.0
45.
1610
.82
3.95
11.4
1(2
0.87
)—
——
—(1
7.06
)(1
.41)
(22.
45)
(10.
21)
(11.
53)
(12.
83)
(15.
90)
IPO
2,20
038
.74
2.38
0.18
39.8
03.
7215
.69
4.27
25.9
53.
0110
.57
2.85
22.9
7(1
9.88
)(1
.45)
(19.
49)
(22.
84)
(9.9
3)(1
1.65
)(1
.31)
(21.
55)
(5.4
7)(1
1.58
)(9
.47)
(23.
12)
IPO
+12,
138
41.0
52.
0211
.07
6.89
2.45
11.1
04.
4428
.15
4.11
10.7
90.
3418
.47
(21.
45)
(1.3
8)(1
6.28
)(1
3.55
)(1
3.45
)(1
6.56
)(1
.43)
(21.
98)
(7.8
1)(1
0.42
)(1
.30)
(21.
34)
IPO
+21,
921
42.0
31.
867.
005.
810.
1310
.12
4.63
28.8
44.
238.
780.
3716
.69
(21.
80)
(1.3
3)(1
5.37
)(1
3.18
)(1
5.51
)(1
6.29
)(1
.40)
(22.
29)
(8.0
6)(8
.59)
(1.5
3)(2
0.28
)IP
O+3
1,66
243
.17
1.75
5.22
4.44
0.01
10.4
14.
7829
.44
4.35
7.99
0.42
14.9
1(2
1.64
)(1
.31)
(15.
36)
(11.
54)
(15.
18)
(15.
28)
(1.3
9)(2
2.06
)(8
.33)
(8.0
9)(2
.08)
(18.
29)
IPO
+51,
158
42.9
01.
623.
483.
62−0
.17
11.3
94.
9529
.88
4.37
7.56
0.59
15.1
1(2
1.78
)(1
.12)
(14.
10)
(11.
89)
(14.
70)
(13.
62)
(1.4
0)(2
1.66
)(8
.01)
(7.6
1)(3
.01)
(18.
49)
IPO
+780
243
.44
1.55
2.92
2.24
0.96
12.1
45.
0529
.99
4.13
7.21
0.75
14.5
9(2
1.44
)(1
.13)
(14.
16)
(9.1
9)(1
2.84
)(1
2.54
)(1
.43)
(21.
43)
(7.6
5)(7
.31)
(3.2
3)(1
7.65
)

The Impact of Market Timing on Capital Structure 1689
B. Definition of Hot and Cold Markets
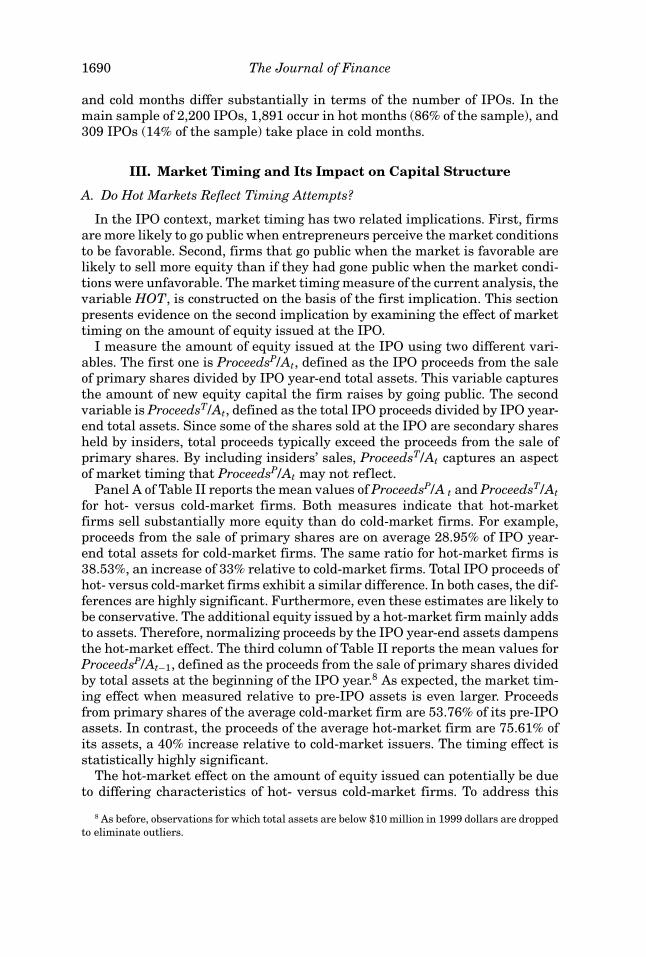
I define hot and cold markets on the basis of the monthly IPO volume. Specifi-cally, I use the SDC sample before the imposition of COMPUSTAT data require-ments to determine the number of IPOs for each month between January 1971and December 1999. To smooth out seasonal variation, I take a 3-month cen-tered moving average of the number of IPOs for each month. Since the economygrew by about 3% per annum over the 29-year period, I detrend the monthlymoving average IPO volume at a rate of 0.25% per month. Hot (cold) monthsare then defined as those that are above (below) the median in the distributionof the detrended monthly moving average IPO volume across all the monthsin the sample. For each IPO in the sample described in Section II.A, a dummyvariable HOT takes the value of one if the firm goes public in a hot month, andzero otherwise. The variable HOT is the main focus of this study in measuringfirms’ market timing attempts.
Figure 1 plots the detrended monthly moving average IPO volume from 1971to 1999. The horizontal line is the median at 9.37. As the figure illustrates, hot
1971 1975 1980 1985 1990 1995 1999
10
20
30
40
50
Time
Det
rend
ed m
onth
ly m
ovin
g av
erag
e IP
O v
olum
e
Figure 1. Time series of the detrended monthly moving average IPO volume. The hori-zontal line is the median detrended monthly volume.
1690 The Journal of Finance
and cold months differ substantially in terms of the number of IPOs. In themain sample of 2,200 IPOs, 1,891 occur in hot months (86% of the sample), and309 IPOs (14% of the sample) take place in cold months.
III. Market Timing and Its Impact on Capital Structure
A. Do Hot Markets Reflect Timing Attempts?
In the IPO context, market timing has two related implications. First, firmsare more likely to go public when entrepreneurs perceive the market conditionsto be favorable. Second, firms that go public when the market is favorable arelikely to sell more equity than if they had gone public when the market condi-tions were unfavorable. The market timing measure of the current analysis, thevariable HOT, is constructed on the basis of the first implication. This sectionpresents evidence on the second implication by examining the effect of markettiming on the amount of equity issued at the IPO.
I measure the amount of equity issued at the IPO using two different vari-ables. The first one is ProceedsP/At, defined as the IPO proceeds from the saleof primary shares divided by IPO year-end total assets. This variable capturesthe amount of new equity capital the firm raises by going public. The secondvariable is ProceedsT/At, defined as the total IPO proceeds divided by IPO year-end total assets. Since some of the shares sold at the IPO are secondary sharesheld by insiders, total proceeds typically exceed the proceeds from the sale ofprimary shares. By including insiders’ sales, ProceedsT/At captures an aspectof market timing that ProceedsP/At may not reflect.
Panel A of Table II reports the mean values of ProceedsP/A t and ProceedsT/Atfor hot- versus cold-market firms. Both measures indicate that hot-marketfirms sell substantially more equity than do cold-market firms. For example,proceeds from the sale of primary shares are on average 28.95% of IPO year-end total assets for cold-market firms. The same ratio for hot-market firms is38.53%, an increase of 33% relative to cold-market firms. Total IPO proceeds ofhot- versus cold-market firms exhibit a similar difference. In both cases, the dif-ferences are highly significant. Furthermore, even these estimates are likely tobe conservative. The additional equity issued by a hot-market firm mainly addsto assets. Therefore, normalizing proceeds by the IPO year-end assets dampensthe hot-market effect. The third column of Table II reports the mean values forProceedsP/At−1, defined as the proceeds from the sale of primary shares dividedby total assets at the beginning of the IPO year.8 As expected, the market tim-ing effect when measured relative to pre-IPO assets is even larger. Proceedsfrom primary shares of the average cold-market firm are 53.76% of its pre-IPOassets. In contrast, the proceeds of the average hot-market firm are 75.61% ofits assets, a 40% increase relative to cold-market issuers. The timing effect isstatistically highly significant.
The hot-market effect on the amount of equity issued can potentially be dueto differing characteristics of hot- versus cold-market firms. To address this
8 As before, observations for which total assets are below $10 million in 1999 dollars are droppedto eliminate outliers.

The Impact of Market Timing on Capital Structure 1691
Table IIMarket Timing Effects on Issuance Activity
For each variable Yt, Panel A reports the mean value among hot- and cold-market firms andthe t-value of their difference. The time subscript t denotes the IPO year. Panel B reports thecoefficients of regressions of the form
Yt = c0 + c1HOT + c2 M/Bt + c3EBITDA/At−1 + c4SIZEt−1 + c5PPE/At−1
+ c6 R&D/At−1 + c7RDDt−1 + c8 D/At−1 + εt .
All regressions are estimated with industry-fixed effects defined by three-digit SIC codes. The con-stant term is not reported. Robust t-statistics are in parentheses. The dummy variable RDD takesthe value of 1 when research and development expense information is missing in COMPUSTAT.The dependent variable Yt is the total IPO proceeds divided by year-end assets, the proceeds fromprimary shares divided by year-end assets, the proceeds from primary shares divided by beginning-of-the-year assets, primary shares issued divided by the total outstanding shares at year-end, offerprice divided by the per-share book value at year-end, and the IPO-year net debt issues divided byyear-end assets in Columns 1–6, respectively. All variables are expressed in percentage terms.
ProceedsT/At ProceedsP/At ProceedsP/At−1 % Issued Offer/Book d/At
Panel A: Mean Values
Hot 47.95 38.53 75.61 23.96 1.77 −0.03Cold 37.87 28.95 53.76 21.76 1.53 1.48t-value (difference) (6.21) (6.45) (4.44) (3.02) (3.68) (1.25)
Panel B: Regression Analysis
HOT 10.16 8.66 22.16 2.58 0.23 −2.24(8.61) (9.03) (7.05) (4.34) (5.64) (1.95)
M/Bt 3.68 1.82 15.16 −2.59 0.39 0.02(7.58) (4.78) (8.07) (15.97) (17.56) (0.06)
EBITDA/At−1 0.29 0.08 −0.26 −0.01 0.01 −0.05(7.75) (2.54) (1.12) (0.41) (4.11) (1.64)
SIZEt−1 −6.54 −6.98 −20.31 −2.97 −0.09 −1.69(16.23) (19.64) (12.92) (14.21) (6.98) (4.71)
PPE/At−1 −0.10 −0.09 −0.42 −0.05 0.00 −0.06(3.38) (3.58) (4.44) (3.32) (0.91) (1.94)
R&D/At−1 0.37 0.30 1.39 −0.02 0.01 −0.10(4.13) (4.10) (3.98) (0.72) (4.23) (2.23)
RDDt−1 −0.52 0.45 1.19 2.30 −0.08 0.84(0.37) (0.40) (0.51) (3.55) (2.03) (0.65)
D/At−1 −0.03 0.05 −0.11 0.11 −0.01 −0.23(0.99) (2.25) (1.04) (9.53) (6.32) (10.94)
R2 0.37 0.36 0.37 0.30 0.58 0.11N 2,157 2,156 1,814 1,963 2,157 2,103
concern, I run the following regression that controls for various determinantsof equity issues:
Yt = c0 + c1HOT + c2M/Bt + c3EBITDA/At−1 + c4SIZEt−1 + c5PPE/At−1
+ c6 R&D/At−1 + c7RDDt−1 + c8 D/At−1 + εt , (1)
where t is the IPO year, and the regression is run in the cross-section ofIPOs. Above, the dependent variable Yt is ProceedsT/At, ProceedsP/At, or
1692 The Journal of Finance
ProceedsP/At−1. The dummy variable HOT captures the market timing effect.The control variables include the market-to-book ratio, profitability, size, tan-gibility of assets, research and development expense, and lagged book leverage.Previous research identifies these factors as the main determinants of financ-ing policy (Titman and Wessels (1988), Rajan and Zingales (1995)). The dummyvariable RDD takes the value of one when R&D is missing in COMPUSTAT.All firm characteristics are lagged one year, with the exception of the market-to-book ratio, which is observed in the IPO year for the first time. To furthercontrol for heterogeneity in industry characteristics, this and all subsequentregressions include industry fixed effects defined by three-digit SIC codes.
The first three columns in Panel B of Table II report the results. The re-sults confirm that the tendency of hot-market firms to issue more equity is agenuine timing effect. Various firm characteristics are highly significant de-terminants of equity issuance activity; furthermore, industry-level variation isalready taken into account. Nevertheless, the hot-market effect retains bothits size and significance. In all three columns, the coefficient of HOT in (1) isalmost identical to the difference in means displayed in Panel A. Indeed, thesignificance of the timing effect increases after introducing the controls.
The positive hot-market effect on the amount of equity issued may reflecthigher prices (relative to the book value of assets) obtained in hot markets,larger ownership stakes offered for sale, or both. The price effect is consistentwith market timing, but it could also obtain if intangible assets play a relativelymore important role in the valuation of hot-market firms. The quantity effectcaptures market timing attempts more directly. To examine these two effectsseparately, I decompose the primary proceeds measure, ProceedsP/At, into itsquantity and price components:
Primary ProceedsTotal Assets
= Primary Shares IssuedNumber of Shares Outstanding
× Offer PricePer Share Book Value of Assets
. (2)
The first term on the right-hand side of (2) measures the fraction of firm owner-ship sold via the issuance of primary shares. The second term is the offer priceas a multiple of book value of assets.9 Columns 4 and 5 in Table II report themean values and regression results for these two variables. The hot-market ef-fect is significantly positive in both cases: hot-market issuers sell more sharesat the IPO, and do so at higher prices relative to book value of assets, comparedto their cold-market counterparts.10,11
9 In both cases, the denominator is measured as of the IPO year-end. Thus, the number of sharesoutstanding is the post-issue value.
10 Note that in contrast to the positive hot-market effect, firms with higher market-to-book ratiossell fewer shares at the IPO.
11 The hot-market price effect in Column 5 is a conservative estimate of the actual price effect.This is because the regression specification controls for the IPO year-end market-to-book ratio,which is highly correlated with the dependent variable, the offer price/book value ratio. When thesame regression is estimated without the market-to-book ratio, the coefficient on the hot-marketdummy increases to 0.29 (not reported in the table).
The Impact of Market Timing on Capital Structure 1693
The last column in Table II reports the net debt issues of hot- and cold-marketfirms in the IPO year. While the mean values are small for both groups, thehot-market effect is significantly negative. This is consistent with the idea thathot-market firms find the equity market conditions more favorable than thedebt market conditions in the IPO year.
Hot-market firms could issue more equity than their cold-market counter-parts for reasons other than market timing. First, hot-market firms may beseverely overleveraged before going public, and may attempt to revert back totheir leverage targets at the IPO. Although regression specification (1) controlsfor pre-IPO book leverage, it is instructive to examine whether hot-market firmshave higher leverage prior to the IPO. The first column in Panel A, Table IIIreports the mean book leverage for hot- and cold-market firms at the beginningof the IPO year. The two groups of firms are very similar in their leverage ratiosprior to the IPO. In Panel B, book leverage at the beginning of the IPO yearis regressed on the hot-market dummy and the same control variables as in(1) except the market-to-book ratio. The coefficient of the hot-market dummyis negative and insignificant, indicating that hot-market firms do not deviatefrom their leverage targets any more than cold-market firms do prior to theIPO.
Another potential explanation for the equity issue activity of hot-marketfirms is that they grow faster. If hot-market firms invest at higher rates, orexpect to do so in the near future, then they are likely to finance part of thisgrowth by raising equity capital. The second column in Table III characterizesthe investment behavior of firms in the IPO year. Contrary to the growth ex-planation, the mean investment rate is in fact lower for hot-market firms. Thedifference in investment rates is statistically significant after controlling forfirm and industry characteristics. The next two columns replicate the analysisfor investment rates in the 2 years subsequent to the IPO. There is no evidencethat hot-market firms invest more after the IPO year either. Therefore, thetendency of hot-market firms to issue more equity does not seem to be relatedto their real investment behavior.12
The investment regressions also point to an important drawback of using themarket-to-book ratio as a measure of market timing. Firms that have highermarket-to-book ratios invest significantly more. Thus, the relationship betweenthe market-to-book ratio and equity issues is likely to obtain because of the ten-dency of growth firms to use more equity financing. Focusing instead on marketconditions around equity issues better isolates the market timing effects, as hot-and cold-market firms do not differ in their future investment activity.
Columns 5–8 in Table III report the profitability of hot- versus cold-marketfirms at the time they go public and in subsequent years. Favorable marketconditions may trigger IPOs of less profitable firms if these firms find it dif-ficult to go public when the IPO market is less active. Supporting this view,
12 Unreported results show that using alternative investment measures (defining investmentmore broadly as growth in assets, or normalizing investment relative to net PPE instead of totalassets) does not change the main conclusion: hot- and cold-market firms do not differ in their realinvestment rates.

1694 The Journal of FinanceT
able
III
Com
par
ison
ofH
ot-
and
Col
d-M
ark
etF
irm
sF
orea
chva
riab
leY
t,P
anel
Are
port
sth
em
ean
valu
eam
ong
hot
-an
dco
ld-m
arke
tfi
rms
and
the
t-va
lue
ofth
eir
diff
eren
ce.
Pan
elB
repo
rts
the
coef
fici
ents
ofre
gres
sion
sof
the
form
Yt=
c 0+
c 1H
OT
+c 2
M/B
IPO
+c 3
M/B
t−1
+c 4
EB
ITD
A/
At−
1+
c 5S
IZE
t−1
+c 6
PP
E/A
t−1
+c 7
R&
D/
At−
1+
c 8R
DD
t−1
+ε
t.
All
regr
essi
ons
are
esti
mat
edw
ith
indu
stry
-fix
edef
fect
sde
fin
edby
thre
e-di
git
SIC
code
s.T
he
con
stan
tte
rmis
not
repo
rted
.Rob
ust
t-st
atis
tics
are
inpa
ren
thes
es.
Th
ede
pen
den
tva
riab
leY
tis
the
pre-
IPO
book
leve
rage
,th
ein
vest
men
tra
tes
for
year
sIP
O,
IPO
+1,
and
IPO
+2,
prof
itab
ilit
yfo
rye
ars
IPO
,IP
O+1
,IP
O+2
,an
dIP
O+4
,an
dth
eIP
O-y
ear
divi
den
dpa
you
tra
tio
inC
olu
mn
s1–
9,re
spec
tive
ly.
INV
/At
EB
ITD
A/A
t
tD
/AP
RE
−IP
Ot
IPO
IPO
+1
IPO
+2
IPO
IPO
+1
IPO
+2
IPO
+4
DIV
/EIP
O
Pan
elA
:Mea
nV
alu
es
Hot
66.7
410
.51
10.7
28.
8015
.37
10.9
39.
9110
.00
3.12
Col
d65
.83
10.9
811
.22
8.67
17.6
812
.14
11.3
612
.03
1.19
t-va
lue
(dif
fere
nce
)(0
.71)
(0.6
6)(0
.75)
(0.2
2)(3
.23)
(1.1
7)(1
.36)
(1.8
9)(3
.33)
Pan
elB
:Reg
ress
ion
An
alys
is
HO
T−0
.43
−1.1
5−0
.43
0.29
−2.2
9−0
.59
−0.7
1−2
.18
1.73
(0.3
4)(2
.00)
(0.8
2)(0
.56)
(3.6
3)(0
.66)
(0.7
7)(2
.33)
(3.8
3)M
/BIP
O—
0.13
0.91
0.15
2.18
2.42
−1.2
0−0
.10
0.97
—(0
.90)
(6.3
7)(1
.47)
(9.7
7)(8
.87)
(4.4
9)(0
.26)
(5.3
5)M
/Bt−
1—
——
0.71
——
3.76
2.67
——
——
(4.4
4)—
—(1
0.97
)(6
.40)
—E
BIT
DA
/At−
1−0
.22
0.05
0.07
0.06
——
——
0.05
(6.7
9)(3
.82)
(2.8
4)(4
.93)
——
——
(3.4
1)S
IZE
t−1
2.21
−1.0
5−1
.46
−0.4
42.
263.
263.
572.
640.
63(5
.53)
(5.7
2)(7
.37)
(3.1
5)(1
1.20
)(1
0.96
)(1
0.22
)(7
.34)
(4.1
5)P
PE
/At−
1−0
.01
0.24
0.26
0.21
0.06
0.13
0.14
0.14
−0.0
1(0
.26)
(14.
43)
(15.
56)
(14.
12)
(4.2
9)(6
.52)
(6.0
5)(5
.27)
(0.8
0)R
&D
/A
t−1
−0.2
9−0
.06
−0.1
1−0
.03
−0.2
1−0
.28
−0.4
0−0
.51
−0.0
1(4
.24)
(2.5
0)(2
.90)
(1.5
4)(5
.57)
(2.2
1)(3
.91)
(4.9
0)(0
.59)
RD
Dt−
11.
860.
94−1
.14
−0.2
00.
100.
81−0
.87
−1.9
00.
41(1
.57)
(1.6
9)(2
.17)
(0.4
1)(0
.15)
(0.8
7)(0
.91)
(2.0
1)(0
.69)
R2
0.15
0.46
0.47
0.42
0.27
0.19
0.27
0.28
0.11
N2,
157
2,13
21,
998
1,84
12,
162
2,02
31,
863
1,35
82,
155

The Impact of Market Timing on Capital Structure 1695
Table IVDividend Payout in the IPO Year
The sample is the hot-market IPOs in Column 1, the cold-market IPOs in Column 2, and all IPOsin Column 3. Panel A reports the fraction of each sample in various dividend payout brackets.Panel B reports the fractions of special and regular dividend payers among the firms with positiveIPO-year dividend payouts. Regular dividend payers are defined as those firms that pay at leasttwo dividends within 12 months after going public.
% Hot Markets % Cold Markets % All
Panel A: IPO Year Payout Ratio
0%: 77.6 79.0 77.80%−10%: 13.2 17.5 13.810%−25%: 4.2 2.3 3.925% and above: 5.0 1.3 4.5
Panel B: Special versus Regular Dividends
Special only: 75.7 52.3 72.5Regular: 24.3 47.7 27.5
Table III shows that the hot-market IPO firms are less profitable than theircold-market counterparts.13 The low profitability of the hot-market firms per-sists well beyond the IPO year.
Further evidence of market timing comes from the dividends hot-marketfirms pay in the IPO year. The last column in Table III shows that the averageIPO-year dividend payout of hot-market firms is 3.12% of IPO year-end bookequity, a surprisingly high ratio for young firms. Table IV provides a closer lookat the IPO-year dividend payout. As one would expect, the majority of the firmsin the sample do not pay any dividends in the IPO year. However, the fractionof payers, about 22%, is quite large, and therefore the high dividend payout ofhot-market firms is not due to a few outliers. Panel B of Table IV shows thatthe positive payout ratios represent special rather than regular dividends inmost cases.14 Furthermore, the frequency of special dividends is substantiallyhigher among hot-market issuers. An examination of IPO filings reveals thatsuch special dividends are typically financed out of the IPO proceeds.15,16 The
13 The lower profitability of the hot-market firms is due in part to their larger asset base at theend of the IPO year.
14 Regular dividend payers are identified as those firms that pay at least two dividends within12 months after going public.
15 IPO filings are available at the SEC website at http://www.sec.gov/edgar.shtml.16 Most of the special dividend payers are S-corporations prior to the IPO. An S-corporation
is a pass-through entity with no corporate taxation. Its shareholders pay personal taxes on thefirm’s income in the year it is earned, regardless of whether the income is distributed or retained.Therefore, many S-corporations have accumulated undistributed income on their books at the timeof their IPOs. Since receiving this sum is a tax-free event, whereas selling shares (at the IPO or inthe future) is subject to capital gains taxation, S-corporation shareholders have a tax incentive toliquidate through special dividends at the IPO.

1696 The Journal of Finance
fact that firms tend to follow this policy predominantly in hot markets is consis-tent with the market timing hypothesis: issuers view hot markets as windowsof opportunity for selling equity relatively easily, and hence feel confident toproceed with an offering whose proceeds will largely finance a special dividend.Convincing IPO investors to finance such a transaction appears to be moredifficult in a cold market.
Prior literature interprets the positive relationship between the market-to-book ratio and equity issues as evidence of market timing. How does the hot-market effect compare to the market-to-book ratio in explaining IPO firms’equity issues? From Table II, the coefficient of M/B in the ProceedsP/At regres-sion is 1.82. The standard deviation of M/B in the IPO cross-section is 1.45(Table I). Hence, a one-standard deviation increase in the market-to-book ratiois associated with a 2.64 percentage point increase in IPO proceeds. Clearly,market timing does not account for all of the cross-sectional variation in themarket-to-book ratio. In particular, firms’ growth prospects directly affect theirmarket-to-book ratios. Furthermore, variation in the market-to-book ratio thatis not due to market timing is likely to be related to factors that affect equityissues (e.g., high-growth firms may issue more equity to maintain financial flex-ibility). The market timing measure of the current analysis is the hot-marketdummy, which has a positive effect of 8.66 percentage points on ProceedsP/At(Table II). As the findings of this section demonstrate, the hot-market effectdoes not directly relate to firms’ growth prospects or other characteristics, andhence is not subject to the concerns that cloud the interpretation of the findingsbased on the market-to-book ratio. It appears that the hot–cold market classi-fication characterizes the market timing phenomenon in a stronger and morerobust manner than the market-to-book ratio does.
To summarize, IPO market volume is a highly significant indicator of indi-vidual firms’ market timing attempts. Firms that go public in hot markets issuemore equity than those that go public in cold markets. This hot-market effectdoes not stem from any differences in leverage prior to the IPO, or external fi-nancing needs subsequent to the IPO. The prevalence of large special dividendsamong hot-market issuers provides further evidence that market timing, as op-posed to financing or investment needs, drives the hot-market effect on equityissues.17
B. The Short-Term Impact of Market Timing on Capital Structure
The findings above show that market timing affects not only total IPOproceeds (which include insiders’ sales), but also the amount of new equity
17 There is one possibility not considered in this section that can potentially explain why hot-market firms differ from cold-market firms in their equity issuance activity. If recapitalization iscostly, firms are likely to set their leverage ratios taking into account not only a snapshot of theiroperating characteristics, but also the anticipated changes in these characteristics. Then, to theextent that hot- versus cold-market firms differ in their expectations about the future, they maypick different leverage ratios and hence issue different amounts of equity. Since this hypothesisclosely relates to capital structure dynamics, it is considered in greater detail below in Section III.D,where the persistence of market timing effects on capital structure is examined.

The Impact of Market Timing on Capital Structure 1697
Table VShort-Term Impact of Market Timing on Capital Structure
For each variable Yt, Panel A reports the mean value among hot- and cold-market firms and thet-value of their difference. The time subscript t denotes the IPO year. Panel B reports the coefficientsof regressions of the form
Yt = c0 + c1HOT + c2 M/Bt + c3EBITDA/At−1 + c4SIZEt−1 + c5PPE/At−1 + c6 R&D/At−1
+ c7RDDt−1 + c8 D/At−1 + εt .
All regressions are estimated with industry-fixed effects defined by three-digit SIC codes. Theconstant term is not reported. Robust t-statistics are in parentheses. The dependent variable Yt isthe change in book leverage, net equity issues, the change in cash, the change in other assets, andthe change in retained earnings in Columns 1–5, respectively. In Column 6, the dependent variableis the level of book leverage, and the lagged book leverage is excluded from the regression.
D/At − D/At−1 e/At �Cash/At �Other Assets/At �RE/At D/At
Panel A: Mean Values
Hot −28.28 40.83 18.09 26.06 3.24 38.42Cold −24.88 33.59 15.82 25.74 6.63 40.70t-value (difference) (2.75) (5.40) (1.77) (0.26) (5.56) (1.87)
Panel B: Regression Analysis
HOT −3.57 6.74 2.42 −0.28 −2.63 −3.69(3.88) (6.41) (2.46) (0.24) (4.74) (3.67)
M/Bt −2.61 3.54 3.34 0.39 0.22 −2.67(10.04) (11.31) (9.95) (1.20) (1.21) (9.94)
EBITDA/At−1 −0.16 −0.01 0.08 0.08 0.22 −0.23(7.07) (0.53) (2.53) (2.63) (13.16) (9.71)
SIZEt−1 3.60 −6.28 −4.51 −3.35 0.14 4.28(11.93) (17.71) (14.65) (9.65) (0.79) (12.87)
PPE/At−1 0.02 −0.08 −0.06 −0.08 0.00 0.02(1.03) (2.89) (2.41) (2.88) (0.30) (0.87)
R&D/At−1 −0.23 0.35 0.55 −0.28 0.02 −0.31(5.69) (7.05) (8.73) (4.65) (0.60) (7.45)
RDDt−1 −0.40 1.90 −0.72 2.21 −0.65 0.19(0.41) (1.65) (0.73) (1.79) (1.09) (0.18)
D/At−1 −0.69 0.18 −0.08 0.05 0.02 —(39.96) (7.97) (4.09) (2.31) (2.07) —
R2 0.51 0.42 0.49 0.15 0.22 0.41N 2,157 2,103 2,157 2,157 2,103 2,157
capital raised by the firm. Therefore, the impact of market timing on leveragein the IPO year is likely to be negative. This section quantifies this negativeeffect, and analyzes how it relates to other changes in the balance sheet of thefirm.
I start with the change in book leverage in the IPO year. The first column ofPanel A, Table V reports the mean change in book leverage for hot- and cold-market firms. Not surprisingly, book leverage declines substantially in both

1698 The Journal of Finance
cases. Hot-market firms, however, reduce leverage by 3.4 percentage pointsmore than cold-market firms do. To better evaluate the hot-market effect, Irun the following regression that controls for other determinants of leveragechanges:
D/At − D/At−1 = c0 + c1HOT + c2M/Bt + c3EBITDA/At−1
+ c4SIZEt−1 + c5PPE/At−1 + c6 R&D/At−1
+ c7RDDt−1 + c8 D/At−1 + εt . (3)
Panel B of Table V reports the coefficient estimates. After controlling for firmand industry characteristics, the hot-market effect on the change in book lever-age in the IPO year is −3.57 percentage points and is highly significant.
The change in leverage can be decomposed as follows:
D/At − D/At−1 = −e/At + (E/A)t−1 × (�Cash + �Other Assets)/At − �RE/At .
(4)
The first term on the right-hand side of (4) is the negative of the net equityissues in year t.18 If all of the new equity capital is used to pay down debt,then the change in leverage resulting from equity issues equals the negativeof the amount issued. But, to the extent that the new equity capital adds tototal assets, the reduction in leverage is less than one-for-one. The second termcaptures this effect through the growth in assets. It is further decomposed intothe change in cash and the change in other assets. If market timers raise moreequity capital than needed, then the proceeds are more likely to add to cashand short-term investments than to other, longer-term assets. The final termin (4) is the change in retained earnings. Newly retained earnings add to equitycapital and hence reduce leverage.
The second to fifth columns in Table V report the mean values and the re-gression analyses for the terms on the right-hand side of (4).19 In line with theresults of Section III.A, the IPO-year net equity issues, e/At, is substantiallyhigher for hot-market IPOs. The additional equity that the hot-market firmsissue largely adds to their cash balances. The hot-market effect on the changein cash is 2.42 percentage points, and is highly significant. The change in long-term assets, on the other hand, is not affected by whether the firm goes publicin a hot or a cold market. The lower profitability of hot-market issuers resultsin a negative hot-market effect on the IPO-year retained earnings.
The overall picture that emerges from the results discussed so far is as follows.Hot-market firms issue significantly more equity and less debt in the IPO yearthan cold-market firms do. As a result, the drop in the book leverage ratio
18 Notice that e/At is not the same as the ProceedsP/At variable in Section III.A, as e/At is calculatedon the basis of the total change in book equity in the IPO year, and hence it includes other formsof equity issuance (e.g., through mergers and employee stock options).
19 In Columns 3 and 4, the dependent variables �Cash/At and �Other Assets/At are not multipliedby (E/A)t−1.

The Impact of Market Timing on Capital Structure 1699
is larger for hot-market firms. Part of this hot-market effect on leverage ismasked by the higher retained earnings cold-market firms generate. Hot- andcold-market firms do not differ in the way they convert new equity capital intoilliquid assets. The additional equity that hot-market firms issue primarilyaffects the cash and other liquid assets balances. This is consistent with theview that market timers tap the equity market more than their capital needsdictate.
I conclude this section by examining the levels of leverage at the end of theIPO year. The last column in Panel A, Table V shows that hot-market issuersstart their first fiscal year as a public firm with significantly less leverage thancold-market issuers do. Perhaps more important is how much firms deviatefrom their leverage targets at this point. To answer this question, I estimatethe following regression in the cross-section of firms as of the IPO year-end:
D/At = c0 + c1HOT + c2M/Bt + c3EBITDA/At−1 + c4SIZEt−1
+ c5PPE/At−1 + c6 R&D/At−1 + c7RDDt−1 + εt . (5)
The control variables utilized in earlier regressions appear in (5) as determi-nants of target leverage. If hot- and cold-market firms do not differ in terms ofhow far away they are from their targets, then the coefficient of the hot-marketdummy should be zero. The last column in Panel B of Table V shows that thisis not the case. Similar to leverage change regressions, the hot-market effecton the level of leverage is negative and significant. Thus, the leverage ratios ofhot-market firms immediately after their IPOs are too low to be explained bystandard determinants of capital structure.
C. Persistence of the Impact of Market Timing on Capital Structure
The previous section presents evidence that market timing shapes the cap-ital structures of firms in the short run. Now I turn to the central question:How persistent are these effects? Recall the three major facts from the aboveanalysis: (i) hot- and cold-market firms have similar leverage ratios prior totheir IPOs; but (ii) hot-market firms reduce leverage to a greater extent in theIPO year; hence (iii) hot-market firms have lower leverage ratios at the endof the IPO year than cold-market firms do. Whether this hot-market effect isreversed in the years subsequent to the IPO is the main question of interest inthis section.
To analyze the persistence question, I first examine the cumulative changein leverage:
D/At − D/APRE−IPO = c0 + c1HOT + c2M/Bt−1 + c3EBITDA/At−1
+ c4SIZEt−1 + c5PPE/At−1 + c6 R&D/At−1 + c7RDDt−1
+ c8 D/APRE−IPO + εt . (6)
If market timing has a permanent effect on leverage, then the cumulativechange in leverage from its pre-IPO level should continue to reflect the
1700 The Journal of Finance
Table VIPersistence of the Impact of Market Timing on Capital Structure
For each variable Yt, Panel A reports the mean value among hot- and cold-market firms and thet-value of their difference. Panel B reports the coefficients of regressions of the form
Yt = c0 + c1HOT + c2 M/Bt−1 + c3EBITDA/At−1 + c4SIZEt−1 + c5PPE/At−1 + c6 R&D/At−1
+ c7RDDt−1 + c8 D/APRE−IPO + εt .
All regressions are estimated with industry-fixed effects defined by three-digit SIC codes. Theconstant term is not reported. Robust t-statistics are in parentheses. The dependent variable Yt isthe cumulative change in book leverage from the pre-IPO year to years IPO+1 and IPO+2 in thefirst four columns. In the last four columns, the dependent variable is the level of book leverage,and the regression excludes the pre-IPO book leverage.
D/At − D/APRE-IPO Book Leverage D/At
t IPO+1 IPO+2 IPO+1 IPO+2 IPO+1 IPO+2 IPO+1 IPO+2
Panel A: Mean Values
Hot −24.96 −22.93 — — 41.14 42.37 — —Cold −24.27 −23.80 — — 40.53 39.98 — —t-value (difference) (0.50) (1.45) — — (0.46) (1.67) — —
Panel B: Regression Analysis
HOT −1.46 0.51 −1.95 0.42 −1.48 0.52 −1.98 0.43(1.47) (0.44) (1.88) (0.36) (1.35) (0.42) (1.75) (0.35)
M/Bt−1 −3.12 −2.65 — — −3.20 −2.78 — —(10.70) (7.66) — — (10.67) (7.74) — —
EBITDA/At−1 −0.32 −0.33 −0.43 −0.41 −0.39 −0.37 −0.50 −0.46(7.63) (7.93) (10.45) (10.07) (8.74) (8.39) (11.39) (10.51)
SIZEt−1 3.17 3.57 3.38 3.59 4.09 4.49 4.32 4.52(9.33) (9.10) (9.53) (8.97) (10.84) (10.91) (10.96) (10.76)
PPE/At−1 0.16 0.20 0.20 0.23 0.17 0.21 0.22 0.24(5.83) (6.79) (7.32) (7.10) (5.76) (5.59) (7.16) (7.50)
R&D/At−1 −0.22 −0.20 −0.34 −0.28 −0.34 −0.26 −0.46 −0.35(2.38) (2.25) (3.75) (3.11) (3.53) (2.94) (4.82) (3.79)
RDDt−1 0.07 0.08 0.13 0.23 0.93 1.34 1.01 1.51(0.06) (0.06) (0.11) (0.17) (0.77) (0.97) (0.80) (1.07)
D/APRE-IPO −0.69 −0.69 −0.68 −0.69 — — — —(34.79) (31.72) (33.66) (31.18) — — — —
R2 0.49 0.46 0.46 0.44 0.40 0.36 0.36 0.33N 2,027 1,873 2,027 1,873 2,027 1,873 2,027 1,873
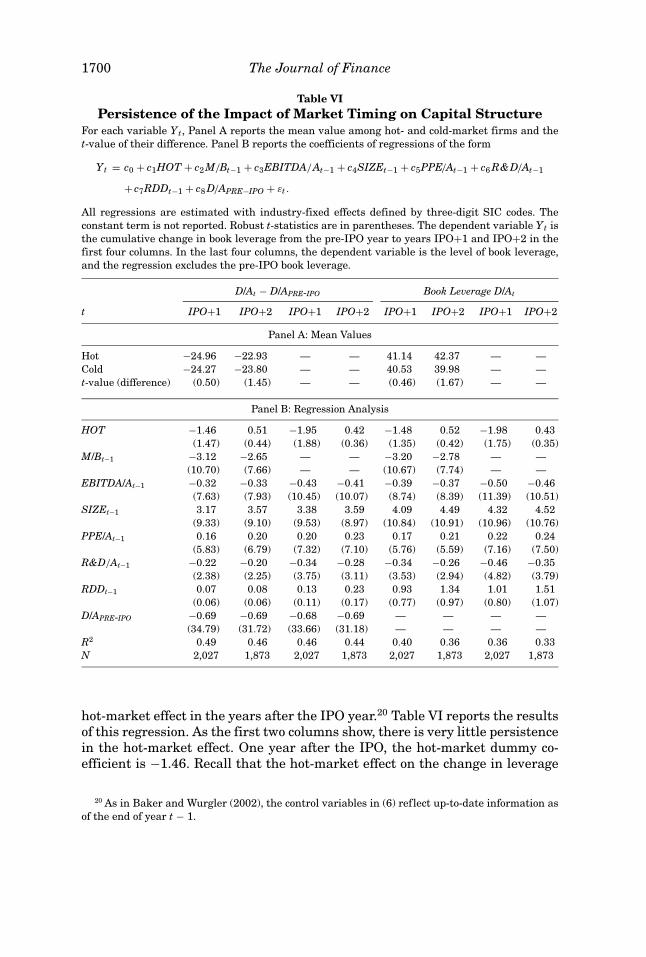
hot-market effect in the years after the IPO year.20 Table VI reports the resultsof this regression. As the first two columns show, there is very little persistencein the hot-market effect. One year after the IPO, the hot-market dummy co-efficient is −1.46. Recall that the hot-market effect on the change in leverage
20 As in Baker and Wurgler (2002), the control variables in (6) reflect up-to-date information asof the end of year t − 1.
The Impact of Market Timing on Capital Structure 1701
in the IPO year is −3.53 percentage points. Therefore, more than half of thiseffect is reversed in the first fiscal year following the IPO. By the second yearafter the IPO, the hot-market effect is completely gone: the point estimate ofthe hot-market dummy is positive and insignificant in year IPO+2. Unreportedregressions show that the results in years following IPO+2 are very similar.Thus, the hot-market effect is permanently dead as of 2 years after the IPO.
One potential concern is the likely interaction between the hot-marketdummy and the market-to-book ratio in the IPO year. It may be the case thatboth variables capture the market timing effect in the IPO year, but the market-to-book ratio does a better job of reflecting the persistence of this effect. Then,since both variables are included in (6), the hot-market dummy may turn outto be insignificant in years subsequent to the IPO even though the markettiming effect is not reversed.21 To address this concern, I re-estimate the per-sistence regression (6) without the market-to-book ratio. The results, reportedin Columns 3 and 4 of Table VI, are similar to those in the first two columns.The IPO-year hot-market effect is reduced to −1.95 in IPO+1, pointing to areversal. The reversal continues, and by the end of year IPO+2, the hot-marketeffect completely vanishes.
The last four columns in Table VI replicate the analysis in the first fourcolumns for levels of leverage. The regression specification is similar to (5).The reversal results for leverage levels are the same as those for cumulativechanges. The short-term effect of market timing on capital structure starts toreverse immediately after the IPO. At the end of year IPO+1, there is still somesignificantly negative effect. The hot-market effect continues to reverse, and bythe end of the second year the reversal is complete.
The exclusion of firms with negative book equity values in years subsequentto the IPO could bias the persistence results above. To the extent that theexcluded firms tend to be cold-market issuers, the average leverage ratio of thecold-market firms would be understated in Table VI. The book equity screencauses 23 firms in IPO+1 and 44 firms in IPO+2 to drop out of the sample.These numbers are quite small, mainly due to the fact that the total assetsand the market-to-book screens already exclude very small firms that are morelikely to experience big losses and negative book equity values. Unreportedresults show that lifting the book equity screen does not lead to any significantchanges in Table VI.
The largely transitory nature of the hot-market effect on capital structurecontrasts with the findings in Baker and Wurgler (2002). Using the same dataset but utilizing the external finance weighted average market-to-book ratio tocapture past timing attempts, Baker and Wurgler argue that market timing hashighly persistent effects on firms’ debt ratios. To provide a direct comparison ofthe two approaches, Table VII reports the coefficient estimates from regressionsthat include both the hot-market dummy and the external finance weightedaverage market-to-book ratio as defined in Baker and Wurgler (2002). The
21 To be more specific, for year IPO+1, M/Bt−1 is the same as the market-to-book ratio in the IPOyear. For IPO+2, M/Bt−1 is different from the IPO-year market-to-book.

1702 The Journal of Finance
Table VIIHot-Market and Historical Market-to-Book Effects on Leverage
The table reports the coefficients of the hot-market dummy, the external finance weighted averagemarket-to-book ratio, and the lagged market-to-book ratio in regressions of the form
Yt = c0 + c1HOT + c2 M/Befwa,t−1 + c3 M/Bt−1 + c4EBITDA/At−1 + c5SIZEt−1 + c6PPE/At−1
+ c7 R&D/At−1 + c8RDDt−1 + c9 D/APRE−IPO + εt .
All regressions are estimated with industry-fixed effects defined by three-digit SIC codes. Robustt-statistics are in parentheses. The dependent variable Yt is the cumulative change in book leveragefrom the pre-IPO year to years IPO+2, IPO+3, and IPO+5 in the first three columns. In the lastthree columns, the dependent variable is the level of book leverage, and the regression excludesthe pre-IPO book leverage.
D/At − D/APRE−IPO Book Leverage D/At
t IPO+2 IPO+3 IPO+5 IPO+2 IPO+3 IPO+5
HOT 0.83 0.57 −0.47 1.03 0.70 −0.24(0.73) (0.44) (0.29) (0.85) (0.52) (0.14)
M/Befwa,t−1 −3.22 −4.42 −5.42 −3.55 −4.74 −5.40(5.90) (7.90) (6.66) (6.14) (8.50) (6.51)
M/Bt−1 −0.46 −0.01 0.29 −0.38 −0.06 0.12(0.87) (0.01) (0.45) (0.68) (0.11) (0.18)
R2 0.49 0.47 0.45 0.40 0.35 0.33N 1,761 1,546 1,055 1,761 1,546 1,055
results illustrate the stark difference between the two conclusions. As in Bakerand Wurgler, the weighted average market-to-book ratio is highly significantin explaining leverage levels and cumulative changes several years after theIPO. In fact, the contemporaneous market-to-book ratio turns insignificant inall cases after the inclusion of the weighted average market-to-book ratio. Ifmarket timing effects were indeed so persistent, one would expect a similarresult for hot-market issuers as well. The fact that the hot-market dummyhas no significance from year IPO+2 on casts doubt on Baker and Wurgler’sinterpretation of their findings.22
D. Reversal
How does the reversal take place? The first possibility is that the hot-marketfirms actively increase their leverage ratios to catch up with their leverage tar-gets. The second possibility is that firm characteristics, rather than the leverageratio itself, change in such a way as to bring the leverage target back in line withthe actual leverage ratio. One plausible story for why this could happen is basedon the existence of recapitalization costs. If recapitalization is costly, dynami-cally optimizing firms will not continuously recapitalize by issuing (or retiring)
22 See Kayhan and Titman (2006) for an analysis of the alternative explanations for the persis-tence of market-to-book effects on leverage ratios.

The Impact of Market Timing on Capital Structure 1703
securities. Rather, recapitalization will be infrequent and lumpy. When firmsdo make active changes to leverage by issuing securities, the new leverage ra-tio will reflect not only a snapshot of the firm characteristics at that moment,but also the direction in which these characteristics are anticipated to move inthe future. This is because a leverage ratio that is optimal given current firmcharacteristics is not necessarily optimal when future recapitalization costs areconsidered (see Fischer, Heinkel, and Zechner (1989) and Titman and Tsyplakov(2003) for models of dynamically optimal capital structure with recapitalizationcosts). In the current context, it may also be the case that hot- and cold-marketfirms differ systematically in their expectations about the future (e.g., antic-ipated changes in growth opportunities), and hence issue different amountsof equity when they go public. Although hot-market firms may appear under-leveraged in the IPO year given a set of control variables proxying for theirthen-current characteristics, the low leverage ratio may in fact be optimal froma dynamic perspective. Over time, the realization of the anticipated changeswill bring the leverage ratio back in line (on average) with the underlying firmcharacteristics, although it is the characteristics, rather than the leverage it-self, that move. If supported by the data, this costly recapitalization hypothesiswould not only explain the reversal results above, but also undermine the mar-ket timing findings of the previous sections, as the IPO-year hot-market effectwould simply be a reflection of dynamic optimization by firms.
As a first look at the two hypotheses above, I examine the annual leveragechanges in the 2 years following the IPO. If hot-market firms set low leverageratios in the IPO year as an optimal response given their expectations aboutthe future, then they should not systematically increase leverage immediatelyafterwards. They may continue to reduce it, or at best, there may be no fur-ther hot-market effect in leverage changes. The first two columns in Panel A,Table VIII show that this is not the case. Hot-market firms increase leveragesubstantially in the two years following the IPO, by an average of 3.85 per-centage points in year IPO+1 and 2.17 percentage points in year IPO+2. Bothnumbers are statistically significant. Cold-market firms, on the other hand, ap-pear to be content with their IPO-year leverage ratios, as their leverage changesare small and not significantly different from zero in both IPO+1 and IPO+2.Unreported results show that this stark difference in the leverage changes ofhot- and cold-market firms disappears from year IPO+3 on. Recall that thereversal of the hot-market effect is complete as of IPO+2. Thus, the reversalappears to be mainly due to the increase in the leverage ratios of hot-marketfirms.
To better evaluate the market timing versus costly recapitalization hypothe-ses, I next run the following leverage change regression for each of the 2 yearsafter the IPO:
D/At − D/At−1 = c0 + c1HOT + c2Markett + c3M/Bt−1 + c4EBITDA/At−1
+ c5SIZEt−1 + c6PPE/At−1 + c7 R&D/At−1 + c8RDDt−1
+ c9dhigh-lev + c10dlow-lev + εt , (7)

1704 The Journal of Finance
Table VIIIReversal of the Market Timing Effect on Capital Structure
For each variable Yt, Panel A reports the mean value among hot- and cold-market firms and thet-value of their difference. Panel B reports the coefficients of regressions of the form
Yt = c0 + c1HOT + c2Markett + c3 M/Bt−1 + c4EBITDA/At−1 + c5SIZEt−1 + c6PPE/At−1
+ c7 R&D/At−1 + c8RDDt−1 + c9dhigh−lev + c10dlow−lev + εt .
The dummy variable dhigh−lev takes the value of 1 if lagged book leverage exceeds 80%, and zerootherwise. The dummy variable dlow−lev is defined similarly for firms with lagged book leveragebelow 10%. Markett is a dummy variable that takes the value of 1 if the IPO volume in fiscal yeart exceeds the median IPO volume across all of the fiscal years in the sample. All regressions areestimated with industry-fixed effects defined by three-digit SIC codes. The constant term is notreported. Robust t-statistics are in parentheses. The dependent variable Yt is the annual change inbook leverage in years IPO+1 and IPO+2, net debt issues in IPO+1 and IPO+2, net equity issuesin IPO+1 and IPO+2, and the share of debt in net issue activity in IPO+1 and IPO+2 in Columns1–8, respectively.
Change in Book Leverage Net Debt Net EquityD/At − D/At−1 Issues d/A Issues e/A d/|d + e|
t IPO+1 IPO+2 IPO+1 IPO+2 IPO+1 IPO+2 IPO+1 IPO+2
Panel A: Mean Values
Hot 3.85 2.17 11.42 7.30 6.67 5.81 51.60 40.28Cold 0.86 0.73 8.92 5.22 8.24 5.87 40.22 35.10t-value (3.77) (1.93) (2.40) (2.05) (1.80) (0.07) (2.44) (0.85)
(difference)
Panel B: Regression Analysis
HOT 2.06 1.38 1.39 2.11 −2.62 −0.08 9.77 7.49(2.62) (1.82) (1.35) (2.01) (2.85) (0.09) (1.96) (1.13)
Markett −1.42 −0.51 −0.60 −0.39 2.86 1.33 −4.12 4.00(2.07) (0.84) (0.67) (0.46) (4.60) (2.02) (1.04) (0.81)
M/Bt−1 −0.27 −0.29 0.20 0.69 2.35 2.91 −2.76 −1.20(1.27) (1.15) (0.78) (2.27) (7.64) (7.86) (2.17) (0.66)
EBITDA/At−1 −0.15 −0.05 −0.03 0.11 −0.15 −0.08 0.30 0.75(4.85) (1.22) (0.75) (2.31) (3.87) (2.50) (1.69) (4.14)
SIZEt−1 −1.39 −0.52 −0.91 −0.04 −0.09 −0.49 −1.65 1.50(5.05) (1.69) (2.51) (0.09) (0.30) (1.65) (1.06) (0.72)
PPE/At−1 0.00 0.02 0.07 0.05 0.02 0.01 0.29 0.30(0.07) (0.73) (2.58) (1.80) (0.73) (0.44) (2.52) (1.96)
R&D/At−1 −0.10 −0.09 −0.03 −0.05 0.27 0.13 0.14 −0.33(1.54) (1.05) (0.36) (0.70) (2.64) (1.32) (0.34) (0.83)
RDDt−1 −0.28 −0.79 1.13 −0.61 1.30 1.67 0.95 −11.57(0.34) (0.87) (0.95) (0.49) (1.63) (1.75) (0.20) (1.80)
dhigh−lev −5.40 −6.11 −9.64 −3.26 −3.36 2.95 −35.60 −19.61(3.60) (2.91) (2.95) (1.23) (1.97) (1.49) (2.35) (1.07)
dlow−lev 1.78 2.70 −1.60 1.18 1.83 −3.07 1.92 27.82(1.29) (1.83) (1.12) (0.74) (1.03) (1.96) (0.33) (3.02)
R2 0.07 0.01 0.08 0.03 0.12 0.08 0.07 0.02N 2,027 1,873 2,026 1,873 2,026 1,873 1,585 1,378
The Impact of Market Timing on Capital Structure 1705
where t = IPO+1 or IPO+2. In (7), the dummy variable dhigh-lev(dlow-lev) takesthe value of 1 if lagged book leverage is above 80% (below 10%), and 0otherwise.23 The regression specification also controls for market conditionsin year t. Financing decisions in years IPO+1 and IPO+2 possibly depend onthen-current market conditions as well. Since every hot market is followed by acold market at some point, the post-IPO leverage increase of hot-market firmsmay potentially arise from a change in market conditions.24 The control vari-able Markett is intended to capture any such effects on financing activity.25
Under the costly recapitalization hypothesis, firms set their leverage ratios inthe IPO year given their expectations about future characteristics. To the extentthat realized values of these characteristics differ from prior expectations, firmsmay find themselves over- or underleveraged in year t, and attempt to reversetheir IPO-year leverage decisions. However, there is no reason to expect thathot-market firms systematically find themselves more underleveraged thancold-market firms do. Those firms that reduced leverage at the IPO more thannecessary (given ex post information) should increase leverage, but the sameargument applies to hot- and cold-market firms alike. In contrast, the markettiming hypothesis posits that hot-market firms are underleveraged as of theIPO year. Thus, to the extent that hot-market firms attempt to catch up withtheir targets in the subsequent years, the coefficient of HOT in (7) should bepositive. The first two columns in Panel B of Table VIII confirm that this isindeed the case. The hot-market dummy is significantly positive in both IPO+1and IPO+2. Thus, the hot-market effect in the IPO year and its subsequentreversal do not seem to be artifacts of optimal capital structure choices undercostly recapitalization.
A firm’s leverage ratio changes as a result of external financing activity andinternal growth in assets. The former reflects the active implementation of cap-ital structure policy, whereas the latter leads to partly passive changes in lever-age, especially in the short run (e.g., when managers do not have enough timeto respond to earnings shocks by issuing securities). Columns 3–6 in Table VIIIreport the external financing activity in years IPO+1 and IPO+2. Hot-marketfirms issue significantly more debt than their cold-market counterparts in bothyears (only the IPO+2 result holds up in the regression analysis). In addition,
23 Notice that lagged book leverage is not directly included in (7). This is because regardlessof the source of deviation from the target, over- or underleveraged firms are likely to revert backto the target. Therefore, including lagged leverage in the regression would subsume the effect ofmarket timing by construction. Instead, I use the leverage dummies in (7) to account for firms withextremely high or low leverage ratios.
24 This is more likely to be true if market conditions change quickly. Conversely, high persis-tence in hot and cold markets would imply that most issuers will continue to face similar marketconditions in the first few years following their IPOs.
25 Markett is a dummy variable that takes the value of 1 if the IPO volume in fiscal year t exceedsthe median IPO volume across all of the fiscal years in the sample. I use the IPO rather than theSEO volume in measuring market conditions, because recent IPO firms are more likely to be subjectto those factors that affect the new issuers than to those that affect the more mature firms of theSEO market. This view is supported by the data, as Markett is significant in explaining the equityissues of the sample firms in years IPO+1 and IPO+2 (see the last two columns in Table VIII).
1706 The Journal of Finance
hot-market firms issue significantly less equity in year IPO+1. This is in sharpcontrast to the financing activity just 1 year earlier, that is, the IPO year, whenthe hot-market effect on equity issues was strongly positive (Table II). Unre-ported results show that the differences in the financing activities of hot- andcold-market firms disappear as of year IPO+3. Overall, the results indicatethat the hot-market firms pursue an active policy of reversing the past markettiming effect on leverage. The reversal starts immediately after the IPO andtakes about 2 years to complete.
While consistent with rebalancing toward leverage targets, the financing pat-terns documented above could potentially reflect pecking order choices as well.Recall that hot-market firms have relatively low profitability at the time theygo public and in subsequent years. Thus, the driving factor behind the post-IPO increase in the leverage ratios of hot-market firms could be their largerfinancing deficits. The fact that the differences in debt and equity issuancedisappear after year IPO+2 while the low profitability of hot-market firmscontinues weakens this argument. Furthermore, the fraction of debt issues innet external financing provides a direct test of the rebalancing versus peck-ing order explanations. Suppose that the tendency of hot-market firms to issuerelatively more debt is due to their larger financing deficits. Then the fractionof debt in external financing should not differ systematically across hot- andcold-market firms, assuming that the two groups of firms are equally likely tofollow the pecking order policy. In contrast, the share of debt in the financingmix should be relatively larger for hot-market firms if they rebalance towardtargets. The last two columns in Table VIII report the mean values and the re-gression results for the fraction of debt issues in net external financing activityin years IPO+1 and IPO+2.26 Consistent with rebalancing, debt constitutes alarger fraction of external financing for hot-market firms in both years. Thehot–cold market difference is statistically significant in IPO+1, when most ofthe reversal takes place.
E. Robustness Checks
Table IX presents several robustness tests. For each test, the table reports thecoefficients of the hot-market dummy in the IPO proceeds from primary sharesregression (1) and the cumulative leverage change regression (6) for years IPO,IPO+1, and IPO+2. The IPO-year results illustrate the market timing effecton the amount of equity issued and the short-term impact of market timingon capital structure, whereas the results for IPO+1 and IPO+2 capture thereversal. The results are similar for leverage level regressions and are notreported.
The first test concerns the robustness of the results to firm size. Markettiming and its capital structure implications may potentially be very different
26 Specifically, the fraction of debt in net external financing is defined as the net debt issuesdivided by the absolute value of the sum of net debt and equity issues. Since this ratio is likely tobe very large when the denominator is close to 0 (e.g., in cases of pure recapitalizations), I dropobservations for which the denominator is less than 5% of the total assets of the firm.

The Impact of Market Timing on Capital Structure 1707
Table IXRobustness Tests
The table reports the coefficient of the hot-market dummy in regressions of the form
Yt = c0 + c1HOT + c2 M/Bt−1 + c3EBITDA/At−1 + c4SIZEt−1 + c5PPE/At−1
+ c6 R&D/At−1 + c7RDDt−1 + c8 D/APRE−IPO + εt .
All regressions are estimated with industry-fixed effects defined by three-digit SIC codes. Robustt-statistics are in parentheses. The dependent variable Yt is the total IPO proceeds divided byyear-end assets and the cumulate change in leverage from the pre-IPO year to years IPO, IPO+1,and IPO+2 in Columns 1–4, respectively. The first four panels report the results for the size (pre-IPO sales below or above $50 million in 1999 dollars) and calendar time (before and after 10/87)subsamples. In the fifth panel, book leverage ratio is alternatively defined as the sum of short-termand long-term debt (rather than total liabilities) divided by total assets. The sixth panel containsthe results when outliers are included in the sample.
D/At − D/APRE−IPO
ProceedsP/At IPO IPO+1 IPO+2
Pre-IPO sales < $50 million HOT 8.61 −3.91 −1.22 0.77t-statistic (5.55) (2.71) (0.71) (0.43)R2 0.24 0.56 0.49 0.49N 986 986 904 790
Pre-IPO sales > $50 million HOT 8.41 −3.70 −1.92 −0.41t-statistic (6.09) (3.13) (1.49) (0.25)R2 0.19 0.48 0.52 0.47N 1,170 1,171 1,123 1,083
Subsample 1/71–9/87 HOT 5.96 −2.93 0.17 1.33t-statistic (3.75) (1.80) (0.10) (0.67)R2 0.47 0.49 0.43 0.40N 774 774 728 676
Subsample 11/87–12/99 HOT 8.40 −3.23 −2.14 −0.07t-statistic (6.60) (2.58) (1.57) (0.04)R2 0.35 0.54 0.54 0.51N 1,376 1,377 1,293 1,192
Alternative leverage definition HOT — −2.33 −1.04 0.78t-statistic — (2.39) (0.95) (0.63)R2 — 0.34 0.31 0.32N — 2,154 2,024 1,871
Outliers included HOT 6.92 −2.89 −2.38 −0.48t-statistic (4.34) (2.93) (1.93) (0.34)R2 0.31 0.53 0.48 0.43N 3,670 2,958 2,859 2,587
for small versus large firms. The first two panels in Table IX replicate theanalysis for small and large firm samples separately. Large firms are definedas those whose pre-IPO sales exceed $50 million in 1999 dollars. The resultsare similar to those in the main analysis. The hot-market effect on the IPOproceeds is very strong for both subsamples. The immediate timing effect on
1708 The Journal of Finance
the leverage ratio is significantly negative in both cases as well. As before, thehot-market effect on leverage quickly reverses. One year after the IPO, thehot-market effect loses its significance for both small and large firms.
The next robustness issue relates to the high persistence of market condi-tions. Most of the late 1990s are hot years, whereas most of the 1970s are cold.Therefore, the hot-market dummy may proxy for differing characteristics of thenew- and old-economy firms that are not captured by the control variables. Theinclusion of industry-fixed effects throughout the analysis alleviates this con-cern. To address the issue more directly, I split the sample at the October 1987stock market crash and analyze the two subsamples separately. The choice of1987 as the sample split point is dictated by the fact that the last major coldmarket before 1999 starts with the 1987 crash. Panels 3 and 4 in Table IX re-port the results. The hot-market effects on the IPO proceeds and the leveragechange in the IPO year are significant for both subsamples. Once again, thehot-market effect reverses in IPO+1 and IPO+2. There seems to be relativelymore persistence in the post-1987 sample; however, the hot-market dummyturns statistically insignificant in IPO+1 in both cases.
The third test concerns the definition of the book leverage ratio. Bakerand Wurgler (2002) include non-interest–bearing liabilities in calculating bookleverage, and the analysis so far follows their definition to facilitate compari-son. When alternatively defined on the basis of short- and long-term debt only,book leverage levels both before and after the IPO are substantially lower (unre-ported). Panel 5 in Table IX shows that the main conclusions from the analysisremain the same with this alternative measure of leverage.
The final robustness check replicates the analysis with all of the outliersincluded. The results, reported in Panel 6 in Table IX, continue to point to thehot-market effect in the IPO year and its subsequent reversal.
IV. Conclusion
This paper analyzes the capital structure implications of equity market tim-ing. While previous studies find convincing evidence of timing attempts byfirms, quantifying the extent to which timing considerations affect financingactivity has proved more problematic: commonly used measures of market tim-ing typically correlate with other determinants of financing policy. This is es-pecially troubling when studying the link between timing attempts and capitalstructure dynamics.
In this paper, I propose initial public offerings as a natural place to look formore robust measures of market timing. The pronounced cycle in IPO volume,and the fact that the peaks of this cycle attract firms from a wide spectrum ofindustries, make the IPO market an excellent laboratory to detect market tim-ing effects. The empirical analysis confirms this view. Market timers, identifiedas firms that go public when the market is hot, issue substantially more equitythan cold-market firms do. The hot-market effect is remarkably robust; it hasalmost no relationship to firm- and industry-level characteristics. Further testsregarding issuers’ starting leverage, investment and dividend policies, and cash
The Impact of Market Timing on Capital Structure 1709
balances are all consistent with the idea that the hot-market effect on equityissues is indeed driven by market timing.
Not surprisingly, the short-term impact of these timing attempts on capitalstructure is negative. Hot-market firms experience a greater decline in theirleverage ratios in the IPO year. Also, their leverage levels are too low to beexplained by the underlying firm characteristics. The negative impact quicklyreverses, however. Immediately following their IPOs, hot-market firms startissuing significantly more debt and less equity than cold-market firms do. Asa result of this active reversal policy, the leverage ratios of hot-market firmsincrease significantly in the 2 years following the IPO. In contrast, cold-marketfirms appear to be content with the leverage ratios they attain at the IPO. By theend of the second year, the hot-market effect on leverage completely vanishes.Overall, the results show that market timing is an important determinant offinancing activity in the short run, but its long-run effects are limited. Firms’capital structure policies in the long term appear to be largely consistent withthe existence of leverage targets.
REFERENCESAsquith, Paul, and David W. Mullins, 1986, Equity issues and offering dilution, Journal of Financial
Economics 15, 61–89.Baker, Malcolm, and Jeffrey Wurgler, 2002, Market timing and capital structure, Journal of Fi-
nance 57, 1–32.Fischer, Edwin O., Robert Heinkel, and Josef Zechner, 1989, Dynamic capital structure choice:
Theory and tests, Journal of Finance 44, 19–40.Graham, John R., and Campbell R. Harvey, 2001, The theory and practice of corporate finance:
Evidence from the field, Journal of Financial Economics 60, 187–243.Helwege, Jean, and Nellie Liang, 2004, Initial public offerings in hot and cold markets, Journal of
Financial and Quantitative Analysis 39, 541–569.Hennessy, Christopher A., and Toni M. Whited, 2004, Debt dynamics, Journal of Finance 60, 1129–
1165.Hovakimian, Armen, Tim Opler, and Sheridan Titman, 2001, The debt-equity choice, Journal of
Financial and Quantitative Analysis 36, 1–24.Ibbotson, Roger G., and Jeffrey F. Jaffe, 1975, “Hot issue” markets, Journal of Finance 30, 1027–
1042.Ibbotson, Roger G., Jody L. Sindelar, and Jay R. Ritter, 1988, Initial public offerings, Journal of
Applied Corporate Finance 1, 37–45.Ibbotson, Roger G., Jody L. Sindelar, and Jay R. Ritter, 1994, The market’s problem with the pricing
of initial public offerings, Journal of Applied Corporate Finance 7, 66–74.Jain, Bharat A., and Omesh Kini, 1994, The post-issue operating performance of IPO firms, Journal
of Finance 49, 1699–1726.Jalilvand, Abolhassan, and Robert S. Harris, 1984, Corporate behavior in adjusting to capital
structure and dividend targets: An econometric study, Journal of Finance 39, 127–145.Jung, Kooyul, Yong-Cheol Kim, and Rene M. Stulz, 1996, Timing, investment opportunities, man-
agerial discretion, and the security issue decision, Journal of Financial Economics 42, 159–185.Kayhan, Ayla, and Sheridan Titman, 2006, Firms’ histories and their capital structure, forthcom-
ing, Journal of Financial Economics.Korajczyk, Robert A., Deborah J. Lucas, and Robert L. McDonald, 1992, Equity issues with time-
varying asymmetric information, Journal of Financial and Quantitative Analysis 27, 397–417.Leary, Mark, and Michael R. Roberts, 2005, Do firms rebalance their capital structure, Journal of
Finance 60, 2575–2619.

1710 The Journal of Finance
Loughran, Tim, and Jay R. Ritter, 1995, The new issue puzzle, Journal of Finance 50, 23–51.Lucas, Deborah J., and Robert L. McDonald, 1990, Equity issues and stock price dynamics, Journal
of Finance 45, 1019–1043.Marsh, Paul, 1982, The choice between equity and debt: An empirical study, Journal of Finance
37, 121–144.Mikkelson, Wayne H., Megan Partch, and Kshitij Shah, 1997, Ownership and operating perfor-
mance of companies that go public, Journal of Financial Economics 44, 281–307.Myers, Stewart C., and Nicholas S. Majluf, 1984, Corporate financing and investment decisions
when firms have information that investors do not have, Journal of Financial Economics 13,187–221.
Pagano, Marco, Fabio Panetta, and Luigi Zingales, 1998, Why do companies go public? An empiricalanalysis, Journal of Finance 53, 27–64.
Rajan, Raghuram G., and Henri Servaes, 1997, Analyst following of initial public offerings, Journalof Finance 52, 507–529.
Rajan, Raghuram G., and Luigi Zingales, 1995, What do we know about capital structure? Someevidence from international data, Journal of Finance 50, 1421–1460.
Ritter, Jay R., 1984, The “hot issue” market of 1980, Journal of Business 57, 215–240.Ritter, Jay R., 1991, The long-run performance of initial public offerings, Journal of Finance 42,
365–394.Taggart, Robert A., 1977, A model of corporate financing decisions, Journal of Finance 32, 1467–
1484.Titman, Sheridan, and Sergey Tsyplakov, 2003, A dynamic model of optimal capital structure,
Working paper, University of Texas at Austin.Titman, Sheridan, and Roberto Wessels, 1988, The determinants of capital structure choice, Jour-
nal of Finance 43, 1–19.