how slow pages hurt the entire user experience: understanding the neurological impact of poor...
TRANSCRIPT

Tammy Everts
RWD Summit – April 2014
How Slow Pages Hurt
the Entire User Experience
Understanding the neurological impact
of poor performance

It’s a mobile-first world.

Slide 3
55% of all time spent on retail sites takes place on a mobile device.
comScore, October 2013

Slide 4

Slide 5
Stuart McMillan, Schuh’s Journey to RWD (Conversion Conference 2013)

Four all-too-common
mobile assumptions

Slide 7
Assumption #1
My site isn’t slow on mobile.

Radware, 2013 State of the Union: Mobile Ecommerce Performance
Slide 8

Radware, 2013 State of the Union: Mobile Ecommerce Performance
Slide 9

Two things are slowing down your site for mobile
(and they’re completely beyond your control).
• Latency – can range
from 35 milliseconds
to 350+ milliseconds
per resource (e.g. images,
CSS files)
• Connection – 3G can be
up to 15 times slower
than broadband
Slide 10

RWD is awesome, but it *can* come
with performance penalties.
Slide 11

Assumption #2
Mobile users expect pages to be slow.
Slide 12

Keynote, 2012 Mobile User Survey
Slide 13

Slide 14
Assumption #3
Mobile users want to browse, not buy.

Slide 15
By 2017, retail mcommerce is expected to hit $113 billion – 26% of total ecommerce sales.
eMarketer, September 2013

Mobile shopping cart abandonment rate is 39% greater than desktop rate.
2013 Google I/O
Slide 16

Slide 17
Assumption #4
Users will stick around, even if pages
are slow, if they really want to buy.

Skava/Harris Interactive, 2013
Slide 18

Slide 19
Case study: The impact of HTML delay on mobile business metrics

Why neuroscientific mobile testing?
Slide 20
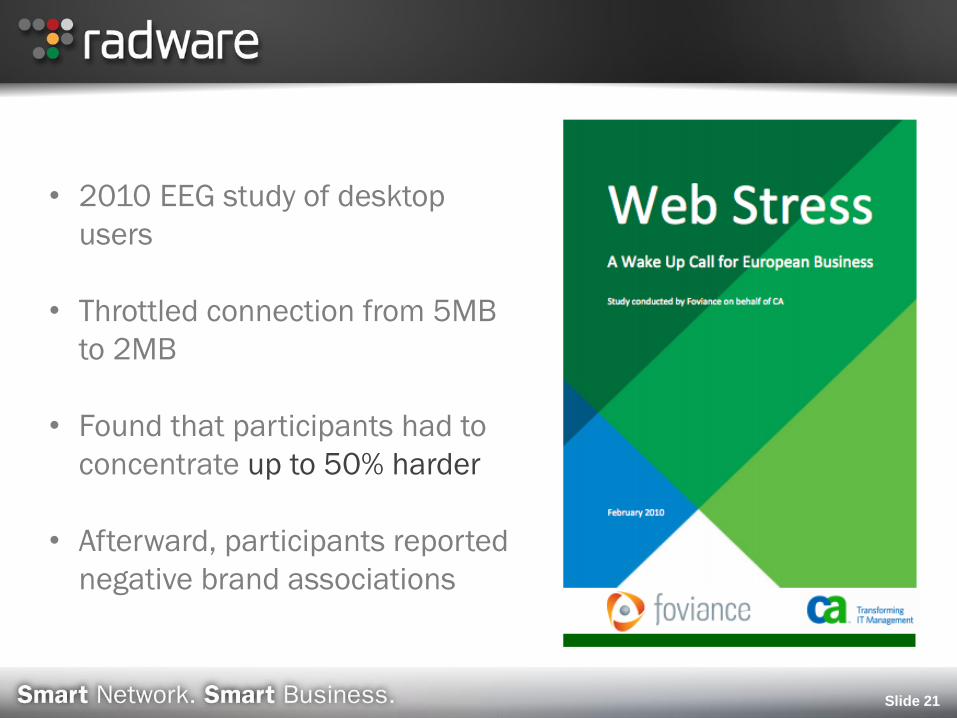
Slide 21
• 2010 EEG study of desktop
users
• Throttled connection from 5MB
to 2MB
• Found that participants had to
concentrate up to 50% harder
• Afterward, participants reported
negative brand associations

Slide 22

Slide 23

What is emotional
engagement research?

“95% of the consumer’s
decisions are made at the
subconscious level.”
Dr. Gerald Zaltman, Harvard UniversityExecutive Committee of Harvard University’s
Mind, Brain and Behavior Interfaculty Initiative
Slide 25
The problem with surveys…
Traditional research relies on eliciting post-cognitive
responses.
But thinking and talking about emotions changes and
distorts them.
Slide 26

Five benefits of neuroscientific testing
1 Evaluates think/feel (not say)
2 Quantified data
3 Moment-by-moment interaction
4 Cause-and-effect triggers
5 Fresh, deeper insights
Slide 27

EEG Emotional Engagement Study

Our research team
• Seren – leaders in customer experience & service design
• NeuroStrata – expert consultants in blending neuromarketing
applications
• Neurosense – global leader in implicit methodologies
Slide 29
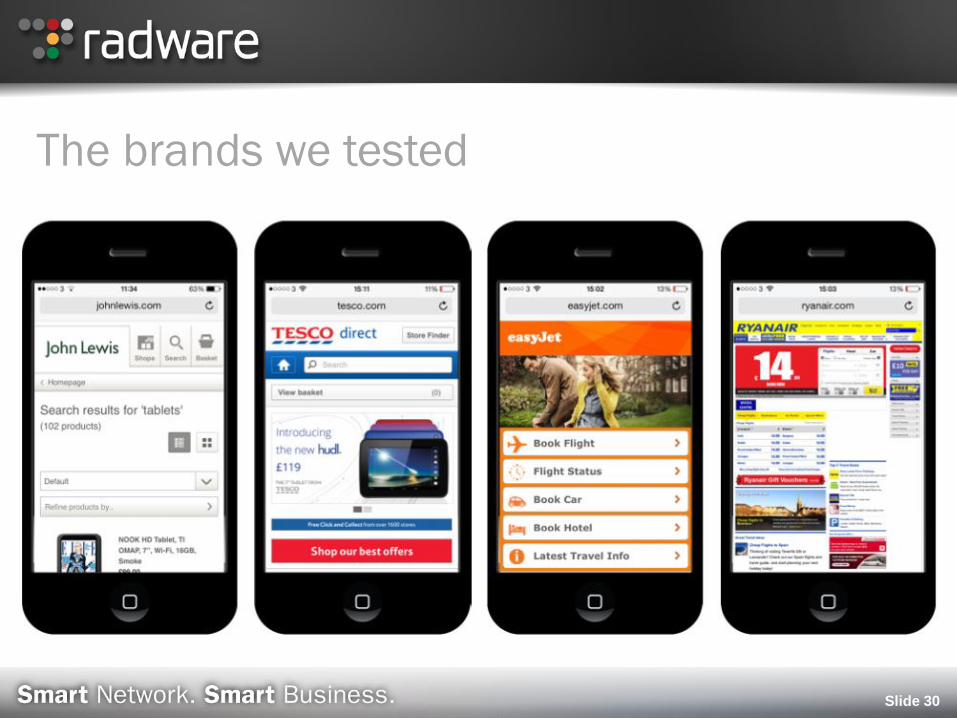
The brands we tested
Slide 30

Our testers
• 24 testers (12 male and 12 female)
• Pre-screened to ensure normal cognitive functioning
• Experienced mobile device users
• Did not know they were part of a performance study
Slide 31

Methodology
• Standardized set of shopping tasks (browsing and checkout)
• Testers served sites over one of two speeds:
– normal Wifi
– artificial 500ms delay
• Using EEG headset and eyetracker, measured moment-by-
moment responses
Slide 32

Slide 33

Slide 34
Why test a 500ms delay?
Case study: The impact of HTML delay on mobile business metrics

Slide 35
We focused on the metrics most affected by the 500ms delay.
Frustration
Emotional engagement

Slide 36

Normal speed
Slide 37
2.66s 2.92s 2.83s 4.24s

Frustration levels across sites (normal speed)
Slide 38
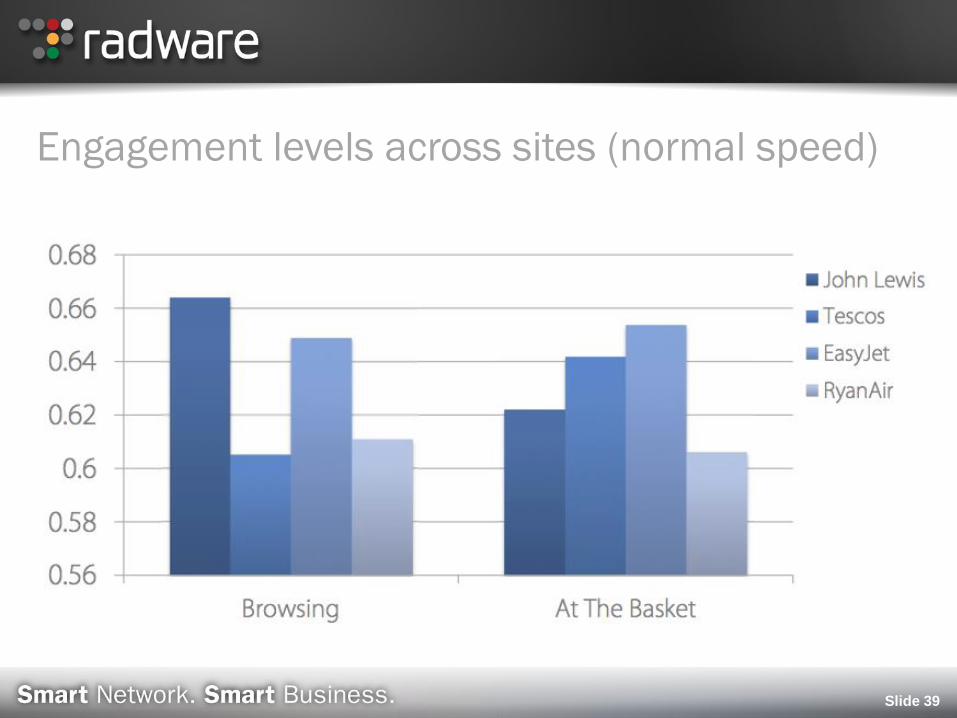
Engagement levels across sites (normal speed)
Slide 39

500ms delay: Peak frustration results
Slide 40

500ms delay: Average engagement results
Slide 41
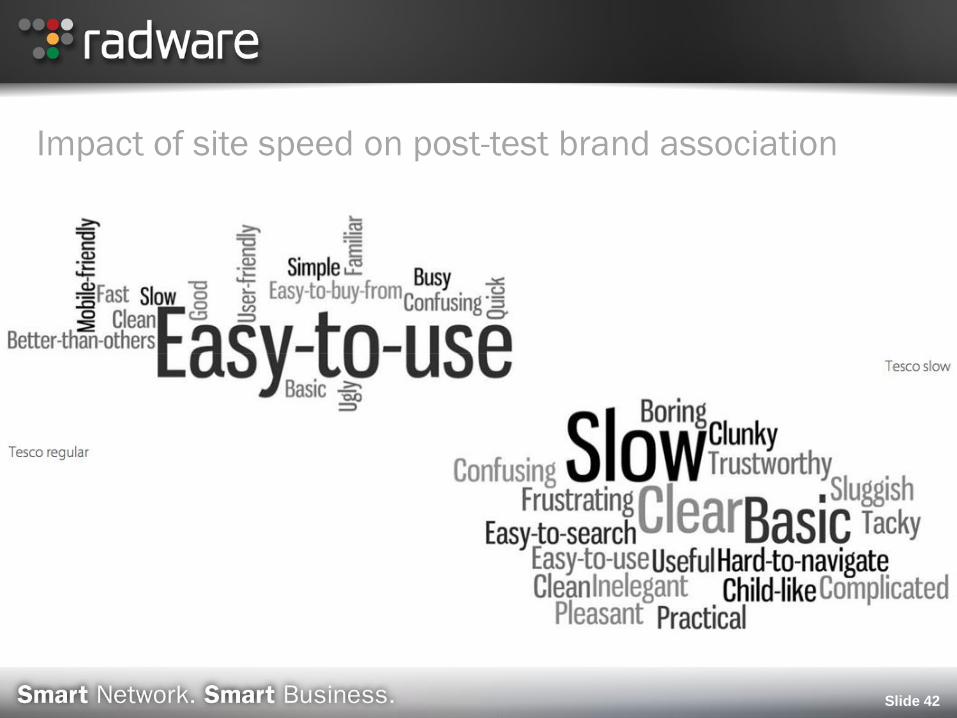
Impact of site speed on post-test brand association
Slide 42

If pages aren’t fast, everything suffers.
Content “boring”
Visual design “tacky” and “confusing”
Navigation “frustrating” and “hard-to-navigate”
Slide 43

Slide 44

Takeaways

1 People feel “web stress” even when shopping under ideal
conditions.
2 Slower web performance has a clear and measurable impact
on people at a neurological level.
3 Slow sites can seriously undermine overall brand health.
4 The nature and scale of impact varies, depending on a
number of factors (e.g. inherent strength/weakness of brand).
5 This presents great opportunities to strengthen overall brand
by investing in performance optimization.
Slide 46

Slide 47

http://www.radware.com/mobile-eeg2013/
Slide 48

Sources
Web Stress: A Wake-Up Call for European Business (Foviance, 2010)
http://www.ca.com/us/~/media/files/supportingpieces/final_webstress_survey_report_229296.aspx
2013 Social & Mobile Commerce Consumer Report (Shop.org / comScore)
http://shop.org/research/original/2013-social-mobile-commerce-consumer-report
2012 Mobile User Survey (Keynote)
http://www.keynote.com/docs/reports/Keynote-2012-Mobile-User-Survey.pdf
2013 State of the Union: Mobile Ecommerce Performance (Radware)
http://www.radware.com/mobile-sotu2013/
The Danger of a Poor Mobile Shopping Experience [INFOGRAPHIC]
http://www.getelastic.com/the-danger-of-a-poor-mobile-shopping-experience-infographic/
Case study: The impact of HTML delay on mobile business metrics (Web Performance Today, November 2011)
http://www.webperformancetoday.com/2011/11/23/case-study-slow-page-load-mobile-business-metrics/
Slide 49

webperformancetoday.com
twitter.com/tameverts
linkedin.com/in/tammyeverts
plus.google.com/+TammyEverts/
Slide 50
Questions?