how spatial constraints on efficacy and dynamic signaling
TRANSCRIPT

How Spatia l Constraints on Efficacy and Dynamic Signa ling Alignment Shape A nimal Communication
How Spatial Constraints on Efficacy and Dynamic Signaling Alignment Shape Animal
Communication
by
Sebastian Alejandro Echeverri
B.S. in Biology and Applied Physics, University of Miami, 2013
Submitted to the Graduate Faculty of the
Dietrich School of Arts and Sciences in partial fulfillment
of the requirements for the degree of
Doctor of Philosophy
University of Pittsburgh
2020

ii
Committee Page
UNIVERSITY OF PITTSBURGH
DIETRICH SCHOOL OF ARTS AND SCIENCES
This dissertation was presented
by
Sebastian Alejandro Echeverri Becerra Osorio
It was defended on
May 21, 2020
and approved by
Dr. Walter Carson, Associate Professor, Department of Biological Sciences, University of
Pittsburgh
Dr. Mark Rebeiz, Associate Professor, Department of Biological Sciences, University of
Pittsburgh
Dr. Tia-Lynn Ashman, Distinguished Professor, Department of Biological Sciences, University
of Pittsburgh
Dr. Nathan Morehouse, Associate Professor, Department of Biological Sciences, University of
Cincinnati
Dissertation Advisor: Dr. Corinne Richards-Zawacki, Associate Professor, Department of
Biological Sciences

iii
Copyright © by Sebastian Alejandro Echeverri Becerra Osorio
2020

iv
Abstract
How Spatial Constraints on Efficacy and Dynamic Signaling Alignment Shape Animal
Communication
Sebastian Alejandro Echeverri, PhD
University of Pittsburgh, 2020
Effective communication is important to the survival and reproduction of many organisms.
Signal transmission and reception have spatial constraints that interact to determine effectiveness.
Signals are often best perceived from specific angles, and sensory systems may be limited in their
ability to detect or interpret incoming stimuli from certain directions. Alignment between these
directional biases can be critical to effective communication. Misalignment of either signal or
sensor may disrupt signal perception. Signals also degrade during the distance traveled from
signaler to receiver. Thus, how animals position themselves during communication may be under
selection. Despite this, we know little about the spatial arrangement of signalers and receivers,
what behaviors influence positioning, or the causes and consequences of variation in positioning.
To address this fundamental gap in knowledge, I developed a geometric framework for studying
the spatial constraints of communication and how they shape positioning across visual, sound, and
chemical signaling. To investigate respective roles of signaler and receiver in managing these
spatial constraints, I then characterized the spatial dynamics of visual signaling in the jumping
spider Habronattus pyrrithrix. Males perform an elaborate courtship dance which includes arm
waves and colorful ornaments; the latter are not visible from the side. The female can only perceive
colors of male displays when they are presented in her frontal field of view. I recorded relative
positions and orientations of both actors throughout courtship and established the role of each sex
in maintaining signaling alignment. Finally, I tested how males control female orientation, and

v
respond to signaling challenges. Using video playback, I asked how males’ arm-waving display
and the visual environment determine how effectively they attracted female attention, as well as
how males respond to variation in their signaling environment. These studies reveal that signaling
alignment is frequently disrupted by females turning away from males, but that male arm-waving
effectively re-captures her attention. Males also modulate displays in response to changing spatial
and environmental conditions. Overall, this dissertation reveals the widespread role of spatial
constraints in driving signaling behavior, and demonstrates that the spatial arrangement of signaler
and receiver must be managed dynamically through behavioral responses.
vi
Table of Contents
Preface .......................................................................................................................................... xii
1.0 Signals in Space: Geometry as a Framework to Analyze the Inherent Spatial
Constraints on Communication Efficacy .................................................................................... 1
1.1 Introduction .................................................................................................................... 1
1.2 Geometry of Visual Communication ............................................................................ 4
1.2.1 Viewing Distance ..................................................................................................5
1.2.2 Directionality of Visual Signals .........................................................................12
1.2.3 Directionality of Sight ........................................................................................21
1.2.4 Positioning within the Visual Environment .....................................................24
1.2.4.1 Directional Illumination ........................................................................ 25
1.2.4.2 Physical Structures ................................................................................ 28
1.2.4.3 Visual Background ................................................................................ 29
1.2.5 Critical Needs and Opportunities .....................................................................31
1.3 Geometry of Sound Communication .......................................................................... 33
1.3.1 Distance of Sound Communication ..................................................................34
1.3.2 Directionality of Sound Signals .........................................................................38
1.3.3 Directionality of Sound Sensors ........................................................................43
1.3.4 Positioning within the Sound Environment .....................................................44
1.3.5 Critical Needs and Opportunities .....................................................................47
1.4 Geometry of Chemical Communication ..................................................................... 48
1.4.1 Fluid Flow and the Directionality of Semiochemical Movement ...................49

vii
1.4.2 Critical Needs and Opportunities .....................................................................52
1.5 Conclusions ................................................................................................................... 53
2.0 Control of Signaling Alignment During the Dynamic Courtship Display of a
Jumping Spider ........................................................................................................................... 63
2.1 Introduction .................................................................................................................. 63
2.2 Methods ......................................................................................................................... 69
2.2.1 Study Species and Maintenance ........................................................................69
2.2.2 Courtship Interactions .......................................................................................69
2.2.3 Interactions Between Live Males and Females ...............................................70
2.2.4 Interactions Between Live Males and Female Models....................................71
2.2.5 Video Analysis ....................................................................................................72
2.2.6 Statistical Methods .............................................................................................73
2.3 Results ............................................................................................................................ 75
2.3.1 Interactions Between Live Males and Females ...............................................75
2.3.2 Interactions Between Live Males and Female Models....................................79
2.4 Discussion ...................................................................................................................... 81
2.4.1 Control of Signaling Alignment ........................................................................81
2.4.2 Implications for Communication ......................................................................82
2.4.3 Selection for Control of Receiver Attention.....................................................83
2.4.4 Signaling Behavior in Response to Spatio-social Cues ...................................86
2.4.5 Conclusions .........................................................................................................88
2.5 Acknowledgements ....................................................................................................... 89
2.5.1 Funding Statement .............................................................................................89

viii
3.0 Jumping Spider Adjusts Attention-Grabbing Display to Spatial and
Environmental Context .............................................................................................................. 90
3.1 Introduction .................................................................................................................. 90
3.2 Methods ......................................................................................................................... 95
3.2.1 Collection and Maintenance ..............................................................................95
3.2.2 Video Playback Experiments ............................................................................98
3.2.3 Stimulus Design ..................................................................................................99
3.2.4 Female Response to Waving Displays from Walking Males (WW Experiment)
.....................................................................................................................................100
3.2.5 Female Response to Waving Displays in Different Visual Environments (SW
Experiment) ...............................................................................................................101
3.2.6 Measurement of Female Responses ................................................................101
3.2.7 Male Courtship in Different Visual Environments .......................................102
3.2.8 Statistical Methods ...........................................................................................104
3.3 Results .......................................................................................................................... 106
3.3.1 Female Response to Waving Displays in Different Visual Environments (SW
Experiment) ...............................................................................................................106
3.3.1.1 Female Responses to Waving vs Non-Waving Males ....................... 106
3.3.1.2 Effect of Background on Female Responses ..................................... 108
3.3.2 Female Response to Waving Displays from Walking Males (WW
Experiment) ...............................................................................................................109
3.3.3 Male Courtship in Different Visual Environments .......................................111
3.4 Discussion .................................................................................................................... 114

ix
3.4.1 Waving Displays as Alerting Signals ..............................................................114
3.4.2 Effect of Background Motion ..........................................................................115
3.4.3 Contextual Plasticity in Waving Displays ......................................................117
3.4.4 Implications for Mate Choice ..........................................................................120
3.4.5 Conclusions .......................................................................................................121
3.5 Acknowledgements ..................................................................................................... 122
3.5.1 Funding Statement ...........................................................................................123
4.0 Conclusions .......................................................................................................................... 124
Appendix A Supplement to Chapter 3 .................................................................................... 127
Bibliography .............................................................................................................................. 134

x
List of Tables
Table 1. The elements of signal geometry, their causes, consequences, and key examples .. 60
Table 2. Modeling of proportion of turns towards waving male .......................................... 110
Appendix Table 1. Modeling of total turns (SW experiment) .............................................. 127
Appendix Table 2. Modeling of number of turns to waving male (SW experiment).......... 128
Appendix Table 3. Modeling of direction of first choice (SW experiment) ......................... 129
Appendix Table 4. Modeling of total tuns (WW experiment) .............................................. 130
Appendix Table 5. Modeling of number of turns to waving male (WW experiment) ........ 131
Appendix Table 6. Modeling of direction of first choice (WW experiment) ....................... 132
Appendix Table 7. Modeling of proportion of turns to waving male (WW experiment) ... 133
xi
List of Figures
Figure 1. Visual signal appearance is affected by viewing distance and receiver acuity ....... 7
Figure 2. Visual signal appearance is affected by viewing direction ..................................... 15
Figure 3. Visual signal directionality is affected by signal properties ................................... 16
Figure 4. The mechanism of sound transmission changes with distance ............................... 35
Figure 5. Variation in sound signal directionality can be associated with function ............. 41
Figure 6. Fluid flows often control the directionality of chemical signals ............................. 51
Figure 7. Habronattus pyrrithrix courtship ............................................................................. 68
Figure 8. Signaling alignment during courtship ...................................................................... 76
Figure 9. Timing of 'knee-pop' displays .................................................................................... 78
Figure 10. Male responses to female looking away .................................................................. 80
Figure 11. Habronattus pyrrithrix courtship and experimental design .................................. 97
Figure 12. Female responses to competitng male stimuli ...................................................... 108
Figure 13. Female responses in different visual environments ............................................. 112
Figure 14. Males adjust waving displays with distance to receiver ...................................... 113
Figure 15. Male displays in different visual environments ................................................... 114

xii
Preface
I dedicate this dissertation to two people who have shaped my life and supported me
wholeheartedly. First is my mother, Julia Becerra, who worked tirelessly to create a life where I
could follow my curiosity as far as it would lead me. Second is my partner, Stella Chung, who
kept me going through the many moments where I could not imagine how I could continue, and
who continues to make me smile more than I ever have. I am incredibly lucky to have both of them
in my life.
There are many more people whose kindness, hard-work, and inspiration I need to
acknowledge. My father, Leon Echeverri, my aunts, Molly and Grecia Becerra, and my
grandmother, Ana Osorio, for raising me. My aunt, Nancy Velez, for watching over me and
teaching me how to be a thoughtful person. My cousins, Christian and Daniel Forero, for
welcoming me as the nerd of our trio. My grandparents, Abuelo y Abuelita Echeverri, whose
Colombian bakery in Jackson Heights was our family’s foothold when we moved to the USA.
I have been lucky to have many wonderful teachers who helped me grow as a scholar and
a person. My 3rd grade teacher, Mrs. Sawicki, who kept a menagerie of class pets and encouraged
me (and all of her students) to care for animals and observe their behavior. My high school
Japanese language teacher, Helinski-sensei, who taught me how to study rigorously, challenge
myself, and seek joyfulness. Several of my professors at the University of Miami, Drs. Bill Searcy
and Keith Waddington, who introduced me to the wonders of animal behavior, especially as a field
of study. Dr. Gavin Leighton, who took a chance and hired me for my first research position.
My research has only been possible through the guidance and collaboration of many
wonderful people. My first PhD advisor, Dr. Nate Morehouse, who showed me a video of a

xiii
dancing jumping spider in a happenstance meeting, and got all of this started by welcoming me
into the lab. Dr. Daniel Zurek, who led us on several spiderhunts across the American Southwest,
and who taught me the basics of macro photography. Dr. Nathan Brouwer, without whom I would
still be trying to learn R on my own. My second advisor, Dr. Cori Richards-Zawacki, who took
me in during uncertain times, and never stopped supporting me, even when all my experiments
failed. My committee members, Dr. Walt Carson, Dr. Tia-Lynn Ashman, and Dr. Mark Rebeiz,
who helped refine my ideas and scholarship. Dr. Melissa Plakke, Dr. Lisa Limeri, Dr. Yusan Yang,
Veronica Saenz, Layla Freeborn, Kim Howell, Dr. Elizabeth Agosto, Rachel Coombs, Dr.
Michelle Spicer, Mariah Denhart, Cassie Olmsted, James LL Lichtenstein, Jahree Sosa, Elizabeth
Amarh, and the many other fellow graduate students who I’ve turned to for academic and
emotional support. I also need to thank the many undergraduate student researchers who I have
had the honor to work with for their dedication to spider science: Taha Ahmed, Zareen Amin,
Sinjon Bartel, Patrick Butler, Corey Forman, John Goté, Abigail Jarret, Ciara Kernan, Julia
Kerstetter, Alex Lysiak, Emily Liu, Margaret Mass, Nicholas Russo, Emma Schanzenbach, Riley
Timbs, Violet Xu, Stanton Young, Wenyu Zang, and Zachary Zimmer, and Wenyu Zang.
The friendship, mentoring, and academic support I’ve found within the community of
arachnologists has been truly incredible, and I am proud to be a part of it. I would like to thank Dr.
Wayne Maddison, Dr. Damian Elias, Dr. Beth Jakob, Dr. Skye Long, and Dr. Lisa Taylor for their
expertise and enthusiasm for the wonderful world of Habronattus jumping spiders. Dr. Catherine
Scott and Sean McCann, whose friendship and boundless joy for spiders has been a much-needed
bright part of the world. Aleck Pang, who along with many others, helped me join the wonderful
community of People Who Post About Spiders on Twitter. And Dr. Shakira Quinones, Dr.

xiv
Mercedes Burns, Dr. Chris Hawn, Leticia Classen Rodriguez, and the many other BIPOC
arachnologists who remind me every day that I am not alone.
I would also like to acknowledge the many who helped me grow as an educator and science
communicator. Dr. Valerie Oke, Dr. Sam Donavan, Dr. Kate Gardner, and the rest of the Teaching
Minor program, as well as my teaching mentors, Dr. Alison Slinskey-Legg, Becky Gonda, and Dr.
Nathan Brouwer. Dr. Daniel Wetzel, Dr. Lew Jacobson, Dr. Nancy Kaufman, Dr. Jeffrey
Lawrence, and the other professors I have had the joy of teaching with and learning from. Dr.
Maria Wheeler-Dubas, who helped me get started with outreach. Dr. Kristin Lewis and the rest of
the staff behind the AAAS Mass Media Fellows program, along with my fellow 2019 Fellows.
Charlotte Sutton, Tom Avril, Frank Kummer, Aneri Pattani, and the rest of the (former) SMASH
desk at the Philly Inquirer, who welcomed me and my spiders to the newsroom.
I would like to thank Dr. Melissa Plakke, Douglas Hall, Dr. Elizabeth Agosto, and Sam
Agosto for the wonderful friendship full of board game nights and gossip over Japanese TV shows.
I would like to thank Sarah Henry, Ryan Chapman, Emily Alden, Helen Stanley, Anna Wenner,
Hanna Takeuchi, Sam Logan, Sam Ewy, Kevin Powell, Brian Murphy, Mariah Denhart, and
Rebecca White for delight that it’s been to explore various fantasy worlds together in our
Dungeons & Dragons games. Finally, I would like to thank my pet spiders for keeping me company
through the many late nights of writing, and Steve Irwin, for teaching me that every animal is
wonderfully weird and beautiful.

1
1.0 Signals in Space: Geometry as a Framework to Analyze the Inherent Spatial
Constraints on Communication Efficacy
1.1 Introduction
Communication of information between two separate individuals is crucial to many key
ecological functions (e.g., contests over resources, coordination of social behavior, mating), and
the traits and behaviors involved in communication are incredibly diverse (Bradbury and
Vehrencamp 2011). What selective pressures drive the evolution of signals and signaling
interactions? The theory of sensory drive states that communication systems may evolve under
selection for effective transmission and reception of signals, as shaped by the constraints and biases
imposed by the species’ physiology and sensory ecology (J. A. Endler 1992; 1993a; J. A. Endler
et al. 1998; 2005). Selection will favor signal traits and signaling behaviors that improve how
effectively a signal travels through the environment from signaler to receiver, and/or the likelihood
that a receiver’s sensory system will detect the signal and act on the information as intended (i.e.,
increases in signal efficacy). For example, signalers may be under selection to sing at a pitch that
stands out in contrast with other concurrent or frequent noises (Nemeth and Brumm 2009). Or,
signalers may be under selection to display with the same colors that receivers’ visual systems
have evolved to seek out in the environment (e.g., those associated with food (Kolm et al. 2012)).
In the 28 years since sensory drive theory was proposed, a robust body of research has provided
strong evidence for how constraints such as ambient light (Terai et al. 2006; J. A. Endler 1993b),
background noise (Slabbekoorn and Smith 2002), and receiver sensory biases (Cole and Endler
2018; Makowicz et al. 2015; Ninnes et al. 2015) shape signal evolution via selection for efficacy

2
(reviewed in (Cummings and Endler 2018)). However, spatial constraints inherent to each step of
communication may also have consequences for signal efficacy, and we know comparatively little
about how these shape selection on signals and signaling behavior.
Signal transmission and reception can often be spatially heterogenous. Signals may
transmit better in certain directions than others, and degrade as they travel the distance from
signaler to receiver (Bradbury and Vehrencamp 2011; G. G. Rosenthal 2007). Likewise, receivers
may only be able to a detect signals, or be more or less sensitive to different types of stimuli, if
they arrive from certain directions (Michael F Land and Nilsson 2012; M. F. Land 1999; Kühne
and Lewis 1985; Rosowski 1994; Bradbury and Vehrencamp 2011). Environmental conditions,
such as physical obstructions and movement of the transmission medium, may distort a signal,
change its directional of travel, and/or block transmission entirely (Book et al. 2012; D. R. Webster
and Weissburg 2009; Pijanowski et al. 2011; G. G. Rosenthal 2007).
For example, consider the spatial constraints faced by a male Anna’s hummingbird
(Calypte anna) when displaying at conspecifics who enter his territory. Males perform “aerial
power dives” at target conspecifics while presenting their brilliant purple feathers (Hamilton
1965). However, these feathers only cover a forward-facing patch on his head (the gorget), and so
are not visible from some angles. In addition, these colorful feathers are iridescent, meaning that
their brightness and color depends on angle of incident sunlight relative to the surface of the
feathers; from the wrong angle, the gorget appears completely black. Hamilton (1965)
hypothesized that if males are under selection to maximize the visibility of their purple feathers to
a target individual, they may experience selection on their spatial positioning during
communication. A male must direct his gorget towards the target and manage his position with
respect to both the target and the sun to maintain an appropriate angle of illumination (Hamilton

3
1965). In addition to these directional constraints on signal transmission, how a male’s display is
perceived is also a function of where the target is looking. Depending on where the displaying
male appears within the target’s field of view, his purple feathers may only be seen peripherally,
or not at all. As a result, moment-to-moment changes in how signaler and receiver position
themselves relative to each other and the environment can strongly affect signal efficacy, and thus
such positioning may itself be a target of selection. Indeed, recent work on related iridescent
hummingbirds shows that how males orient and position themselves has evolved to directly
manage the spatial constraints of his display (Simpson and McGraw 2018a; 2018c; Hogan and
Stoddard 2018).
Analogous geometric constraints exist for other visual signals, as well as sound and
chemical communication (R. H. Wiley and Richards 1982; Muller-Schwarze 2006; D. R. Webster
and Weissburg 2009; Bradbury and Vehrencamp 2011). Despite this, much previous work on
animal communication has implicitly relied on assumptions about one or more of the geometric
considerations discussed above. Signalers are assumed to direct their displays at the receiver
throughout communication. Receivers are likewise assumed to have a relatively constant sensory
perception of the display without looking away or turning away. While the role of coarse-scale
environmental features in shaping communication traits have been the subject of rigorous study,
how animals position themselves within these environments on fine spatial and temporal scales
has received much less attention. Such assumptions may have begun as necessary steps to facilitate
the study of complex signaling interactions. However, by continuing to ignore the consequences
of directional constraints, we underestimate the challenges involved in effective visual
communication and therefore the axes along which selection may act. Thus, we have a limited
understanding of several fundamental questions on communication, including:

4
• What are the spatial constraints on effective communication?
• How do these constraints select for specific geometries of signaler and receiver within
the physical environment?
• How do signaler and receiver position and orient themselves during communication,
and what are the functional consequences for signaling outcomes?
• How does positioning behavior evolve, and potentially co-evolve, with spatial
constraints?
As these questions are fundamentally spatial in nature, we propose the development of a
framework based on the tools of geometry: a description of the spatial properties and arrangements
of elements in a system. The groundwork laid in the past few decades by separate ecological,
behavioral and physiological studies provides a powerful understanding of the physical and
ecological constraints experienced by signalers and receivers. We can quantify how a signal travels
in different directions, how it is modified en route via interactions with the environment, and how
well it is detected by the receiver’s sensory system depending on the angle of incidence. Combined
with modern improvements in tracking the position and orientation of actors, we can now analyze
the spatial aspects of signaling at each step of communication. In this chapter, we will outline the
critical elements of signaling geometry, review the compelling empirical evidence for their roles
in shaping communication, and propose directions for future study.
1.2 Geometry of Visual Communication
We begin with a survey of visual communication because this modality is subject to
especially strong geometric constraints. Light waves, unlike sound waves or diffusing chemical

5
signals, travel only in straight lines and cannot pass through most natural materials (Johnsen 2012).
As a result, signal and sensor directionality both have strict boundaries, and visual communication
typically operates on the eponymous “line of sight.” Light from a signal must be able to follow an
unobstructed path to the receiver’s eye, and the receiver must be looking towards that incoming
light. A robust body of visual physiology research has described the spatial constraints on how
eyes perceive for many systems (Michael F Land and Nilsson 2012; Johnsen 2012), and over years
of iterative work, researchers have developed effective methodologies for measuring signal
directionality (e.g., (White, Zeil, and Kemp 2015; Santos et al. 2007; Meadows et al. 2009)). By
integrating these pieces, we are now able to rigorously investigate how the positioning of signaler
and receiver during communication affect signal efficacy.
1.2.1 Viewing Distance
The appearance, perception, and even function of visual signals can change dramatically
with the distance between signal and receiver (termed here and in the literature as “viewing
distance”, “receiver distance”, or “communication distance”). As this viewing distance increases,
the image of the signal formed in a receiver’s eye grows smaller, and takes up less of their field of
view. Smaller images are detected by fewer photoreceptors, and as a result, the receiver loses some
ability to distinguish details within the signal (Michael F Land and Nilsson 2012; E. M. Caves,
Brandley, and Johnsen 2018; Bradbury and Vehrencamp 2011; Cronin et al. 2014). As distance
increases and details blur together, contrast between the signal and its surroundings can also
decrease. Eventually, with enough distance, the receiver will not be able to tell the signal apart
from other nearby stimuli. Signal perception can also become compromised if the distance
between signaler and receiver is outside of the range within which the receiver’s eye can focus on

6
objects. If the distance between the signaler and receiver is smaller than the minimum focusing
distance, or greater than the maximum focusing distance, the result is a blurry image (Michael F
Land and Nilsson 2012). All else being equal, smaller and/or blurrier signals compromise visual
information transfer and tend to be less salient (Fig. 1, (Michael F Land and Nilsson 2012; E. M.
Caves, Brandley, and Johnsen 2018)). In addition, signals seen at an extremely close range may
not “fit” within the receiver’s field of view and therefore may not be visible in their entirety. Thus,
we can generally expect signal efficacy to be influenced by distance from receiver, to decrease
with increasing distance, but with species-specific variation depending on focusing range and the
physical size of the signal. It follows that signalers are likely under selection to (a) assess receiver
distance, (b) compensate for effects of viewing distance through changes in signal properties
and/or usage, and (c) control viewing distance by moving either themselves and/or the receiver.
Several mechanisms exist that allow signalers to estimate object distance either visually,
and/or via cues from other senses (e.g., sound or olfaction), and these are reviewed elsewhere
(Naguib and Wiley 2001; Michael F Land and Nilsson 2012; Cronin et al. 2014). While the
mechanisms may vary among species, evidence of distance-dependent signaling behavior
indicates that signalers can and do use this type of spatial information during communication.
Signalers can actively change their visual displays to improve signal saliency at different distances.
This active distance-dependent signal modification has been most studied in species that use
movement-based displays. In these systems, signalers generally increase the intensity of their
movements for more distant receivers. For example, in the jumping spider Habronattus pyrrithrix,
males increase the amplitude of the arm-waving display of their courtship dance when further from
the female (Chapter 3). Likewise, signaling males of the lizard Anolis gundlachi respond to

7
Figure 1. Visual signal appearance is affected by viewing distance and receiver acuity
Estimated views of orbweaver stabilimentum by three potential receivers, adapted from (Caves, Brandley,
and Johnsen 2018). As viewing distance increases, signals appear blurrier, but the maximum range of
detectability depends on the visual acuity of the signaler. Differences in color vision are not represented here.
increased viewing distance by also increasing the amplitude of their head-bob display (Steinberg
and Leal 2013). In both cases, the signaler increases signal intensity approximately linearly with
distance, and this modulation increases salience (relative to an unmodified signal), but does not
fully compensate for the effect of viewing distance. This suggests possible limitations on signaling
plasticity, and/or the functional benefits of these adjustments. In A. gundlachi, the extent of signal
modulation seems to be matched to the amplitudes that best stimulate the species’ visual system
(Steinberg and Leal 2013). Signalers may also qualitatively change their signal in response to
viewing distance. For example, A. gundlachi males append an additional signal component to their
display when signaling at a farther distance (Steinberg and Leal 2013). Such facultative signal
modifications provide another option for signalers to compensate for distance, especially if
modulation of the primary signal may alter its information content.

8
We also note that signalers may employ distance-dependent signals for reasons other than
compensating for decreased salience at larger distances. For example, male fiddler crabs (Uca
perplexa) change their claw-waving display with distance, but, contrary to other examples,
increase display intensity as females approach. Males may do this to communicate different
messages at different viewing distances, or to avoid females misinterpreting their display as a
predator cue (How et al. 2008).
The taxonomic breadth of confirmed descriptions of distance-dependent visual signal
modification (jumping spiders, crabs, lizards) strongly suggests that this ability has evolved
repeatedly, and may be more common than current evidence suggests. For example, anecdotal
observations suggest that humans also engage in distance-dependent signal modification of a
movement-based signal; when waving arms to get others’ attention, signaling humans often
increase the speed and amplitude of their waves with increasing distance from intended receivers.
However, the extent of this behavior, and its impact on signal effectiveness, has yet to be tested.
We know even less about distance-dependent signaling for visual signals that are not movement-
based. Signalers capable of rapid color and pattern change (e.g., paradise whiptail fish,
chameleons, cuttlefish and other cephalopods; reviewed in (Hutton et al. 2015)) may use this
ability for signal modulation if certain colors are better able to reach a distant receiver, as in the
case in marine environments (see below).
Which features within a visual signal are most salient will also change with viewing
distance. At greater viewing distances, coarser-scale features will dominate the perceived image,
while at closer distances, fine-scale features are likely more noticeable. When the coarse-scale
and fine-scale features of display are sufficiently different, displays can have distance-dependent
appearances. Indeed, distance-dependent functions without the need for distance-dependent

9
behaviors or movement on the part of the signaler have been identified for a number of animal
signals (Kelley and Kelley 2014; Barnett and Cuthill 2014; Barnett et al. 2017). In humans, this
property of visual perception is used to create “hybrid-image” illusions, where one image
transitions into another as the viewer stands further away (or otherwise blurs their vision, such as
by squinting) (Kelley and Kelley 2014). In nature, this phenomenon allows signals to evolve to
simultaneously have two separate, often contradictory functions. Aposematic animals, for
example, use conspicuous colors and patterns to alert predators to their (purported) inedibility.
However, at greater distances, such displays may, through color mixing, end up being cryptic,
thereby serving as camouflage and allowing these animals to avoid detection at all. For example,
the striped aposematic patterns of many lepidopteran larvae (Barnett and Cuthill 2014; Barnett,
Cuthill, and Scott-Samuel 2018; Tullberg, Merilaita, and Wiklund 2005; Bohlin, Tullberg, and
Merilaita 2008), skunks (Caro 2013), and frogs (Barnett et al. 2018) have been shown to function
as aposematic markings up close, and as camouflage at a greater distance (e.g. “distance-dependent
defensive coloration” sensu (Barnett and Cuthill 2014)). Similarly, several species of reef fish have
pointillist coloration patterns: many small dots and stripes that are resolved as discrete, distinctly
colored elements from shorter distances but appear uniform and monochrome over long distances.
Such coloration allows for species discrimination at close range, but camouflage from more distant
predators (Marshall 2000; reviewed in Stevens 2007). It is likely that other species with bold
markings, either for aposematism or social communication, will benefit from distance-dependent
cryptic patterning, suggesting that these dual-function signals may be more common than the scope
of current work suggests.
Distance-dependent perception may also shape the evolution of signaling polymorphisms.
In the dimorphic jumping spider Maevia inclemens, males come in ‘grey’ and ‘tufted’ morphs,

10
which have specialized courtship displays that most effectively attract a female’s attention at
nearer versus farther viewing distances, respectively (David L Clark and Uetz 1993). As initial
viewing distance can vary between male-female encounters, and the initial capture of a female’s
attention strongly influences mating success, both morphs are able to persist in the species (David
L Clark and Biesiadecki 2002; D L Clark and Morjan 2001). However, whether this effect may
play a role in other polymorphic systems is an interesting question for future study.
Importantly, the strength of distance dependent effects (e.g., the rate at which images
become blurry with increasing distance) in any given signaling interaction depends largely on the
receiver’s visual system. Species with greater acuity (“sharper” vision as a result of larger eyes
and/or more densely packed photoreceptor arrays) will likely be able to perceive signals at greater
viewing distances (given that the eye is also capable of focusing the image at that distance;
(Michael F Land and Nilsson 2012). Visual acuity may thus limit the distances at which
communication can occur (i.e., the active space of a signal (H C Gerhardt 2017)). For example,
individual paper wasps (Polistes fuscatus) have unique facial markings, but the size of pattern
elements and the acuity of the species’ eyes indicates that individuals cannot visually recognize
each other beyond distances of 5.7cm at the most (Tibbetts 2002; E. M. Caves, Brandley, and
Johnsen 2018). Visual acuity can vary by three orders of magnitude between species, such that a
community of heterospecific receivers may have drastically different perception of a signal from
the same distance (Fig. 1, (reviewed in Caves, Brandley, and Johnsen 2018)). Species disparities
in visual acuity may also allow for semi-private communication channels—at certain viewing
distances, one species may be able to clearly perceive a signal, while another may perceive the
image differently, or not be able to detect it at all. For example, the bright white X-shaped webbed
decorations (“stabilimenta”) made by some orbweaver spiders are salient to an approaching bird,

11
but not a prey insect at the same distance, as a result of the disparity in acuity between the two
species. In this manner, the stabilimenta may be a warning signal to birds (so they avoid flying
into the web and damaging it), while not being visible to flying insects (E. M. Caves, Brandley,
and Johnsen 2018; Matthew J. Bruce, Heiling, and Herberstein 2005); but see (M. J. Bruce 2006)
for review of alternative hypotheses including prey attraction). Jellyfish may exploit a similar
acuity disparity to avoid destruction of their stinging tentacles by adult fish while remaining cryptic
to pelagic crustaceans and adult fish (E. M. Caves, Brandley, and Johnsen 2018).
Finally, the effects of viewing distance are also modified by environmental conditions.
Signal perception degrades more quickly with viewing distance in dim light than in bright light.
To compensate, male guppies (Poecilia reticulata) move closer to females when courting in
dimmer lighting (Long and Rosenqvist 1998). In addition, the quality and density of particles in
the transmission medium (e.g., in air or in water) will determine how light is scattered and/or
absorbed per unit distance. This attenuation effect further reduces the range of effective viewing
distance beyond that established by limits of the visual system. The transmission medium may also
interact with certain wavelengths of light such that some colors attenuate more quickly than others.
The rate of attenuation depends on particle density, and a result visual signals degrade more
quickly with distance when underwater than in air (Johnsen 2012; Cronin et al. 2014). However,
weather conditions (e.g., fog, rain, and dust storms) may transiently produce similar effects on
land. The sharp disparity in distance-dependent effects between air and land may create a unique
situation for amphibious signalers that are viewed in both environments, although this remains to
be investigated.

12
1.2.2 Directionality of Visual Signals
In addition to distance-dependent effects, the appearance of a visual signal often depends
on the direction from which it is viewed. This effect can result in strong selection on signalers to
manage the orientation of their signal relative to the receiver’s location (Bradbury and Vehrencamp
2011; G. G. Rosenthal 2007; Hutton et al. 2015). Consider the tail-fan display of a male peafowl.
For this forward-facing, approximately flat display, an appropriate measurement of the viewing
angle would be the angle between the vector from the receiver to the signaler and the perpendicular
vector from the center of the display (Fig. 2). When seen “head-on” (i.e., at a viewing angle of 0),
the elements of the display are fully visible with their familiar eyespots arrayed in a fan-like shape
(Fig. 2A). However, if the male were to turn towards the right, this display would be seen from an
increasingly skewed perspective. Eventually, the peacock is seen in profile (i.e., at a viewing angle
of 90 degrees), and the eye spots are no longer visible (Fig 2B). Other signal elements, however,
such the male’s orange wings, may now be visible from this perspective. So, to ensure that females
can see display elements, courting peacocks must track a female’s relative position, and orient
their display appropriately. Indeed, males change their orientation towards females to expose
different ornaments depending on the display being performed (Dakin and Montgomerie 2009).
Signaler behaviors that work to manage the directionality of their displays are expected to be a
common feature of visual communication, shaped by selection for effective communication (G.
G. Rosenthal 2007; J. A. Endler 1992; Echeverri, Morehouse, and Zurek 2017).
The strength of this selection likely depends in part on the extent of signal directionality.
Hypothetically, a perfectly smooth and matte sphere of uniform color and brightness would act as
an omnidirectional signal (if a message was coded by reflectance information), as its appearance
would remain constant irrespective of viewing angle. However, much like the proverbial

13
“spherical cow” used to simplify thought experiments in physics, no such omnidirectional signal
exists in nature to our knowledge. We can then classify natural signals on an axis from weakly
directional to strongly directional. The peacock’s tail is an example of a strongly directional signal,
where appearance and effectiveness change dramatically with viewing angle (Fig. 2A, B). Visual
signals tend to be strongly directional if (Fig. 3):
(a) they are formed by approximately flat surfaces (e.g., flattened tail feathers arranged in
a plane in peafowl and relatives (Dakin and Montgomerie 2009) and other birds (e.g.,
great bustards (Olea et al. 2010) and birds of paradise (Scholes 2008b)), clypeal
coloration in jumping spiders (e.g., (Echeverri, Morehouse, and Zurek 2017; Elias et
al. 2012)), dewlaps in Anolis (Leo J. Fleishman et al. 2015; Gartner et al. 2013; Losos
et al. 2017) and other lizards (Klomp et al. 2017), butterfly wings (White, Zeil, and
Kemp 2015; Rutowski et al. 2007a)),
(b) they have a directionally asymmetric design (e.g., the dewlap of Anolis lineatus, which
is colored differently on the left versus right side (Losos et al. 2017; Gartner et al. 2013)
or have dorso-ventral countershading, as in many marine organisms (Cuthill et al.
2016)),
(c) signaled information is coded by the area (or volume) of the signal, as less of this area
will be seen if viewed from a skewed angle (e.g., displays that serve to exaggerate the
signalers size, such as deimatic displays in mantises (Maldonado 1970), the
neuropteran Palmipenna aeoleoptera (Picker, Leon, and Londt 1991), and other
species (Umbers, Lehtonen, and Mappes 2015))
and/or

14
(d) the material that forms the signal reflects light in a specular (mirror-like) or iridescent
(color-changing depending on viewing angle) manner (e.g., feathers of some
hummingbirds (Simpson and McGraw 2018b; Hamilton 1965; Hogan and Stoddard
2018) and birds of paradise (Scholes 2008b), and the wing scales of some butterflies
(White, Zeil, and Kemp 2015); reviewed in Meadows et al. 2009; Doucet and Meadows
2009).
Conversely, certain signals may be weakly directional, with appearance and effectiveness
remaining relatively constant from many viewing angles. Visual signals are likely to be weakly
directional if:
(a) signal components are distributed uniformly or nearly uniformly over the signaler’s
body such that the signaled information is accessible from many angles (e.g., red body
coloration of a male cardinal (Fig. 2C, D), or non-iridescent aposematic stripes that
wrap all the way around a caterpillar)
(b) signaled information is coded by a spatially simple design (e.g., stripes of 2 alternating
colors) and/or by traits that do not depend on apparent area or volume (e.g., color hue
instead of area of color patch). Spatially complex designs and size-dependent signals
may not be fully visible from skewed angles.
and
(c) the material that forms the signal reflects light in diffuse or matte manner, such that
the angle of incident light only weakly affects the properties of the reflected light. Many
pigment-based colors fulfill this condition.

15
Figure 2. Visual signal appearance is affected by viewing direction
The appearance of a strongly directional visual signal (tail train of a peacock, Pavo cristatus) changes
dramatically when “head-on” (A), and in profile (B). The appearance of a weakly directional visual signal
(red coloration of a male cardinal, Cardinalis cardinalis) changes only slightly with viewing angle (C, D).
Images from Wikimedia Commons users Jennie Kondo (A), “Arpingstone” (B), Jocelyn Anderson (C, D).

16
Figure 3. Visual signal directionality is affected by signal properties
Visual signals can be classified on an axis from weakly directional to strongly directional. The extent of this
directionality is affected by the physical shape of the signal, how its component material interact with light,
and/or its location on the signaler’s body. Images by (top row, left to right) Wikimedia user “Stu’s Images”,
Scholes 2008, Brown et al 2012; (bottom row, left to right) Jocelyn Anderson, Vedant Kasambe, Steve
Berardi, USFWS Pacific Southwest.
Iridescent signals, where color changes based on viewing angle, are perhaps the most
famous and well-studied examples of highly directional visual signals (reviewed in (Meadows et
al. 2009; Doucet and Meadows 2009). Iridescent signals are phylogenetically widespread, and can
have especially narrow effective viewing angles. Consequently, signaler behaviors that effectively
orient their iridescent signal towards receivers are quite common, having been observed in
hummingbirds (e.g., (Simpson and McGraw 2018b; Hamilton 1965; Hogan and Stoddard 2018)),
birds of paradise (Scholes 2008b), and butterflies (White, Zeil, and Kemp 2015; Rutowski et al.
2007b). However, the appearance of iridescent signals depends on not just the viewing angle
relative to the receiver, but also the direction of the light source. For the moment, we will focus on
the consequences of directionality agnostic of lighting, but will return to this additional
complication when we discuss the geometric considerations of the visual environment within
which signaling occurs.

17
Unfortunately, we know relatively little about signal directionality and its consequences
for signaler behavior outside of iridescent systems, despite that non-iridescent signals can exhibit
strong directionality. While it is generally assumed that the appearance of non-iridescent, pigment-
based colors is not angle-dependent, in the rare case that this assumption has actually been tested,
it has proven false. An exemplary study on the blue-fronted Amazon parrot (Amazona aestiva)
shows that several measures of pigmentary color signals (intensity, hue, and within-ornament
contrast) can vary solely based on viewing angle (Santos et al. 2007). Indeed, any surface that is
rough on a fine scale, such as a bird’s feather, will reflect light in an angle-dependent way, even if
it reflects light diffusely (Oren and Nayar 1995). Only a perfectly smooth and matte surface will
not do so. Thus, it is likely that color signals in more species also have directional changes in
coloration. We note that studies on iridescent color signal directionality may also measure non-
iridescent colors as a baseline for comparison (e.g., (Kemp and Rutowski 2007)). Although the
angle-dependent changes of these non-iridescent colors may not be prominently discussed in
publications, such datasets may provide a useful resource for expanding our understanding of
visual signal directionality.
Signalers may be under selection to, when possible, aim their directional signal towards
the receiver. In great bustards, males orient their bright tail displays towards females (Olea et al.
2010), though as with peafowl, the extent to which they do so varies with specific phases of
courtship and the sun’s location (Dakin and Montgomerie 2009). In the lizard Anolis linneatus,
however, while males have an asymmetrically colored dewlap (one side being orange and the other
yellow), they do not appear to preferentially show either side to a receiver during communication
(Gartner et al. 2013; Losos et al. 2017). This suggests that A. linneatus males are under little

18
selection to do so, and thus that, despite the directionality of dewlap color, this does not affect
signal function in this case.
Signalers that construct a physical structure as a visual signal, as opposed to displaying
with their own body, (i.e., a type of extended phenotype signal sensu (Schaedelin and Taborsky
2009) may require alternative strategies to ensure these structures are viewed from an effective
angle. While no longer obscured or limited by the signaler’s own anatomy, these external signals
can also be highly directional, and often cannot easily be reoriented during communication
(Schaedelin and Taborsky 2009). Instead, signalers may use strategies that control receiver
position. Male great bowerbirds (Chlamydera nuchalis) arrange rocks in their bowers to create a
visual illusion that may amplify the perceived size of the male (J. A. Endler, Mielke, and Kelley
2012). This illusion relies on forced perspective, requiring that females view the structure from a
very specific angle to perceive the signal (Kelley and Endler 2012). Males build an entranceway
that restricts females to viewing the bower from within the limited viewing angle of the illusion
(J. A. Endler, Mielke, and Kelley 2012). Signalers may also rely on predictable movement of
receivers. In Vargula annecohenae, a marine ostracod, males eject luminescent materials while
swimming in a complex three-dimensional pattern to create a visual display that persists briefly in
the water column (Rivers and Morin 2008). Females are free to move when viewing this display,
but swim towards males in a simple intercept course, thereby allowing males to reasonably predict
females’ viewing angles (Rivers and Morin 2006; 2008). Other species that construct physical
structures as possible visual signals (e.g., sand pyramids built by male ghost crabs (Linsenmair
1967), and ornaments in bird nests; reviewed in (Schaedelin and Taborsky 2009)) are exciting
opportunities to understand how signalers control receivers’ perspective.

19
Signalers with more traditional displays may create physical structures to constrain the
range of viewing angles receivers have access to. For instance, several birds of paradise clear
courtship stages underneath low hanging tree branches. These branches serve as a perch for
females to view the male’s display from above, where the full design of the male’s elaborate
ornaments can be seen (Scholes 2008a; 2008b). By constraining possible viewing angles ahead of
the communication interaction, signalers can ensure optimal viewing and reduce the cognitive load
required to track receiver position during communication and reorient. However, in both cases,
this strategy is dependent on communication occurring at a known location that the signaler can
manipulate beforehand. The development of this strategy may thus be evolutionarily associated
with territoriality and/or landmark-based social behavior (e.g., “hill-topping” in many insects
(Alcock 1987).
Signaling interactions where orienting a signal is challenging may also select for weakly
directional signals. This may be the case when there are multiple receivers or when receiver
location is rapidly changing or simply unknown. This suggests that broadcast displays, such as
camouflage patterns or body coloration that indicate territorial or social ranking, may have
undergone selection for weaker directionality than that of dyadic displays (e.g., a courtship signal
directed at a single female). Broadcast signals that are strongly directional, such as dorsoventral
countershading in marine organisms, seabirds, and some primates (Cuthill et al. 2016; Ruxton,
Speed, and Kelly 2004; Kamilar and Bradley 2011), likely have coevolved with morphology and
typical body orientation to increase the chance that receivers view the signal from an effective
direction (Johnsen 2002; Donohue, Hemmi, and Kelley 2020).
While previous work provides clear evidence for the role of signal directionality in visual
signaling efficacy, many questions remain to be investigated. There have been very few studies

20
quantifying the directionality of non-iridescent signals. Work by Santos et al. (2007) demonstrated
the angle-dependent appearance of a pigmentary color ornament. However, how such methods can
best be adapted to quantify angle-dependent changes in the visibility of spatially complex patterns
(as opposed to coloration changes) remains a pressing need. Furthermore, few studies have tested
the consequences of signal directionality on signaling outcomes. Work on iridescent warning
colors on butterflies has, as a proxy for viewing the iridescence from suboptimal angles, removed
these colors from a clay model used in predation experiments (e.g., (Pegram, Han, and Rutowski
2015)). But what are the consequences for iridescent colors viewed at intermediate angles, or for
non-iridescent signals? It is clear that at extreme viewing angles, many highly directional signals
are entirely obscured and likely ineffective. But how effective is a peacock that faces his display
30 degrees away from the female? 45 degrees? What is the rate of change (linear? exponential?)
of signal effectiveness, and what factors (signal complexity? signaler anatomy?) influence this
rate? The answers to these questions are important to understanding the strength of selection on
signaler orientation and positioning during communication, and thus for making hypotheses about
the evolution of such behavior as has been done for iridescent displays. We encourage researchers
to more widely measure the effective viewing angles of non-iridescent signals, how these
constraints drive communication outcomes, and how signalers manage this effect.
In addition, the majority of published work regarding directional signals has dealt with
dyadic signaling situations (i.e., between two individuals). But in cases where there are multiple
receivers (e.g., in a lek), signalers are constrained in their ability to orient their display towards
more than one receiver. How do signalers manage this potential conflict of interest? Do lekking
males select one female to aim their display at, or orient themselves such that the greatest number
of receivers have an adequate, if sub-optimal, viewing angle? And what influences these decisions?
21
While lekking great bustards do orient their signals towards a female, the consistency of this
behavior (only ~20% of the time (Olea et al. 2010)) is far less than what is seen in dyadic
interactions between peafowl (~60% of the time (Dakin and Montgomerie 2009)) and jumping
spiders (~99% of the time (Echeverri, Morehouse, and Zurek 2017)). This suggests that courting
multiple females may indeed challenge signalers’ abilities to orient their displays appropriately.
Finally, we note that signal directionality interacts strongly with the directionality of the
receiver’s visual system (see following section), such that the effects of one may compliment or
exacerbate those of the other. Therefore, we strongly recommend that researchers assess both
factors when possible.
1.2.3 Directionality of Sight
Just as signal appearance changes with viewing angle, how eyes detect and process visual
information is also subject to directional biases. The distribution of photoreceptors is rarely, if
ever, uniform across the retina. In many species certain areas of the retina (e.g., foveal areas or
retinal streaks) have a much greater density of receptors than others (e.g. the retinal periphery)
(Temple 2011; Michael F Land and Nilsson 2012; Cronin et al. 2014). Likewise, the required
photoreceptor types and neural wiring for different visual functions, such as color perception,
spatial acuity, and motion detection tend to be regionalized within the retina (Michael F Land and
Nilsson 2012). Consequently, what visual information is available to receivers depends on the
moment-to-moment position of the signal within their field of view.
The precise nature of these specialized retinal regions varies among species, between sexes
of the same species, and between eyes of an individual (Michael F Land and Nilsson 2012; Cronin
et al. 2014). While most vertebrates only have one set of physiologically similar eyes, many
22
invertebrates have multiple sets, each of which can be physiologically different. Vision in these
animals can be modular in nature, with each set of eyes specialized for distinct visual functions,
and with distinct directional limitations. Within arachnids, for example, the arrangement and
function of eye pairs varies greatly amongst spiders (Foelix 2011). A particularly notable example
is the vision of jumping spiders, where the anterior median eyes are specialized for high acuity and
color vision, while two of the remaining three sets of lateral eyes excel at motion detection, but
achromatically and with reduced resolution (Harland, Li, and Jackson 2011; M F Land 1985).
Thus, while the overall field of view of the entire spider is quite wide (approaching 360 degrees),
how a visual stimulus is processed depends on which eye can see the stimulus. Likewise, insects
often have one set of compound eyes and several simple ocelli, and many marine invertebrates
have numerous sets of eyes (Michael F Land and Nilsson 2012).
As a result of spatial heterogeneity in visual system function, even the perception of an
otherwise static display can become dynamic if the receiver changes their field of view by looking
around (e.g., bringing the display from the periphery to the foveal region or vice versa) (G. G.
Rosenthal 2007; Hutton et al. 2015). Indeed, such gaze movements, (of the eye itself, the head,
and/or body) are a common evolutionary solution to the directional limitations of vision (reviewed
in M. F. Land 1999).
Despite extensive physiological and neurological research on functional regionalization of
visual systems available for many species (Temple 2011), this information has rarely been
incorporated into signaling research. Instead, receivers are often implicitly assumed to look at
signals uniformly and consistently. It is commonplace, even in studies on directional biases in
signal propagation (Olea et al. 2010; Dakin and Montgomerie 2009; White, Zeil, and Kemp 2015;
Stavenga et al. 2011; Vukusic et al. 2002; Hamilton 1965) to neglect or not report the orientation

23
of receiver’s gaze or field of view. However, when receiver gaze has been measured during a
signaling interaction, it is clear that visual attention is temporally and spatially dynamic. Pivotal
work in tracking gaze of peahens viewing courting peacocks shows that females view only certain
display elements (the bottom edge of the males’ train, and his body, but not individual eyespots)
with their highest acuity (foveal) vision (Jessica L Yorzinski et al. 2013; J. L. Yorzinski et al.
2015). In addition, this work found that females often (63% of the time) looked away from the
male during communication, such that males would be viewed entirely with the female’s
peripheral vision or not at all. Likewise, in Habronattus pyrrithrix jumping spiders, females looked
away from males for over 73% of the interaction (Echeverri, Morehouse, and Zurek 2017).
Because of their unique visual system, males were likely visible to the female throughout this
period, but only achromatically, and at a reduced resolution.
Furthermore, eyes that are (or appear to be) anatomically identical, may be preferentially
used for a certain visual task based on which lateral hemisphere of the brain they are associated
with (i.e. left or right). Here, the geometric constraints on perception are a consequence of
asymmetrical neurophysiology, and not limitations to the visual “hardware”. This visual
“handedness”, or lateralization, means that which eye is used to see the signal, (especially for
species with fields of view with small or no binocular overlap) may change how visual information
is integrated and acted upon (reviewed in (Salva et al. 2012)). For instance, male zebra finches use
female coloration to decide which individuals to court, with a strong preference for females of the
same color morph. However, males are only able to make this distinction when viewing females
with their right eye (Templeton et al. 2012). This implies that courting males must orient
themselves to keep prospective females to their right-hand side, and/or that females should position
themselves appropriately so as to have the best opportunity to be evaluated or even to avoid critical

24
evaluation. Lateralization in this system appears to be a consequence of avian brain structure,
suggesting that such biases may be common in birds. Lateralized visual function may be a
mechanism by which neurophysiology may drive the evolution of signaling behavior in other
systems. However, such comparative work remains to be done.
Tracking how receivers orient their visual system, in combination with physiological and
neurological research on the regionalization of the visual field, allows for inferences about what
visual information is available to the receiver and when. Using this, we can better understand how
receivers make decisions about signaling outcomes, and thus more precisely track selection on
signal components. Luckily, the technology needed to track receiver orientation is increasingly
accessible. Gaze-tracking technology has been developed for primates, canines, peafowl (Jessica
L Yorzinski et al. 2013), and jumping spiders (Canavesi et al. 2011), and may be adapted for
related species. In species where eyes do not move independently of the head (e.g., most
arthropods, amphibians, and reptiles), measuring the head’s facing direction can be sufficient to
track a receiver’s visual field (M. F. Land 1999).
1.2.4 Positioning within the Visual Environment
Until now, we have largely discussed the role of geometry inherent in interactions between
visual signals and receivers in general, without fully placing these interactions in the real-world
context of the visual environment, with the additional complexities that such environments bring.
However, signal effectiveness also changes as a function of the spatial arrangement of signaler and
receiver within the physical environment around them (G. G. Rosenthal 2007; Ryan and
Cummings 2013). Illumination, obscuring physical objects, and the backdrop against which
signalers display can all affect signal efficacy, and natural environments are often heterogenous in

25
these spatio-visual properties (J. A. Endler 1992; G. G. Rosenthal 2007). Space use during
communication may thus be a result of selection for behaviors that result in effective geometries
of signaler, receiver, and environment.
1.2.4.1 Directional Illumination
Signal appearance is dependent on the direction of illumination, and how a signal’s
constitutive material(s) reflect oncoming light from different angles. With the notable exception
of phosphorescent/luminescent animals, signalers must rely on an external source for the light
necessary for signal transmission. The light source’s position relative to the signaler and receiver
will determine the extent to which the receiver sees the signal as brightly lit or in silhouette. This
will be by influenced the relative position of signal, receiver, and the illumination source. In
addition, different materials reflect incoming light differently, modulating the effects of
illumination (Bradbury and Vehrencamp 2011). Diffusely reflective surfaces, which “spread out”
reflected light, can result in signals that are weakly directional with respect to illumination angle.
In contrast, specularly (i.e., mirror-like) reflecting surfaces produce signals that are highly
directional with respect to illumination angle. In the extreme case of iridescent reflection, the color
of reflected light will change depending on the angles of illumination and viewing, resulting in
some of the best studied examples of highly directional visual signals. The physical mechanisms
underlying iridescence have been well described (Doucet and Meadows 2009; Meadows et al.
2009; Seago et al. 2009), but there are ongoing questions regarding the evolution, function, and
use of these signals.
As with other highly directional signals, the angle-dependent appearance of iridescent
signals may select for signalers to aim their display such that the bright iridescent color is visible
by the receiver. However, signalers using iridescence are more constrained in their possible

26
positions and orientations, as they must also manage the angle of illumination as well as that of
the receiver’s position. Males of common eggfly butterflies (Hypolimnas bolina (White, Zeil, and
Kemp 2015)) and broad-tailed hummingbirds (Selaphorus platycercus (Hogan and Stoddard
2018)) have been shown to position themselves in relation to the sun and the intended receiver so
as to maximize the brightness of their signal in the eye of the receiver. Male Anna’s hummingbirds
(Calypte anna) also display their iridescent gorgets towards the sun when displaying at a focal
female, though whether this behavior indeed improves brightness remains to be formally tested
(Hamilton 1965).
In addition to producing particularly bright colors, iridescent signal elements can also be
used to produce a “flashing” effect because of their rapid directional color changes (e.g., as in
Colias eurytheme butterflies (Kemp and Rutowski 2007; Rutowski et al. 2007b)). Such flashy
signals may be effective at capturing a receiver’s attention due to their changing appearance (G.
G. Rosenthal 2007; Számadó 2015; Doucet and Meadows 2009), but require potentially more
complex signaler behavior. To increase flashiness, signalers can oscillate their positions between
those corresponding to the viewing angles of most and least reflectance. In the butterfly C.
eurytheme, the iridescent color patches are located on the wings, so that flashing effects are a
byproduct of flight (Kemp and Rutowski 2007). Recent work shows that in bee hummingbirds,
positioning during display and iridescent signal directionality appear to be tightly evolutionarily
linked to produce flashy signals (Simpson and McGraw 2019). However, these two display
strategies (maintaining a bright iridescent color vs producing a flashy signal) may also be exhibited
within a species. In broad-tailed hummingbirds (Selaphorus platycercus), some males oriented
more towards the sun and produced flashier displays, while other males maintained a more
consistent coloration (Simpson and McGraw 2018c).

27
Iridescent color changes have been quantified for various Lepidoptera (Kemp 2008;
Rutowski et al. 2007a; Vukusic et al. 2002; Lind et al. 2017; Rutowski, Nahm, and Macedonia
2010), birds of paradise (Stavenga et al. 2011), and beetles (Seago et al. 2009), amongst others
(Meadows et al. 2009), and the methods to do so have been well described by (Meadows et al.
2011). However, whether these signalers’ positioning during communication presents their
iridescent colors effectively remains to be tested outside of a few systems.
Even for non-iridescent signals, the relative position of illumination can affect signal
appearance. Pigment-based color patches of the blue-fronted Amazon parrot have been shown to
change in brightness, hue, and within-patch contrast as a function of illumination angle, and such
effects are suggested to be widespread (Santos et al. 2007). In addition, the non-iridescent plumage
of the summer tanager (Tersina viridis) also shows dramatic color change depending on whether
the illumination source is behind the receiver or behind the signaler (Skigin et al. 2019; Barreira
et al. 2016). In addition to possible color-changing effects, most displays will appear brighter with
direct illumination. Thus, non-iridescent signalers can also experience selection to orient their
display towards the sun. Great bustards (Otis tarda) orient their bright white tail displays towards
the sun, particularly when the sun is low in the sky and thus best positioned to shine upon the
male’s vertically-held tail feathers (Olea et al. 2010). Likewise, snowy owls (Bubo scandiacus)
seem to orient their white breast feathers towards and the sun in order to increase brightness
((Bortolotti, Stoffel, and Galván 2011), but see (Wiebe and Chang 2018)). To determine how and
why non-iridescent signalers orient themselves with respect to the sun, we encourage future
research to build on work by applying the robust methodology used in iridescent systems to non-
iridescent ones.

28
1.2.4.2 Physical Structures
Unlike some other modes of communication, light cannot flow around solid objects in its
path (at least not on behaviorally-relevant spatial and gravitational scales) and so such obstructions
shape which positions of signaler, receiver, and illumination are most effective. Most simply,
objects located between signaler and receiver may partially or fully obscure signal visibility (G.
G. Rosenthal 2007). To establish a clear line of sight for receivers, signalers may experience
selection to maneuver around intervening objects during communication, and/or directly modify
the local environment by clearing objects in advance of signaling. The latter strategy, however,
depends on signalers having the opportunity to control when and where signaling will occur. In
cases where signalers encounter receivers in variable locations (e.g., a male happens upon a
moving female and begins courtship), signalers will likely have less control over the physical
environment. In dense microhabitats, navigating physical obstructions while displaying may be
cognitively demanding for signalers. There is little research on how signalers navigate fine-scale
obstacles during communication, and the extent to which this imposes an additional challenge for
signalers.
Alternatively, physical objects in the signaling environment also provide an opportunity
for signalers to strictly control what receivers see. Male great bowerbirds (Chlamydera nuchalis)
build an “avenue” of reeds that function to block females from viewing the male’s bower from all
but head-on, preserving the directional visual illusion of the bower display (J. A. Endler, Mielke,
and Kelley 2012; Kelley and Endler 2012). Signalers may also use obstructions for “peek-a-boo”
displays, repeatedly presenting and hiding the signal from behind cover, as seen in some jumping
spiders (genera Saitis and Jotus (Hill 2009; Otto and Hill 2016)). Such interactions have been
studied in the context of human development (e.g., (Greenfield 1972), but not in communication

29
of other animals. These peek-a-boo displays may allow signalers to avoid visual desensitization
and/or exploit biases for novel stimuli. However, they require signalers to track the receiver’s
position without a clear line of sight, as the peek-a-boo only functions if the obscuring object
remains between signaler and receiver.
How do signalers navigate this and other cognitive and sensory challenges regarding
physical objects? If signalers are using an obstruction to control the receiver’s field of view, this
may require some ability to estimate what the receiver will see based on current conditions,
especially if the signaler cannot establish a line-of-sight (e.g., if only showing a part of its body in
a peekaboo type display). And how do signalers compensate if no suitable object is available?
Testing signaling interactions in physical environments with similar structures to the species’
natural conditions is important for beginning to answer these questions. Such observations may
exist in species descriptions or in video form, but we strongly encourage future work to conduct
observations in natural environments, and/or reproduce similar physical obstructions in lab
environments.
1.2.4.3 Visual Background
Signals are not perceived as isolated stimuli; instead, they are perceptually weighted
against their surrounding stimuli (i.e., the visual background) (G. G. Rosenthal 2007; Cronin et al.
2014; Ord et al. 2007; R. Peters, Hemmi, and Zeil 2008; Cole 2013). The properties of the
background (color, complexity, illumination, movement, etc.) interact with those of the signal to
affect signal efficacy. The position of signaler and receiver within their environment will change
this background in all but exceptionally homogenous habitats.
How signaling efficacy is affected by any specific background, and thus how selection acts
on positioning, depends on signal function. Species with cryptic body patterning experience

30
selection to position themselves such that they are viewed against a background with similar visual
properties (Stevens and Ruxton 2019; Cuthill et al. 2016; Cronin et al. 2014). Species with counter-
shading colorations must keep themselves oriented with respect to the direction of illumination, so
that they more closely match the brightness and color of their background when viewed from above
and/or below (Cuthill et al. 2016; Ruxton, Speed, and Kelly 2004). While frequently discussed in
terms of marine organisms (Johnsen 2002), countershading may also benefit caterpillars in forests
(Rowland et al. 2008).
Species with cryptic coloration may experience selection to match the directional
properties of physical features in their visual environment. The geometrid moth (Jankowskia
fuscaria) has a bark-like pattern on its wings, but when viewed against non-pattern-matching trees
experiences greater predation. Even on pattern-matching trees, however, the moths must also
orient their bodies such that the direction of their markings matches that of the tree because the
pattern of bark is itself directional (R. J. Webster et al. 2009). Individuals do not orient themselves
from a distance, but conduct short re-orientation movements after landing that allow them to hone-
in on the proper orientation. As the moth may not be able to resolve the bark pattern while on the
tree, it may detect the orientation of the back through touch, and use this information to inform its
visual signaling behavior (Changku Kang et al. 2015; Chang ku Kang et al. 2013).
The extent to which geometry affects the visual background also depends on habitat
homogeneity. In heterogenous environments, especially at boundaries between different
microhabitats, changes in relative positioning can have stronger effects (e.g., by changing which
microhabitat is behind the signaler). In homogenous environments, such as in the open ocean or
an open field, changes in positioning within certain planes (e.g., horizontally at the same depth in
the water column) can be much more constrained (Johnsen 2002; 2012). In addition, much as

31
viewing distance affects signal perception, the distance between the signaler and the background
behind them may determine whether the signal and background are perceived at similar levels of
detail (E. M. Caves, Brandley, and Johnsen 2018).
As with other physical properties, in some systems signalers may be able to select or
modify their visual environment prior to communication (e.g., clearing debris from a display court
in manakins (Uy and Endler 2004)) . However, when signaling interactions are unpredictable in
location, signalers may be under selection to assess their environment, and reposition themselves
during communication. In the jumping spider Habronattus pyrrithrix, males move closer to
females when courting against more spatially and temporally complex backgrounds (Chapter 3).
Jumping spiders have a particularly wide field of view, and may be able to assess their background
without turning away from the receiver. Other animals with laterally-oriented eyes (e.g., many
birds and mammals) may also be able to simultaneously view the receiver and the visual
background if they position themselves appropriately. However, many species lack such a wide
field of view. How is the visual environment assessed during communication, if at all? Do signalers
incur a cost by moving their visual attention away from the receiver in order to assess their own
background, either by missing potential cues or by inadvertently showing disinterest? We
encourage future work to pursue these questions to determine how signalers select and position
themselves to control their visual background.
1.2.5 Critical Needs and Opportunities
Previous studies have developed a useful methodological toolbox for analyzing visual
signal geometry, and many exciting hypotheses to test. Perhaps the most important is a suite of
tools for tracking body position and movement of individuals (e.g., standalone programs such as
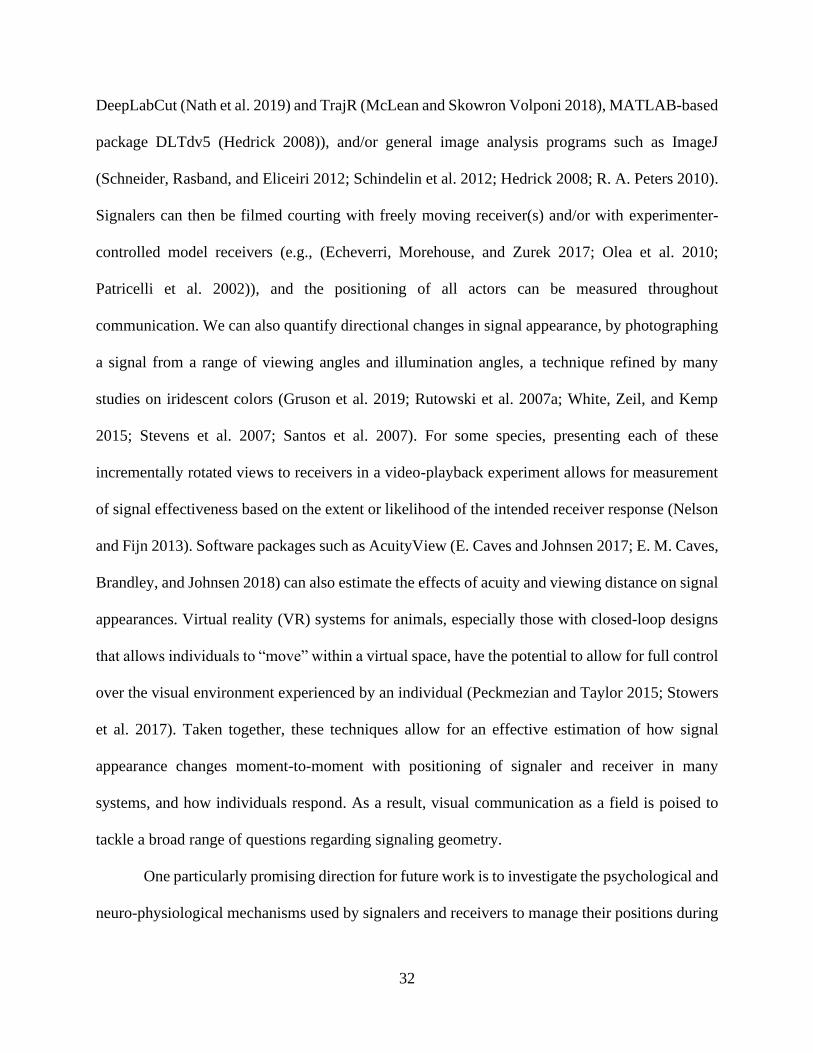
32
DeepLabCut (Nath et al. 2019) and TrajR (McLean and Skowron Volponi 2018), MATLAB-based
package DLTdv5 (Hedrick 2008)), and/or general image analysis programs such as ImageJ
(Schneider, Rasband, and Eliceiri 2012; Schindelin et al. 2012; Hedrick 2008; R. A. Peters 2010).
Signalers can then be filmed courting with freely moving receiver(s) and/or with experimenter-
controlled model receivers (e.g., (Echeverri, Morehouse, and Zurek 2017; Olea et al. 2010;
Patricelli et al. 2002)), and the positioning of all actors can be measured throughout
communication. We can also quantify directional changes in signal appearance, by photographing
a signal from a range of viewing angles and illumination angles, a technique refined by many
studies on iridescent colors (Gruson et al. 2019; Rutowski et al. 2007a; White, Zeil, and Kemp
2015; Stevens et al. 2007; Santos et al. 2007). For some species, presenting each of these
incrementally rotated views to receivers in a video-playback experiment allows for measurement
of signal effectiveness based on the extent or likelihood of the intended receiver response (Nelson
and Fijn 2013). Software packages such as AcuityView (E. Caves and Johnsen 2017; E. M. Caves,
Brandley, and Johnsen 2018) can also estimate the effects of acuity and viewing distance on signal
appearances. Virtual reality (VR) systems for animals, especially those with closed-loop designs
that allows individuals to “move” within a virtual space, have the potential to allow for full control
over the visual environment experienced by an individual (Peckmezian and Taylor 2015; Stowers
et al. 2017). Taken together, these techniques allow for an effective estimation of how signal
appearance changes moment-to-moment with positioning of signaler and receiver in many
systems, and how individuals respond. As a result, visual communication as a field is poised to
tackle a broad range of questions regarding signaling geometry.
One particularly promising direction for future work is to investigate the psychological and
neuro-physiological mechanisms used by signalers and receivers to manage their positions during

33
communication. Much work has studied how animals navigate to different geographic locations
and around physical obstacles (reviewed in Collett and Graham 2004; Berdahl et al. 2018), but we
know much less about how individuals handle navigation with respect to a communication partner.
Unlike in geographic navigation, the sensory cues and “landmarks” (physical appearance, e.g., the
extent to which eyes are visible) associated with signal and sensor orientation are not fixed in
space, due to the movement of both signaler and receiver(s). This may preclude simple
navigational strategies such as path integration and a static mental map. Instead, communicators
may require new strategies or heuristics focused on signaling-relevant cue. What these strategies
are, how they vary and evolve, and what their role is in communication efficacy remain exciting
open questions.
1.3 Geometry of Sound Communication
Many of the same geometric constraints that are important to visual signaling also shape
the efficacy of acoustic signals. Sound also travels as a wave, sound signals are often directional,
and are detected by sensors with directional biases. However, unlike the electromagnetic waves of
light, sounds are mechanical waves, and can travel through a much greater diversity of materials
than light waves. In addition to traveling as a pressure wave in air or water, sound signals may also
transmit as vibrational waves, either on a surface (e.g., ripples on the water) or through an object
(e.g., a rock or leaf). As a result, sound waves interact in complex ways with the environment, and
this complexity affects how signalers and receivers position themselves.

34
1.3.1 Distance of Sound Communication
Sound waves attenuate in several ways as they travel, reducing signal detectability. As a
wave spreads from the point of origin, the amplitude (volume or loudness) of the wave decreases
because the initial kinetic energy is spread out over more and more molecules. In addition, at each
collision of molecules that propagates the wave, additional energy is lost in the form of heat to
entropy. Environmental effects notwithstanding, sound signals continuously degrade through the
combined action of these two forms of attenuation, called spreading loss and heat loss respectively,
such that sound information becomes harder for receivers to extract as communication distance
increases (Bradbury and Vehrencamp 2011; R. Haven Wiley and Richards 1978)). Past a certain
distance, the signal is no longer detectable.
In addition to these distance-dependent issues due to attenuation, the distance between
sender and receiver of sound signals impacts whether such signals can be perceived as near-field
or far-field sounds. The mechanism of sound signal transmission changes across the boundary
between these two types of sound (Fig. 4, (Bradbury and Vehrencamp 2011; R. Haven Wiley and
Richards 1978). Very close to the origin of the sound (within the “near field”; within approximately
1/6 of the wavelength of the sound), receivers can detect the tidal movement of molecules pushed
by the sound wave. However, past this boundary (e.g., in the “far field” of the sound), receivers
only have access to the pressure changes caused by the sound, which are much harder to detect
(Bradbury and Vehrencamp 2011). The sensory structures needed for near- vs. far- field signals
are typically distinct, and so consequences of this boundary depends on the sensory capabilities of
the receivers. If receivers are only able detect near-field sounds, effective communication distance
would be strictly limited. If instead receivers are able to detect both types of sound, signalers could
improve signal detection by adjusting their position (or signal wavelength) such that receivers

35
remain within the near field of the sound. However, to our knowledge, no study has specifically
tested for such behaviors, or studied the consequences of the near vs. far field on positioning for
sound communication.
As seen in visual communication, one possible consequence of distance-dependent signal
quality is selection on signalers to assess receiver distance and compensate for attenuation as
needed. If receivers are within line of sight, signalers may assess distance visually. However, in
many cases, receivers may be out of sight. If the receiver has themselves made a noise (either their
own sound signal or simply through sound cues from movement), signalers may use the various
effects of sound attenuation to estimate distance. Signalers are known to use the reverberation
(echoes), overall amplitude (volume), and frequency intensity (relative volume of different
pitches) of sounds to estimate their relative and/or absolute distance, although their ability to do
so may rely in part on prior experience (reviewed in (Naguib and Wiley 2001)).
Figure 4. The mechanism of sound transmission changes with distance
Very close to the origin of the sound (within the “near field”; within approximately 1/6 of the wavelength of
the sound), receivers can detect the tidal movement of molecules pushed by the sound wave. However, past
this (in the “far field” of the sound), receivers only have access to the pressure changes caused by the sound,
which are much harder to detect.

36
It follows that signalers may adjust their sound signal to compensate for the effects of
attenuation, thus increasing the range at which the sound signal is effective (active space).
However, evidence of distance-dependent modulation in acoustic signals comes primarily in the
form of adjustment of overall amplitude. Both zebra finches (Brumm and Slater 2006) and humans
(A. H. Marshall and Meyer 1985) produce quieter (lower amplitude) calls when closer to a focal
receiver, and louder calls when further away. Other songbirds also have the ability to modulate
song amplitude, but whether they, or other species, specifically do so in response to receiver
distance is an open avenue for future research. Likewise, it is unknown if signalers compensate for
other forms of sound attenuation in a distance-dependent manner. Because higher frequencies
attenuate more quickly with distance, signalers might be able to selectively boost the higher
frequency components within the signal when communicating with more distant receivers. As with
the analogous distance-dependent signal modulation, the extent of this strategy as compensation
for attenuation remains to be explored, although some species of frogs and birds are known to
change frequency in response to environmental noise (Parris, Velik-lord, and North 2009; Nemeth
and Brumm 2009).
Alternatively, attenuation with distance may be a part of an intended signal function.
Signalers may use sound signals to provide receivers with relative location information (termed
“ranging” in literature (Naguib and Wiley 2001)), especially when out of visual contact. If a signal
has evolved to give accurate information, signalers then benefit from explicitly avoiding
compensating for distance-dependent attenuation. In theory, signalers may even be under selection
to enhance the perception of attenuation so as to facilitate ranging by receivers. Signals that include
wide frequency sweeps (“trills”) could allow receivers to better estimate distance via the extent of
frequency-specific attenuation. Pygmy marmosets, Cebuella pygmaea, for example, produce three

37
calls which vary in how effectively their trills give distance information. The most informative trill
is used when receiver distance is larger, and vice versa (Snowdon and Hodun 1981). A similar
function may explain the usage of trills by some forest bird species in their long-range songs,
despite that trills tend to be more easily obscured by the structure of the forest environment (Naguib
and Wiley 2001).
Signalers may also use distance-dependent signaling strategies to exclude unintended
receivers (e.g., eavesdroppers such as predators) from accessing distance information. In
Richardson’s ground squirrels, individuals were more likely to make ultrasonic frequency alarm
calls upon initially sighting a predator if that predator was further away. Such calls will degrade
more quickly than the species’ lower frequency alarm calls, possibly reducing the chances that a
distant predator will hear it while still alerting nearby conspecifics (Wilson and Hare 2006).
Switching between qualitatively different signal types, each specialized for short- or long-range
communication, may be another way in which signalers respond to changes in receiver distance.
In theory, signalers could even exploit predictable patterns of sound attenuation to produce
deceptive distance information by mimicking the effects of degradation themselves (Naguib and
Wiley 2001). Howling monkeys (Alouatta palliata), for example, produce both a normal grunt
call, and a grunt with additional reverberation that may be perceived as deceptively distant
(Whitehead 1987). These deceptive signals may allow the signalers to avoid confrontation with
other groups of conspecifics. Signalers might also create falsely distant-sounding signals by
selectively decreasing the amplitude of high frequency elements within a call, although this has
yet to be observed. How common are falsely distant signals, and other possible illusions in sound
communication? Is their usage limited by constraints in producing them and/or from limited
functional utility? How receivers perceive and possibly distinguish between honest and false

38
distance information in sound signals may also be an exciting avenue for future neurophysiological
research.
1.3.2 Directionality of Sound Signals
Many sound signals are directional, radiating with greater intensity in certain directions
than in others. As with visual signals, sound signal directionality can affect how and when signalers
produce sounds, effectiveness of different types of signal functions, and how receivers act upon
signals. The directionality of a sound signal is largely shaped by the morphology that a signaler
uses to create the sound. Sound-producing organs are incredibly diverse, but many are located on
one or a few places on a signalers body. Sound waves originating from these organs will more
quickly propagate into the transmission medium from certain directions (e.g., out of the mouth of
a singing bird), but are blocked and/or dampened by the receiver’s body in other directions. In
addition, external (e.g., nose cones in several species of bats , an open mouth or beak in mammals
and birds) and internal (e.g., dish-like skulls of whales) structures can act as sound emission horns,
further concentrating sound energy in certain directions (Bradbury and Vehrencamp 2011).
Signalers may control directionality by adjusting the horn shape and body posture.
In general, sound produced by a single internal source, such as vocalizations in many birds
and mammals, will produce a sound that is bilaterally symmetrical and loudest in front of the
animals’ mouth (or other sound emission structure) (Hunter et al. 1986). Sound signal
directionality has been measured for a variety of vertebrates (Brumm, Robertson, and Nemeth
2011; Dantzker, Deane, and Bradbury 1999; Holt et al. 2010; Chaverri and Gillam 2013; Frommolt
and Gebler 2004; Lammers and Au 2003; Blackwell et al. 2012; H Carl Gerhardt 1975), as well
as in crickets (Forrest 1991). These studies indicate extreme variation in the extent of sound

39
directionality, ranging from weakly directional (e.g., human speech (A. H. Marshall and Meyer
1985)) to highly directional (e.g., a 30 decibel difference from loudest to quietest direction in
elephant seal calls (Holt et al. 2010)).
Signalers that produce sound with different internal and/or external structures may produce
different patterns of directionality. In ruffed grouse (Bonasa umbellus), for example, males signal
by drumming on logs. As a consequence of the log’s shape, this produces a sound that is bi-
directional, with two opposite facing lobes aligned with the long axis of the log (Garcia, Charrier,
and Iwaniuk 2012). These birds and other signalers that use separate physical structures to produce
sound may be limited in their ability to orient their signals.
As with visual signals, the constraints of directional sounds suggest that signalers would
be under selection to accurately aim strongly directional sounds towards intended receivers to
improve signal efficacy. Indeed, nightingales and sedge warblers orient towards a single rival when
producing a territorial defense call (Brumm and Todt 2003; Brumm, Robertson, and Nemeth
2011). In these experiments, rival birds were simulated by playing back conspecific song on a
speaker, indicating that signalers can use sound information to assess receiver position, likely in
addition to the visual mechanisms described above.
When the position of the intended receiver is unknown (or a signal must reach multiple
receivers), however, signalers may compensate by producing their signal in multiple directions to
increase the chances of facing a receiver. Both nightingales and sedge warblers rotate on their
perch while calling, much like a rotating siren when receiver position is unclear. Similar patterns
of spatial positioning have been observed in northern mockingbirds (Breitwisch and Whitesides
1987), red-winged blackbirds (Brenowitz 1982; Patricelli, Dantzker, and Bradbury 2007), and
crickets (Forrest 1991). This suggest that aiming a strongly directional sound at a known receiver,

40
and rotating while signaling to unknown receiver(s) may be a frequently evolved solution to the
constraints of directional sound. In addition, observing a signaler’s orientation movements can
help to identify intended receivers, and thus be a particularly useful tool for determining signal
function(s) (Brumm, Robertson, and Nemeth 2011).
Likewise, the extent of sound directionality can itself be strongly tied to signal function. A
sound’s directionality determines in large part where the signal can be heard; signalers may exploit
this to control what sound information is available to potential receivers. Red-winged blackbirds
(Agelaius pheoniceus), for example, produce at least five different call types, which co-vary in
their directionality and function. Strongly directional calls are used for dyadic interactions where
receiver position is known (courtship and copulation solicitation, Fig. 5A), while weakly
directional calls are used to communicate with receivers located in potentially many different
directions (alarming conspecifics to danger) (Patricelli, Dantzker, and Bradbury 2007). Likewise,
the antipredator calls of nine other songbird species are also less directional than their courtship
calls (Fig. 5B (Jessica L. Yorzinski and Patricelli 2010)).
In addition, signalers may modulate the directionality of a specific sound in response to the
spatial arrangement of receivers. Dark-eyed juncos, and yellow-rumped warblers all increase the
directionality of their weakly directional alarm calls such that the sound is louder towards the
location of a predator (Jessica L. Yorzinski and Patricelli 2010). This may improve the efficacy of
a signaled message to the predator (e.g., that the predator has been detected and the hunt will not
be successful), indicating that alarm calls in these species might serve dual functions. Signalers
might also weaken the directionality of a strongly directional sound signal if the number of
receivers increases. This, however, has yet to be observed. Nevertheless, modulation of
41
Figure 5. Variation in sound signal directionality can be associated with function
Strongly directional sounds, like the precopulatory song of a red-winged blackbird (A), are often used in
dyadic interactions, and may be aimed at the receiver. Weakly directional sounds, like the alarm call of the
yellow-rumped warbler (B), can be used to reach multiple receivers or receivers at a greater variety of
locations. Distance from the center of the circle with the volume of the call in that direction. Redrawn from
(Patricelli, Dantzker, and Bradbury 2007; Yorzinski and Patricelli 2010).
directionality may be an important mechanism—potentially unique to sound signaling—for
compromise between signal functions with conflicting spatial constraints.
If receivers have experience with the directionality of a specific sound signal, and some
information about the signaler’s location, they may use the properties of the sound they receive as
an indication for signaler orientation and possibly intention. For strongly directional sounds,
receiving a high amplitude can indicate that a signaler is directing their sound towards—and
therefore paying more attention to—the receiver, and vice versa. Male elephant seals (Mirounga
angustirostris), for example, produce a directional threat call that dominant males use to repel
subordinate males from breeding females. However, subordinate males do not back away when
they hear a call that sounds like the dominant male is facing away, indicating that subordinates use
directionality to assess the likelihood of confrontation (Holt et al. 2010). In this manner, sound
directionality and signaler orientation may be critical in mediating receiver responses; this
hypothesis remains a particularly promising and unexplored direction for future research.

42
Relative spatial information between sender and receiver can also be encoded in sound
signals in the form of Doppler shifts. A moving signaler will produce relatively crowded sound
waves in the direction of travel, and relatively spaced out waves in the opposite direction. As a
result, a receiver will experience an overall shift in the received frequency of the sound: higher
frequency if the signaler is approaching, and lower frequency if the signaler is moving away. In
situations where signal function is tied to approaching the receiver (e.g., during courtship, or
agonistic interactions), these Doppler shifts may affect signal function and/or provide information
on signaler speed. The extent of this Doppler shift is determined by the speed of relative motion
and the speed of sound (Bradbury and Vehrencamp 2011). In air, signalers moving at 10m/s (e.g.,
a fast bat or bird) will only produce a Doppler shift of about ~3% (Bradbury and Vehrencamp
2011), suggesting that the effect of this phenomenon on communication may be negligible.
However, flying signalers may produce a significant Doppler shift when producing sound while
diving towards a receiver, as seen in the courtship displays of many hummingbirds. Male Costa’s
hummingbirds have special feathers that produce a tone while diving at females, the pitch of which
can change by up to 28% (from 7 to 9 kHz) due to Doppler shift (C. J. Clark and Mistick 2018).
Males, however, minimize the frequency shift experienced by females by diving not at the female
directly, but at a point displaced to her side. C. J. Clark and Mistick (2018) hypothesize that this
change in positioning suggests that males are attempting to control the information available to
females, who could otherwise assess dive speed (via the extent of the Doppler shift) as a proxy for
males’ physical ability.

43
1.3.3 Directionality of Sound Sensors
Sound reception can also have directional biases, with the extent of this likely determined
by, as with sound signals, sensor structure and location on the receiver’s body. We note that the
term “directional hearing” has, perhaps confusingly, also been used to describe an animal’s ability
to identify the relative location of a sound (i.e., “hear” its direction) (Bradbury and Vehrencamp
2011). However, in the context of this review, we will use “hearing directionality” to describe how
an animal’s ability to detect different types of sound information varies with the direction from
which that sound reaches the receiver. While the vast majority of previous work has focused on
sound locating abilities, a receiver’s orientation can also affect sound perception. For sensory
organs located on only one or a few parts of the body, approaching sound may be blocked and/or
distorted by refraction by the receiver’s body (Bradbury and Vehrencamp 2011). In addition, many
animals (but especially mammals and some birds) have sound detection horns in the form of
external ears (pinna) that amplify incoming sounds for an internal ear where actual detection occurs
(Kühne and Lewis 1985; Rosowski 1994). Much like emission horns, detection horns are
directional; they capture more sound from certain directions. It follows that how incoming sound
from different directions is detected will be affected by sensor shape and orientation. Thus,
receivers are likely under selection to orient their sensors towards sound signals. Species with
pinna may be under stronger selection to do so as a result of increased directional biases in
reception. Pinna are known to move in response to sound, although these movements have been
primarily studied in the context of determining the location of a sound (“localization”; e.g., in cats
(Populin and Yin 1998)), as opposed to explicitly for improving signal reception. Other animals
that lack moveable pinnae may use whole head or body movements for a similar effect (e.g., owls
(Knudsen, Blasdel, and Konishi 1979)). Presumably, localization is followed by pinna

44
reorientation towards the sound to improve reception, but this may not always be the case. As seen
with eye movements (see Chapter 1.2.3), the dynamics of sound sensor orientation may also be
complex and not optimal for signal reception. How receivers control sound sensor directionality
during communication, and how this impacts reception of different types of sound information,
remain as crucial gaps in our understanding of sound communication.
1.3.4 Positioning within the Sound Environment
Spatial heterogeneity in sound environments can affect sound wave transmission, and
therefore how signalers and receivers might position themselves within the environment. When
sound waves encounter objects within their transmission medium, and/or if the medium itself
changes in properties that affect the speed of sound (e.g., temperature, pressure, fluid flow), the
wave can be reflected, refracted (bent) and/or scattered. The nature and extent of these effects
depend on the relative properties of adjacent layers of the transmission medium (or the medium
and an object within it), and can be complex (Pijanowski et al. 2011; Farina 2014). While a detailed
analysis of each of these effects is outside of the scope of this review (but see Bradbury and
Vehrencamp 2011), we highlight one phenomenon, which evidence demonstrates is particularly
likely to affect how animals position themselves during communication.
To increase signal transmission, signalers may be under selection to adjust their vertical
positioning during communication. Refraction of sound waves within different layers of a medium
can affect the distance a signal can travel. Transitions between warm and cold layers of a
transmission medium bend sound waves towards the colder layer, as a result of the difference in
speed of sound between the two. For example, in an open habitat, sound signals produced near the

45
ground on a hot day will bend upwards, and thus away from a distant receiver located the same
height from the signaler. This temperature gradient refraction creates a space where the sound
waves have bent too far upward for a receiver at ground level to hear them clearly, termed a
“shadow zone”. The distance at which the shadow zone begins is, however, a function of the height
at which the sound was produced (R. H. Wiley and Richards 1982). Thus, terrestrial signalers may
be under selection to call from a greater height above the ground such that the shadow zone occurs
further than the receiver’s location, either by adjusting their posture and/or position during
communication. Although we focus here on terrestrial examples, similar phenomena occur in
aquatic systems.
Several bird species (e.g., Eurasian wrens (Mathevon, Aubin, and Dabelsteen 1996),
rufous-and-white-wrens (Barker and Mennill 2009)) move into high perches when singing,
increasing the range of their song (R. H. Wiley and Richards 1982). These behaviors may have the
added effect of avoiding scattering from low vegetation, but may also expose signalers to predators
and/or other eavesdroppers (Campos et al. 2009). Likewise, receivers may benefit from improved
signal transmission at different heights. King penguins listening for a call from their mate, for
example, receive a less degraded (as thus more easily identifiable) sound when standing upright
(as opposed to lying down; Lengagne et al. 1999). We also note that signalers may also respond to
temperature gradient refraction, not via positioning, but by waiting until environmental conditions
change before signaling. For example, at night, air closer to the ground is cooler than air above,
and the effects of refraction instead act to improve signal transmission by curving sound waves
(that would otherwise pass over the receiver) back down towards the ground (Henwood and
Fabrick 1979). By calling at night, male bladder grasshoppers improve the range of their signals
from 150 meters (in the day) to over 1.5 kilometers (Van Staaden and Römer 1997). Dawn
46
choruses, common in a variety of birds, may also have evolved to exploit this phenomenon
(Henwood and Fabrick 1979).
Much like temperature gradients, differences in fluid flow can also refract sound (Bradbury
and Vehrencamp 2011). Sound signals will travel further when aligned with the direction of fluid
flow (as observed in red-winged blackbird calls (Brenowitz 1982)), with this effect being more
noticeable for wind than for water currents. Signalers may benefit from monitoring wind direction
and orienting in the same direction. However, this strategy could limit transmission to receivers in
other directions. Whether signalers choose to “sing with the wind”, and how they manage possible
countervailing selection (e.g., noise produced by the wind, increased thermoregulatory costs from
exposure (Ward and Slater 2005)) on this behavior remain to be investigated.
Finally, signalers may use physical structures in the environment to increase signal range.
Signalers may use sound emission horns to amplify their calls and increase their directionality.
These horns may be naturally occurring (e.g., tree-hole frogs and their eponymous use of tree
cavities (Lardner and Bin Lakim 2002), or Spix’s disc-winged bat’s use of curled leaves (Chaverri
and Gillam 2013)), or constructed (e.g., burrows made my mole crickets (Bennet-clark 1987). For
signalers that use vibratory sounds, signal efficacy may depend on whether signaler and receiver
are touching the same object, and how well that objects transmits vibrations (D. O. Elias, Mason,
and Hebets 2010; M. F. Rosenthal et al. 2019; D. O. Elias, Mason, and Hoy 2004). A signaler’s
ability to find or create appropriately shaped environmental features may be critical to effective
communication in such systems.

47
1.3.5 Critical Needs and Opportunities
Previous work in sound communication has created a powerful foundation for investigating
the geometric constraints on the modality and their evolutionary consequences. Many studies have
explored the physical and environmental factors that determine how sounds degrade as they travel
from signaler to receiver, and how signalers may compensate for these effects. Several studies
have developed robust techniques for measuring sound signal directionality and observing how
signalers orient these sounds (e.g., (Patricelli, Dantzker, and Bradbury 2008; Brumm, Robertson,
and Nemeth 2011; Jessica L. Yorzinski and Patricelli 2010)). The general system of a circular
array of microphones, speakers, and cameras described in these studies of is broadly adaptable.
Several key questions stand out as important future directions. We know much less about
the directionality of sound and sound detection for waves traveling across ground or water
surfaces, leaves, or other approximately flat surfaces. How can signalers control sound
directionality for these types of signals, if at all? In addition, we know very little about the
directionality of sound reception, unlike for visual systems. How does the relative orientation of a
receiver’s sound sensors and/or pinna affect how effectively they can detect and interpret incoming
signals? During communication, how much do receivers track signalers and orient their sound
sensors appropriately? How might signalers’ behaviors have evolved to influence receiver sensor
orientation? Do receivers use environmental structures (e.g., sound detection horns) to improve
reception, as they do with sound signal production? We strongly encourage a new push for work
on sound sensor directionality. This will facilitate testing of the importance of alignment between
the directional biases of signal and sensor, as is beginning to occur for visual communication.

48
1.4 Geometry of Chemical Communication
The mechanisms and geometric constraints of chemical communication are markedly
different from those of other modalities. Unlike visual and sound signals, which travel as waves,
chemical communication relies upon the travel of individual molecules whose chemical properties
carry the signaled information (i.e., semiochemicals). In practice, the transmission of these
semiochemicals (except those delivered by touch) is often driven by interactions with the spatial
properties of the signaling environment (Atema 1995; Alberts, Winkler, and Hall 1992; Muller-
Schwarze 2006). As with other signaling modalities, the detectability of chemical signals tends to
decrease with increasing distance from the origin of the signal. In the absence of fluid flow in the
transmission medium, released semiochemicals will spread via simple diffusion. Apart from weak
directionality introduced if the signaler’s body blocks molecular movement in a direction, the
signal will spread evenly as an expanding sphere. As this sphere grows, the concentration of
semiochemicals will decrease, reducing the number of molecules that can be detected by a receiver.
The rate of diffusion depends on the chemical properties of the signal molecule and of the medium
it is diffusing into. At a certain distance from the location of emission—or after enough time has
passed—the concentration will decrease below the receiver’s threshold for detection.
Receivers can assess this concentration gradient to determine the location of the signal’s
emission; indeed, this appears to be one of the primary functions of many chemical signals, (e.g.,
mate attractant pheromones in many insects (Pokorny et al. 2017; Miller, Loudon, and Freed 2007;
Andersson et al. 2011; Graham et al. 2012; Williams et al. 2013). A large volume of research has
studied how receivers find and use this directional information (reviewed in (Moore and Crimaldi
2004)). However, there is little evidence that signalers assess receiver distance and adjust the
intensity of their chemical signals during communication, as seen in other modalities. This may be

49
because of this information may only be rarely available to signalers, due to the relatively slow
speed of diffusion (compared to visual and sound signals) and the resulting asynchronous nature
of long-range chemical communication. A receiver is likely to have moved before a newly emitted,
more intense signal will have reached them. Instead, how semiochemicals travel from signaler to
receiver is almost always driven by patterns of molecular movement in the environment (“fluid
flow;” either natural, or signaler-generated) (Atema 1995; Alberts, Winkler, and Hall 1992). As
such, efficacy of chemical communication tends to be influenced by how signaler and receiver
position themselves with respect to fluid flow dynamics within the environment more so than in
other modalities, and so we will focus on these factors here.
1.4.1 Fluid Flow and the Directionality of Semiochemical Movement
Signalers may be under selection to improve signal efficacy by orienting themselves with
respect to natural fluid flows in the environment, and/or generating their own. In most natural
conditions, fluid flow will dominate over the effects of simple diffusion (Atema 1995; Alberts,
Winkler, and Hall 1992; Muller-Schwarze 2006). Chemical signal molecules will be pushed along
by the movement of molecules of the transmission medium, and so the direction of fluid flow will
largely define the signals’ directionality and active space.
Signalers can improve transmission by assessing receiver location and positioning
themselves such that fluid flow will carry the chemical signal to a nearby receiver (Fig. 6). Tilapia
(Li and Buchinger 2014) and swordtail fish (G. G. Rosenthal et al. 2011) both release urinary
chemical signals when upstream of a target receiver. Given the preponderance of currents in many
aquatic habitats, this may be a more widespread strategy than current work indicates. Terrestrial

50
organisms may also release semiochemicals from upwind to aim their signal at a known downwind
receiver, but this also remains to be investigated.
When receiver position is unknown, signalers may position themselves within the
environment to increase the dispersive effects of fluid flow. Many terrestrial insects, for
example, produce mate-attractant pheromones to advertise their location (confusingly
termed “calling”). Signalers engaging in chemical calling may select elevated locations in
order to access faster and/or more consistent fluid flows (Bradbury and Vehrencamp 2011;
Moore and Crimaldi 2004). A robust body of work, especially from the field of pest monitoring,
has tested and modeled how wind speed and signaling height influence the dispersion rate and
range of chemical signals (e.g., (Murlis, Willis, and Cardé 2000; Andersson et al. 2011; Witzgall
et al. 2008; Williams et al. 2013; Graham et al. 2012)). However, work on orchid bees suggests
that signalers may also be under selection to avoid chemical “noise” from other signalers by
partitioning signaling heights (Pokorny et al. 2017). The same study shows that signalers may
align themselves with the direction of fluid flow when calling to increase signal transmission.
Calling males rest on the downwind side of trees while calling in windy conditions, so as to
avoid fluid flows being blocked by the tree itself (Pokorny et al. 2017). Receivers may likewise
improve signal detection by resting on the upwind side of objects. While this hypothesis has
not been widely tested, evidence from the resting orientation of wood cockroaches on
trees (genus Parcoblatta) suggests that air flows are not sufficiently blocked by trees to affect
behavior (Miller, Loudon, and Freed 2007).
In addition to exploiting naturally occurring fluid flows, signalers may create their own
(e. g., by spraying semiochemicals in liquid, or through body movement). In this way, signalers
may exert more direct control over when receivers access chemical information. For example,

51
Figure 6. Fluid flows often control the directionality of chemical signals
The relative position of signaler and receiver within a fluid flow may determine the efficacy of a chemical
signal. Many marine organisms release semiochemicals with their urine. Signalers that urinate from directly
upstream (A) will increase the likelihood that the signal reaches the intended receiver (C). Signalers urinating
from other positions (B) may not have their signals reach the receiver.
crayfish use gill movement to generate their own flow currents and use these to direct urine
towards the receiver (Bergman, Martin, and Moore 2005). Similar behaviors are seen in lobsters,
newts, and bats (Atema 1995). Likewise, terrestrial animals may directly spray urine at a
receiver. For example, female mara (a large rodent), spray urine at other females, the scent of
which serves to reduce harassment from males (Ottway, Pankhurst, and Waterhouse 2005)). The
extent to which this behavior occurs in other terrestrial systems has not been well explored,
but it is likely associated with communication interactions where the receiver’s position is
known (as opposed to the ‘broadcast’ communication described above).

52
1.4.2 Critical Needs and Opportunities
We have a growing understanding of how natural fluid flow shapes the positioning of
signalers during chemical communication, and several studies provide examples for how to
address the challenges of measuring the associated geometry. Fluid flow may be measured with
specialized equipment (e.g., a three-dimensional anemometer (Girling, Higbee, and Cardé 2013)),
or relatively low-tech approximation (e.g., the novel “feather boa” technique employed by (Miller,
Loudon, and Freed 2007)). Researchers with access to air tunnels and flow chambers may use
these to test hypotheses by manipulating fluid motion, although these (esp. air movement tests)
can also sometimes be approximated with household solutions, such as a portable fan (Miller,
Loudon, and Freed 2007). Measuring the actual movement of semiochemicals in real-time remains
a more involved process, which may be why many studies prefer to use signaling outcomes as a
proxy (e.g., the number of conspecifics attracted by a pheromone trap (Girling, Higbee, and Cardé
2013)) (Muller-Schwarze 2006; Riffell, Abrell, and Hildebrand 2008).
There are several open directions for future research. We know perhaps the least about the
directionality of reception for chemical signals. Due to the specific location of chemical sensors
on the body (generally the head or on antennae or other limbs), fluid flows carrying
semiochemicals may be blocked or slowed from certain directions. Work on fluid dynamics has
shown that the shape of the sensor and surrounding morphology will affect how fluid flows in and
through the sensor, loosely defining a volume of surrounding space that feeds into the sensory cells
(Jaffar-Bandjee, Krijnen, and Casas 2020; Craven, Paterson, and Settles 2010). Many species
repeatedly reorient their body and/or antennae to track the direction of a chemical plume back to
its source (Atema 1995; Breithaupt and Thiel 2011), indicating that these chemical sensors have
some directional biases. Likewise, many species engage in “sniffing” behaviors to increase fluid
53
flow over and/or through their chemical sensors. However, slower timescales of chemical
communication along with its often asynchronous nature likely precludes the complex interactions
of signal and sensor orientation as seen in other modalities.
Also interesting are the possible consequences of variation in spatial positioning. How do
signalers vary in their efforts to signal from upstream of a receiver, or to create a fluid flow in that
direction? And how might this variation affect signaling outcomes? It is possible that diffusion
across short distances may relax pressure on signal aiming, especially compared to other
modalities. In addition, the asynchronous nature of many chemical signaling interactions would
preclude the importance of moment-to-moment alignment of the directional chemical signals and
chemical sensors. However, signaling alignment may still influence effectiveness in close-range
communication with signaler-generated fluid flows (e.g., signaling via urine spraying), and we
encourage future work to explore this possibility.
1.5 Conclusions
In summary, effective communication is often reliant on the interaction between the
inherent directional constraints of signal transmission and reception, and the positioning of signaler
and receiver on fine spatial and temporal scales. Signal efficacy tends to decrease with increasing
distance between signaler and receiver, either as a consequence of shrinking image size, fading
and echoing sound, or rarefaction of semiochemicals. Signals themselves propagate further in
certain directions than in others, and the physiological design of sensory organs means that
receivers ability to detect stimuli also varies with the direction of the incoming stimulus.
Environmental conditions may modify the extent of these directional constraints, or impose their

54
own (e.g., fluid flow). The growing body of work reviewed here show that across three major
signaling modalities and a diversity of species, signalers and receivers likely experience selection
to manage their positioning during communication.
We find frequent evidence that signalers assess and manage their positioning so as to
improve signal effectiveness. Generally, signalers may increase signal intensity to compensate for
degradation at increased distance (e.g., (Brumm and Slater 2006; Echeverri, Zurek, and Morehouse
2020; Steinberg and Leal 2013)), aim directional signals towards receivers (e.g., (White, Zeil, and
Kemp 2015; Olea et al. 2010; Jessica L. Yorzinski and Patricelli 2010), and/or position themselves
with respect to environmental features that increase transmission (Mathevon, Aubin, and
Dabelsteen 1996; Dakin and Montgomerie 2009; Olea et al. 2010; Pokorny et al. 2017). Signaler
behavior has been shown to co-evolve with signal directionality to improve efficacy, although this
work is currently limited to hummingbirds (Simpson and McGraw 2019). In contrast, we know
comparatively little about the spatial behavior of receivers, and its consequences for
communication. In particular, very few studies have measured how receivers orient their sensory
systems. This lack of research is evidence of an unspoken and largely untested assumption that
receivers will orient so as to maximize signal reception. So far, this assumption has only been
tested for visual signals, but that research shows that, contrary to expectations, where receivers
look during visual communication can be dynamic and often suboptimal for signal reception
(Jessica L Yorzinski et al. 2013; J. L. Yorzinski et al. 2015; Echeverri, Morehouse, and Zurek
2017). This suggests that receivers’ spatial behavior may be under different selective pressures
than those of signalers.
Perhaps the most promising direction for future research is investigating the dynamics of
signaling alignment, and its consequences for signal efficacy. To increase signal efficacy, signaler
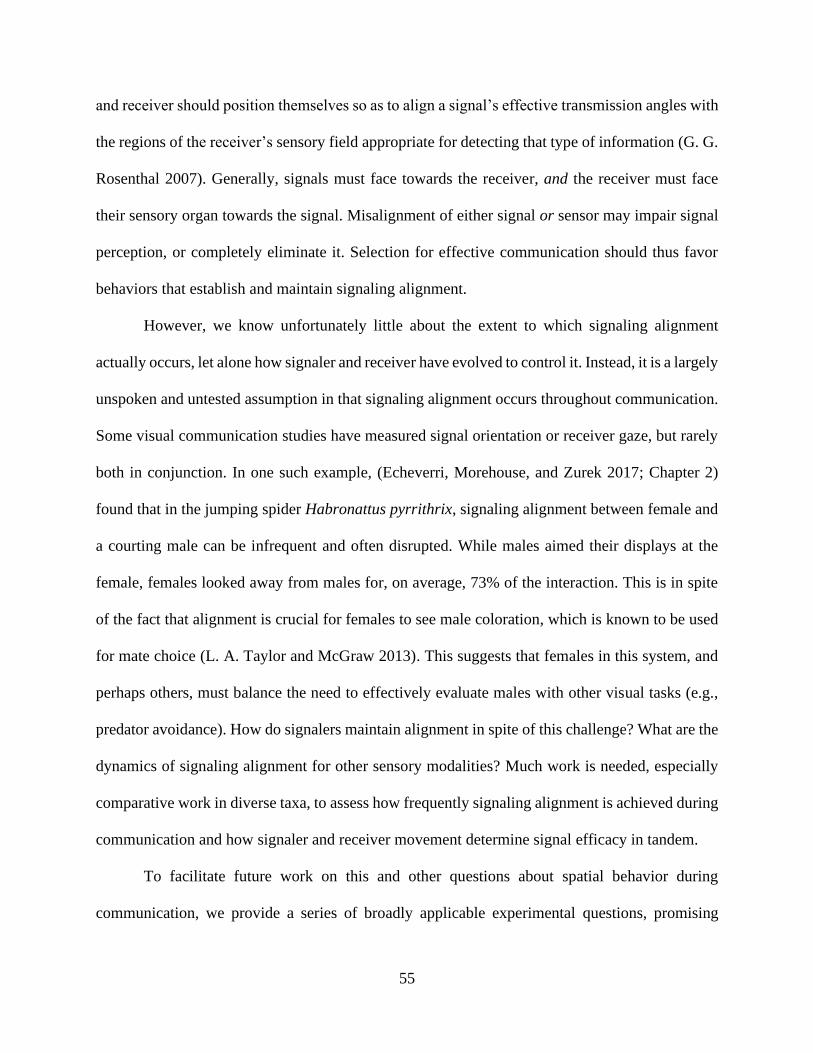
55
and receiver should position themselves so as to align a signal’s effective transmission angles with
the regions of the receiver’s sensory field appropriate for detecting that type of information (G. G.
Rosenthal 2007). Generally, signals must face towards the receiver, and the receiver must face
their sensory organ towards the signal. Misalignment of either signal or sensor may impair signal
perception, or completely eliminate it. Selection for effective communication should thus favor
behaviors that establish and maintain signaling alignment.
However, we know unfortunately little about the extent to which signaling alignment
actually occurs, let alone how signaler and receiver have evolved to control it. Instead, it is a largely
unspoken and untested assumption in that signaling alignment occurs throughout communication.
Some visual communication studies have measured signal orientation or receiver gaze, but rarely
both in conjunction. In one such example, (Echeverri, Morehouse, and Zurek 2017; Chapter 2)
found that in the jumping spider Habronattus pyrrithrix, signaling alignment between female and
a courting male can be infrequent and often disrupted. While males aimed their displays at the
female, females looked away from males for, on average, 73% of the interaction. This is in spite
of the fact that alignment is crucial for females to see male coloration, which is known to be used
for mate choice (L. A. Taylor and McGraw 2013). This suggests that females in this system, and
perhaps others, must balance the need to effectively evaluate males with other visual tasks (e.g.,
predator avoidance). How do signalers maintain alignment in spite of this challenge? What are the
dynamics of signaling alignment for other sensory modalities? Much work is needed, especially
comparative work in diverse taxa, to assess how frequently signaling alignment is achieved during
communication and how signaler and receiver movement determine signal efficacy in tandem.
To facilitate future work on this and other questions about spatial behavior during
communication, we provide a series of broadly applicable experimental questions, promising

56
hypotheses, and examples of best practices. We encourage researchers to consider the following
questions to assess what is known about signaling geometry in their system, and use gaps in
knowledge as inspiration for new research:
• What are the applicable spatial constraints on signal transmission and reception?
• How do different geometries of signalers, receiver, and/or environmental conditions
change how detectable signals are to the receiver? What spatial arrangements are most
likely to lead to effective communication of the signaled information?
• How often are these geometries achieved during communication?
• How do signaler and receiver behaviors contribute to or detract from effective
positioning?
• What are the signaling and associated selective consequences of ineffective
geometries?
• How does positioning behavior, signal directionality, and/or sensor directionality
evolve or co-evolve? How does do these spatial constraints vary between close
relatives?
• How do signalers and receivers handle sub-optimal signaling geometries? How do
signalers and receiver position themselves when, for example, environmental
conditions for effective transmission are at odds with directing the signal towards the
receiver, or when communicating with multiple receivers?
• What neurological processing is required for signaler and receiver each to manage
geometries? What information must they process and when?

57
• How do signalers vary in their ability to manage geometric constraints during
communication? What traits (e.g., body condition, age, cognitive ability) affect
signalers’ abilities to do so?
To interpret resulting observations, we adapt and expand upon several hypotheses
regarding how animals may position themselves during communication:
• Signaler-driven optimization: This predicts that signalers will position themselves and their
signals in with respect to the receiver and the environment to optimize signal transmission
and reception. Signaler behavior will thus increase alignment between directional biases in
transmission and reception and/or compensate for distance-dependent effects. This
hypothesis is an extension of selection for signal efficacy as predicated by sensory drive
(J. A. Endler 1992; 1993a; G. G. Rosenthal 2007), and is well supported for all three
signaling modalities.
• Receiver-driven optimization (proposed by (Hutton et al. 2015): This hypothesis predicts
that receivers will position themselves to maximize stimulation received from signals. As
such, receiver behaviors will increase signaling alignment (e.g., turning their pinna towards
a calling signaler).
• Receiver-imposed handicap (proposed by (Hutton et al. 2015): This predicts that receivers
will position themselves in a manner that is suboptimal for signal transmission. As such,
receiver behaviors will decrease signaling alignment (e.g., looking away from a visual
signal, moving behind a physical obstruction or onto a different sound transmission
medium). Receivers may do so to evaluate signalers’ ability to assess and adapt to spatial
signaling challenges (i.e., their spatio-social skill (Sih, Chang, and Wey 2014; Echeverri,

58
Morehouse, and Zurek 2017; Sih, Sinn, and Patricelli 2019)), and/or if a cumulative
assessment of a signal is informative (e.g., if signal directionality is tied to signaler quality).
• Limited attention (adapted from (Reuven Dukas 2004; R Dukas 2002)): This hypothesis
predicts that how receivers position themselves reflects a dynamic trade-off between
optimal geometries for signal evaluation, and those necessary for other ecological tasks
(e.g., predator avoidance). The extent to which receiver behavior increases or decreases
signaling alignment will be driven by the urgency of the task (e.g., receivers spend more
time looking towards a signaler when predator cues are absent).
As best practices for measuring spatial constraints and positioning depend in part on
signaling modality, we direct researchers to exemplary studies within each modality (Table 1). A
combination of extensive monitoring equipment (e.g., multi-angle camera arrays) and
computationally-intensive manipulations (e.g., virtual reality paradigms) will likely become
commonplace for this research. However, such studies should continue to be based on and
compared to observations of free-moving animals in natural settings, as this is the gold standard
for this research. In addition, we emphasize that researchers can still measure signaling geometry
and test hypotheses with widely accessible equipment, especially for visual and sound
communication. Even a single basic sensor (camera or microphone) can be provide for a coarse
but effective measurement of signal directionality. Filming signaling interactions, even if just with
a single top-down or side view can be sufficient to the extent of signaling alignment, especially
when combined with basic information about sensor directionality potentially available in
physiology research (e.g., field of view). Body, head, and/or eye orientation of signaler and
receiver can be analyzed from video footage using free programs such as ImageJ, and the relative
orientation of both actors can be used to calculate the extent to which they face each other (for

59
example, see Echeverri, Morehouse, and Zurek 2017)). We strongly encourage researchers to use
the tools available to incorporate a geometric framework into future studies on signal efficacy,
even if only some parameters can be measured.
Finally, we call attention to the potential role of multimodal signaling in affecting
positioning and signaling geometry. While we have thus far considered the geometric constraints
of each modality in isolation, many animal signals involve two or more modalities (e.g., a visual
display paired with a song, as in many birds and jumping spiders). As discussed in this review,
each modality differs, often greatly, in its inherent spatial constraints on transmission and
reception. As a result, the selection on positioning for multimodal signals may be complex, and
we call for signaling geometry to be including in the ongoing research on the function and
evolution of multimodal signals (Hebets and Papaj 2005; Partan 2013). In communication
interactions where multimodal signal components are both informative, for example, signalers and
receivers may experience particularly strong selection on behaviors that achieve effective signaling
geometries for both modalities. Given that certain modalities may be more directional than others,
it is also possible that one modality of the signal may function to manage signaling alignment for
effective communication in another modality. A weakly directional sound signal, for example,
may serve to indicate the location of the signaler, cueing the receiver to reorient their field of view
towards a visual signal that is produced in synchrony or shortly after the sound. This “guiding” of
signaling alignment may be a widespread function of multimodal signals that contain one or more
strongly directional components, and we encourage a thorough investigation of this hypothesis.

60
Table 1. The elements of signal geometry, their causes, consequences, and key examples
Element of
Signaling
Geometry Common Causes
Consequence(s) for Signal
Efficacy Measurement Methodology Key Examples
Communication
distance: The
linear distance
between signaler
and receiver.
Alternatively
termed "receiver
distance",
"viewing
distance"
Visual
Signaler and receiver
are spatially separated
Visual
Image size decreases
with distance,
Image blurs outside
of focusing range
Visual
AcuityView software package
(requires acuity information)
(E. Caves and Johnsen
2017; E. M. Caves,
Brandley, and Johnsen
2018; How et al. 2008;
Steinberg and Leal
2013)
Sound Sound
Sounds attenuate with
distance Sound
Microphone(s) (or vibration sensor)
at range of distances from signaler
(Brumm and Slater
2006)
Chemical Chemical
Semiochemicals
diffuse over time
Chemical
Compare semiochemical
concentration from samples at
different distances over time. Can
also estimate based on response rate
of receivers located at different
distances
Remains to be well
studied
Signal
directionality:
The extent to
which signal
properties (e.g.,
color, visibility,
volume,
semiochemical
concentration)
vary when
observed from
different
directions
Visual
Signaler's body blocks
viewing, appearance
changes with viewing
angle (e.g., iridescence)
Visual
Signal only visible
from certain angles,
color changes with
angle (iridescence)
Visual
Sequential imaging of signal from
different angles
(Santos et al. 2007;
White, Zeil, and Kemp
2015; Gruson et al.
2019; Meadows et al.
2011; Skigin et al.
2019)
Sound
Physical objects direct
and/or dampen sound,
emission horns focus
sounds in a direction
Sound
Volume varies with
direction, directional
loss of certain signal
elements (e.g., high
frequency sounds,
harmonics)
Sound
Microphone(s) (or vibration sensor)
at range of angles
(Brumm, Robertson,
and Nemeth 2011;
Patricelli, Dantzker,
and Bradbury 2008;
Garcia, Charrier, and
Iwaniuk 2012;
Patricelli, Dantzker,
and Bradbury 2007)
Chemical
Fluid flows directs
spread of
semiochemicals Chemical
Travel and
concentration of
semiochemicals Chemical
Can be estimated from releasing
visible chemicals in same fluid flow See fluid flow, below
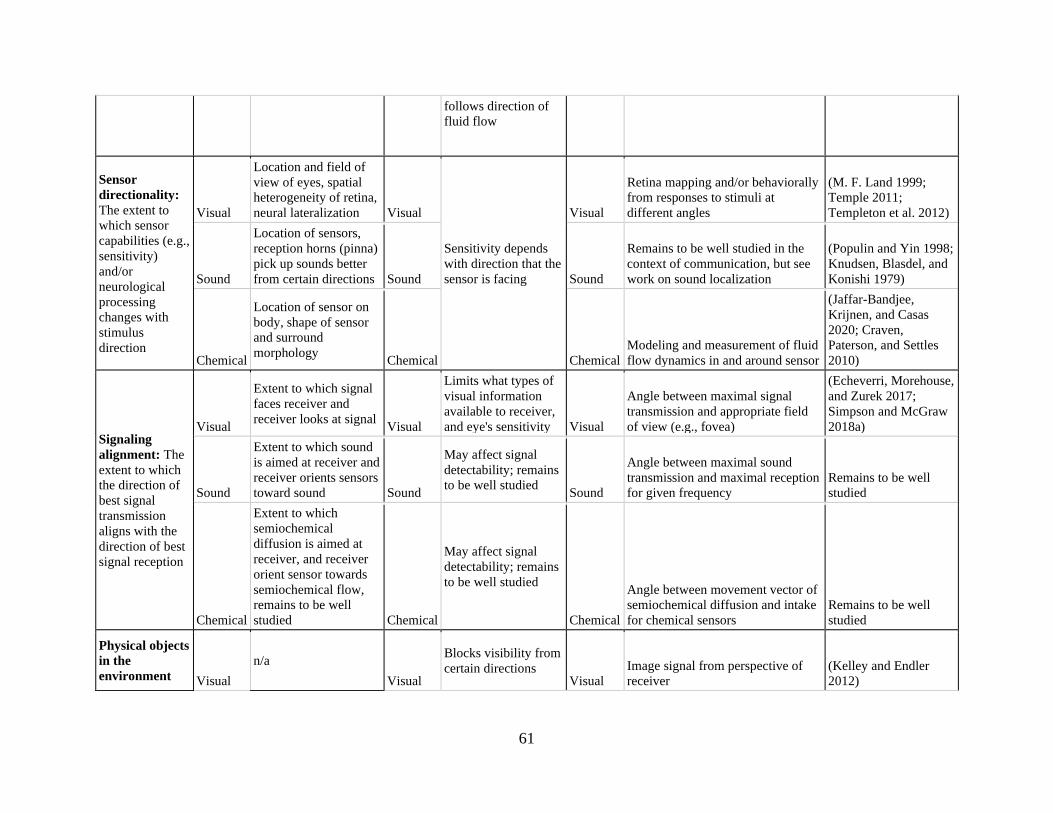
61
follows direction of
fluid flow
Sensor
directionality:
The extent to
which sensor
capabilities (e.g.,
sensitivity)
and/or
neurological
processing
changes with
stimulus
direction
Visual
Location and field of
view of eyes, spatial
heterogeneity of retina,
neural lateralization Visual
Sensitivity depends
with direction that the
sensor is facing
Visual
Retina mapping and/or behaviorally
from responses to stimuli at
different angles
(M. F. Land 1999;
Temple 2011;
Templeton et al. 2012)
Sound
Location of sensors,
reception horns (pinna)
pick up sounds better
from certain directions Sound Sound
Remains to be well studied in the
context of communication, but see
work on sound localization
(Populin and Yin 1998;
Knudsen, Blasdel, and
Konishi 1979)
Chemical
Location of sensor on
body, shape of sensor
and surround
morphology Chemical Chemical
Modeling and measurement of fluid
flow dynamics in and around sensor
(Jaffar-Bandjee,
Krijnen, and Casas
2020; Craven,
Paterson, and Settles
2010)
Signaling
alignment: The
extent to which
the direction of
best signal
transmission
aligns with the
direction of best
signal reception
Visual
Extent to which signal
faces receiver and
receiver looks at signal Visual
Limits what types of
visual information
available to receiver,
and eye's sensitivity Visual
Angle between maximal signal
transmission and appropriate field
of view (e.g., fovea)
(Echeverri, Morehouse,
and Zurek 2017;
Simpson and McGraw
2018a)
Sound
Extent to which sound
is aimed at receiver and
receiver orients sensors
toward sound Sound
May affect signal
detectability; remains
to be well studied Sound
Angle between maximal sound
transmission and maximal reception
for given frequency
Remains to be well
studied
Chemical
Extent to which
semiochemical
diffusion is aimed at
receiver, and receiver
orient sensor towards
semiochemical flow,
remains to be well
studied Chemical
May affect signal
detectability; remains
to be well studied
Chemical
Angle between movement vector of
semiochemical diffusion and intake
for chemical sensors
Remains to be well
studied
Physical objects
in the
environment Visual
n/a
Visual
Blocks visibility from
certain directions Visual
Image signal from perspective of
receiver
(Kelley and Endler
2012)

62
Sound Sound
Reflects and/or
refracts sound, net
effect on transmission
varies Sound
Measure sound transmission in
different physical environments
(Mathevon, Aubin, and
Dabelsteen 1996;
Barker and Mennill
2009; R. Haven Wiley
and Richards 1978)
Chemical Chemical
May redirect fluid
flow, or allow access
to areas of different
flow Chemical
Measure fluid flow in different
physical environments
(Pokorny et al. 2017;
Girling, Higbee, and
Cardé 2013; Moore and
Crimaldi 2004)
Fluid flow:
Directional
movement of the
transmission
medium
Visual
n/a
Visual
n/a
Visual n/a n/a
Sound Sound
Increases wave
transmission in
direction of flow,
decreases in opposite
direction Sound Flow measurement tools (Brenowitz 1982)
Chemical Chemical
Carries
semiochemicals in
direction of fluid flow Chemical Flow measurement tools
(Girling, Higbee, and
Cardé 2013; Miller,
Loudon, and Freed
2007)

63
2.0 Control of Signaling Alignment During the Dynamic Courtship Display of a Jumping
Spider
The contents of this chapter are adapted from a published article of the same name. © 2017
Echeverri et al. Originally published in the journal Behavioral Ecology.
https://doi.org/10.1093/beheco/arx107
2.1 Introduction
In animal communication, directional biases in signal transmission and reception can have
a strong influence on signaling effectiveness. While this is likely to be true for many signaling
modalities, it is particularly pronounced in visual signaling. Both visual signals and visual systems
often have strong directional biases, and this places a number of distinct constraints on signaling
in this modality. First, because the appearance of visual signals is often angle-dependent, visual
signals face spatial constraints on their visibility. For example, from certain vantage points,
signaling surfaces may be partially or fully obscured by the signaler’s body, or may transmit and/or
reflect light differently. The latter situation is particularly pronounced for specular or iridescent
signals (Osorio and Ham 2002; Doucet and Meadows 2009; Hutton et al. 2015; Leo J. Fleishman
et al. 2015). Thus, signalers may need to carefully monitor their own position relative to receivers
to make sure that their signals are detectable. Second, visual systems have inherent biases in
sensitivity as a result of the directionality of lens optics combined with regionalization of retinal
function (e.g. foveal areas; Temple 2011; Land and Nilsson 2012). Eyes can only evaluate stimuli

64
that fall within their field of view, and photoreceptor mosaics are rarely, if ever, homogenous
across the retina. Instead, most retinas exhibit strong regionalization of visual functions such as
color perception, spatial acuity, and motion detection (Land and Nilsson 2012). Such
regionalization means that receivers cannot see all types of visual information everywhere all at
the same time. Thus, perception of visual signal characteristics (e.g., color, pattern) will often
strongly depend on their position within the receiver’s field of view.
As a result of these directional biases in signal propagation and signal reception, alignment
of these two aspects of visual signaling (hereafter “signaling alignment”) is likely to often be
important for communication efficacy. Spatial arrangements that align key signal features with the
appropriate regions of the receiver’s visual field will increase signaling efficacy, whereas
misalignment may reduce or even eliminate signal perception. While selection for communication
efficacy should thus favor behaviors that establish and maintain signaling alignment (Endler 1992),
we know little about the extent to which signaling alignment actually occurs, let alone how signaler
and receiver contribute to its establishment and maintenance. Previous work has shown that some
signalers employ color and motion elements designed to be particularly salient in their visual
environment (e.g., Fleishman 1992; Peters and Evans 2003; Fleishman et al. 2015), and may also
deliberately position themselves relative to the sun to augment the salience of directional visual
signals (Hamilton 1965; Dakin and Montgomerie 2009; Olea et al. 2010; White, Zeil, and Kemp
2015; Klomp et al. 2017). For example, males with iridescent color ornaments have been shown
to aim their displays toward prospective mates (e.g., Anna’s hummingbirds, Calypte anna,
Hamilton 1965; and common eggfly butterflies, Hypolimnas bolina, White et al. 2015). However,
we know much less about how receivers direct the focus of their visual systems during
communication. For example, none of the studies cited above have explicitly measured how

65
dynamic responses of receiver body position or eye orientation might promote or impede optimal
signaling alignment. The result is an implicit assumption that receiver position always supports
optimal evaluation of the male display. Pivotal work by Yorzinski et al. (2013) concerning where
peahens (Pavo cristatus) look during peacock displays reveals that receiver behavior need not
match such expectations of optimality. Instead, displays may be under selection explicitly to
capture and retain the visual attention of distractible receivers (R Dukas 2002; Számadó 2015).
Work to investigate this more dynamic view of visual signaling is sorely needed.
To better understand signaling alignment over the course of a dynamic signaling
interaction, we studied both male and female position during courtship in the jumping spider
Habronattus pyrrithrix (Chamberlin 1924; Aranea: Salticidae). Both the visual signals and visual
system of this species have clear directional biases. First, male displays are forward-facing. During
courtship, males produce a series of distinctive displays that include stereotypical movements and
brightly colored ornaments (Taylor et al. 2010; Taylor and McGraw 2013). These display routines
can be divided into long-range and short-range bouts distinguished by differences in not only
distance from receiver, but also distinct posture and movement repertoires (Fig. 7a,b; Elias et al.
2012). Males initiate courtship with the long-range phase, which involves sidling, forelimb
waving, and palp movements that reveal the underlying red male clypeus (Fig. 7a). After
approaching the female, males then switch to the close-range phase, which is characterized by
rapid movements of the black-and-white tarsi of the raised first leg pair, and ratchet-like
movements of third leg pair that bring conspicuous orange patches on the femur (“knees”) into
view above the male’s head (Fig. 7b). Male appearance, particularly the red male clypeus, affects
male success during courtship (Taylor and McGraw 2013). Many of the prominent visual elements
of these displays are partially or entirely obscured when viewed from the side (Fig. 7c). Thus,

66
males should benefit from directing these displays toward the appropriate region of the female
field of view.
Color and high acuity vision in H. pyrrithrix are also forward-facing. Like all jumping
spiders, H. pyrrithrix has two principal eyes and six lateral eyes. Only the two principal eyes are
capable of detail and color discrimination (Land 1969; Blest et al. 1981; Zurek et al. 2015). While
the movable retinas of the principal eyes can scan within their movement range, this is limited to
a cone of approximately 60 degrees in front of the animal (Land 1969). Thus, the field of color
vision is restricted to a 60-degree cone centered around the spider’s facing direction. This is in
contrast to the lateral eyes, which function as monochromatic motion trackers and have a combined
field of view of up to 360 degrees (Duelli 1978; M F Land 1985; Zurek and Nelson 2012b).
Because both male color displays and female color vision are forward-facing, female
perception of male coloration is strongly influenced by position and orientation of both actors. If
males do not orient their display towards the female, and/or if a displaying male is not within the
field of view of a female’s principal eyes, male color and pattern information will not be visible
for female evaluation. Both actors may therefore be under selection to establish and maintain
signaling alignment.
Our focus here is on visual signaling, because this modality exhibits the strong directional
biases described above. It is important to note that courtship in H. pyrrithrix and other salticids
also involves other modalities. Males often perform complex vibrational songs alongside their
visual display behaviors (Elias et al. 2012), and these vibrational elements are likewise important
to mate choice (D. Elias et al. 2005). However, under our experimental conditions, these
vibrational songs are unlikely to have strongly directional properties, and in the field, directional
propagation of these vibrations will be haphazardly determined by substrate properties (D. O.

67
Elias, Mason, and Hoy 2004). In addition, both sexes deposit silk draglines during normal
locomotion, which may serve as chemo-tactile spatial cues of an individual’s previous path, and
males may use these silk lines to track down females in the field (R. Jackson 1987). However, any
given silk deposit is an unreliable indicator of its creator’s current position, as it does not account
for subsequent movement and direction changes following silk deposition. While both substrate-
borne vibrations and chemical signals contain spatial information, communication efficacy in these
modalities is less strongly tied to the geometry of signaler and receiver. Here, we chose to focus
on the more predictably directional challenges of visual signaling, but return to potential functions
of vibrational signaling in particular in the Discussion.
In this study, we asked two main questions. First, we sought to determine to what extent
signaling alignment is established and maintained throughout a signaling interaction. Second, we
asked how signaler and receiver each contribute to signaling alignment. While both males and
females stand to benefit from effective communication, control of alignment need not be evenly
split. We addressed these questions by first measuring the position and orientation of live males
and females during live courtship interactions. We then followed up on these live interactions by
quantifying male position when males courted non-living female models. This second series of
experiments allowed us to separate male signaling behavior from female behavioral responses, and
to determine how males responded to experimentally induced changes in female orientation.

68
Figure 7. Habronattus pyrrithrix courtship
Male posture during (a) long-range and (b) short-range phases of courtship, c) side view of short-range
courtship interaction (photo by Colin Hutton), and d) coordinates and angles determined: distance between
male and female (point A to point C), absolute angle of each spider relative to the arena (β), male azimuth in
female field of view (θM∈F), female azimuth in male field of view (θF∈M), alignment angle between male and
female body axes (α).

69
2.2 Methods
2.2.1 Study Species and Maintenance
Habronattus pyrrithrix is a small, sexually dimorphic jumping spider found in riparian
habitats and grassy agricultural and urban areas ranging from southern California and Arizona to
Sinaloa, Mexico. We collected adult and sub-adult individuals from two high-density populations
in Queen Creek, Arizona (33°13’16” N, 111°35’50” W), and Yuma, Arizona (32°43’53” N,
114°36’49” W) in May 2014 and June 2015. Following field capture, we housed spiders
individually in translucent cylindrical plastic containers (7cm diameter, 6cm tall) in a climate-
controlled chamber that maintained a constant temperature (24˚C), constant humidity (55% RH),
and a 16:8h light:dark cycle. The material of the housing containers prevented adjacent individuals
from seeing each other clearly, if at all. We fed each spider once per week with cricket nymphs
(1st-3rd instar Acheta domesticus or Gryllodes sigillatus) in quantities approximately equal to
twice the spider’s mass. We ran courtship trials between September and December 2014 for
animals collected in May 2014, and between September and October 2015 for animals collected
in June 2015.
2.2.2 Courtship Interactions
Courtship interactions took place in a custom-built arena consisting of a 16cm diameter
disc of 3mm thick matte white polystyrene (Plastics 2000, Modesto, CA) affixed atop a cylinder.
Spiders were free to leave this platform at any point during trials. The polystyrene surface should
allow for the transmission of at least some frequencies of male vibrational song (D. Elias, personal

70
communication). Thus, females in live trials experienced both visual and vibratory elements of
male courtship displays. For trials involving female models, a vertical rod protruding 1-2 mm from
the center of the arena floor allowed us to mount models by their ventral surface, and to rotate
them with a mechanism below the setup. All trials took place under full-spectrum natural light in
a greenhouse. Trials were filmed from above the center of the arena, with a Nikon D7000
(1920x1080 pixels, 24 frames/second) in 2014, and with a Panasonic Lumix DMC-GH4
(3840x2160 pixels, 30 frames/second) in 2015. Supplemental lighting was provided by two
Neewer DN-160 LED light panels. To remove silk and odor cues from previous interactions, we
wiped down the arena surface with 95% ethanol following each trial.
2.2.3 Interactions Between Live Males and Females
To characterize the degree to which signaling alignment naturally occurs in courtship, we
filmed courtship between unrestrained adult male and female pairs. Because male jumping spiders
often use dragline silk as a cue of female proximity (D. O. Elias, Andrade, and Kasumovic 2011),
we placed the female atop the arena before introducing the male and allowed her to lay silk
draglines. If males did not begin courting within 5 minutes, we removed both animals and ended
the trial. If either animal left the arena during this period, we returned them to the arena top and
allowed them another chance to initiate courtship.
Once males began to court females, we allowed courtship to proceed for 10 minutes, until
males attempted to copulate, or until aggression by the female occurred, whichever occurred first.
In our experience, this 10-minute period permits males to progress through both long-range and
short-range courtship phases. We excluded from subsequent analyses any trial where courtship did
not include both long-range and short-range display types, resulting in useable data from 18 pairs.

71
All males and females were only used once. Individuals comprising 8 of the 18 pairs were captured
in the field as adults, and were thus of uncertain mating status. The other 10 pairs were captured
as sub-adults and lab-raised to maturity, and thus known to be virgin. We did not find significant
differences in different measures of courtship and alignment behavior between these two groups
(field-matured versus lab-matured, see Results), and thus pooled all trials with live pairs in
subsequent analyses.
2.2.4 Interactions Between Live Males and Female Models
To investigate the contribution of male behaviors to signaling alignment in the absence of
female movement, we filmed adult males displaying to female models. Models were created by
ventrally mounting a dead female onto a rotating rod protruding from the floor of the arena. These
females were adults from our lab colony who died of natural causes, and were frozen at -80°C
within 24 hours of death. Before introducing the male, we allowed a live lab-matured female to
walk about the arena in order to deposit silk and other chemical cues, which we found increased
male propensity to remain on the arena until visually noticing the model. The same female was
used for all model trials, and was not re-used for any other part of the study. Consistent with
previous studies of Habronattus jumping spiders (e.g., Elias et al. 2012), males were observed to
readily court these dead females. Female models were only used for a maximum of two days of
filming. Models did not include any females from the live courtship trials. Males used for live
female interactions were not used for interactions with model females, with the exception of three
field-matured males.
We used a paired design to evaluate male courtship of stationary (n =14) and (n = 12)
turning models. To prevent sequence effects, individual males randomly experienced either the

72
stationary or turning model first, utilizing a list randomizer from http://random.org. To encourage
initiation of courtship following introduction of the male into the arena, we rotated the female
model to imitate typical female scanning behavior. For the stationary model treatment, we did not
move the female model after courtship had commenced, and allowed the male to court for ten
minutes or until he attempted to mount the model.
We investigated how males respond when females turn away during courtship by
quantifying male courtship behaviors following experimental reorientation of female models. We
allowed male courtship to proceed until males began their short-range phase of courtship. After
five seconds of short-range male display, we rotated the model so that it faced away (approximately
180 degrees) from the male. This turn magnitude is common in live interactions, and was chosen
to present males with maximal misalignment. Following rotation, we then left the female model
stationary for the remainder of the trial (10 minutes of courting or until a mounting attempt).
For stationary-model trials, we excluded any trials that did not contain both long-range and
short-range displays. For the turning-model condition, we only excluded trials that did not contain
short-range displays.
2.2.5 Video Analysis
We used Adobe Premiere Pro CC v9.1 (Adobe Systems Inc., San Jose, CA, USA) to trim
each trial video to only include the longest continuous courtship sequence. We defined a
continuous sequence as beginning when the male initiated his courtship display, and ending when
the male ceased displaying for more than 60s despite remaining oriented toward the female, left
the arena top, or when the end of the trial was reached. Videos were down-sampled to 5 frames
per second (fps) for analysis because our preliminary analyses indicated that this frame rate

73
allowed us to resolve even the briefest time period between male reorientation movements
observable in unedited 30 fps footage. We used ImageJ (v.2.0.0-rc-34/1.50a, Schneider et al. 2012;
Schindelin et al. 2012) to mark the locations of the pedicel (B, D in Fig. 7d) and the point between
the principal eye lenses (A, C in Fig. 7d) in both spiders. We calculated the following
measurements for each video frame using MATLAB (r2014a, The MathWorks, Inc., Torrance,
CA, USA): distance between male and female (distance from A to C in Fig. 7d), male azimuth in
female field of view (θM∈F), female azimuth in male field of view (θF∈M), alignment angle between
male and female body axes (α), and absolute angles of male (βM) and female (βF) body axes relative
to the top left corner of the video frame. All angles are reported in radians. For each trial, we scored
male display phase as long-range (sidling movement with large amplitude lateral waves of the 1st
leg pair) or short-range (stationary with both 1st legs raised high). Lastly, for short-range courtship
involving live males and females, we also quantified a conspicuous male behavior that may be
related to capturing and/or retaining female visual attention: ratcheting movements that raise the
orange patch on the 3rd leg femur above the cephalothorax, bringing these “knees” into the female’s
field of view. The timing of these “knee raises” was considered explicitly in relation to female
position and reorientation behavior to determine whether males employ these either 1) to elicit
female reorientation toward the male display, or 2) as a response to female re-orientation toward
the male display.
2.2.6 Statistical Methods
All statistical tests were carried out using R version 3.2.2 (R Core Team 2015). We
determined the distances at which males initiated long- and short-range courtship stages, and tested

74
whether these differed between trials with live and model females using Welch's unequal variances
t-tests.
Tests on circular data used the R package ‘circular’ v0.4-7 (Agostinelli and Lund 2013).
For short- and long-range courtship phases in each trial, we calculated the mean vector of the
observations of alignment angle α in each video frame. The direction α of this vector represents
mean signaling alignment during the phase and trial, with a value of 0, or 2π, representing perfect
alignment of viewing direction (i.e., male and female directly facing each other), and a value of π
representing the female facing directly away from the male. The resultant length of this vector, ρα,
represents the density of observations at mean α, and thereby serves as a measure for the
consistency of alignment during each phase and trial. Equivalent vectors were also calculated for
the absolute facing angles of male and female (βM and βF), and the azimuth of the other spider from
the perspective of male and female (θM∈F and θF∈M). We determined the mean alignment angle of
each category by taking the circular mean of α values in each trial. We also calculated the
proportion of time the female spent within a 60° cone in front of the male (F∈M) and vice versa
(M∈F).
To determine whether males initiated courtship phases in specific positions relative to the
female, we tested whether α at phase initiation was nonrandom using Rao’s spacing test of
uniformity (Jammalamadaka and Sengupta 2001; Russell and Levitin 1995; Rao 1976).
Differences in mean α between trial types (live vs model), display types (long-range vs short-
range), and rearing history (lab-matured vs field-matured), as well as sex differences in mean θ
were tested using Mardia-Watson-Wheeler tests (Wheeler and Watson 1964; Mardia 1972;
Jammalamadaka and Sengupta 2001). Also called uniform scores test, this non-parametric test

75
compares the homogeneity of two or more samples of circular data. This test performs better than
circular ANOVA when sample sizes are small (Tasdan et al. 2014).
We observed that male “knee raises” are carried out during periods when males and females
are close to or in alignment. Thus, this display motif may function to elicit female reorientation
or as a reaction of the male to increased alignment resulting from female reorientation towards
him. To distinguish between these potential functions, we computed the cross-correlation function
(ccf) of the time lag between the initial frame of female reorientation towards the male and the
initial frame of a bout of male knee raises across all occurrences of knee raises in live trials.
2.3 Results
Analysis and experimental manipulation of the geometry of H. pyrrithrix courtship reveal
a dynamic interaction in which both partners react to visual cues from the other. Males readily
accepted model females as courtship partners, initiating courtship elements at similar distances as
with live females (mean ± SD distance at long-range courtship initiation: live 34.4 ± 16.3 mm,
model 23.7 ± 21.3 mm, Welch’s t-test, t38.99 = 1.829, p = 0.075; short-range courtship initiation:
live 9.0 ± 4.0 mm, model 7.1 ± 6.2 mm, Welch’s t-test, t37.85 = 1.198, p = 0.238), but we observed
key differences in relative angular positioning during courtship sequences (see below).
2.3.1 Interactions Between Live Males and Females
Interactions between live males and females allowed us to evaluate how male forward-
facing displays were aligned with the frontal female field of view, and to some extent which sex

76
Figure 8. Signaling alignment during courtship
Alignment of facing directions of male and female spiders during (a, c) long-range and (b, d) short-range
courtship phases. Arrow direction indicates the mean of α, the relative angle between male and female
viewing direction (e.g., at 0 the spiders face each other). Arrow length indicates the density of observations at
mean α (ρα), and thereby serves as a measure for the consistency of alignment. Colored lines outside of
circular axes represent mean density distribution of observations.

77
was responsible for this alignment. Males nearly always remained fixated on the female, whereas
females faced away from the male for much of the time (male: θF∈M = -0.056 ± 0.054 rad, ρ =
0.999, female: θM∈F = 1.678 ± 2.075 rad, ρ = 0.116, Mardia-Watson-Wheeler test, W(2) = 25.267,
p < 0.0001). In addition, males most commonly initiated long-range courtship displays when their
facing direction was aligned with that of the female (mean α at display initiation ± SD: -0.12 ±
1.34 rad; circular distribution of display initiations was non-uniform, Rao statistic 159.374, p <
0.05). Following initiation of this long-range phase, the male waved his front legs while walking
sideways, approaching the female on a zig-zag course. Females rarely tracked males with their
frontal visual field during this approach, leading to long-range displays being carried out evenly
around the female (Fig. 8a).
Males approached females until close enough to initiate their short-range display motif, at
a mean (± SD) distance of 9 ± 4 mm. Short-range displays were initiated regardless of alignment
(mean α at display initiation ± SD = -0.12 ± 1.78 rad; circular distribution of display initiation was
uniform, Rao statistic 145.474, p > 0.05). However, females often turned around so that short-
range displays more often took place with both spiders facing each other than did long-range
displays (Figure 8b; mean α during short-range display ± SD: 0.25 ± 1.67 rad versus mean α during
long-range display ± SD: 3.05 ± 1.21 rad, Mardia-Watson-Wheeler test, W(2) = 6.743, p = 0.034).
Knee raises were carried out by the male once he and the female became closely aligned
during the short-range display phase. Analysis of the relative timing of female turn initiation
towards the male and the beginning of a knee raising bout revealed that this display motif occurs
more frequently following a female turn to face the male (Fig. 9a). Subsequent cross-correlation
analysis revealed that initiation of knee raise bouts was most likely to occur 200ms after the female

78
Figure 9. Timing of 'knee-pop' displays
(a) Occurrences of female reorientation to face the male, relative to a male’s initiation of knee raise display
bouts. Histogram depicts summed counts of the first reorientations immediately before and after knee raise
initiation (t = 0, dotted vertical line on x-axis) during 12 live interactions that included knee raises. (b) Cross-
correlation plot of female facing direction (predictor) and male knee raise occurrence (recruit). Red
horizontal lines indicate 95% confidence interval, and dotted vertical line illustrates the moment the female
turns to face the displaying male. The dominant correlation occurs at -0.2s, meaning that males are most
likely to raise their knees 0.2s after a female reorients to face him.

79
turned towards the male (at a 200ms lag, Fig. 9b, dominant cross-correlation = 0.03, mean ± c.i. =
0 ± 0.012).
We tested for possible behavioral differences between pairs with field-matured versus lab-
matured females. We found no significant group differences in alignment α (Mardia-Watson-
Wheeler test, W(2) = 0.998, p = 0.607), courtship duration (field 380 ± 327s, lab 175 ± 166s,
Welch’s t-test, t9.85 = 1.62, p = 0.137), fixation on the other spider (Male (θF∈M) Mardia-Watson-
Wheeler test, W(2) = 0.05, p = 0.975, female (θM∈F) W(2) = 0.08, p = 0.959), duration of knee
raise bouts (field 46 ± 42s, lab 28 ± 36s, Welch’s t-test, t13.9 = 0.938, p = 0.364), and female
locomotor activity as measured by the spread of facing direction ρβF (field 0.52 ± 0.23, lab 0.41 ±
0.21, Welch’s t-test, t14.2 = 1.06, p = 0.308).
2.3.2 Interactions Between Live Males and Female Models
During trials with female models, males approached females from the front and did not
deviate much from the model’s frontal cone during the approach (Figure 8c). This led to greater
long-range display alignment during model trials when compared to live trials (mean α ± SD,
model: 0.14 ± 0.61 rad, live: 3.05 ± 1.21 rad, Mardia-Watson-Wheeler test, W(2) = 20.575, p <
0.001). As with live trials, short-range displays in model trials occurred predominantly face-to-
face (mean α ± SD, model: -0.06 ± 1.08 rad, live: 0.25 ± 1.67 rad), and a comparison of live versus
model trials indicated no statistical difference in short-range display alignment between these two
conditions (Fig. 8b, d, Mardia-Watson-Wheeler test, W(2) = 1.436, p = 0.488).
In the model-turn condition, the model was initially positioned so that courting males
carried out their short-range display directly in front of the female (α ≈ 0). When the model was
then turned so that it faced directly away from the male, males most often responded by moving

80
Figure 10. Male responses to female looking away
Change in absolute alignment angle in each “model-turn” trial. In all 12 trials, males (original angular
position indicated with a circle) initiated courtship face-to-face with a female model (originally facing towards
π). Five seconds after display initiation, the model was turned to face away from the male (to 0) by the
experimenter. Male position was recorded until display stopped, with an x indicating the final male angular
position. Colors indicate angular position in female’s visual field, as shown in inset.

81
towards the front of the model (Fig. 10, paired t11 = -3.17, p = 0.009). However, of the males that
repositioned, only some moved into the model’s frontal hemisphere (4 out of 7 individuals, Fig.
10), and no males reached the field of view of the model’s principal eyes.
2.4 Discussion
2.4.1 Control of Signaling Alignment
In many sensory modalities, both signals and sensors can have pronounced directional
biases. When this is the case, signalers and receivers can maximize the efficiency of information
transmission by spatially aligning themselves. We investigated to what extent the directional
courtship displays of male H. pyrrithrix are aligned with the forward-facing field of view of female
receivers. Tight alignment would improve detection and evaluation of male courtship elements by
the female, including aspects that would not be visible to the female without the specific input of
her forward-facing principal eyes (i.e., color, fine detail).
We found that males initiate courtship following establishment of frontal “eye contact”
with females, but then continue long-range displays irrespective of their position in the female
field of view. However, male short-range courtship displays are aligned with the female frontal
field of view for much of the time, although this alignment is often transient.
How does each actor contribute to achievement or disruption of signaling alignment? Our
results indicate that males actively manage their body orientation in relation to females such that
their displays are almost always directed towards a focal female (>97% of the time). When we
rotated female models to face away from males, most males repositioned themselves towards the

82
front of the model. However, few males moved beyond the model’s rear hemisphere, and no males
moved into the model’s frontal field of view. This suggests that while males adjust their position
in response to changes in female orientation, they vary in the extent of their movement, and these
responses alone are insufficient to maintain signaling alignment. Thus, successful alignment is not
the result of male position alone, but rather the product of male position and female orientation in
response to the male display.
We observed that female movement often disrupts alignment, especially during long-range
displays. This is supported by our observation that male-female alignment during long-range
courtship was substantially better when males courted a stationary model instead of a freely
moving female. Because males nearly always oriented their displays toward females, the
discrepancy in alignment between live and model trials can be largely attributed to changes in
orientation of live females. However, during short-range courtship, alignment was consistently
high for both live and model trials. This is likely because live females remained more consistently
oriented towards the male displays during this phase of courtship.
2.4.2 Implications for Communication
These results have several implications for courtship dynamics in this and other species.
Signaling alignment should improve a female’s ability to evaluate male color and pattern. Why
then do females carry out movements that reduce this ability? The female-induced misalignment
we observed at long range may suggest that females are rarely interested in the male display at this
stage of courtship. Females may primarily assess male vibrational song (as in certain other species;
Elias et al. 2005) and/or chemical signals, which are both unconstrained by viewing angle. It is
also possible that females prioritize the motion elements of male courtship, as jumping spider

83
motion detection has a very wide field of view (near 360˚, Land 1985) and is thus not constrained
by alignment with the female frontal visual field. However, previous work by Taylor and McGraw
(2013) indicates that male coloration is indeed an axis of female mate choice in H. pyrrithrix, and
that this evaluation occurs, at least in part, during a male’s long-range display, when misalignment
is most frequent. It is possible that females only require a short period to conduct this evaluation.
Importantly, males usually initiate their long-range displays within the field of female color vision.
A brief glimpse of color information from long range might be sufficient for recognition of a
potential mate, but preclude the longer evaluation necessary to assess more subtle differences in
male coloration that might be associated with male quality (Taylor et al. 2011).
Female movements that disrupt signaling alignment may also be a consequence of limited
visual attention. These animals may face physiological and/or cognitive limitations that impede
their ability to perform multiple visual tasks simultaneously, such as predation avoidance and mate
evaluation (R Dukas 2002; Reuven Dukas 2004). Orientation towards and away from the courting
male may reflect how these different tasks compete for a female’s visual and cognitive resources.
Here, H. pyrrithrix females look away from courting males for the majority (over 73% of the time)
of the interaction, similar to results in courted peahens (63% of the time, Yorzinski et al. 2013).
Given that conspicuous male displays are susceptible to eavesdropping and attack from predators
(J. Endler 1980; Zuk and Kolluru 1998; Woods et al. 2007), our results suggest that females may
allocate more time to increased vigilance over male evaluation.
2.4.3 Selection for Control of Receiver Attention
Because reduced receiver attention impairs signaling alignment, signalers may be under
selection to capture receiver attention, retain attention once captured, and/or capitalize on

84
transiently attentive receivers via strategic signaling behaviors (J. A. Endler 1992; R Dukas 2002;
G. G. Rosenthal 2007). One strategy is to use displays tailored to elicit females to turn, and then
discourage them from turning away. In other words, aspects of male displays may function to
capture and/or retain a female’s visual attention. To this end, signaling males may employ a simple
but salient “alert” signal that primes female attention for a subsequent information-rich signal
(Richards 1981b; Guilford and Dawkins 1991; Leo J. Fleishman 1988). The forelimb waving
characteristic of long-range display in Habronattus and other jumping spiders (Herberstein 2012;
D. O. Elias et al. 2012) is likely to serve as an introductory alert to establish signaling alignment
in advance of the more complex short-range display. In other taxa, similar exaggerated
introductory movements improve signal detection (e.g., in Jacky dragons, Amphibolus muricatus,
Peters et al. 2007; and Anolis lizards Ord and Stamps 2008; Fleishman and Pallus 2010) and gaze
re-acquisition (in peafowl, Yorzinski et al. 2013). If long-range motion displays do indeed perform
an attention-grabbing function in H. pyrrithrix, it is possible that the effectiveness of such displays
may depend on the properties of the visual environment (e.g., background motion, spatial
complexity) within which they are performed (e.g., Peters 2008; Cole 2013; Wiley 2016). Given
that even sympatric Habronattus species differ in their microhabitat use (L. A. Taylor, Powell, and
McGraw 2017) , the need for a salient alert may have shaped intra- and interspecific display
variation in this genus.
Once attention is captured, signaling males may then use subsequent display features to
retain female attention. Here, we find that males may do so by targeting additional visual channels.
For example, the timing and design of male “knee raises” suggests a function in maintenance of
female visual attention. While males often initiate knee-raises when the female is looking away, a
male is most likely to initiate a bout immediately after a female turns to face him. By presenting,

85
obscuring, and reintroducing their orange leg ornaments, males may seek to repeatedly attract the
gaze of the female’s color sensitive principal eyes, as these eyes track and scan novel stimuli
moving into their field of view (M F Land 1969b). H. pyrrithrix males also perform rapid bends
of the first leg tarsi during short-range display; these “flicks” appear to be carried out at regular
intervals regardless of alignment and are thus less likely to be involved in attention management.
However, they were not reliably quantifiable in footage due to their small amplitude and short
duration, and thus not specifically considered in this study. Experimental manipulation of male
knee raises and flicks (e.g., color, pattern, rate) may prove to be fruitful in identifying precisely
how female visual attention is retained, and how this retention impacts on signaling outcomes.
Signalers might also use multiple sensory “channels” to manage receiver attention, such
that a signal in one modality may function as a conspicuous alert for a coordinated message in
another (McLennan 2003; Hebets and Papaj 2005; Grafe and Wanger 2007). Habronattus males
produce substrate-born vibrations during courtship, which can be perceived by a nearby female
regardless of facing direction and are often temporally synchronized with specific visual display
motifs (Elias et al. 2012). Thus, vibrations could attract female attention despite visual
misalignment and/or maintain attention while a visual display is performed. Muting male
vibrations decreases mating success in another Habronattus species (D. Elias et al. 2005), but the
extent to which male vibration may function as an alerting precursor to certain information-rich
visual displays, a redundancy for a visual alert signal, or an independent information-rich sensory
channel is open for further research.

86
2.4.4 Signaling Behavior in Response to Spatio-social Cues
If signalers are limited in their control of receiver attention, they can still benefit by
attending to a receiver’s spatial information in order to capitalize on opportunities for effective
signaling. Signalers may compensate for transient attention by orienting their displays towards the
receiver’s position, even when the receiver is facing away. This behavior ensures that if the female
does eventually face the male, his signal is immediately visible to her principal field of view. H.
pyrrithrix males show high fidelity in tracking a female’s location and orienting their displays
towards her. However, the extent to which signalers in other systems similarly orient towards
receivers, and the effects of this tactic on signaling efficacy, are relatively unknown. In the few
systems in which this has been studied, signalers do appear to actively face their displays towards
the receiver’s location (e.g., in Anna’s hummingbirds, Hamilton 1965; peafowl, Dakin and
Montgomerie 2009; great bustards, Otis tarda, Olea et al. 2010; common eggfly butterflies, White
et al. 2015), but with considerable interspecific variation in the degree and pattern of male
orientation. Imperfect orientation might stem from challenges in tracking receivers (e.g., due to
fast moving and/or multiple receivers), environmental constraints on direction, and/or
countervailing individual interests. In jumping spiders, for example, females are known to
cannibalize males both pre- and post-copulation (R. R. Jackson et al. 1997). As a female’s striking
zone is directly in front of her (Foelix 2011), male efforts to maintain direct “face-to-face”
alignment may carry an increased risk of attack and may thus be limited in the interest of survival.
While laboratory experiments have shown relatively high rates of sexual cannibalism in H.
pyrrithrix (12 of 36 trials involving 48hrs of cohabitation; Taylor and McGraw 2013), the extent
of this behavior in natural populations, and its consequences for communication, is not well
understood.
87
Signalers may also improve communication efficacy by using receiver spatial information
to decide when to employ particular signals or signal elements. Opportunistic signaling may be
particularly important for energetically costly displays, as it allows signalers to avoid their display
falling on averted eyes. This is another possible explanation for the timing of knee raises in H.
pyrrithrix. Males may prefer to deploy their colorful knees when females are looking because this
is when color information is most likely to be received.
It is also possible that female-induced misalignment is a deliberate strategy to assess male
quality. Male efforts to improve and/or capitalize on signaling alignment rely in large part on his
ability to accurately attend to female orientation, determine her gaze direction (i.e., gaze
sensitivity; Davidson et al. 2013) and react appropriately. This implies that more attentive males
may be more successful communicators and, in turn, more valuable mates. Our results, and those
of previous studies, suggest widespread intraspecific variation in signalers’ ability (or propensity)
to assess and respond to a receiver’s spatial cues. Due to the energetic and cognitive costs of
attending to the receiver’s spatial cues (Davidson et al. 2013), an individual signaler’s ability to
do so may be a broad indicator of signaler quality that influences signaling alignment, and, in turn,
signaling outcomes. By turning away from courting males, females may be attempting to assess
his ability to maintain signaling alignment, and/or any of suite of correlated traits such as
persistence, body condition, and motor performance that influence mate choice in many systems
(Byers et al. 2010). Thus, we propose expanding the concept of “social skill” introduced by Sih
and Bell (2008) to include a signaler’s ability to assess and adaptively respond to a receiver’s
spatial cues. Previous work has noted that signaling males are able to adjust display intensity or
tactics in response to female cues (Patricelli, Coleman, and Borgia 2006; Patricelli and Krakauer
2010; Sullivan-Beckers and Hebets 2014), and changes in receiver distance (e.g., How et al. 2008;

88
Fleishman and Pallus 2010), potentially improving courtship success (but see Patricelli et al.
2006). Whether females use signaling alignment as a proxy for aspects of male quality, or whether
improved courtship outcomes are strictly a result of increased signal efficacy remains an
interesting direction for future work.
2.4.5 Conclusions
In summary, directional biases in both vision and visual signaling predict that effective
communication requires behavioral alignment of these two directional elements during signaling.
While previous work (e.g., Dakin and Montgomerie 2009; Olea et al. 2010; White et al. 2015) has
shown that signalers often aim their signals towards the receiver’s position, whether receivers also
orient their visual field towards a signaling male has not been well investigated. We found that in
the courtship of the jumping spider H. pyrrithrix, females often looked away from courting males,
such that male display and the female frontal field of view were misaligned. Thus, although
alignment is essential for females to be able to see and evaluate male display color and pattern,
females appear to often undermine such alignment by reorienting to investigate other stimuli.
These dynamic shifts in signaling alignment throughout courtship illustrate the challenge males
face in contending with limited female visual attention, and highlight the potential importance of
variation in male social skill when responding to female attentiveness and spatial positioning.
Finally, we note that the directional biases in signal transmission and/or reception are not unique
to visual communication. Acoustic signalers also employ directional calls (e.g., in grouse,
Dantzker et al. 1999; whales, Holt et al. 2010), and some even actively modulate this directionality
based on signal function (Patricelli, Dantzker, and Bradbury 2008). However, the importance of
directionality on effective communication in visual, acoustic, and other modalities remains an

89
interesting but largely uninvestigated avenue for further research. We encourage those interested
to consider the active roles of both signalers and receivers in determining signaling alignment and
efficacy.
2.5 Acknowledgements
We thank Zareen Amin, Sinjon Bartel, Patrick Butler, John Goté, Ciara Kernan, Alex
Lysiak, Margaret Mass, Emma Schanzenbach, Riley Timbs, and Zachary Zimmer for assistance
with courtship filming, animal care, and video scoring. We also thank Lisa Taylor for assistance
with fieldwork, animal care protocols, and experimental design. We also thank Mark Schnepf and
Schnepf Farms for allowing us to collect spiders on their property. Finally, we thank two
anonymous reviewers for their feedback which improved the quality of the manuscript.
2.5.1 Funding Statement
The research presented in this chapter was supported by the University of Pittsburgh, and
the National Science Foundation (IOS-1557549 to N.I.M.). Additional funds for fieldwork and
equipment were provided by 90 generous backers of our Experiment.com crowdfunding campaign.

90
3.0 Jumping Spider Adjusts Attention-Grabbing Display to Spatial and Environmental
Context
3.1 Introduction
A major challenge for visual signalers, especially those in complex environments, is to
attract and retain the attention of intended receivers (Reuven Dukas 2004; R Dukas 2002; Számadó
and Penn 2015; J. A. Endler 1992; G. G. Rosenthal 2007; Számadó 2015). This is because animals
face physiological and cognitive limitations on their ability to attend to multiple visual stimuli
(Reuven Dukas 2004), and natural environments are cluttered with an excess of potentially
important visual stimuli (e.g., cues associated with predators, prey, and ecological needs). Because
processing visual information is computationally demanding, handling multiple visual tasks
concurrently decreases performance in each (Broadbent and Gregory 1965; Milinski 1990; Reuven
Dukas 1998; Kastner and Ungerleider 2000; R Dukas 2002). As a result, animals often reduce this
cognitive load by preferentially attending to only select few stimuli (R Dukas 2002; Reuven Dukas
2004), while filtering out the vast majority of detectable visual information (e.g., 99.98% in
primates (Van Essen et al. 1991; Van Essen, Anderson, and Felleman 1992)). Thus, even if a signal
is detectable, a receiver may not devote the cognitive resources required to process the signal (R
Dukas 2002; J. A. Endler et al. 1998; Guilford and Dawkins 1991). Consequently, we expect that
signalers may be under strong selection to “outcompete” distracting stimuli.
One potential solution to this challenge that has evolved repeatedly is for signalers to
precede their complex visual displays with a particularly salient signal that captures the receiver’s
attention (Richards 1981b; R Dukas 2002; Számadó 2015; Bradbury and Vehrencamp 2011; G. G.
91
Rosenthal 2007; Swan and Hare 2008). Such “alerting” displays are predicted to be structurally
simple (e.g., a brief, rapid movement), and taxonomically widespread (R Dukas 2002; Bradbury
and Vehrencamp 2011; Számadó 2015). Introductory elements of otherwise longer and more
complex visual displays have been suggested to function as alerts in many species (Számadó 2015;
Hebets and Papaj 2005; G. G. Rosenthal 2007; Rivers and Morin 2008). We note that signals that
function to warn of a nearby predator are sometimes also termed ‘alert signals,’ but here we focus
solely on signals that function primarily to capture receiver attention (i.e., attention-seeking
displays, sensu (Számadó 2015)). Even if alerts only inform a receiver about an upcoming complex
signal (e.g., do not inform about the signalers’ condition), theoretical modeling indicates that these
signals are still evolutionarily stable (Számadó 2015).
The effectiveness of an alerting display may depend not only on the properties of the
display itself, but also the nature of other stimuli in the environment that compete for the receiver’s
attention. Background stimuli can reduce the likelihood of signal detection. For visual signals in
terrestrial environments, wind-blown vegetation is the primary source of distracting motion
“noise” (Bradbury and Vehrencamp 2011; Cronin et al. 2014; R. Peters, Hemmi, and Zeil 2008;
Richard A Peters 2013). Thus, alerting displays must contrast with such background motion in
order to be readily detectable (Leo J. Fleishman 1992; R. Peters, Hemmi, and Zeil 2008; Ord and
Stamps 2008). To increase salience, alert signals may evolve to exploit particular pre-existing
sensory biases in the receiver’s visual system (Michael F Land and Nilsson 2012; Bradbury and
Vehrencamp 2011; J. A. Endler 1992; Guilford and Dawkins 1991; R Dukas 2002), and/or to be
qualitatively different from environmental motion (G. G. Rosenthal 2007; R. Peters, Hemmi, and
Zeil 2008; Richard A Peters 2013).

92
Signalers must compete not only with static properties of their environments, but also
dynamic changes to environmental conditions, such as rapid increases or decreases in wind-blown
vegetation. Thus signalers may often experience selection for behavioral plasticity such that they
are able to adjust their alert display in response to the current visual environment (Richard A.
Peters, Hemmi, and Zeil 2007; McNett, Luan, and Cocroft 2010; R. Peters, Hemmi, and Zeil 2008;
Mcgregor et al. 2013; Ord and Stamps 2008; R Dukas 2002; Ord et al. 2016). However, assessing
environmental conditions may itself be a demanding cognitive task for signalers, especially while
simultaneously performing a complex display. In addition, changing the properties (e.g., speed,
and direction of motion) of a signal may reduce how effectively they address receiver preferences.
Thus, background motion may result in selection that conflicts with receiver-based selective
pressures.
Despite the predicted importance and ubiquity of alerting displays, previous research on
alerting signals is limited in number and phylogenetic scope. To date, visual alerting displays have
only been explicitly studied in vertebrate systems (Anolis lizards (Ord and Stamps 2008),
Amphibolurus lizards (Richard A. Peters, Hemmi, and Zeil 2007), but see also (Swan and Hare
2008; Richards 1981a) for acoustic communication examples in mammalian and avian systems).
Even within this limited body of work, however, we see a diversity of responses to adverse
environmental conditions. Amphibolurus lizards change signal duration and structure (Richard A.
Peters, Hemmi, and Zeil 2007) in response to changing environmental conditions, while some
Anolis lizards increase display speed (Ord, Stamps, and Losos 2010; Ord et al. 2016; 2007) and/or
timing (Ord, Charles, and Hofer 2010). These differences suggest that selection on alert displays
may result in the evolution of a diversity of solutions, even within one phylogenetic group. Outside
of lizards, we know little about the role of attention and attention-seeking signals. This is

93
particularly true in arthropod communication, despite many species being known for their complex
visual displays (e.g., jumping spiders and wolf spiders (D. O. Elias et al. 2012; Girard, Kasumovic,
and Elias 2011; Uetz et al. 2011), butterflies (White, Zeil, and Kemp 2015), marine ostracods
(Rivers and Morin 2008)). Due to their small eyes and brains (compared to those of many
vertebrates), many arthropods likely face stricter limits on how much visual information they can
attend to at any given time.
Here, we investigate variation in alert signals in the courtship display of the jumping spider
Habronattus pyrrithrix (Chamberlin 1924; Aranea: Salticidae), the challenges posed by variation
in environmental conditions during these displays, and how males address these challenges while
displaying. H. pyrrithrix is a small, sexually dimorphic jumping spider found in riparian habitats,
agricultural settings, and grassy urban areas ranging from southern California and Arizona to
Sinaloa, Mexico (Griswold 1987). Because of their complex courtship displays (D. O. Elias et al.
2012) and unique visual system (Zurek et al. 2015), this species provides an excellent opportunity
to study how signalers use alerts to capture receiver attention.
Female visual attention is important to male courtship communication in H. pyrrithrix.
Males are colorful and ornamented, and perform an elaborate courtship dance consisting of
stereotyped sequences of movements (D. O. Elias et al. 2012; Maddison and Hedin 2003). Females
are choosy, selecting males at least in part based on their coloration (Blackburn and Maddison
2014; Masta and Maddison 2011; L. A. Taylor and McGraw 2013). However, whether or not
females are able to see male colors is limited by where females direct their attention. Only two of
a jumping spider’s eight eyes, the forward-facing principal eyes, provide the animal with color
vision and high spatial resolution (Harland, Li, and Jackson 2011; Zurek et al. 2015; M F Land
1969a; Blest et al. 1981; Blest 1985). The gaze of principal eyes can be moved to look around the

94
world via muscular movements of the underlying retina, but only within an approximately 60-
degree cone in front of the spider (M F Land 1985). In contrast, the four lateral eyes function as
lower-resolution monochromatic motion detectors with a combined field of view of nearly 360
degrees (M F Land 1985; Duelli 1978; Zurek et al. 2010). Thus, while a female may be able to
detect a courting male from almost any direction, she can only see his colors if she turns to face
him. Females, however, frequently turn away from actively courting males (Echeverri, Morehouse,
and Zurek 2017). Thus, males are likely under selection not only to attract female visual attention,
but also to retain it.
Habronattus pyrrithrix courtship consists of two distinct stages, the first of which may
serve to capture attention in advance of the second. Courtship begins with a relatively simple, long-
range display, followed by a more complex, close-range display (D. O. Elias et al. 2012). As males
approach a female, they perform the long-range display, raising and lowering (“waving”) their first
leg pair while walking from side to side and exposing their red clypeus (Fig. 11A, B). If males
successfully transition from the long-range to the close-range display, males then rapidly twitch
the tarsi (final segments) of their raised first legs while repeatedly raising their third legs to expose
and hide conspicuous orange ornaments on the distal femur of these legs (D. O. Elias et al. 2012).
We hypothesize that the conspicuous arm waves that males perform during long-range courtship
function as alerting signals, thereby capturing female visual attention prior to initiation of the short-
range courtship display. Jumping spiders are known to turn towards movement seen by their lateral
eyes (Echeverri, Morehouse, and Zurek 2017), so male waving displays may have evolved to target
this sensitivity in prospective female mates.
Several factors may influence the effectiveness of male alerts. First, the ecology of H.
pyrrithrix suggests that males may experience a visual environment that reduces signal salience.

95
Males actively search for females, and initiate courtship whenever they encounter a female (L. A.
Taylor, Powell, and McGraw 2017; Blackburn, Maddison, and Blackburn 2015). As a result, males
have relatively little control of over the visual environment during courtship (unlike in species that
prepare a specific location for displaying, e.g. manakins (Uy and Endler 2004)). Second, because
the species is often found in or near vegetation, the visual noise of wind-blown motion may be a
frequent signaling challenge. Finally, preliminary data showed intraspecific variation in waving
displays (SAE, unpublished data), but the causes and consequences of this variation are unknown.
In this study, we investigated the role of the male H. pyrrithrix arm waving display as an
alert signal, and how this function might be affected by signaling conditions. First, we used to
video playback to ask whether or not arm waves captured female attention. We then tested how
signal variation and visual environment complexity affected this alerting function. Finally, we
observed male courtship under different environmental conditions to ask if and how males adjusted
their alerting display in response to the visual environment.
3.2 Methods
3.2.1 Collection and Maintenance
We collected sub-adult individuals from a high-density population in Queen Creek,
Arizona (33°13’16” N, 111°35’50” W) in May 2016. Following field capture, spiders individually
were reared to maturity in opaque cylindrical plastic containers (7cm diameter, 6cm tall) in a
chamber at constant temperature (21˚C) and a 12:12h light:dark cycle. We fed each spider twice
per week with cricket nymphs (1st-3rd instar Gryllodes sigillatus) in quantities approximately

96
equal to twice the spider’s mass. Video playback experiments were conducted between August
and November 2016, and courtship trials between September and December 2016.

97
Figure 11. Habronattus pyrrithrix courtship and experimental design
(a) Habronattus pyrrithrix males initiate courtship with a waving display of the first leg pair. (b) Animated
stimuli were designed with range of amplitudes (Θ) and angular velocities (°/s) designed to span the range of
natural variation. (c) Females viewed competing waving and non-waving stimuli, and their attempts to orient
towards either were recorded as movement of the “treadball” held by their feet. (d) Stimuli were presented
against four backgrounds: 50% grey, a habitat photo, a habitat video, and a habitat video played at 1.5x
speed. (e) In a separate experiment, males courted females on a circular stage while experiencing one of the
same four background conditions (Grey, Habitat Still, Habitat Video, Fast Habitat Video at 1.5x speed)
displayed on three surrounding video screens. Four cameras positioned overhead (1) or in front of openings
in the arena walls (3) recorded the scene at 30 frames per second. (f) Tracking of 14 morphological landmarks
allowed for 3D reconstruction and quantification of male waving displays.

98
3.2.2 Video Playback Experiments
To assess how waving displays capture female attention, we filmed the reaction of females
to competing animations of waving and non-waving males. Females viewed video stimuli in a
custom-built “theater” consisting of two computer monitors arranged in an L-shape (2560x1440
pixel resolution, 120hz; Acer XB270HU; Fig 11c). During the experiment, females viewed the
monitors from a location of 43cm along the angular bisector (i.e., 45° from each monitor) and
centered vertically with respect to the monitors’ height. To maintain a consistent viewing position
and orientation, females were suspended from a metal rod that connected to a neodymium disc
magnet (1mm diameter, 0.5mm thickness, .07lb pull force; SuperMagnetMan N50 D1005) glued
to the top of their cephalothorax with UV-activated glue (Bondic, Laser Bonding Tech, Inc.).
Magnets allowed us to easily remove and replace females between experiments. The metal rod
was held by a micromanipulator, which was used to fine tune the position and orientation of the
spider such that the female’s body axis aligned with the angular bisector of the two monitors. We
rested the micromanipulator base atop a foam cushion to dampen stray vibrations. While
suspended, females held a lightweight grey foam ball (diameter approximately 1cm) that was
marked with spots of white paint to facilitate tracking of movement. We positioned a piece of
cardstock 3cm behind the female to prevent her from seeing the rest of the room or the
experimenter with her posterior eyes. This cardstock was covered in matte black paper on the side
facing the spider. We filmed all experiments with a GoPro Hero 4 Black (1280x720p, 60fps)
through a small notch cut into the bottom of the cardstock behind the female. All trials took place
in an isolated, windowless room lit by four incandescent 60W bulbs to ensure a consistent visual
environment.
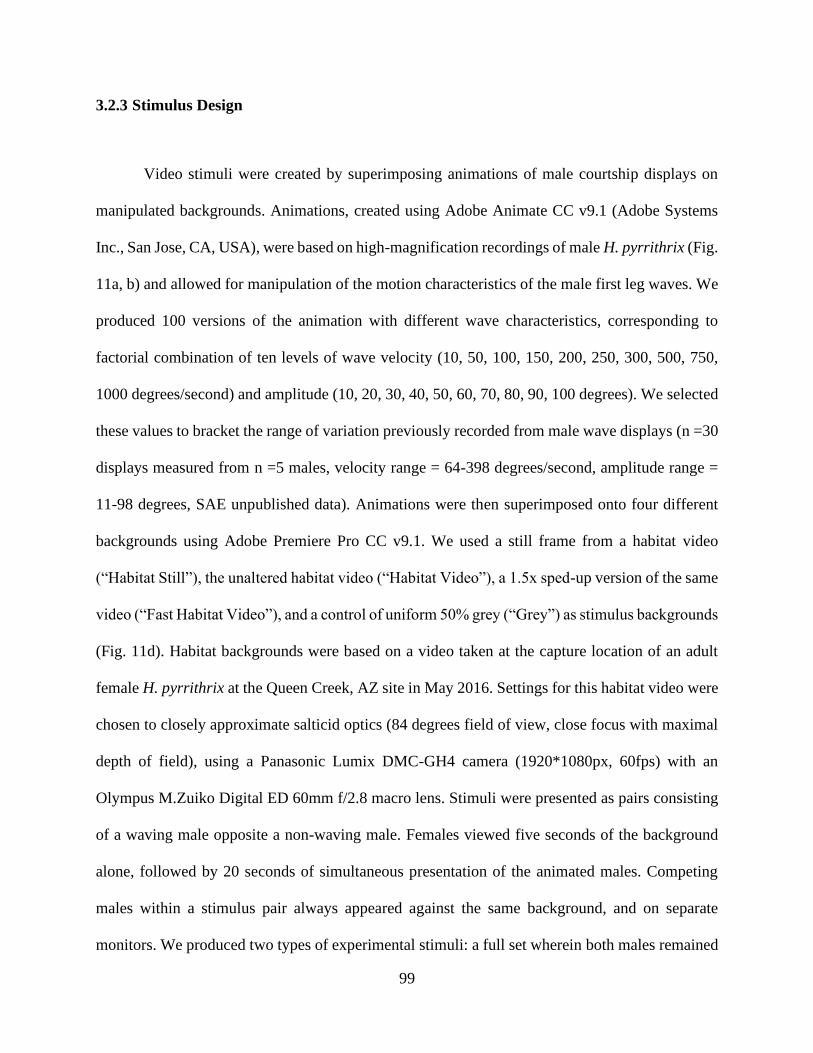
99
3.2.3 Stimulus Design
Video stimuli were created by superimposing animations of male courtship displays on
manipulated backgrounds. Animations, created using Adobe Animate CC v9.1 (Adobe Systems
Inc., San Jose, CA, USA), were based on high-magnification recordings of male H. pyrrithrix (Fig.
11a, b) and allowed for manipulation of the motion characteristics of the male first leg waves. We
produced 100 versions of the animation with different wave characteristics, corresponding to
factorial combination of ten levels of wave velocity (10, 50, 100, 150, 200, 250, 300, 500, 750,
1000 degrees/second) and amplitude (10, 20, 30, 40, 50, 60, 70, 80, 90, 100 degrees). We selected
these values to bracket the range of variation previously recorded from male wave displays (n =30
displays measured from n =5 males, velocity range = 64-398 degrees/second, amplitude range =
11-98 degrees, SAE unpublished data). Animations were then superimposed onto four different
backgrounds using Adobe Premiere Pro CC v9.1. We used a still frame from a habitat video
(“Habitat Still”), the unaltered habitat video (“Habitat Video”), a 1.5x sped-up version of the same
video (“Fast Habitat Video”), and a control of uniform 50% grey (“Grey”) as stimulus backgrounds
(Fig. 11d). Habitat backgrounds were based on a video taken at the capture location of an adult
female H. pyrrithrix at the Queen Creek, AZ site in May 2016. Settings for this habitat video were
chosen to closely approximate salticid optics (84 degrees field of view, close focus with maximal
depth of field), using a Panasonic Lumix DMC-GH4 camera (1920*1080px, 60fps) with an
Olympus M.Zuiko Digital ED 60mm f/2.8 macro lens. Stimuli were presented as pairs consisting
of a waving male opposite a non-waving male. Females viewed five seconds of the background
alone, followed by 20 seconds of simultaneous presentation of the animated males. Competing
males within a stimulus pair always appeared against the same background, and on separate
monitors. We produced two types of experimental stimuli: a full set wherein both males remained

100
in the same location on screen (i.e., “standing and waving”; hereafter “SW”), and a subset wherein
both males walked across the screen (i.e., “walking and waving”; hereafter “WW”, see below).
3.2.4 Female Response to Waving Displays from Walking Males (WW Experiment)
To determine how female responses were affected by males walking while displaying, we
also filmed the reaction of females (n =10) to the WW stimuli. WW stimulus pairs were created
as described above but were designed such that both displaying and non-displaying males appeared
at the outer edges of the monitors (i.e., in the female’s periphery), and walked towards the center
of the female’s field of view. This experiment also served to determine whether female responses
in the SW experiment were driven purely by the presence vs absence of movement in each stimulus
pair.
Waving displays in the WW stimuli consisted of a limited set of wave parameters chosen
to approximate typical displays of live males: three levels of amplitude (30, 50, 70 degrees) and
four levels of velocity (100, 150, 200, 250 degree/s). WW stimuli were only presented on the grey
background. No females were re-used between this and the SW experiment. Each female
experienced a singular experimental session consisting of five repeats of all 12 combinations of
WW stimuli. Stimulus order was randomized within a repeat. Following each repeat, playback was
paused for 5 minutes to reduce desensitization.

101
3.2.5 Female Response to Waving Displays in Different Visual Environments (SW
Experiment)
To assess how responses were affected by display parameters and the visual environment,
we filmed the reaction of females (n = 40) to the SW stimuli. Stimuli pairs were shown in sessions
consisting of 50 pairs on the same background. Thus, for each background condition, two sessions
were required for the female to view all combinations of male waving display parameters. These
two sessions of the same background type occurred on consecutive days. The order of stimuli and
the monitor on which the waving male appeared on were randomized. Within each session,
playback was paused for a 5-minute break following the 25th stimulus to reduce desensitization.
For logistical purposes, the 40 females were tested in cohorts of 10.
3.2.6 Measurement of Female Responses
Because females were mounted in place and could not turn, female attempts to orient
toward a stimulus translated instead to turns of the foam ball. We therefore scored female responses
to video stimuli by tracking the movement of the foam ball held by the female. For each stimulus,
we determined four primary response variables: (1) Total number of turns to either direction, (2)
Total number of turns towards the waving male, (3) Direction of first choice (which stimulus the
female attempted to turn toward first), (4) Proportion of turns to wave (# turns toward waving male
/ total turns, excluding trials where the female did respond to either stimulus).
Due to the large volume of footage, the SW experiment was scored by four scorers, who
were trained on partial videos until the entire group’s pair-wise measurement repeatability was
greater than 70%. The WW experiment was scored by one individual.
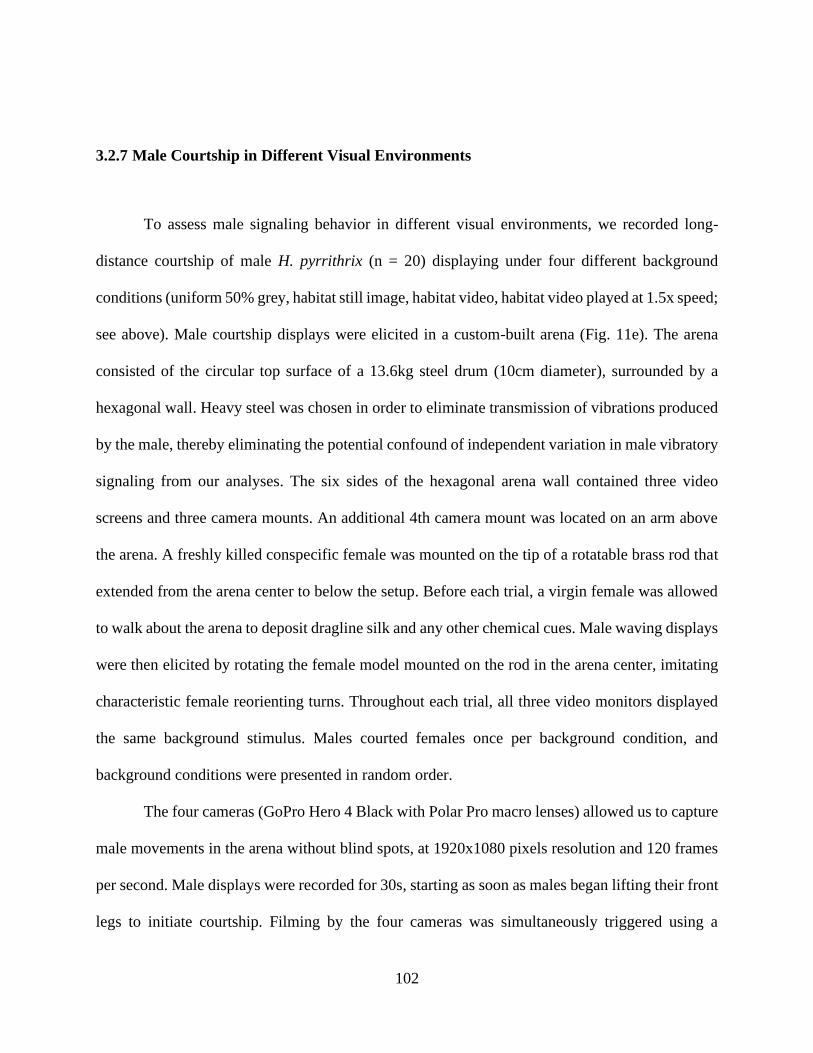
102
3.2.7 Male Courtship in Different Visual Environments
To assess male signaling behavior in different visual environments, we recorded long-
distance courtship of male H. pyrrithrix (n = 20) displaying under four different background
conditions (uniform 50% grey, habitat still image, habitat video, habitat video played at 1.5x speed;
see above). Male courtship displays were elicited in a custom-built arena (Fig. 11e). The arena
consisted of the circular top surface of a 13.6kg steel drum (10cm diameter), surrounded by a
hexagonal wall. Heavy steel was chosen in order to eliminate transmission of vibrations produced
by the male, thereby eliminating the potential confound of independent variation in male vibratory
signaling from our analyses. The six sides of the hexagonal arena wall contained three video
screens and three camera mounts. An additional 4th camera mount was located on an arm above
the arena. A freshly killed conspecific female was mounted on the tip of a rotatable brass rod that
extended from the arena center to below the setup. Before each trial, a virgin female was allowed
to walk about the arena to deposit dragline silk and any other chemical cues. Male waving displays
were then elicited by rotating the female model mounted on the rod in the arena center, imitating
characteristic female reorienting turns. Throughout each trial, all three video monitors displayed
the same background stimulus. Males courted females once per background condition, and
background conditions were presented in random order.
The four cameras (GoPro Hero 4 Black with Polar Pro macro lenses) allowed us to capture
male movements in the arena without blind spots, at 1920x1080 pixels resolution and 120 frames
per second. Male displays were recorded for 30s, starting as soon as males began lifting their front
legs to initiate courtship. Filming by the four cameras was simultaneously triggered using a

103
wireless remote control. The arena was cleaned with 95% ethanol between consecutive trials to
remove previous scent and silk cues. Experiments were carried out under direct sunlight in August
and September 2016 between 10am and 4pm. Only 66 of an intended 80 trials were included in
the full analysis, because some males died of natural causes before experiencing all trial conditions
(n = 3 trials), males failed to display (n = 8 trials), or we determined that recorded movements
were locomotory upon inspection (n = 3 trials).
To calculate properties of male waving displays, we first determined the frames in which
a wave of either left or right leg began or ended in trial. When multiple movements in the same
direction (up or down) occurred in sequence, they were treated as separate waves in the rare
instances when there was a pause of 500 ms or more between them. In each of these start/end
frames, we marked the xy pixel coordinates of 14 morphological landmarks from each of the four
perspectives (Fig. 11f). We then used direct linear transformation to calculate 3D coordinates with
confidence intervals for each landmark. Some landmarks were hidden behind the male body from
some perspectives, but all landmarks remained visible in at least two of the four perspectives so
that a 3D coordinate could be calculated. The cameras were calibrated in the MATLAB-based
digitizing environment DLTdv5 (version 5 from 2014-10-16 (Hedrick 2008)) using an 80-point
calibration object. All recordings were synchronized based on an audio cue in Adobe Premiere.
From the 3D coordinate sets, we calculated absolute amplitude and velocity of waves. We
measured the angle between the line from the spider’s coxa to the tarsus (approximately “shoulder”
to “wrist”), and the horizontal arena floor. We defined the amplitude as the difference between the
initial and final angle. Furthermore, we calculated the angular velocity and distance moved by the
male tarsus from the perspective of the female at the center of the arena.

104
3.2.8 Statistical Methods
To determine whether females paid more attention to male waving displays in general, we
calculated the net turns to wave (# turns toward waving male - # turns toward non-waving male),
and compared this metric against a hypothetical mean of 0 (equal attention to both stimuli) using
a one-sample Student’s t-test. We performed this test for both the SW experiment and WW
experiments. All statistical tests were carried out using R version 3.3.2 (Team 2013).
To assess the influence of each of our three test variables (amplitude, velocity, and
background) on how females in the SW experiment attended to waving males, we used
Generalized Linear Mixed Models (GLMMs; as implemented in R package lme4 (Bates et al.
2014)). We modeled our four response variables (total number of turns, direction of first choice,
number of turns to waving male, and proportion of turns to waving male) each as separate GLMMs.
When modeling first choice and proportion of turns, we excluded trials where the female did not
react to either stimulus. We modeled females’ first choice and proportion of total turns towards
the waving male using Binomial GLMMs with logit link, because these variables represented
binary and proportion data, respectively. Total number of turns and turns toward the waving male
were modeled using Poisson GLMMs with log link because these variables represented count data
(Crawley 2003; 2005). All four of these global models shared the same effect structure, as follows:
(Response Variable) ~ amplitude + velocity + background + velocity * amplitude + amplitude *
background + background * velocity + amplitude * velocity * background + wavingSide
+ scorer + cohort + (1|cohort:spiderID) + (1|session) + (1|stimulusOrder)
We treated the amplitude, velocity, and background of the stimulus, and all their
interactions, as fixed factors. We centered and standardized amplitude and velocity to two standard
deviations (SD) using the R package arm (Gelman and Hill 2007), so that effect sizes could be
105
compared between variables (Gelman 2008). We included the order of stimuli within an
experimental session, the order of sessions, and individual identity as random factors. To account
for possible variation in testing conditions and aging of the spiders, we included the experimental
cohort in the model. However, due to the small number of levels for this factor (fewer than 5), we
treated it as a fixed factor (following advice in (Crawley 2003; 2005)). For the same reason, we
also modeled the scorer (4 levels) and which side the waving male appeared on (2 levels) as fixed
factors. Spider identity was nested within experimental cohort. We excluded trials (n = 200) from
the analysis when females did not grip the foam ball, experimental conditions were disrupted (e.g.,
by excessive noise in adjacent rooms), and when technical errors occurred during video playback.
For all response variables modeled, we computed all 38 possible sub-models of the global
model and compared the quality of these models to each other using the Akaike information
criterion (AIC). As the weight of the best model was less than 0.9 in all cases, we elected to use
model averaging (following advice in (Grueber et al. 2011)). We selected models within 2 ∆AIC
of the top model for averaging (R package MuMIn (K 2013)). As the goal of modeling in this
study was to determine which factors had the strongest effects on the response variables, we used
the full (i.e., “zero-method”) average when averaging over component models in all cases (Grueber
et al. 2011; Nakagawa and Freckleton 2011).
We also used GLMMs to assess female responses in the WW experiment, but with a
different effect structure, as follows:
(Response Variable) ~ amplitude + velocity + velocity * amplitude + wavingSide + (1|spiderID)
+ (1|repeatOrder) + (1|stimulusOrder)
Background, experimental cohort, experimental session, and scorer did not vary in the WW
experiments, and so these were not included as factors. We included the order that repeated stimuli

106
were viewed as a random factor. Modeling and model averaging were otherwise carried out as
described above.
To determine the effects of background treatment on male waving displays in the arena
study, we created three linear mixed-effects models with wave amplitude, visual angle, and male-
female distance as response variables, background condition as a fixed effect, and male ID as
random effect (R package lme4 (Bates et al. 2014)). The effect of background treatment on
response variables was then evaluated using a repeated-measures analysis-of-variance
(rmANOVA) with Type III sums of squares.
3.3 Results
3.3.1 Female Response to Waving Displays in Different Visual Environments (SW
Experiment)
3.3.1.1 Female Responses to Waving vs Non-Waving Males
Females in the SW experiment (n = 40) showed interest in the male stimuli by attempting
to turn towards one of them in 61.82% of the trials (9767 of 15800 trials). When females
responded, they typically made one or two turns in total (mean ± SD total turns = 1.82 ± 0.93, n =
9767). The averaged GLMM (average of 16 component models, Appendix Table 1) showed that
there was no significant effect of wave amplitude (Z = 0.797, p = 0.43), velocity (Z = 0.52, p =
0.60), or their interaction (Z = 0.368, p = 0.71) on the total number of turns.
For the number of turns to wave, females turned towards the waving male approximately
once (mean ± SD turns to wave = 0.95 ± 0.52, n = 15800). The averaged GLMM (average of 8
107
component models, Appendix Table 2) showed that there was no significant effect of wave
amplitude (Z = 0.551, p = 0.58), velocity (Z = 0.695, p = 0.49), or their interactions (not included
as factor in any component model) on turns to wave. Females oriented more times towards the
waving male than towards the non-waving male (Fig. 12a, mean ± SD net turns to wave = 0.74 ±
0.96, n = 15800; Student’s t-test, t15799 = 91.467, p < 0.0001).
For the direction of first choice, females were more likely to first turn towards the waving
male before the non-waving male, but this preference, while highly significant, was only slightly
above chance (i.e., effect size was small; mean ± SD likelihood to turn toward waving male first
= 0.54 ± 0.50, n = 9767; Student’s t-test, t9766 = 7.0295, p < 0.0001). Larger amplitude waves were
more likely to draw a females’ attention on her first choice, but the increase was small (mean ±
SD likelihood to turn toward waving male first: 10° amplitude 0.53 ± 0.50, 100° amplitude 0.56 ±
0.50). The averaged GLMM (average of 3 component models, Appendix Table 2) indicated a
significant positive effect of waving display amplitude on the direction of first choice (Z = 1.124,
p = 0.0263). There was no significant effect of display velocity (Z = 0.354, p = 0.72), or the
interaction of amplitude and velocity (not included as a factor in any component model) on the
direction of first choice (Appendix Table 3).
For the proportion of turns to wave, females directed the large majority (89%) of their
responses at the waving male (mean ± SD proportion of turns to wave = 0.89 ± 0.21, n = 9767;
Student’s t-test, t9766 = 172.21, p < 0.0001). The averaged GLMM (5 component models, Table 1)
showed no significant effect of wave amplitude (Z = 0.097, p = 0.92), velocity (Z = 0,156, p =0.88),
or their interaction (Z = 0.435, p = 0.66), on the proportion of turns to wave.

108
Figure 12. Female responses to competitng male stimuli
Females turned toward waving males (dark pink bars) more often than toward non-waving males (white
bars) when (a) animated males were presented in a stationary courtship posture (n = 15800 trials), and when
(b) both animated males walked across the female’s field of view (n = 660 trials). Central light pink bars
correspond to cases where females engaged in an equal number of turns toward both stimuli, including cases
where the female did not turn towards either stimulus.
3.3.1.2 Effect of Background on Female Responses
For the total number of turns, females were more responsive when viewing stimuli against
stationary (Grey and Habitat Still) backgrounds than against moving backgrounds (mean ± SD
total turns: Grey 1.52 ± 1.17, Habitat Still 1.14 ± 1.03, Habitat Video 1.00 ± 0.95, Fast Habitat
Video 1.02 ± 0.98, n = 15800). This difference in total turns between moving and stationary
backgrounds is also represented in the averaged GLMM (average of 16 component models,
Appendix Table 1), where the moving backgrounds both have significant negative effects on
female turns (Habitat Video Z = 12.052, p < 0.0001, Fast Habitat Video Z = 4.849, p < 0.0001).
For the turns to wave, females oriented to the waving male fewer times when viewing them against

109
moving backgrounds (mean ± SD turns to waving male: Grey 1.15 ± 0.62, Habitat Photo 1.00 ±
0.47, Habitat Video 0.83 ± 0.41, Fast Habitat Video 0.87 ± 0.42, n = 15800). The averaged model
(8 component models, Appendix Table 2) confirms a significant negative effect of the Habitat
Video (Z = 8.093, p < 0.0001) and Fast Habitat Video (Z = 2.3, p = 0.021) backgrounds on the
number of turns to wave.
For the direction of first choice, the averaged GLMM (average of 3 component models,
Appendix Table 3) showed there was no significant effect of background (not included as a factor
in any component model) on how likely females were to first turn towards the waving male.
For the proportion of turns to wave, females directed a greater proportion of responses
towards the waving male when viewing stimuli against more complex backgrounds (Fig. 13, mean
± SD proportion of turns to waving male: Grey 0.85 ± 0.22, Habitat Photo 0.90 ± 0.19, Habitat
Video 0.91 ± 0.18, Fast Habitat Video 0.92 ± 0.19; n = 9767). The averaged model (5 component
models; Table 1) indicates a significant positive effect of the Habitat Photo (Z = 5.012, p < 0.0001),
Habitat Video (Z = 6.853, p < 0.0001), and Fast Habitat Video (Z = 6.411, p < 0.0001)
backgrounds.
3.3.2 Female Response to Waving Displays from Walking Males (WW Experiment)
Females in the WW experiment (n = 10) frequently responded to the animated stimuli
(75.60%, 499 of 660 trials), and typically turned towards the stimuli 1-3 times (mean ± SD total
turns = 2.44 ± 1.41, n = 499). Females again showed a preference to turn towards waving males
first (mean ± SD likelihood to turn toward waving male first = 0.63 ± 0.49, n = 499; Student’s t-
test, t498 = 4.5172, p < 0.0001), and to orient to the waving male more often (Fig. 12b, mean ± SD
net turns to waving male = 1.51 ± 0.74, Student’s t-test, t659 = 19.205, p < 0.0001). The averaged

110
Table 2. Modeling of proportion of turns towards waving male
Effect of each parameter on the proportion of turns towards waving males in the SW experiment, as
determined by binomial GLMM. Results represent model averaging of the top (2 ΔAIC) models (n = 5).
Asterisks following p-values indicate significance (* p < 0.05, ** p < 0.01, *** p < 0.0001). Relative
Importance scores indicate the proportion of models that include the variable.
* Effect sizes have been standardized on two SD following Gelman (Gelman 2008)
† BackgroundGrey was the reference category
†† ScorerSAE was the reference category
Parameter Estimate* Unconditional
SE
95% C.I. Z p-value
Relative
Importance 2.5 % 97.5%
(Intercept) 1.32871 0.079223 1.17 1.48 16.77 < 2 x 10-16 ***
amplitude -0.002152 0.022275 -0.08 0.07 0.097 0.92305 0.32
velocity -0.003576 0.022937 -0.09 0.07 0.156 0.876126 0.33
amplitude:velocity 0.032687 0.075065 0.02 0.32 0.435 0.663242 0.19
backgroundPhoto† 0.361307 0.07208 0.22 0.50 5.012 5.0 x 10⁻⁷ *** 1.00
backgroundVid 0.473625 0.069102 0.34 0.61 6.853 < 2 x 10-16 *** 1.00
backgroundVidFast 0.438317 0.068363 0.30 0.57 6.411 < 2 x 10-16 *** 1.00
cohort 0.355644 0.127285 0.11 0.61 2.794 0.00521 ** 1.00
scorerEL†† 0.621976 0.09025 0.45 0.80 6.891 < 2 x 10-16 *** 1.00
scorerJEK -0.028933 0.065464 -0.16 0.10 0.442 0.658545 1.00
scorerNAR 0.286032 0.078966 0.13 0.44 3.622 0.000293 *** 1.00
wavingSide -0.007236 0.022618 -0.11 0.04 0.32 0.749049 0.20

111
GLMM of each response variable showed no significant effect of amplitude, velocity, or their
interaction. Model details are presented in Appendix Tables 4-7.
3.3.3 Male Courtship in Different Visual Environments
We quantified male long-distance waving displays with respect to distance from the
female, as well as visual background. Males carried out waves with an average amplitude of 28.9
± 7.0° (upstroke) and -28.8 ± 7.0° (downstroke), an average angular velocity of 88.4 ± 22.9°/s
(upstroke), and 79.4 ± 22.1°/s (downstroke). Males performed a mean of 3.06 ± 0.94 (upstroke)
and 3.09 ± 0.94 (downstroke) waves per second. Subsequent analyses were carried out using
absolute values for wave amplitude regardless of wave direction.
Wave amplitude was strongly positively correlated with distance to the female (Fig. 14a,
amplitude = 17.3 + 0.37 * distance, r2 = 0.13, F60.41 = 7.6, p = 0.008). However, these increases in
male wave amplitude did not fully compensate for distance-based declines in the visual angle of
male waves. From the perspective of the female, male waves performed from greater distances
were smaller in visual angle compared to those performed closer (Fig. 14b). However, by waving
with greater absolute amplitude at longer distances (i.e., by adopting a “dynamic wave” strategy),
males’ increased the perceived visual angles in the female’s field of view moreso than if they had
waved at the same amplitude (i.e., a “static wave” strategy, see curves in Fig. 14b).
Males did not change the velocity of their waves when courting in different backgrounds
(F3 = 0.86, p = 0.46). However, we did find a significant decrease in wave amplitude, but only
when courting against the Habitat Video background (Fig. 15a, F3=14.6, p < 0.0001). Male
courtship against the Fast Habitat Video background was not significantly different from courtship
against Grey or Habitat Still backgrounds. We found that males consistently responded to different

112
backgrounds by altering their position in relation to females. Males displayed closer to the female
when background complexity increased (Fig. 15b, F3 = 44.23, p < 0.0001), leading to increased
perceived movement (Fig. 15c, F3 = 12.26, p < 0.0001).
Figure 13. Female responses in different visual environments
Proportion of female orientation responses toward (dark pink bars) or away from (white bars) waving male
stimuli, split by background type (L to R: grey, habitat still, habitat video, habitat fast video). Females were
less responsive when viewing stimuli against moving backgrounds, but in these cases directed a greater
proportion of their attention to waving males. Error bars represent ±1 SE.

113
Figure 14. Males adjust waving displays with distance to receiver
(a) Males wave with greater amplitude at greater distances (linear regression, 95% CI in grey). (b) Visual
angle of male wave as viewed by the focal females. Male wave visual angles decrease with increasing distance,
but at a slower rate due to dynamic adjustment of wave amplitude (solid curve with grey confidence interval,
dynamic wave: visual angle = tan-1((a + b * distance) / distance), with tarsus displacement of a=2mm and
wave increase factor of b=0.1mm), as compared to an unchanging wave amplitude (dashed curve,
hypothetical static wave: visual angle = tan-1(a / distance). Data points represent the means of individual
trials.

114
Figure 15. Male displays in different visual environments
(a) Males do not change leg wave amplitude when courting against more complex backgrounds, (b) but
instead court at shorter distances from the female. (c) As a result, male leg movement as perceived by females
is greater when backgrounds are more complex.
3.4 Discussion
3.4.1 Waving Displays as Alerting Signals
We demonstrate here that the waving displays of H. pyrrithrix have a robust attention-
grabbing function. In the introductory, long-range phase of courtship, males display towards a
focal female by raising and waving their outstretched forelegs. Females often face away from the
courting male, but may notice these waves and subsequently attend to the male. Jumping spiders
turn to fixate on stimuli of interest with their primary eyes (Harland, Li, and Jackson 2011; M. F.
Land 1999; M F Land 1969b; Zurek and Nelson 2012b), allowing us to infer visual attention from
these turning responses. Based on multiple measures of female response to competing videos of
waving and non-waving males, we found that waving males are effective at capturing female visual
attention. Females were more likely to respond to waving males first, and devoted a much greater

115
fraction of their attention (89% of all turns) to waving males than to non-waving males. Waving
males were also attention-grabbing when both stimuli (waving and non-waving) walked across the
female’s field of view (Fig. 12), indicating that waving displays increase salience even in the
presence of a competing source of male movement. In addition, waving-while-walking appeared
to augment the alerting function of male displays, increasing the likelihood (by approximately
10%) that females would look at the waving male first. This advantage is consistent with the
observation that males often sidle side-to-side while presenting these waving displays to females.
What aspects of waving displays are responsible for capturing female visual attention?
Waves may target a specific pre-existing sensory bias for a specific movement (e.g., as seen in the
head-bob display of Anolis lizards (Steinberg and Leal 2013)). In such a case, we would expect
that the effective combinations of signal properties (amplitude, velocity) would be constrained.
However, while observed variation in male displays is clustered (low amplitude (28.8 ± 7.0°) and
high velocity (83.9 ± 22.5°/s)) within the range tested in the SW experiment (10-100°), we also
observed that waves were similarly effective across the entire range. There was no decline in
alerting function that would indicate the boundary of a strict sensory bias. Instead, our findings
suggest that waving displays function to stimulate the general motion sensitivity of salticid lateral
eyes (Zurek et al. 2010; Zurek and Nelson 2012a). Observed male variation may therefore be
constrained for reasons distinct from their alerting function, such as body condition, and/or active
female choice on waving displays (but see (d) below).
3.4.2 Effect of Background Motion
We also found that background motion impacts female responses to male waving displays.
Females were less likely to respond to male stimuli when these were presented against moving
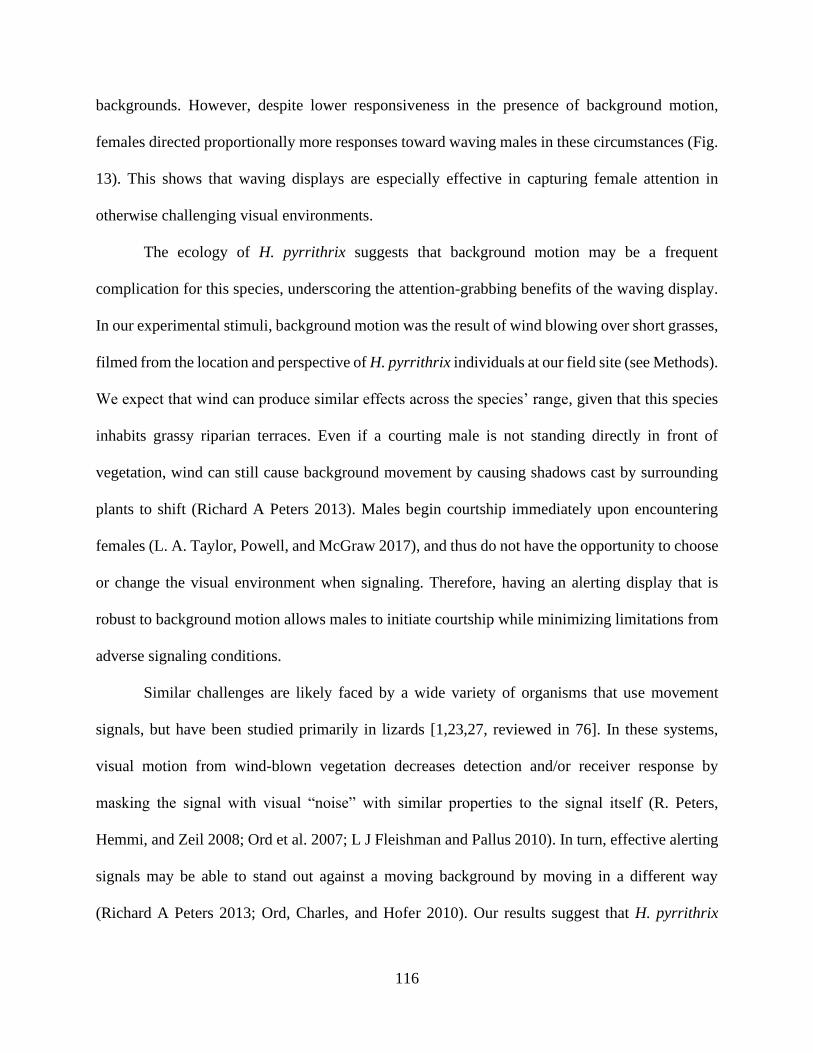
116
backgrounds. However, despite lower responsiveness in the presence of background motion,
females directed proportionally more responses toward waving males in these circumstances (Fig.
13). This shows that waving displays are especially effective in capturing female attention in
otherwise challenging visual environments.
The ecology of H. pyrrithrix suggests that background motion may be a frequent
complication for this species, underscoring the attention-grabbing benefits of the waving display.
In our experimental stimuli, background motion was the result of wind blowing over short grasses,
filmed from the location and perspective of H. pyrrithrix individuals at our field site (see Methods).
We expect that wind can produce similar effects across the species’ range, given that this species
inhabits grassy riparian terraces. Even if a courting male is not standing directly in front of
vegetation, wind can still cause background movement by causing shadows cast by surrounding
plants to shift (Richard A Peters 2013). Males begin courtship immediately upon encountering
females (L. A. Taylor, Powell, and McGraw 2017), and thus do not have the opportunity to choose
or change the visual environment when signaling. Therefore, having an alerting display that is
robust to background motion allows males to initiate courtship while minimizing limitations from
adverse signaling conditions.
Similar challenges are likely faced by a wide variety of organisms that use movement
signals, but have been studied primarily in lizards [1,23,27, reviewed in 76]. In these systems,
visual motion from wind-blown vegetation decreases detection and/or receiver response by
masking the signal with visual “noise” with similar properties to the signal itself (R. Peters,
Hemmi, and Zeil 2008; Ord et al. 2007; L J Fleishman and Pallus 2010). In turn, effective alerting
signals may be able to stand out against a moving background by moving in a different way
(Richard A Peters 2013; Ord, Charles, and Hofer 2010). Our results suggest that H. pyrrithrix

117
waving displays are qualitatively different enough from the movement of wind-blown grass to
remain salient. To our knowledge, this study is the first evidence that movement from wind-blown
vegetation is a source of visual noise for arthropod signalers. The role of such noise in the evolution
of movement signals in this and other species is an exciting field for future study.
3.4.3 Contextual Plasticity in Waving Displays
We also report that H. pyrrithrix males actively respond to the visual and spatial conditions
of a courtship interaction and adjust their waving displays to improve signal salience. While these
responses did not take the form of changes to the average properties of their waves (i.e., males
exhibited no changes to average wave velocity, and only idiosyncratic responses to average wave
amplitude), males did exhibit changes to other behaviors that impact the salience of their displays
from the female perspective. First, males increased the amplitude of their waving displays when
courting from further away from the female (Fig. 14). Second, when courting against more spatio-
temporally complex backgrounds, males moved closer to the female (Fig. 15). Both of these
behaviors increase the visual angle of the male wave from the perspective of the female. In other
words, these dynamic adjustments increase the perceived size of male waving displays, especially
when compared to such waves had males not adjusted their signaling. Our results from the SW
experiment (see above) show that larger waving displays are more likely to attract a female’s
attention first. Therefore, these forms of behavioral plasticity may improve the effectiveness of
male alerting displays in changing conditions.
Many species produce distinct long- and short- range signals, but active modification of a
signal in response to communication distance appears to be rarely studied. Previous work has
described distance-dependent signal modification primarily in acoustic communication. By

118
adjusting amplitude, acoustic signalers are able to compensate for how sound waves degrade
during travel (Cole 2013; Bradbury and Vehrencamp 2011). Humans (Michael, Siegel, and Pick
Jr 1995) and zebra finches (Brumm and Slater 2006) both increase the loudness (amplitude) of
their vocal communications when further from the focal receiver. Evidence for a similar strategy
in visual signaling is limited, despite the fact that visual signals also “drop off” with increasing
distance, appearing smaller from further away. Fiddler crabs (Uca perplexa) adjust the timing of
their claw-waving displays with distance to the female, but also perform qualitative changes to the
display structure that may correspond to different messages at different ranges (How et al. 2008).
In the lizard Anolis gundlachi, signalers increase the amplitude of their head-bob display with
increasing receiver distance (Steinberg and Leal 2013) (although the species also uses distance as
a cue to facultatively add a separate alert signal before their display (Ord and Stamps 2008)).
Similarly, H. pyrrithrix males appear to modify their visual display by increasing the perceived
intensity of the signal without changing its overall structure.
We note that for the acoustic signals of humans and finches, as in H. pyrrithrix visual
displays, signal modification did not fully compensate for the effect of distance. This suggests that
there may be constraints on these animals’ ability to compensate, and/or the benefit in doing so (as
seen for Anolis gundlachi (Steinberg and Leal 2013; Ord and Stamps 2008)). In addition,
Habronattus jumping spiders are known to produce complex seismic songs in synchrony with their
visual displays (D. O. Elias et al. 2012); do males also “sing” louder when courting from further
away, or is their ability to compensate with distance limited to visual signaling? These questions
are exciting avenues for future research.
To our knowledge, this is the first time that distance-dependent signal modification has
been described in an arachnid. The phylogenetic range of distance-dependent signal modification
119
suggests that it may be a more widespread strategy for effective communication than current
research indicates (How et al. 2008). Humans, for example, also wave their arms to attract
attention, and common experience suggests they may also increase the intensity of their displays
with communication distance. However, this observation surprisingly remains to be tested, along
with how other animals might use this strategy in their communication.
Work on how signalers respond to increased motion noise in their environment is also
limited. In general, signalers may attempt to change the properties of their signal to better stand
out against background noise (e.g., the Lombard Effect, where acoustic signalers increase
vocalization volume in noisy situations, reviewed in (Brumm and Zollinger 2011)), and/or adjust
how and when signals are used (e.g., timing signal delivery when noise is minimized (McNett,
Luan, and Cocroft 2010)). Previous work regarding movement-based signals is restricted to
research on Jacky Dragon lizards (Amphibolurus muricatus) and Anolis lizards. These animals
appear to follow a strategy analogous to the Lombard Effect. When faced with visual noise from
wind-blown plants, A. muricatus increase the duration and changes the structure of their tail-
flicking alerting signal (Richard A. Peters, Hemmi, and Zeil 2007), and two Anolis species (A.
gundlachi and A. cristatellus) increases the speed of their head bob displays (Ord, Stamps, and
Losos 2010; Ord et al. 2016; 2007). Several Anolis species also time their signaling for moments
of decreased visual noise (Ord, Charles, and Hofer 2010). In contrast, H. pyrrithrix males respond
primarily by changing their spatial positioning, moving closer to the female when in increasingly
noisy visual environments. Some species with multimodal displays change between modalities
when one is affected by environmental conditions (e.g., wolf spiders (Gordon and Uetz 2011)).
Whether H. pyrrithrix similarly increases vibrational courtship in response to a noisy visual
environment is another question open for future work.

120
3.4.4 Implications for Mate Choice
Observed natural variation in H. pyrrithrix waving displays and the effectiveness of
different waves suggests that these signals may be subject to selection. Larger amplitude waves
were more likely to attract a female’s attention first, so it is possible that males experience selection
to perform larger waves. Capturing attention early may improve mating success, as in the jumping
spider Maevia inclemens (D L Clark and Morjan 2001). This hypothesis may explain why males
responded to noisy signaling conditions by increasing the visual angle (apparent size) of their
displays from the female’s perspective; larger amplitude displays will also take up a larger visual
angle. It is also possible that, in addition to the alerting effects of waving displays, females may
assess wave amplitude in mate choice. Previous work shows that mating success improves with
male body size in this species (L. A. Taylor and McGraw 2013), and larger males will, all else
being equal, take up a larger visual angle in the female’s field of view. Thus, the visual angle
subtended by a display may be used by females as a proxy for overall body size, and male display
adjustments may serve to communicate or exaggerate this metric of his size.
Females may also have the opportunity to directly judge males based on their ability to
respond to changing conditions (Sih, Chang, and Wey 2014). Our findings suggest that males are
continuously assessing receiver distance and background complexity during courtship, and this
may be cognitively demanding. In addition, increasing wave amplitude requires males to invest
more energy into their display; male effort is a common axis of female mate choice in other
systems(Bradbury and Vehrencamp 2011), including in peacock jumping spiders (Girard, Elias,
and Kasumovic 2015). Males vary in the extent of their response to these spatio-social cues (Fig
14, Fig 15), allowing females to potentially assess a combination of male cognitive skill and
signaling effort. Disentangling how attention capture, display variation, and contextual plasticity

121
affect mating success in H. pyrrithrix will improve our understanding of the evolution of these
complex visual displays.
3.4.5 Conclusions
In summary, we show that the introductory arm-waving display of Habronattus pyrrithrix
reliably captures female visual attention, thus functioning as an alerting signal. We thus expand
the phylogenetic extent of alerting signals to include jumping spiders, and follow others in
suggesting that attention-grabbing components within complex displays are likely more common
than current research shows (Ord and Stamps 2008; G. G. Rosenthal 2007; Számadó 2015). We
also find that background motion from wind-blown vegetation is a source of sensory noise,
decreasing female responsiveness. Previous work has shown that the visual displays of Jacky
dragon lizards are affected by wind-blown vegetation ((Ord and Stamps 2008; Richard A. Peters,
Hemmi, and Zeil 2007)), but we provide the first evidence that arthropod signalers face similar
challenges. However, H. pyrrithrix waving displays are, in part, robust to these adverse conditions,
capturing a greater proportion of female attention when background motion was present. In
addition, displaying males appear to assess signaling conditions, including background complexity
and distance from intended receiver, and adjust their signaling adaptively to increase the apparent
size of their display. Males vary in the extent of this plastic response, possibly providing females
information on cognitive ability, effort, and/or condition.
Our work has several implications for the evolution of communication systems in the
Habronattus genus and other taxa. Habronattus species inhabit a wide range of habitats, and also
exhibit diverse introductory motifs to their courtship sequences, many of which may be alerting
displays (Leduc-Robert and Maddison 2018). Such putative alerts vary amongst even closely

122
related species in their amplitude, velocity, direction of motion, and even which limb (foreleg or
pedipalp) is moved (D. O. Elias et al. 2012, SAE unpublished data). Do these represent distinct
solutions to capturing female attention early in the male display? And if so, have they been shaped
by ecological differences related to salience? Habronattus species also vary in their degree of
microhabitat specialization, and thus vary in breadth of visual environments in which courtship
occurs. How does alert salience vary between qualitatively different environments, and are such
challenges met via signal evolution or adaptive plasticity (e.g., in Anolis lizards (Ord et al. 2016;
Ord, Stamps, and Losos 2010))? Such questions are exciting prospects for future investigations on
the evolution of alerting signals, in this and other arthropod groups.
3.5 Acknowledgements
We thank Taha Ahmed, Sinjon Bartel, Corey Forman, John Gote, Abigail Jarret, Ciara
Kernan, Julia Kerstetter, Margaret Mass, Nicholas Russo, Emily Liu, Violet Xu, Stanton Young,
Zachary Zimmer, and Wenyu Zeng for their work on animal care and video scoring. We thank the
University of Pittsburgh Machine Shop for constructing the courtship arena used in these
experiments. We also thank Mark Schnepf and Schnepf Farms for allowing us to collect spiders
on their property. Finally, we thank Dr. Nathan Brouwer for his mentoring and advice on statistical
methods.

123
3.5.1 Funding Statement
This work was financially supported by the University of Pittsburgh, the University of
Cincinnati, and the National Science Foundation (NSF IOS-1557549, IOS-1734291, and IOS-
1933714 all to NIM). SAE was supported in part by the Andrew Mellon Predoctoral Fellowship
and the Ivy McManus Predoctoral Fellowship.

124
4.0 Conclusions
Through the above research, I have developed our understanding of the pervasive
directional constraints in signal transmission and reception, how communicators position
themselves with respect to these biases, and how signalers respond to dynamic alignment of signal
and sensor. Previous work in animal communication has often operated under the untested
assumptions that signaler and receiver behavior during communication facilitates signal
perception. In my survey of communication literature, I found robust evidence for directional
constraints on signal transmission and reception across species and signaling modalities. Taken
together, these constraints indicate that even small changes in positioning may have strong effects
on signal efficacy. However, while several studies have investigated how signalers orient
themselves to manage signal directionality, there has been very little work that assesses how
receivers direct their sensors (and thus their attention) during communication. For effective visual
communication, it is not sufficient for signalers to orient their signals towards intended receivers.
Receivers must also orient their sensor(s) towards these signals, and with the portion of their
sensory field that is most sensitive to the type of information used by the signal (G. G. Rosenthal
2007).
I then empirically investigated the dynamics of such signaling alignment in the courtship
of the fiery-haired jumping spider, Habronattus pyrrithrix. Habronattus jumping spiders have
strong directional biases in visual signal transmission and reception. Males use colorful ornaments
in their courtship dances, but these are only on the forward-facing surfaces of their bodies.
Likewise, females can only see in color through their anterior median eyes, which sweep only a
60-degree cone in front of their body. Thus, the degree of alignment between male and female

125
facing directions serves as a reliable estimation of the effectiveness of color communication in this
system. By characterizing signaling alignment throughout courtship, I discovered that the visibility
of male coloration is dynamic, and ultimately determined by changes in receiver behavior. Females
frequently looked away from courting males, and while males did sometimes reposition
themselves in response, they did not move enough to regain a position in her frontal field of view.
However, I also found evidence that males assessed the direction a female is facing, and used this
information to make tactical decisions on when to display certain color ornaments. Males were
most likely to show their orange “knees” to females immediately after she turned back to face him.
Furthermore, female orientation towards males, and thus signaling alignment, increased
significantly as courtship progressed from long to short-range display.
I tested one possible mechanism for how males might improve signal alignment by
assessing the effectiveness of male arm-waving as “alert displays” that function to capture a
female’s visual attention. Through a video playback experiment, I found that females frequently
turned to look towards waving males, and the relative effectiveness of these displays increased in
adverse signaling conditions. This suggests that such waving displays, which are widespread in
Habronattus and other jumping spiders, may be a repeated or conserved adaptation for controlling
receiver orientation. In addition, by quantifying male displays in increasingly complex signaling
environments, I found that males assess and respond adaptively to their spatial and visual
environment during communication.
In summary, this research demonstrates the importance of considering the inherent spatial
constraints of signaling in shaping selection on communication behavior. The Habronattus group
of jumping spiders provides an excellent springboard for future research on a variety of pressing
questions. I found evidence of variation in males’ abilities to respond to spatial information,

126
suggesting that females have the potential to assess this spatio-social skill (Sih, Sinn, and Patricelli
2019) in mate choice. Habronattus species vary in the presence and elaboration of color
ornaments, this raises the question of whether selection for behaviors that increase signaling
alignment vary with the use of color in displays, and if this selection is relaxed in less colorful
species. More broadly, assessing the frequency, control, and consequences of signaling alignment
in other systems will help reveal previously unexplored axes on which selection may act to shape
animal communication. Overall, this dissertation reveals the widespread role of spatial constraints
in driving signaling behavior, and demonstrates that the spatial arrangement of signaler and
receiver, and thus communication efficacy, must be managed dynamically through behavioral
responses.
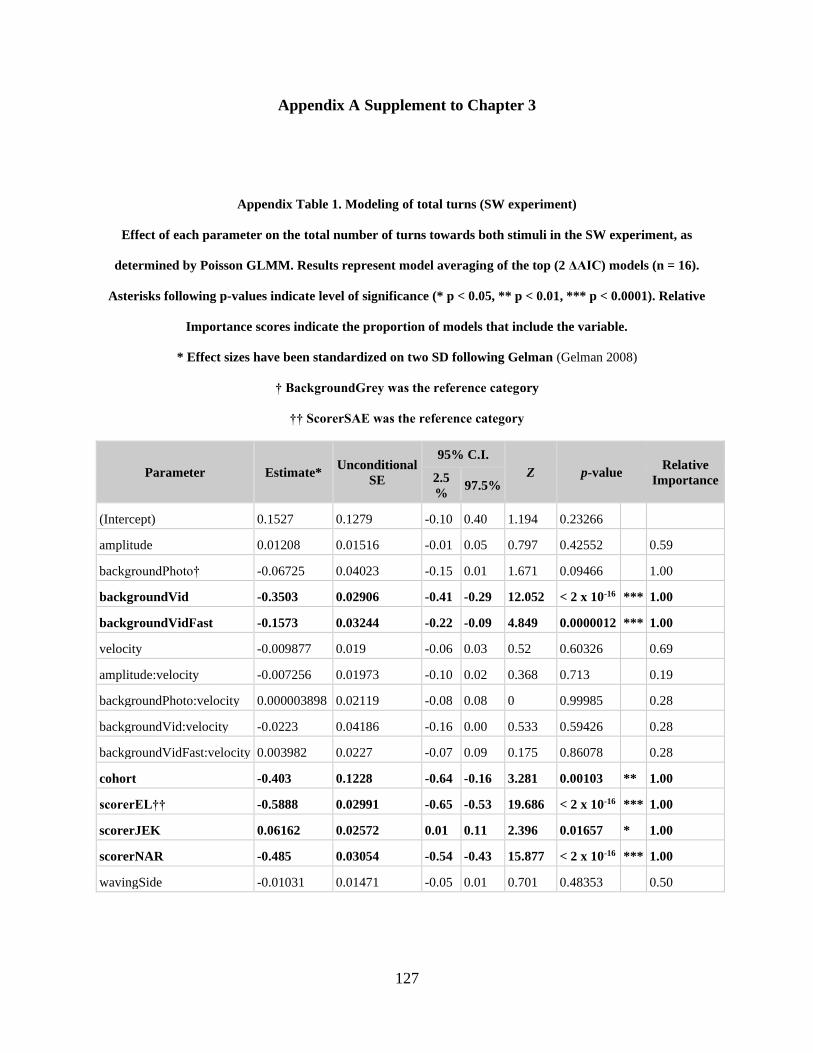
127
Appendix A Supplement to Chapter 3
Appendix Table 1. Modeling of total turns (SW experiment)
Effect of each parameter on the total number of turns towards both stimuli in the SW experiment, as
determined by Poisson GLMM. Results represent model averaging of the top (2 ΔAIC) models (n = 16).
Asterisks following p-values indicate level of significance (* p < 0.05, ** p < 0.01, *** p < 0.0001). Relative
Importance scores indicate the proportion of models that include the variable.
* Effect sizes have been standardized on two SD following Gelman (Gelman 2008)
† BackgroundGrey was the reference category
†† ScorerSAE was the reference category
Parameter Estimate* Unconditional
SE
95% C.I.
Z p-value Relative
Importance 2.5
% 97.5%
(Intercept) 0.1527 0.1279 -0.10 0.40 1.194 0.23266
amplitude 0.01208 0.01516 -0.01 0.05 0.797 0.42552 0.59
backgroundPhoto† -0.06725 0.04023 -0.15 0.01 1.671 0.09466 1.00
backgroundVid -0.3503 0.02906 -0.41 -0.29 12.052 < 2 x 10-16 *** 1.00
backgroundVidFast -0.1573 0.03244 -0.22 -0.09 4.849 0.0000012 *** 1.00
velocity -0.009877 0.019 -0.06 0.03 0.52 0.60326 0.69
amplitude:velocity -0.007256 0.01973 -0.10 0.02 0.368 0.713 0.19
backgroundPhoto:velocity 0.000003898 0.02119 -0.08 0.08 0 0.99985 0.28
backgroundVid:velocity -0.0223 0.04186 -0.16 0.00 0.533 0.59426 0.28
backgroundVidFast:velocity 0.003982 0.0227 -0.07 0.09 0.175 0.86078 0.28
cohort -0.403 0.1228 -0.64 -0.16 3.281 0.00103 ** 1.00
scorerEL†† -0.5888 0.02991 -0.65 -0.53 19.686 < 2 x 10-16 *** 1.00
scorerJEK 0.06162 0.02572 0.01 0.11 2.396 0.01657 * 1.00
scorerNAR -0.485 0.03054 -0.54 -0.43 15.877 < 2 x 10-16 *** 1.00
wavingSide -0.01031 0.01471 -0.05 0.01 0.701 0.48353 0.50

128
Appendix Table 2. Modeling of number of turns to waving male (SW experiment)
Effect of each parameter on the number of turns to the waving male in the SW experiment, as determined by
binomial GLMM. Results represent model averaging of the top (2 ΔAIC) models (n = 8). Asterisks following
p-values indicate level of significance (* p < 0.05, ** p < 0.01, *** p < 0.0001). Relative Importance scores
indicate the proportion of models that include the variable.
* Effect sizes have been standardized on two SD following Gelman (Gelman 2008)
† BackgroundGrey was the reference category
†† ScorerSAE was the reference category
Parameter Estimate* Unconditional
SE
95% C.I. Z p-value
Relative
Importance 2.5 % 97.5%
(Intercept) -0.067515 0.111272 -0.29 0.15 0.607 0.54404
amplitude 0.00768 0.013927 -0.01 0.05 0.551 0.58133 0.41
backgroundPhoto† -0.009425 0.043584 -0.09 0.08 0.216 0.82881 1.00
backgroundVid -0.254278 0.031416 -0.32 -0.19 8.093 < 2 x 10-16 *** 1.00
backgroundVidFast -0.081237 0.035325 -0.15 -0.01 2.3 0.02147 * 1.00
velocity -0.011326 0.016291 -0.06 0.01 0.695 0.48696 0.49
cohort -0.346034 0.110347 -0.56 -0.13 3.136 0.00171 ** 1.00
scorerEL†† -0.510907 0.03216 -0.57 -0.45 15.885 < 2 x 10-16 *** 1.00
scorerJEK 0.0505 0.028651 -0.01 0.11 1.762 0.07799 . 1.00
scorerNAR -0.440244 0.033601 -0.51 -0.37 13.101 < 2 x 10-16 *** 1.00
wavingSide -0.017651 0.018862 -0.06 0.00 0.936 0.34939 0.62

129
Appendix Table 3. Modeling of direction of first choice (SW experiment)
Effect of each parameter on direction of first choice (which stimuli the female turned towards first) in the SW
experiment, as determined by binomial GLMM. Results represent model averaging of the top (2 ΔAIC)
models (n = 3). Asterisks following p-values indicate level of significance (* p < 0.05, ** p < 0.01, *** p <
0.0001). Relative Importance scores indicate the proportion of models that include the variable.
* Effect sizes have been standardized on two SD following Gelman (Gelman 2008)
†† ScorerSAE was the reference category
Parameter Estimate* Unconditional
SE
95% C.I. Z p-value
Relative
Importance 2.5 % 97.5%
(Intercept) 0.247725 0.040152 0.17 0.33 6.169 < 2 x 10-16 ***
amplitude 0.090896 0.040918 0.01 0.17 2.221 0.0263 * 1.00
velocity 0.009193 0.025988 -0.04 0.12 0.354 0.7235 0.26
cohort -0.003964 0.056111 -0.11 0.11 0.071 0.9437 1.00
scorerEL†† -0.397417 0.072414 -0.54 -0.26 5.487 < 2 x 10-16 *** 1.00
scorerJEK -0.443061 0.065228 -0.57 -0.32 6.792 < 2 x 10-16 *** 1.00
scorerNAR 0.009834 0.074959 -0.14 0.16 0.131 0.8956 1.00
wavingSide 0.053561 0.047635 -0.01 0.15 1.124 0.2609 0.73

130
Appendix Table 4. Modeling of total tuns (WW experiment)
Effect of each parameter on the total number of turns towards both stimuli in the WW experiment, as
determined by Poisson GLMM. Results represent model averaging of the top (2 ΔAIC) models (n = 6).
Asterisks following p-values indicate level of significance (* p < 0.05, ** p < 0.01, *** p < 0.0001). Relative
Importance scores indicate the proportion of models that include the variable.
* Effect sizes have been standardized on two SD following Gelman (Gelman 2008)
Parameter Estimate* Unconditional
SE
95% C.I. Z p-value
Relative
Importance 2.5 % 97.5%
(Intercept) 0.5019141 0.1570053 0.19 0.81 3.191 0.00142 **
amplitude -0.0008328 0.028597 -0.12 0.11 0.029 0.97681 0.23
velocity 0.0514657 0.0612959 -0.03 0.20 0.839 0.40161 0.62
amplitude:velocity -0.0241456 0.0754625 -0.42 0.04 0.32 0.74913 0.13
wavingSide -0.0040041 0.0281332 -0.13 0.10 0.142 0.88702 0.21

131
Appendix Table 5. Modeling of number of turns to waving male (WW experiment)
Effect of each parameter on the number of turns to the waving male in the WW experiment, as determined
by binomial GLMM. Results represent model averaging of the top (2 ΔAIC) models (n = 3). Asterisks
following p-values indicate level of significance (* p < 0.05, ** p < 0.01, *** p < 0.0001). Relative Importance
scores indicate the proportion of models that include the variable.
* Effect sizes have been standardized on two SD following Gelman (Gelman 2008)
Parameter Estimate* Unconditional
SE
95% C.I. Z p-value
Relative
Importance 2.5 % 97.5%
(Intercept) 0.32875 0.146199 0.04 0.62 2.244 0.0248 *
amplitude -0.026186 0.056871 -0.16 0.09 0.46 0.6458 0.72
velocity 0.037488 0.059146 -0.07 0.18 0.633 0.5269 0.72
amplitude:velocity -0.228533 0.179744 -0.57 -0.07 1.271 0.2039 0.72
wavingSide 0.001218 0.028472 -0.12 0.13 0.043 0.9659 0.19

132
Appendix Table 6. Modeling of direction of first choice (WW experiment)
Effect of each parameter on the direction of first choice (which stimuli the female turned towards first) in the
WW experiment, as determined by binomial GLMM. Results represent model averaging of the top (2 ΔAIC)
models (n = 4). Asterisks following p-values indicate level of significance (* p < 0.05, ** p < 0.01, *** p <
0.0001). Relative Importance scores indicate the proportion of models that include the variable.
* Effect sizes have been standardized on two SD following Gelman (Gelman 2008)
Parameter Estimate* Unconditional
SE
95% C.I. Z p-value
Relative
Importance 2.5 % 97.5%
(Intercept) 0.398493 0.106913 0.19 0.61 3.718 0.000201 ***
amplitude 0.006513 0.078043 -0.32 0.40 0.083 0.933648 0.18
velocity -0.013077 0.083505 -0.43 0.29 0.156 0.875824 0.19
wavingSide -0.002518 0.076498 -0.38 0.35 0.033 0.973802 0.17

133
Appendix Table 7. Modeling of proportion of turns to waving male (WW experiment)
Effect of each parameter on the proportion of turns towards waving males in the WW experiment, as
determined by binomial GLMM. Results represent model averaging of the top (2 ΔAIC) models (n = 6).
Asterisks following p-values indicate level of significance (* p < 0.05, ** p < 0.01, *** p < 0.0001). Relative
Importance scores indicate the proportion of models that include the variable.
* Effect sizes have been standardized on two SD following Gelman (Gelman 2008)
Parameter Estimate* Unconditional
SE
95% C.I. Z p-value
Relative
Importance 2.5 % 97.5%
(Intercept) 1.826388 0.203062 1.43 2.23 8.972 < 2 x 10-16 ***
amplitude -0.047963 0.119331 -0.43 0.21 0.401 0.688 0.43
velocity -0.099738 0.151652 -0.52 0.12 0.657 0.511 0.50
amplitude:velocity -0.11153 0.268185 -1.21 0.04 0.416 0.678 0.19
wavingSide 0.009243 0.058789 -0.23 0.39 0.157 0.875 0.11
134
Bibliography
Agostinelli, C, and U Lund. 2013. “R Package Circular: Circular Statistics (Version 0.4-3).” URL
Https://R-Forge. r-Project. Org/Projects/Circular.
Alberts, Allison C., David W Winkler, and Corson Hall. 1992. “Constraints on the Design of
Chemical Communication Systems in Terrestrial Vertebrates.” The American Naturalist 139
(4): 526–43. https://doi.org/10.2307/2678832.
Alcock, John. 1987. “Leks and Hilltopping in Insects.” Journal of Natural History 21 (2): 319–28.
Andersson, Martin N., Muhammad Binyameen, Medhat M. Sadek, and Fredrik Schlyter. 2011.
“Attraction Modulated by Spacing of Pheromone Components and Anti-Attractants in a Bark
Beetle and a Moth.” Journal of Chemical Ecology 37: 899–911.
https://doi.org/10.1007/s10886-011-9995-3.
Atema, Jelle. 1995. “Chemical Signals in the Marine Environment: Dispersal, Detection, and
Temporal Signal Analysis.” Proceedings of the National Academy of Sciences of the United
States of America 92 (1): 62–66. https://doi.org/10.1073/pnas.92.1.62.
Barker, Nicole K S, and Daniel J. Mennill. 2009. “Song Perch Height in Rufous-and-White Wrens:
Does Behaviour Enhance Effective Communication in a Tropical Forest?” Ethology 115 (9):
897–904. https://doi.org/10.1111/j.1439-0310.2009.01674.x.
Barnett, James B., and Innes C. Cuthill. 2014. “Distance-Dependent Defensive Coloration.”
Current Biology 24 (24): R1157–58. https://doi.org/10.1016/j.cub.2014.11.015.
Barnett, James B., Innes C. Cuthill, and Nicholas E. Scott-Samuel. 2018. “Distance-Dependent
Aposematism and Camouflage in the Cinnabar Moth Caterpillar (Tyria Jacobaeae,
Erebidae).” Royal Society Open Science 5 (2): 171396. https://doi.org/10.1098/rsos.171396.
Barnett, James B., Annabelle S. Redfern, Robin Bhattacharyya-DIckson, Olivia Clifton, Thomas
Courty, Thien Ho, Annabel Hopes, et al. 2017. “Stripes for Warning and Stripes for Hiding:
Spatial Frequency and Detection Distance.” Behavioral Ecology 28 (2): 373–81.
https://doi.org/10.1093/beheco/arw168.
Barnett, James B, Constantine Michalis, Nicholas E. Scott-Samuel, and Innes C Cuthill. 2018.
“Distance-Dependent Defensive Coloration in the Poison Frog Dendrobates Tinctorius ,
Dendrobatidae.” Proceedings of the National Academy of Sciences, 201800826.
https://doi.org/10.1073/pnas.1800826115.
Barreira, Ana S., Natalia C. García, Stephen C. Lougheed, and Pablo L. Tubaro. 2016. “ Viewing
Geometry Affects Sexual Dichromatism and Conspicuousness of Noniridescent Plumage of
Swallow Tanagers ( Tersina Viridis ) .” The Auk 133 (3): 530–43.

135
https://doi.org/10.1642/auk-15-170.1.
Bates, Douglas, Martin Mächler, Benjamin M. Bolker, and Steven C. Walker. 2014. “Fitting
Linear Mixed-Effects Models Using Lme4.” Journal of Statistical Software 67 (1).
https://doi.org/10.18637/jss.v067.i01.
Bennet-clark, B Y H C. 1987. “The Tuned Singing Burrow of Mole Crickets.” Journal of
Experimental Biology 128 (1): 383–409.
Berdahl, Andrew M., Albert B. Kao, Andrea Flack, Peter A.H. Westley, Edward A. Codling, Iain
D. Couzin, Anthony I. Dell, and Dora Biro. 2018. “Collective Animal Navigation and
Migratory Culture: From Theoretical Models to Empirical Evidence.” Philosophical
Transactions of the Royal Society B: Biological Sciences 373 (1746).
https://doi.org/10.1098/rstb.2017.0009.
Bergman, Daniel A., Arthur L. Martin, and Paul A. Moore. 2005. “Control of Information Flow
through the Influence of Mechanical and Chemical Signals during Agonistic Encounters by
the Crayfish, Orconectes Rusticus.” Animal Behaviour 70 (3): 485–96.
https://doi.org/10.1016/j.anbehav.2004.11.021.
Blackburn, Gwylim S., and Wayne P. Maddison. 2014. “Stark Sexual Display Divergence among
Jumping Spider Populations in the Face of Gene Flow.” Molecular Ecology 23 (21): 5208–
23. https://doi.org/10.1111/mec.12942.
Blackburn, Gwylim S., Wayne P. Maddison, and Gwylim S. Blackburn. 2015. “Insights to the
Mating Strategies of Habronattus Americanus Jumping Spiders from Natural Behaviour and
Staged Interactions in the Wild.” Behaviour 152 (9): 1169–86.
https://doi.org/10.1163/1568539X-00003273.
Blackwell, Susanna B., Trent L. McDonald, Katherine H. Kim, Lisanne a M Aerts, W. John
Richardson, Charles R. Greene, and Bill Streever. 2012. “Directionality of Bowhead Whale
Calls Measured with Multiple Sensors.” Marine Mammal Science 28 (1): 200–212.
https://doi.org/10.1111/j.1748-7692.2011.00464.x.
Blest, A. D. 1985. “Retinal Mosaics of the Principal Eyes of Jumping Spiders (Salticidae) in Some
Neotropical Habitats: Optical Trade-Offs between Sizes and Habitat Illuminances.” Journal
of Comparative Physiology A 157 (3): 391–404. https://doi.org/10.1007/BF00618129.
Blest, A. D., R. C. Hardie, P. McIntyre, and D. S. Williams. 1981. “The Spectral Sensitivities of
Identified Receptors and the Function of Retinal Tiering in the Principal Eyes of a Jumping
Spider.” Journal of Comparative Physiology ? A 145 (2): 227–39.
https://doi.org/10.1007/BF00605035.
Bohlin, Titti, Birgitta S. Tullberg, and Sami Merilaita. 2008. “The Effect of Signal Appearance
and Distance on Detection Risk in an Aposematic Butterfly Larva (Parnassius Apollo).”
Animal Behaviour 76: 577–84. https://doi.org/10.1016/j.anbehav.2008.02.012.
Book, The, Indian Birds, Bombay Natural, and History Society. 2012. “Principles of Animal

136
Communictaion” 2 (1993): 32–33. https://doi.org/10.1017/S0959270910000560.7.
Bortolotti, Gary R., Marten J. Stoffel, and Ismael Galván. 2011. “Wintering Snowy Owls Bubo
Scandiacus Integrate Plumage Colour, Behaviour and Their Environment to Maximize
Efficacy of Visual Displays.” Ibis 153 (1): 134–42. https://doi.org/10.1111/j.1474-
919X.2010.01067.x.
Bradbury, J W, and S L Vehrencamp. 2011. Principles of Animal Communication. 2nd ed.
Sunderland, Massachusetts: Sinauer. https://doi.org/10.1093/ae/45.2.126.
Breithaupt, Thomas, and Martin Thiel. 2011. “Chemical Communication in Crustaceans.”
Chemical Communication in Crustaceans, no. June: 1–565. https://doi.org/10.1007/978-0-
387-77101-4.
Breitwisch, Randall, and George H Whitesides. 1987. “Directionality of Singing and Non-Singing
Behaviour of Mated and Unmated Northern Mockingbirds, Mimus Polyglottos.” Animal
Behaviour 35 (2): 331–39.
Brenowitz, Eliot A. 1982. “The Active Space of Red-Winged Blackbird Song.” Journal of
Comparative Physiology □ A 147 (4): 511–22. https://doi.org/10.1007/BF00612017.
Broadbent, Donald E., and Margaret Gregory. 1965. “Effects of Noise and of Signal Rate upon
Vigilance Analysed by Means of Decision Theory.” Human Factors: The Journal of Human
Factors and Ergonomics Society 7 (2): 155–62.
https://doi.org/10.1177/001872086500700207.
Bruce, M. J. 2006. “Silk Decorations: Controversy and Consensus.” Journal of Zoology 269 (1):
89–97. https://doi.org/10.1111/j.1469-7998.2006.00047.x.
Bruce, Matthew J., Astrid M. Heiling, and Marie E. Herberstein. 2005. “Spider Signals: Are Web
Decorations Visible to Birds and Bees?” Biology Letters 1 (3): 299–302.
https://doi.org/10.1098/rsbl.2005.0307.
Brumm, Henrik, Kathryn A. Robertson, and Erwin Nemeth. 2011. “Singing Direction as a Tool to
Investigate the Function of Birdsong: An Experiment on Sedge Warblers.” Animal Behaviour
81 (3): 653–59. https://doi.org/10.1016/j.anbehav.2010.12.015.
Brumm, Henrik, and P. J B Slater. 2006. “Animals Can Vary Signal Amplitude with Receiver
Distance: Evidence from Zebra Finch Song.” Animal Behaviour 72: 699–705.
https://doi.org/10.1016/j.anbehav.2006.01.020.
Brumm, Henrik, and Dietmar Todt. 2003. “Facing the Rival : Directional Singing Behaviour in
Nightingales.” Behaviour 140 (1): 43–53.
Brumm, Henrik, and Anne Zollinger. 2011. “The Evolution of the Lombard Effect: 100 Years of
Psychoacoustic Research.” Behaviour 148 (11–13): 1173–98.
https://doi.org/10.1163/000579511X605759.

137
Campos, Diana P., Laith A. Bander, Aliz Raksi, and Daniel T. Blumstein. 2009. “Perch Exposure
and Predation Risk: A Comparative Study in Passerines.” Acta Ethologica 12 (2): 93–98.
https://doi.org/10.1007/s10211-009-0061-x.
Canavesi, Cristina, Skye Long, Dennis Fantone, Elizabeth Jakob, Robert R Jackson, Duane
Harland, and Jannick P Rolland. 2011. “Design of a Retinal Tracking System for Jumping
Spiders.” In Novel Optical Systems Design and Optimization XIV, 8129:81290A-81290A –
8. http://dx.doi.org/10.1117/12.896353.
Caro, Tm. 2013. “Are Spotted Skunks Conspicuous or Cryptic?” Ethology, Ecology & Evolution
25 (2).
Caves, Eleanor, and Sönke Johnsen. 2017. “AcuityView” 12 (10): 3218–21.
Caves, Eleanor M., Nicholas C. Brandley, and Sönke Johnsen. 2018. “Visual Acuity and the
Evolution of Signals.” Trends in Ecology & Evolution 33 (5): 358–72.
https://doi.org/10.1016/j.tree.2018.03.001.
Chamberlin, Ralph V. 1924. “Descriptions of New American and Chinese Spiders, with Notes on
Other Chinese Species.” Proceedings of the US National Museum 63 (13).
https://doi.org/10.1126/science.9.231.776.
Chaverri, Gloriana, and Erin H Gillam. 2013. “Sound Amplification by Means of a Horn-like
Roosting Structure in Spix’s Disc-Winged Bat.” Proceedings. Biological Sciences / The
Royal Society 280 (1772): 20132362. https://doi.org/10.1098/rspb.2013.2362.
Clark, Christopher J., and Emily A. Mistick. 2018. “Strategic Acoustic Control of a Hummingbird
Courtship Dive.” Current Biology 28 (8): 1257-1264.e6.
https://doi.org/10.1016/j.cub.2018.03.021.
Clark, D L, and C L Morjan. 2001. “Attracting Female Attention: The Evolution of Dimorphic
Courtship Displays in the Jumping Spider Maevia Inclemens (Araneae: Salticidae).”
Proceedings. Biological Sciences / The Royal Society 268 (1484): 2461–65.
https://doi.org/10.1098/rspb.2001.1819.
Clark, David L, and Brandon Biesiadecki. 2002. “MATING SUCCESS AND ALTERNATIVE
REPRODUCTIVE STRATEGIES OF THE DIMORPHIC JUMPING SPIDER , MAEVIA
INCLEMENS ( ARANEAE , STRATEGIES OF THE DIMORPHIC JUMPING SPIDER ,.”
Journal of Arachnology 30 (3): 511–18.
Clark, David L, and George W Uetz. 1993. “Signal Efficacy and the Evolution of Male
Dimorphism in the Jumping Spider, Maevia Inclemens.” Proceedings of the National
Academy of Sciences of the United States of America 90 (24): 11954–57.
http://www.pubmedcentral.nih.gov/articlerender.fcgi?artid=48103&tool=pmcentrez&render
type=abstract.
Cole, Gemma L. 2013. “Lost in Translation: Adaptation of Mating Signals in Changing
Environments.” Springer Science Reviews 1 (1–2): 25–40. https://doi.org/10.1007/s40362-

138
013-0009-4.
Cole, Gemma L., and John A. Endler. 2018. “Courtship Diverges with Foraging Behaviour in
Artificially Selected Populations.” Animal Behaviour 144: 9–15.
https://doi.org/10.1016/j.anbehav.2018.07.016.
Collett, Thomas S., and Paul Graham. 2004. “Animal Navigation: Path Integration, Visual
Landmarks and Cognitive Maps.” Current Biology 14 (12): 475–77.
https://doi.org/10.1016/j.cub.2004.06.013.
Craven, Brent A., Eric G. Paterson, and Gary S. Settles. 2010. “The Fluid Dynamics of Canine
Olfaction: Unique Nasal Airflow Patterns as an Explanation of Macrosmia.” Journal of the
Royal Society Interface 7 (47): 933–43. https://doi.org/10.1098/rsif.2009.0490.
Crawley, Michael J. 2003. Statistical Computing: An Introduction to Data Analysis Using S-Plus.
Chichester, England: Wiley.
———. 2005. Statistics: An Introduction Using R. Wiley.
Cronin, Thomas W, Sönke Johnsen, N Justin Marshall, and Eric J Warrant. 2014. Visual Ecology.
Princeton University Press.
Cummings, Molly E., and John A. Endler. 2018. “25 Years of Sensory Drive: The Evidence and
Its Watery Bias.” Current Zoology 64 (4): 471–84. https://doi.org/10.1093/cz/zoy043.
Cuthill, Innes C, N Simon Sanghera, Olivier Penacchio, Paul George Lovell, Graeme D Ruxton,
and Julie M Harris. 2016. “Optimizing Countershading Camouflage.” PNAS 113 (46):
13093–97. https://doi.org/10.1073/pnas.1611589113.
Dakin, Roslyn, and Robert Montgomerie. 2009. “Peacocks Orient Their Courtship Displays
towards the Sun.” Behavioral Ecology and Sociobiology 63: 825–34.
https://doi.org/10.1007/s00265-009-0717-6.
Dantzker, Marc S., Grant B. Deane, and Jack W. Bradbury. 1999. “Directional Acoustic Radiation
in the Strut Display of Male Sage Grouse Centrocercus Urophasianus.” The Journal of
Experimental Biology 202 (21): 2893–2909.
Davidson, Gabrielle L., Shannon Butler, Esteban Fernández-Juricic, Alex Thornton, and Nicola S.
Clayton. 2013. “Gaze Sensitivity: Function and Mechanisms from Sensory and Cognitive
Perspectives.” Animal Behaviour 87: 3–15. https://doi.org/10.1016/j.anbehav.2013.10.024.
Donohue, Callum G, Jan M Hemmi, and Jennifer L Kelley. 2020. “Countershading Enhances
Camouflage by Reducing Prey Contrast.” Proceedings of the Royal Society B 287 (1927):
20200477.
Doucet, Stéphanie M, and Melissa G Meadows. 2009. “Iridescence: A Functional Perspective.”
Journal of the Royal Society, Interface / the Royal Society 6 Suppl 2 (February): S115–32.
https://doi.org/10.1098/rsif.2008.0395.focus.

139
Duelli, Peter. 1978. “Movement Detection in the Posterolateral Eyes of Jumping Spiders (Evarcha
Arcuata, Salticidae).” Journal of Comparative Physiology 124 (1): 15–26.
https://doi.org/10.1007/BF00656387.
Dukas, R. 2002. “Behavioural and Ecological Consequences of Limited Attention.” Philosophical
Transactions of the Royal Society, Series B: Biological Sciences 357 (October): 1539–47.
https://doi.org/10.1098/rstb.2002.1063.
Dukas, Reuven. 1998. Cognitive Ecology: The Evolutionary Ecology of Information Processing
and Decision Making. University of Chicago Press.
———. 2004. “Causes and Consequences of Limited Attention.” Brain, Behavior and Evolution
63 (4): 197–210. https://doi.org/10.1159/000076781.
Echeverri, Sebastian A., Daniel B. Zurek, and Nathan I. Morehouse. 2020. “Jumping Spider
Adjusts Attention-Grabbing Display to Spatial and Environmental Context.” Dryad.
https://doi.org/https://doi.org/10.5061/dryad.x3ffbg7fx.
Echeverri, Sebastian A, Nathan I. Morehouse, and Daniel B. Zurek. 2017. “Control of Signal
Alignment during the Dynamic Courtship Display of a Jumping Spider.” Behavioral Ecology
00 (arx107): 1–9. https://doi.org/10.1093/beheco/arx107.
Elias, D, E Hebets, R Hoy, and a Mason. 2005. “Seismic Signals Are Crucial for Male Mating
Success in a Visual Specialist Jumping Spider (Araneae: Salticidae).” Animal Behaviour 69
(4): 931–38. https://doi.org/10.1016/j.anbehav.2004.06.024.
Elias, Damian O., Maydianne C B Andrade, and Michael M. Kasumovic. 2011. “Dynamic
Population Structure and the Evolution of Spider Mating Systems.” Advances in Insect
Physiology 41: 65–114. https://doi.org/10.1016/B978-0-12-415919-8.00002-1.
Elias, Damian O., Wayne P. Maddison, Christina Peckmezian, Madeline B. Girard, and Andrew
C. Mason. 2012. “Orchestrating the Score: Complex Multimodal Courtship in the
Habronattus Coecatus Group of Habronattus Jumping Spiders (Araneae: Salticidae).”
Biological Journal of the Linnean Society 105 (3): 522–47. https://doi.org/10.1111/j.1095-
8312.2011.01817.x.
Elias, Damian O, Andrew C Mason, and Eileen A Hebets. 2010. “A Signal-Substrate Match in the
Substrate-Borne Component of a Multimodal Courtship Display.” Current Zoology 56 (3):
370–78. https://doi.org/10.1093/czoolo/56.3.370.
Elias, Damian O, Andrew C Mason, and Ronald R Hoy. 2004. “The Effect of Substrate on the
Efficacy of Seismic Courtship Signal Transmission in the Jumping Spider Habronattus
Dossenus (Araneae: Salticidae).” The Journal of Experimental Biology 207: 4105–10.
https://doi.org/10.1242/jeb.01261.
Endler, John. 1980. “Natural Selection on Color Patterns in Poecilia Reticulata.” Evolution 34 (1):
76–91. https://doi.org/10.2307/2408316.
140
Endler, John A. 1992. “Signals, Signal Conditions, and the Direction of Evolution.” The American
Naturalist 139: S125. https://doi.org/10.1086/285308.
———. 1993a. “Some General Comments on the Evolution and Design of Animal
Communication Systems.” Philosophical Transactions of the Royal Society of London. Series
B, Biological Sciences 340 (1292): 215–25. https://doi.org/10.1098/rstb.1993.0060.
———. 1993b. “The Color of Light in Forests and Its Implications.” Ecological Monographs 63
(1): 1–27. https://doi.org/10.2307/2937121.
Endler, John A., Alexandra L Basolo, M Andersson, and Y Iwasa. 1998. “Sensory Ecology,
Receiver Biases, and Sexual Selection.” Trends in Ecology and Evolution 13 (10): 415–20.
https://doi.org/https://doi.org/10.1016/S0169-5347(98)01471-2.
Endler, John A., P. W. Mielke, and Laura A. Kelley. 2012. “Illusions Promote Mating Success in
Great Bowerbirds.” Science 337 (January): 292–292.
https://doi.org/10.1126/science.1221690.
Endler, John A, David a Westcott, Joah R Madden, and Tim Robson. 2005. “Animal Visual
Systems and the Evolution of Color Patterns: Sensory Processing Illuminates Signal
Evolution.” Evolution; International Journal of Organic Evolution 59 (8): 1795–1818.
https://doi.org/10.1554/04-669.1.
Essen, D C Van, C H Anderson, and D J Felleman. 1992. “Information Processing in the Primate
Visual System: An Integrated Systems Perspective.” Science.
https://doi.org/10.1126/science.1734518.
Essen, D C Van, B Olshausen, C H Anderson, and J L Gallant. 1991. “Pattern Recognition,
Attention, and Information Bottlenecks in the Primate Visual System.” Visual Information
Processing: From Neurons to Chips 1473: 17–28. https://doi.org/10.1117/12.45537.
Farina, Almo. 2014. “Soundscape Ecology.” Soundscape Ecology. https://doi.org/10.1007/978-
94-007-7374-5.
Fleishman, L J, and A C Pallus. 2010. “Motion Perception and Visual Signal Design in Anolis
Lizards.” Proceedings of the Royal Society B: Biological Sciences 277 (1700): 3547–54.
https://doi.org/10.1098/rspb.2010.0742.
Fleishman, Leo J. 1988. “Sensory Influences on Physical Design of a Visual Display.” Animal
Behaviour 36 (5): 1420–24. https://doi.org/10.1016/S0003-3472(88)80212-4.
———. 1992. “The Influence of the Sensory System and the Environment on Motion Patterns in
the Visual Displays of Anoline Lizards and Other Vertebrates.” The American Naturalist 139
(s1): S36. https://doi.org/10.1086/285304.
Fleishman, Leo J., Brianna Ogas, David Steinberg, and Manuel Leal. 2015. “Why Do Anolis
Dewlaps Glow? An Analysis of a Translucent Visual Signal.” Functional Ecology 30 (3):
345–55. https://doi.org/10.1111/1365-2435.12502.

141
Foelix, Rainer F. 2011. Biology of Spiders. Insect Systematics & Evolution. Vol. 14. OUP USA.
https://doi.org/10.1163/187631283X00371.
Forrest, T. G. 1991. “Power Output and Efficiency of Sound Production by Crickets.” Behavioral
Ecology 2 (4): 327–38. https://doi.org/10.1093/beheco/2.4.327.
Frommolt, Karl-Heinz, and Alban Gebler. 2004. “Directionality of Dog Vocalizations.” The
Journal of the Acoustical Society of America 116 (1): 561–65.
https://doi.org/10.1121/1.1758971.
Garcia, Maxime, Isabelle Charrier, and Andrew N. Iwaniuk. 2012. “Directionality of the
Drumming Display of the Ruffed Grouse.” The Condor 114 (3): 500–506.
https://doi.org/10.1525/cond.2012.110158.
Gartner, Gabriel E.A., Tony Gamble, Alexander L. Jaffe, Alexis Harrison, and Jonathan B. Losos.
2013. “Left-Right Dewlap Asymmetry and Phylogeography of Anolis Lineatus on Aruba and
Curaçao.” Biological Journal of the Linnean Society 110 (2): 409–26.
https://doi.org/10.1111/bij.12131.
Gelman, Andrew. 2008. “Scaling Regression Inputs by Dividing by Two Standard Deviations.”
Statistics in Medicine 27 (15): 2865–73. https://doi.org/10.1002/sim.3107.
Gelman, Andrew, and Jennifer Hill. 2007. Data Analysis Using Regression and
Multilevel/Hierarchical Models. New York, NY: Cambridge University Press.
Gerhardt, H C. 2017. “Signal Design Rules in Animal Communication.”
Gerhardt, H Carl. 1975. “Sound Pressure Levels and Radiation Patterns of the Vocalizations of
Some North American Frogs and Toads.” Journal of Comparative Physiology 102 (1): 1–12.
Girard, Madeline B., Damian O. Elias, and Michael M. Kasumovic. 2015. “Female Preference for
Multi-Modal Courtship: Multiple Signals Are Important for Male Mating Success in Peacock
Spiders.” Proceedings of the Royal Society B: Biological Sciences 282 (1820): 12–14.
https://doi.org/10.1098/rspb.2015.2222.
Girard, Madeline B, Michael M Kasumovic, and Damian O Elias. 2011. “Multi-Modal Courtship
in the Peacock Spider, Maratus Volans (O.P.-Cambridge, 1874).” PloS One 6 (9): e25390.
https://doi.org/10.1371/journal.pone.0025390.
Girling, Robbie D., Bradley S. Higbee, and Ring T. Cardé. 2013. “The Plume Also Rises:
Trajectories of Pheromone Plumes Issuing from Point Sources in an Orchard Canopy at
Night.” Journal of Chemical Ecology 39: 1150–60. https://doi.org/10.1007/s10886-013-
0341-9.
Gordon, Shira D., and George W. Uetz. 2011. “Multimodal Communication of Wolf Spiders on
Different Substrates: Evidence for Behavioural Plasticity.” Animal Behaviour 81 (2): 367–
75. https://doi.org/10.1016/j.anbehav.2010.11.003.

142
Grafe, T. Ulmar, and Thomas C. Wanger. 2007. “Multimodal Signaling in Male and Female Foot-
Flagging Frogs Staurois Guttatus (Ranidae): An Alerting Function of Calling.” Ethology 113
(8): 772–81. https://doi.org/10.1111/j.1439-0310.2007.01378.x.
Graham, Elizabeth E., Therese M. Poland, Deborah G. McCullough, and Jocelyn G. Millar. 2012.
“A Comparison of Trap Type and Height for Capturing Cerambycid Beetles (Coleoptera).”
Journal of Economic Entomology 105 (Rabaglia 2008): 837–46.
https://doi.org/10.1603/EC12053.
Greenfield, Patricia M. 1972. “Playing Peekaboo with a Four-Month-Old: A Study of the Role of
Speech and Nonspeech Sounds in the Formation of a Visual Schema.” The Journal of
Psychology 82 (2): 287–98. https://doi.org/10.1080/00223980.1972.9923819.
Griswold, Charles E. 1987. A Revision of the Jumping Spider Genus Habronattus FOP-Cambridge
(Araneae, Salticidae), with Phenetic and Cladistic Analyses. Vol. 107. Univ of California
Press.
Grueber, C. E., S. Nakagawa, R. J. Laws, and I. G. Jamieson. 2011. “Multimodel Inference in
Ecology and Evolution: Challenges and Solutions.” Journal of Evolutionary Biology 24 (4):
699–711. https://doi.org/10.1111/j.1420-9101.2010.02210.x.
Gruson, Hugo, Christine Andraud, Willy Daney De Marcillac, Serge Berthier, Marianne Elias, and
Doris Gomez. 2019. “Quantitative Characterization of Iridescent Colours in Biological
Studies: A Novel Method Using Optical Theory.” Interface Focus 9 (1).
https://doi.org/10.1098/rsfs.2018.0049.
Guilford, Tim, and Marian Stamp Dawkins. 1991. “Receiver Psychology and the Evolution of
Animal Signals.” Animal Behaviour 42 (1): 1–14. https://doi.org/10.1016/S0003-
3472(05)80600-1.
Hamilton, William J. 1965. “Sun-Oriented Display of the Anna’s Hummingbird.” Wilson
Ornithological Society 77 (1): 38–44.
Harland, Duane P., Daiqin Li, and Robert R. Jackson. 2011. “How Jumping Spiders See The
World.” In How Animals See the World: Comparative Behavior, Biology, and Evolution of
Vision, 1:1–36. https://doi.org/10.1017/CBO9781107415324.004.
Hebets, Eileen A., and Daniel R. Papaj. 2005. “Complex Signal Function: Developing a
Framework of Testable Hypotheses.” Behavioral Ecology and Sociobiology 57: 197–214.
https://doi.org/10.1007/s00265-004-0865-7.
Hedrick, Tyson L. 2008. “Software Techniques for Two- and Three-Dimensional Kinematic
Measurements of Biological and Biomimetic Systems.” Bioinspiration & Biomimetics 3 (3):
034001. https://doi.org/10.1088/1748-3182/3/3/034001.
Henwood, Kenneth, and Allan Fabrick. 1979. “A Quantitative Analysis of the Dawn Chorus :
Temporal Selection for Communicatory Optimization.” The American Naturalist 114 (2):
260–74. https://doi.org/https://www.jstor.org/stable/2460222.

143
Herberstein, Marie E. 2012. Spider Behaviour: Flexibility and Versatility. Cambridge University
Press. https://doi.org/http://dx.doi.org/10.1016/j.anbehav.2012.04.004.
Hill, David Edwin. 2009. “Euophryine Jumping Spiders That Extend Their Third Legs during
Courtship ( Araneae : Salticidae : Euophryinae : Maratus , Saitis ).” Peckhamia 74 (1): 1–27.
Hogan, Benedict G., and Mary Caswell Stoddard. 2018. “Synchronization of Speed, Sound and
Iridescent Color in a Hummingbird Aerial Courtship Dive.” Nature Communications 9 (1):
5260. https://doi.org/10.1038/s41467-018-07562-7.
Holt, Marla M., Brandon L. Southall, Stephen J. Insley, and Ronald J. Schusterman. 2010. “Call
Directionality and Its Behavioural Significance in Male Northern Elephant Seals, Mirounga
Angustirostris.” Animal Behaviour 80: 351–61.
https://doi.org/10.1016/j.anbehav.2010.06.013.
How, Martin J., Jan M. Hemmi, Jochen Zeil, and Richard Peters. 2008. “Claw Waving Display
Changes with Receiver Distance in Fiddler Crabs, Uca Perplexa.” Animal Behaviour 75
(Crane 1975): 1015–22. https://doi.org/10.1016/j.anbehav.2007.09.004.
Hunter, Malcolm L, Alejandro Kacelnik, John Roberts, and Maxime Vuillermoz. 1986.
“Directionality of Avian Vocalizations : A Laboratory Study.” The Condor 88 (3): 371–75.
Hutton, Pierce, Russell A. Ligon, Kevin J. McGraw, Brett M Seymoure, and Richard K. Simpson.
2015. “Dynamic Color Communication.” Current Opinions in Behavior.
https://doi.org/10.1016/j.cobeha.2015.08.007.
Jackson, R. R., S. D. Pollard, J. C. Choe, and B. J. Crespi. 1997. “Jumping Spider Mating
Strategies: Sex among Cannibals in and out of Webs.” In The Evolution of Mating Systems in
Insects and Arachnids, 340–51. Cambridge University Press.
Jackson, RR. 1987. “Comparative Study of Releaser Pheromones Associated with the Silk of
Jumping Spiders (Araneae, Salticidae).” New Zealand Journal of Zoology 14 (1): 1–10.
https://doi.org/10.1080/03014223.1987.10422676.
Jaffar-Bandjee, Mourad, Gijs Krijnen, and Jérôme Casas. 2020. “Symposium Article: Challenges
in Modeling Pheromone Capture by Pectinate Antennae.” Integrative and Comparative
Biology. https://doi.org/10.1093/icb/icaa057.
Jammalamadaka, S Rao, and Ashis Sengupta. 2001. Topics in Circular Statistics. Vol. 5. World
Scientific.
Johnsen, Sönke. 2002. “Cryptic and Conspicuous Coloration in the Pelagic Environment.”
Proceedings. Biological Sciences / The Royal Society 269 (September 2001): 243–56.
https://doi.org/10.1098/rspb.2001.1855.
———. 2012. Optics of Life. Princeton University Press.
K, Bartón. 2013. “MuMIn: Multi-Modal Inference. Model Selection and Model Averaging Based

144
on Information Criteria (AICc and Alike).” Http://Cran.r-
Project.Org/Web/Packages/MuMIn/Index.Html.
Kamilar, J. M., and B. J. Bradley. 2011. “Countershading Is Related to Positional Behavior in
Primates.” Journal of Zoology 283 (4): 227–33. https://doi.org/10.1111/j.1469-
7998.2010.00765.x.
Kang, Chang ku, Jong yeol Moon, Sang im Lee, and Piotr G. Jablonski. 2013. “Cryptically
Patterned Moths Perceive Bark Structure When Choosing Body Orientations That Match
Wing Color Pattern to the Bark Pattern.” PLoS ONE 8 (10): 1–9.
https://doi.org/10.1371/journal.pone.0078117.
Kang, Changku, Martin Stevens, Jong Yeol Moon, Sang Im Lee, and Piotr G. Jablonski. 2015.
“Camouflage through Behavior in Moths: The Role of Background Matching and Disruptive
Coloration.” Behavioral Ecology 26 (1): 45–54. https://doi.org/10.1093/beheco/aru150.
Kastner, Sabine, and Leslie G Ungerleider. 2000. “Mechanisms of Visual Attention in the Human
Cortex.” Annual Review of Neuroscience 23: 315–41.
https://doi.org/https://doi.org/10.1146/annurev.neuro.23.1.315.
Kelley, Laura A., and John A. Endler. 2012. “Male Great Bowerbirds Create Forced Perspective
Illusions with Consistently Different Individual Quality.” Proceedings of the National
Academy of Sciences of the United States of America 109: 20980–85.
https://doi.org/10.1073/pnas.1208350109.
Kelley, Laura A., and Jennifer L. Kelley. 2014. “Animal Visual Illusion and Confusion: The
Importance of a Perceptual Perspective.” Behavioral Ecology 25: 450–63.
https://doi.org/10.1093/beheco/art118.
Kemp, Darrell J. 2008. “Female Mating Biases for Bright Ultraviolet Iridescence in the Butterfly
Eurema Hecabe (Pieridae).” Behavioral Ecology 19 (1): 1–8.
https://doi.org/10.1093/beheco/arm094.
Kemp, Darrell J., and Ronald L. Rutowski. 2007. “Condition Dependence, Quantitative Genetics,
and the Potential Signal Content of Iridescent Ultraviolet Butterfly Coloration.” Evolution 61
(1): 168–83. https://doi.org/10.1111/j.1558-5646.2007.00014.x.
Klomp, Danielle A., Devi Stuart-Fox, Indraneil Das, and Terry J. Ord. 2017. “Gliding Lizards Use
the Position of the Sun to Enhance Social Display.” Biology Letters 13 (2): 9–12.
https://doi.org/10.6084/m9.figshare.c.3671992.
Knudsen, Eric I., Gary G. Blasdel, and Masakazu Konishi. 1979. “Sound Localization by the Barn
Owl (Tyto Alba) Measured with the Search Coil Technique.” Journal of Comparative
Physiology □ A 133 (1): 1–11. https://doi.org/10.1007/BF00663105.
Kolm, Niclas, Mirjam Amcoff, Richard P. Mann, and Göran Arnqvist. 2012. “Diversification of a
Food-Mimicking Male Ornament via Sensory Drive.” Current Biology 22 (15): 1440–43.
https://doi.org/10.1016/j.cub.2012.05.050.

145
Kühne, R, and B Lewis. 1985. “External and Middle Ears.” In Form and Function in Birds.
Academic Press: London.
Lammers, Marc O., and W W L Au. 2003. “Directionality in the Whistles of Hawaiian Spinner
Dolphins (Stenella Longirostris): A Signal Feature To Cue Direction of Movement?” Marine
Mammal Science 19 (April): 249–64. https://doi.org/10.1111/j.1748-7692.2003.tb01107.x.
Land, M. F. 1999. “Motion and Vision: Why Animals Move Their Eyes.” Journal of Comparative
Physiology - A Sensory, Neural, and Behavioral Physiology 185 (4): 341–52.
https://doi.org/10.1007/s003590050393.
Land, M F. 1969a. “Structure of the Retinae of the Principal Eyes of Jumping Spiders (Salticidae:
Dendryphantinae) in Relation to Visual Optics.” The Journal of Experimental Biology 51 (2):
443–70.
———. 1969b. “Movements of the Retinae of Jumping Spiders (Salticidae: Dendryphantinae) in
Response to Visual Stimuli.” The Journal of Experimental Biology 51 (2): 471–93.
http://www.ncbi.nlm.nih.gov/pubmed/5351426.
———. 1985. “Fields of View of the Eyes of Primitive Jumping Spiders.” Journal of Experimental
Biology 119: 381–84.
Land, Michael F, and Dan-Eric Nilsson. 2012. Animal Eyes. Oxford University Press.
Lardner, Björn, and Maklarin Bin Lakim. 2002. “Tree-Hole Frogs Exploit Resonance Effects.”
Nature 420 (6915): 475. https://doi.org/10.1038/420475a.
Leduc-Robert, Geneviève, and Wayne P. Maddison. 2018. “Phylogeny with Introgression in
Habronattus Jumping Spiders (Araneae: Salticidae).” BMC Evolutionary Biology 18 (1): 1–
23. https://doi.org/10.1186/s12862-018-1137-x.
Lengagne, Thierry, Thierry Aubin, Pierre Jouventin, and Jacques Lauga. 1999. “Acoustic
Communication in a King Penguin Colony: Importance of Bird Location within the Colony
and of the Body Position of the Listener.” Polar Biology 21: 262–68.
https://doi.org/10.1007/s003000050361.
Li, Weiming, and Tyler Buchinger. 2014. “Pheromone Signaling: A Pissing Contest in Tilapia.”
Current Biology 24 (18): R843–45. https://doi.org/10.1016/j.cub.2014.08.001.
Lind, Olle, Miriam J. Henze, Almut Kelber, and Daniel Osorio. 2017. “Coevolution of Coloration
and Colour Vision?” Philosophical Transactions of the Royal Society B: Biological Sciences
372 (1724): 1–8. https://doi.org/10.1098/rstb.2016.0338.
Linsenmair, K. Eduard. 1967. “Konstruktion Und Signalfunktion Der Sandpyramide Der
Reiterkrabbe Ocypode Saratan Forsk. (Decapoda Brachyura Ocypodidae))).” Zeitschrift Für
Tierpsychologie 24 (4): 403–56. https://doi.org/10.1111/j.1439-0310.1967.tb01238.x.
Long, Kevin D., and Gunilla Rosenqvist. 1998. “Changes in Male Guppy Courting Distance in

146
Response to a Fluctuating Light Environment.” Behavioral Ecology and Sociobiology 44 (2):
77–83. https://doi.org/10.1007/s002650050518.
Losos, Danielle N., Jackson B. R. Weaver, Thomas W. Fies, Anthony Herrel, Anne-Claire Fabre,
and Jonathan B. Losos. 2017. “The Curious Case of the Left-Sided Dewlap: Directional
Asymmetry In the Curaçao Anole, Anolis Lineatus.” Breviora 553 (1): 1–7.
https://doi.org/10.3099/mcz35.1.
Maddison, Wayne P., and Marshal C Hedin. 2003. “Phylogeny of Habronattus Jumping Spiders (
Araneae : Salticidae ), with Consideration of Genital and Courtship Evolution.” Systematic
Entomology 28: 1–21.
Makowicz, Amber M., Jessie C. Tanner, Eric Dumas, Cameron D. Siler, and Ingo Schlupp. 2015.
“Pre-Existing Biases for Swords in Mollies ( Poecilia ).” Behavioral Ecology 27 (AUGUST):
arv130. https://doi.org/10.1093/beheco/arv130.
Maldonado, Héctor. 1970. “The Deimatic Reaction in the Praying Mantis Stagmatoptera
Biocellata.” Zeitschrift Für Vergleichende Physiologie 68 (1): 60–71.
Marshall, A H, and J Meyer. 1985. “The Directivity and Auditory Impressions of Singers.” Acta
Acustica United with Acustica 58 (3): 130–40.
Marshall, N J. 2000. “Communication and Camouflage with the Same ‘bright’ Colours in Reef
Fishes.” Philosophical Transactions of the Royal Society B: Biological Sciences 355 (1401):
1243–48. https://doi.org/10.1098/rstb.2000.0676.
Masta, Susan E, and Wayne P Maddison. 2011. “Sexual Selection Driving Diversification in
Jumping Spiders.” Proceedings of the National Academy of Sciences of the United States of
America 99 (7): 4442–47. https://doi.org/10.1073/pnas.072493099.
Mathevon, N., T. Aubin, and T. Dabelsteen. 1996. “Song Degradation during Propagation:
Importance of Song Post for the Wren Troglodytes Troglodytes.” Ethology 102: 397–412.
https://doi.org/10.1111/j.1439-0310.1996.tb01135.x.
Mcgregor, Peter K, Andrew G Horn, Marty L Leonard, and Frank Thomsen. 2013. Animal
Communication and Noise. Animal Signals and Communication 2. Vol. 2.
https://doi.org/10.1007/978-3-642-41494-7.
McLean, Donald James, and Marta A. Skowron Volponi. 2018. “Trajr: An R Package for
Characterisation of Animal Trajectories.” Ethology 124 (6): 440–48.
https://doi.org/10.1111/eth.12739.
McLennan, Deborah A. 2003. “The Importance of Olfactory Signals in the Gasterosteid Mating
System: Sticklebacks Go Multimodal.” Biological Journal of the Linnean Society 80 (4):
555–72. https://doi.org/10.1111/j.1095-8312.2003.00254.x.
McNett, Gabriel D., Lucia H. Luan, and Reginald B. Cocroft. 2010. “Wind-Induced Noise Alters
Signaler and Receiver Behavior in Vibrational Communication.” Behavioral Ecology and
147
Sociobiology 64 (12): 2043–51. https://doi.org/10.1007/s00265-010-1018-9.
Meadows, Melissa G., Nathan I. Morehouse, Ronald L. Rutowski, Jonathan M. Douglas, and
Kevin J. McGraw. 2011. “Quantifying Iridescent Coloration in Animals: A Method for
Improving Repeatability.” Behavioral Ecology and Sociobiology 65 (6): 1317–27.
https://doi.org/10.1007/s00265-010-1135-5.
Meadows, Melissa G, Michael W Butler, Nathan I Morehouse, Lisa A Taylor, Matthew B Toomey,
Kevin J McGraw, and Ronald L Rutowski. 2009. “Iridescence: Views from Many Angles.”
Journal of the Royal Society, Interface / the Royal Society 6 Suppl 2 (Suppl_2): S107-13.
https://doi.org/10.1098/rsif.2009.0013.focus.
Michael, Deirdre D, Gerald M Siegel, and Herbert L Pick Jr. 1995. “Effects of Distance on Vocal
Intensity.” Journal of Speech, Language, and Hearing Research 38 (5): 1176–83.
Milinski, Manfred. 1990. “Information Overload and Food Selection.” In Behavioural
Mechanisms of Food Selection, NATO ASI S, 721–37. Berlin, Heidelberg: Springer.
https://doi.org/10.1007/978-3-642-75118-9_35.
Miller, Ginger L., Catherine Loudon, and Sarah Freed. 2007. “Position around a Tree:
Consequences for Pheromone Detection.” Journal of Chemical Ecology 33 (3): 541–54.
https://doi.org/10.1007/s10886-006-9243-4.
Moore, Paul, and John Crimaldi. 2004. “Odor Landscapes and Animal Behavior: Tracking Odor
Plumes in Different Physical Worlds.” Journal of Marine Systems 49: 55–64.
https://doi.org/10.1016/j.jmarsys.2003.05.005.
Muller-Schwarze, Dietland. 2006. Chemical Ecology of Vertebrates. Cambridge University Press.
Murlis, John, Mark A Willis, and Ring T Cardé. 2000. “Spatial and Temporal Structures of
Pheromone Plumes in Fields and Forests.” Physiological Entomology 25 (3): 211–22.
https://doi.org/10.1046/j.1365-3032.2000.00176.x.
Naguib, Marc, and R. Haven Wiley. 2001. “Estimating the Distance to a Source of Sound:
Mechanisms and Adaptations for Long-Range Communication.” Animal Behaviour 62 (1):
825–37. https://doi.org/10.1006/anbe.2001.1860.
Nakagawa, Shinichi, and Robert P. Freckleton. 2011. “Model Averaging, Missing Data and
Multiple Imputation: A Case Study for Behavioural Ecology.” Behavioral Ecology and
Sociobiology 65 (1): 103–16. https://doi.org/10.1007/s00265-010-1044-7.
Nath, Tanmay, Alexander Mathis, An Chi Chen, Amir Patel, Matthias Bethge, and Mackenzie
Weygandt Mathis. 2019. “Using DeepLabCut for 3D Markerless Pose Estimation across
Species and Behaviors.” Nature Protocols 14 (7): 2152–76.
Nelson, Ximena J., and Natasha Fijn. 2013. “The Use of Visual Media as a Tool for Investigating
Animal Behaviour.” Animal Behaviour 85 (3): 525–36.
https://doi.org/10.1016/j.anbehav.2012.12.009.

148
Nemeth, Erwin, and Henrik Brumm. 2009. “Blackbirds Sing Higher-Pitched Songs in Cities:
Adaptation to Habitat Acoustics or Side-Effect of Urbanization?” Animal Behaviour 78 (3):
637–41. https://doi.org/10.1016/j.anbehav.2009.06.016.
Ninnes, Calum E., Marius Adrion, Pim Edelaar, José L. Tella, and Staffan Andersson. 2015. “A
Receiver Bias for Red Predates the Convergent Evolution of Red Color in Widowbirds and
Bishops.” Behavioral Ecology 26: 1212–18. https://doi.org/10.1093/beheco/arv068.
Olea, PedroP. P., Fabián Casas, Steve Redpath, and Javier Viñuela. 2010. “Bottoms up: Great
Bustards Use the Sun to Maximise Signal Efficacy.” Behavioral Ecology and Sociobiology
64 (6): 927–37. https://doi.org/10.1007/s00265-010-0908-1.
Ord, Terry J., Judy A. Stamps, and Jonathan B. Losos. 2010. “Adaptation and Plasticity of Animal
Communication in Fluctuating Environments.” Evolution 64 (11): 3134–48.
https://doi.org/10.1111/j.1558-5646.2010.01056.x.
Ord, Terry J, Grace K Charles, and Rebecca K Hofer. 2010. “The Evolution of Alternative
Adaptive Strategies for Effective Communication in Noisy Environments.” The American
Naturalist 177 (1): 54–64. https://doi.org/10.1086/657439.
Ord, Terry J, Grace K Charles, Meredith Palmer, and Judy A Stamps. 2016. “Plasticity in Social
Communication and Its Implications for the Colonization of Novel Habitats.” Behavioral
Ecology 27 (1): 341–51. https://doi.org/10.1093/beheco/arv165.
Ord, Terry J, Richard A. Peters, Barbara Clucas, and Judy A. Stamps. 2007. “Lizards Speed up
Visual Displays in Noisy Motion Habitats.” Proceedings of the Royal Society B: Biological
Sciences 274 (January): 1057–62. https://doi.org/10.1098/rspb.2006.0263.
Ord, Terry J, and Judy A Stamps. 2008. “Alert Signals Enhance Animal Communication in ‘Noisy’
Environments.” Proceedings of the National Academy of Sciences 105: 18830–35.
https://doi.org/10.1073/pnas.0807657105.
Oren, Michael, and Shree K. Nayar. 1995. “Generalization of the Lambertian Model and
Implications for Machine Vision.” International Journal of Computer Vision 14 (3): 227–51.
https://doi.org/10.1007/BF01679684.
Osorio, D, and A. D. Ham. 2002. “Spectral Reflectance and Directional Properties of Structural
Coloration in Bird Plumage.” The Journal of Experimental Biology 205 (Pt 14): 2017–27.
Otto, Jürgen C, and David E Hill. 2016. “Males of a New Species of Jotus from Australia Wave a
Paddle-Shaped Lure to Solicit Nearby Females (Araneae: Salticidae: Euophryini).”
Peckhamia 122.1 (January): 1–39.
Ottway, Deborah S., Sheila J. Pankhurst, and John S. Waterhouse. 2005. “A Possible Function for
Female Enurination in the Mara, Dolichotis Patagonum.” Chemical Signals in Vertebrates
10: 101–9. https://doi.org/10.1007/0-387-25160-X.
Parris, Kirsten M, Meah Velik-lord, and Joanne M a North. 2009. “Frogs Call at a Higherpitch in

149
Traffic Noise.” Ecology and Society 14 (1): 25. https://doi.org/3.
Partan, Sarah R. 2013. “Ten Unanswered Questions in Multimodal Communication.” Behavioral
Ecology and Sociobiology 67: 1523–39. https://doi.org/10.1007/s00265-013-1565-y.
Patricelli, Gail L., Seth W. Coleman, and Gerald Borgia. 2006. “Male Satin Bowerbirds,
Ptilonorhynchus Violaceus, Adjust Their Display Intensity in Response to Female Startling:
An Experiment with Robotic Females.” Animal Behaviour 71 (1): 49–59.
https://doi.org/10.1016/j.anbehav.2005.03.029.
Patricelli, Gail L., Marc S. Dantzker, and Jack W. Bradbury. 2007. “Differences in Acoustic
Directionality among Vocalizations of the Male Red-Winged Blackbird (Agelaius
Pheoniceus) Are Related to Function in Communication.” Behavioral Ecology and
Sociobiology 61 (7): 1099–1110. https://doi.org/10.1007/s00265-006-0343-5.
———. 2008. “Acoustic Directionality of Red-Winged Blackbird (Agelaius Phoeniceus) Song
Relates to Amplitude and Singing Behaviours.” Animal Behaviour 76 (4): 1389–1401.
https://doi.org/10.1016/j.anbehav.2008.07.005.
Patricelli, Gail L., and Alan H. Krakauer. 2010. “Tactical Allocation of Effort among Multiple
Signals in Sage Grouse: An Experiment with a Robotic Female.” Behavioral Ecology 21 (1):
97–106. https://doi.org/10.1093/beheco/arp155.
Patricelli, Gail L, J Albert C Uy, Gregory Walsh, and Gerald Borgia. 2002. “Male Displays
Adjusted to Female’s Response.” Nature 415 (January): 279–80.
https://doi.org/10.1038/415279a.
Peckmezian, Tina, and Phillip W Taylor. 2015. “A Virtual Reality Paradigm for the Study of
Visually Mediated Behaviour and Cognition in Spiders.” Animal Behaviour 107: 87–95.
https://doi.org/10.1016/j.anbehav.2015.06.018.
Pegram, Kimberly V., Hanh A. Han, and Ronald L. Rutowski. 2015. “Warning Signal Efficacy:
Assessing the Effects of Color, Iridescence, and Time of Day in the Field.” Ethology 121 (9):
861–73. https://doi.org/10.1111/eth.12403.
Peters, R. A. 2010. “A Framework for Quantifying Properties of 3-Dimensional Movement-Based
Signals.” Current Zoology 56 (3): 327–36.
Peters, R. A., and C. S. Evans. 2003. “Design of the Jacky Dragon Visual Display: Signal and
Noise Characteristics in a Complex Moving Environment.” Journal of Comparative
Physiology A: Neuroethology, Sensory, Neural, and Behavioral Physiology 189 (6): 447–59.
https://doi.org/10.1007/s00359-003-0423-1.
Peters, Richard A. 2008. “Environmental Motion Delays the Detection of Movement-Based
Signals.” Biology Letters 4 (August 2007): 2–5. https://doi.org/10.1098/rsbl.2007.0422.
Peters, Richard A., Jan M. Hemmi, and Jochen Zeil. 2007. “Signaling against the Wind: Modifying
Motion-Signal Structure in Response to Increased Noise.” Current Biology 17: 1231–34.

150
https://doi.org/10.1016/j.cub.2007.06.035.
Peters, Richard A. 2013. “Noise in Visual Communication: Motion from Wind-Blown Plants.” In
Animal Communication and Noise, edited by Henrik Brumm, 311–30. Berlin, Heidelberg:
Springer Berlin Heidelberg. https://doi.org/10.1007/978-3-642-41494-7_11.
Peters, Richard, Jan Hemmi, and Jochen Zeil. 2008. “Image Motion Environments: Background
Noise for Movement-Based Animal Signals.” Journal of Comparative Physiology A 194 (5):
441–56. https://doi.org/10.1007/s00359-008-0317-3.
Picker, Mike D., Belle Leon, and Jason G.H. Londt. 1991. “The Hypertrophied Hindwings of
Palmipenna Aeoleoptera Picker, 1987 (Neuroptera: Nemopteridae) Reduce Attack by Robber
Flies by Increasing Apparent Body Size.” Animal Behaviour 42 (5): 821–25.
https://doi.org/10.1016/S0003-3472(05)80126-5.
Pijanowski, Bryan C., Luis J. Villanueva-Rivera, Sarah L. Dumyahn, Almo Farina, Bernie L.
Krause, Brian M. Napoletano, Stuart H. Gage, and Nadia Pieretti. 2011. “Soundscape
Ecology: The Science of Sound in the Landscape.” BioScience 61 (3): 203–16.
https://doi.org/10.1525/bio.2011.61.3.6.
Pokorny, Tamara, Ira Vogler, René Losch, Patrick Schlütting, Pedro Juarez, Nicolai Bissantz,
Santiago R. Ramírez, and Thomas Eltz. 2017. “Blown by the Wind: The Ecology of Male
Courtship Display Behavior in Orchid Bees.” Ecology 98 (4): 1140–52.
https://doi.org/10.1002/ecy.1755.
Populin, Luis C., and Tom C.T. Yin. 1998. “Pinna Movements of the Cat during Sound
Localization.” Journal of Neuroscience 18 (11): 4233–43.
https://doi.org/10.1523/jneurosci.18-11-04233.1998.
Rao, J S. 1976. “Some Tests Based on Arc-Lengths for the Circle.” The Indian Journal of
Statistics, Series B (1960-2002) 38 (4): 329–38. http://www.jstor.org/stable/25052032.
Richards, Douglas G. 1981a. “Alerting and Message Components in Songs of Rufous-Sided
Towhees.” Behaviour 76: 223–49. https://doi.org/10.1163/156853981x00095.
———. 1981b. “Estimation of Distance of Singing Conspecifics By The Carolina Wren.” The
Auk, no. January: 127–33.
Riffell, Jeffrey A., Leif Abrell, and John G. Hildebrand. 2008. “Physical Processes and Real-Time
Chemical Measurement of the Insect Olfactory Environment.” Journal of Chemical Ecology
34 (7): 837–53. https://doi.org/10.1007/s10886-008-9490-7.
Rivers, T. J., and J. G. Morin. 2008. “Complex Sexual Courtship Displays by Luminescent Male
Marine Ostracods.” Journal of Experimental Biology 211 (14): 2252–62.
https://doi.org/10.1242/jeb.011130.
Rivers, T J, and J G Morin. 2006. “Female Responses to Complex Luminescent Male Displays in
a Caribbean Ostracod.” In Luminescence, 21:289. WILEY-BLACKWELL COMMERCE

151
PLACE, 350 MAIN ST, MALDEN 02148, MA USA.
Rosenthal, Gil G. 2007. “Spatiotemporal Dimensions of Visual Signals in Animal
Communication.” Annual Review of Ecology, Evolution, and Systematics 38 (1): 155–78.
https://doi.org/10.1146/annurev.ecolsys.38.091206.095745.
Rosenthal, Gil G., Jessica N. Fitzsimmons, Kristina U. Woods, Gabriele Gerlach, and Heidi S.
Fisher. 2011. “Tactical Release of a Sexually-Selected Pheromone in a Swordtail Fish.” PLoS
ONE 6 (2): 3–7. https://doi.org/10.1371/journal.pone.0016994.
Rosenthal, Malcolm F., Eileen A. Hebets, Benji Kessler, Rowan McGinley, and Damian O. Elias.
2019. “The Effects of Microhabitat Specialization on Mating Communication in a Wolf
Spider.” Behavioral Ecology 30 (5): 1398–1405. https://doi.org/10.1093/beheco/arz091.
Rosowski, John J. 1994. “Outer and Middle Ears.” In Comparative Hearing: Mammals, 172–247.
Springer.
Rowland, Hannah M., Innes C. Cuthill, Ian F. Harvey, Michael P. Speed, and Graeme D. Ruxton.
2008. “Can’t Tell the Caterpillars from the Trees: Countershading Enhances Survival in a
Woodland.” Proceedings of the Royal Society B: Biological Sciences 275 (1651): 2539–45.
https://doi.org/10.1098/rspb.2008.0812.
Russell, Gerald S., and Daniel J. Levitin. 1995. “An Expanded Table of Probability Values for
Rao’s Spacing Test.” Communications in Statistics - Simulation and Computation 24 (4):
879–88. https://doi.org/10.1080/03610919508813281.
Rutowski, Ronald L., Joseph M. Macedonia, Justin W. Merry, Nathan I. Morehouse, Kasey
Yturralde, Laura Taylor-Taft, Diann Gaalema, Darrell J. Kemp, and Randi S. Papke. 2007a.
“Iridescent Ultraviolet Signal in the Orange Sulphur Butterfly (Colias Eurytheme): Spatial,
Temporal and Spectral Properties.” Biological Journal of the Linnean Society 90 (2): 349–
64. https://doi.org/10.1111/j.1095-8312.2007.00749.x.
Rutowski, Ronald L., Alexandra C. Nahm, and Joseph M. Macedonia. 2010. “Iridescent Hindwing
Patches in the Pipevine Swallowtail: Differences in Dorsal and Ventral Surfaces Relate to
Signal Function and Context.” Functional Ecology 24 (4): 767–75.
https://doi.org/10.1111/j.1365-2435.2010.01693.x.
Rutowski, Ronald L, Joseph M Macedonia, Justin W Merry, Nathan I Morehouse, Kasey
Yturralde, Laura Taylor-Taft, Diann Gaalema, Darrell J Kemp, and Randi S Papke. 2007b.
“Iridescent Ultraviolet Signal in the Orange Sulphur Butterfly (Colias Eurytheme): Spatial,
Temporal and Spectral Properties.” Biological Journal of the Linnean Society 90 (2): 349–
64. https://doi.org/10.1111/j.1095-8312.2007.00749.x.
Ruxton, Graeme D., Michael P. Speed, and David J. Kelly. 2004. “What, If Anything, Is the
Adaptive Function of Countershading?” Animal Behaviour 68 (3): 445–51.
https://doi.org/10.1016/j.anbehav.2003.12.009.
Ryan, Michael J., and Molly E. Cummings. 2013. “Perceptual Biases and Mate Choice.” Annual

152
Review of Ecology, Evolution, and Systematics 44 (1): 437–59.
https://doi.org/10.1146/annurev-ecolsys-110512-135901.
Salva, Orsola, Lucia Regolin, Elena Mascalzoni, and Giorgio Vallortigara. 2012. “Cerebral and
Behavioural Asymmetries in Animal Social Recognition.” Comparative Cognition &
Behavior Reviews 7: 110–38. https://doi.org/10.3819/ccbr.2012.70006.
Santos, S. I. C. O., L. De Neve, J. T. Lumeij, and M. I. Förschler. 2007. “Strong Effects of Various
Incidence and Observation Angles on Spectrometric Assessment of Plumage Colouration in
Birds.” Behavioral Ecology and Sociobiology 61 (9): 1499–1506.
https://doi.org/10.1007/s00265-007-0373-7.
Schaedelin, Franziska C., and Michael Taborsky. 2009. “Extended Phenotypes as Signals.”
Biological Reviews 84 (2): 293–313. https://doi.org/10.1111/j.1469-185X.2008.00075.x.
Schindelin, Johannes, Ignacio Arganda-Carreras, Erwin Frise, Verena Kaynig, Mark Longair,
Tobias Pietzsch, Stephan Preibisch, et al. 2012. “Fiji: An Open Source Platform for Biological
Image Analysis.” Nature Methods 9 (7): 676–82. https://doi.org/10.1038/nmeth.2019.Fiji.
Schneider, Caroline A., Wayne S. Rasband, and Kevin W. Eliceiri. 2012. “NIH Image to ImageJ:
25 Years of Image Analysis.” Nature Methods 9 (7): 671–75.
https://doi.org/10.1038/nmeth.2089.
Scholes, Edwin. 2008a. “Courtship Ethology of Wahnes’ Parotia Parotia Wahnesi (Aves:
Paradisaeidae).” Journal of Ethology 26 (1): 79–91. https://doi.org/10.1007/s10164-006-
0032-x.
———. 2008b. “Evolution of the Courtship Phenotype in the Bird of Paradise Genus Parotia
(Aves: Paradisaeidae): Homology, Phylogeny, and Modularity.” Biological Journal of the
Linnean Society 94 (3): 491–504. https://doi.org/10.1111/j.1095-8312.2008.01012.x.
Seago, Ainsley E, Parrish Brady, Jean-Pol Vigneron, and Tom D Schultz. 2009. “Gold Bugs and
beyond: A Review of Iridescence and Structural Colour Mechanisms in Beetles
(Coleoptera).” Journal of the Royal Society, Interface / the Royal Society 6 Suppl 2 (October
2008): S165–84. https://doi.org/10.1098/rsif.2008.0354.focus.
Sih, Andrew, and Alison M. Bell. 2008. “Insights for Behavioral Ecology from Behavoural
Syndromes.” Advances in the Study of Behavior 3454 (08): 227–81.
https://doi.org/10.1016/S0065-3454(08)00005-3.Insights.
Sih, Andrew, Ann T. Chang, and Tina W. Wey. 2014. “Effects of Behavioural Type, Social Skill
and the Social Environment on Male Mating Success in Water Striders.” Animal Behaviour
94: 9–17. https://doi.org/10.1016/j.anbehav.2014.05.010.
Sih, Andrew, David L. Sinn, and Gail L. Patricelli. 2019. “On the Importance of Individual
Differences in Behavioural Skill.” Animal Behaviour 155: 307–17.
https://doi.org/10.1016/j.anbehav.2019.06.017.

153
Simpson, Richard K., and Kevin J. McGraw. 2018a. “It’s Not Just What You Have, but How You
Use It: Solar-Positional and Behavioral Effects on Hummingbird Color Appearance during
Courtship.” Ecology Letters In Review. https://doi.org/10.1111/ele.13125.
———. 2018b. “It’s Not Just What You Have, but How You Use It: Solar-Positional and
Behavioural Effects on Hummingbird Colour Appearance during Courtship.” Ecology Letters
21 (9): 1413–22. https://doi.org/10.1111/ele.13125.
———. 2018c. “Two Ways to Display: Male Hummingbirds Show Different Color-Display
Tactics Based on Sun Orientation.” Behavioral Ecology In Press (March): 1–12.
https://doi.org/10.1093/beheco/ary016.
———. 2019. “Experimental Trait Mismatches Uncover Specificity of Evolutionary Links
between Multiple Signaling Traits and Their Interactions in Hummingbirds.” Evolution 73
(3): 436–51. https://doi.org/10.1111/evo.13662.
Skigin, Diana C., Marina E. Inchaussandague, Christian D’Ambrosio, Ana Barreira, and Pablo
Tubaro. 2019. “How the Observed Color of the Swallow Tanager (Tersina Viridis) Changes
with Viewing Geometry.” Optik 182 (January): 639–46.
https://doi.org/10.1016/j.ijleo.2019.01.037.
Slabbekoorn, Hans, and Thomas B Smith. 2002. “Habitat-Dependent Song Divergence in the Little
Greenbul: An Analysis of Environmental Selection Pressures on Acoustic Signals.”
Evolution; International Journal of Organic Evolution 56 (9): 1849–58.
https://doi.org/10.1554/0014-3820(2002)056[1849:hdsdit]2.0.co;2.
Snowdon, Charles T., and Alexandra Hodun. 1981. “Acoustic Adaptation in Pygmy Marmoset
Contact Calls: Locational Cues Vary with Distances between Conspecifics.” Behavioral
Ecology and Sociobiology 9 (4): 295–300. https://doi.org/10.1007/BF00299886.
Staaden, M Van, and H Römer. 1997. “Sexual Signalling in Bladder Grasshoppers: Tactical
Design for Maximizing Calling Range.” The Journal of Experimental Biology 200 (Pt 20):
2597–2608.
Stavenga, Doekele G., Hein L. Leertouwer, N. Justin Marshall, and Daniel Osorio. 2011.
“Dramatic Colour Changes in a Bird of Paradise Caused by Uniquely Structured Breast
Feather Barbules.” Proceedings of the Royal Society B: Biological Sciences 278 (1715):
2098–2104. https://doi.org/10.1098/rspb.2010.2293.
Steinberg, David S., and Manuel Leal. 2013. “Sensory System Properties Predict Signal
Modulation in a Tropical Lizard.” Animal Behaviour 85 (3): 623–29.
https://doi.org/10.1016/j.anbehav.2012.12.025.
Stephens, M A. 1972. “Tests for the von Mises Distribution.” Journal of the American Statistical
Association 67 (338): 456–61. https://doi.org/10.1080/01621459.1972.10482410.
Stevens, Martin. 2007. “Predator Perception and the Interrelation between Different Forms of
Protective Coloration.” Proceedings. Biological Sciences / The Royal Society 274 (1617):

154
1457–64. https://doi.org/10.1098/rspb.2007.0220.
Stevens, Martin, C. Alejandro Parraga, Innes C. Cuthill, Julian C. Partridge, and Tom S.
Troscianko. 2007. “Using Digital Photography to Study Animal Coloration.” Biological
Journal of the Linnean Society 90 (2): 211–37. https://doi.org/10.1111/j.1095-
8312.2007.00725.x.
Stevens, Martin, and Graeme D. Ruxton. 2019. “The Key Role of Behaviour in Animal
Camouflage.” Biological Reviews 94 (1): 116–34. https://doi.org/10.1111/brv.12438.
Stowers, John R., Maximilian Hofbauer, Renaud Bastien, Johannes Griessner, Peter Higgins,
Sarfarazhussain Farooqui, Ruth M. Fischer, et al. 2017. “Virtual Reality for Freely Moving
Animals.” Nature Methods 14 (10): 995–1002. https://doi.org/10.1038/nmeth.4399.
Sullivan-Beckers, L, and E Hebets. 2014. “Tactical Adjustment of Signalling Leads to Increased
Mating Success and Survival.” Animal Behaviour 93: 111–17.
https://doi.org/10.1016/j.anbehav.2014.04.021.
Swan, David C., and James F. Hare. 2008. “The First Cut Is the Deepest: Primary Syllables of
Richardson’s Ground Squirrel, Spermophilus Richardsonii, Repeated Calls Alert Receivers.”
Animal Behaviour 76 (1): 47–54. https://doi.org/10.1016/j.anbehav.2007.11.008.
Számadó, Szabolcs. 2015. “Attention-Seeking Displays.” PLoS ONE 10 (8): 1–20.
https://doi.org/10.1371/journal.pone.0135379.
Számadó, Szabolcs, and Dustin J. Penn. 2015. “Why Does Costly Signalling Evolve? Challenges
with Testing the Handicap Hypothesis.” Animal Behaviour 110: e9–12.
https://doi.org/10.1016/j.anbehav.2015.06.005.
Taylor, Lisa a., David L. Clark, and Kevin J. McGraw. 2010. “Condition Dependence of Male
Display Coloration in a Jumping Spider (Habronattus Pyrrithrix).” Behavioral Ecology and
Sociobiology 65 (5): 1133–46. https://doi.org/10.1007/s00265-010-1127-5.
Taylor, Lisa A., and K. J. McGraw. 2013. “Male Ornamental Coloration Improves Courtship
Success in a Jumping Spider, but Only in the Sun.” Behavioral Ecology 24 (4): 955–67.
https://doi.org/10.1093/beheco/art011.
Taylor, Lisa A., Erin C. Powell, and Kevin J. McGraw. 2017. “Frequent Misdirected Courtship in
a Natural Community of Colorful Habronattus Jumping Spiders.” PLoS ONE 12 (4):
e0173156. https://doi.org/10.1371/journal.pone.0173156.
Team, R Core. 2013. “A Language and Environment for Statistical Computing.” R Foundation for
Statistical Computing, Vienna, Austria. http://www.r-project.org/.
Temple, S. E. 2011. “Why Different Regions of the Retina Have Different Spectral Sensitivities:
A Review of Mechanisms and Functional Significance of Intraretinal Variability in Spectral
Sensitivity in Vertebrates.” Visual Neuroscience 28 (August): 281–93.
https://doi.org/10.1017/S0952523811000113.

155
Templeton, Jennifer J., D. James Mountjoy, Sarah R. Pryke, and Simon C. Griffith. 2012. “In the
Eye of the Beholder: Visual Mate Choice Lateralization in a Polymorphic Songbird.” Biology
Letters 8 (6): 924–27. https://doi.org/10.1098/rsbl.2012.0830.
Terai, Yohey, Ole Seehausen, Takeshi Sasaki, Kazuhiko Takahashi, Shinji Mizoiri, Tohru
Sugawara, Tetsu Sato, et al. 2006. “Divergent Selection on Opsins Drives Incipient
Speciation in Lake Victoria Cichlids.” PLoS Biology 4 (12): 2244–51.
https://doi.org/10.1371/journal.pbio.0040433.
Tibbetts, Elizabeth A. 2002. “Visual Signals of Individual Identity in the Wasp Polistes Fuscatus.”
Proceedings of the Royal Society B: Biological Sciences 269 (1499): 1423–28.
https://doi.org/10.1098/rspb.2002.2031.
Tullberg, Birgitta S, Sami Merilaita, and Christer Wiklund. 2005. “Aposematism and Crypsis
Combined as a Result of Distance Dependence: Functional Versatility of the Colour Pattern
in the Swallowtail Butterfly Larva.” Proceedings. Biological Sciences / The Royal Society
272 (June): 1315–21. https://doi.org/10.1098/rspb.2005.3079.
Uetz, GeorgeW. W., DavidL. L. Clark, J.Andrew Andrew Roberts, and Meghan Rector. 2011.
“Effect of Visual Background Complexity and Light Level on the Detection of Visual Signals
of Male Schizocosa Ocreata Wolf Spiders by Female Conspecifics.” Behavioral Ecology and
Sociobiology 65 (4): 753–61. https://doi.org/10.1007/s00265-010-1079-9.
Umbers, Kate D.L., Jussi Lehtonen, and Johanna Mappes. 2015. “Deimatic Displays.” Current
Biology 25 (2): R58–59. https://doi.org/10.1016/j.cub.2014.11.011.
Uy, J. Albert C, and John A. Endler. 2004. “Modification of the Visual Background Increases the
Conspicuousness of Golden-Collared Manakin Displays.” Behavioral Ecology 15 (6): 1003–
10. https://doi.org/10.1093/beheco/arh106.
Vukusic, P, J R Sambles, C R Lawrence, and R J Wootton. 2002. “Limited-View Iridescence in
the Butterfly Ancyluris Meliboeus.” Proceedings of the Royal Society B: Biological Sciences
269 (1486): 7–14. https://doi.org/10.1098/rspb.2001.1836.
Ward, Sally, and Peter J.B. Slater. 2005. “Raised Thermoregulatory Costs at Exposed Song Posts
Increase the Energetic Cost of Singing for Willow Warblers Phylloscopus Trochilus.”
Journal of Avian Biology 36 (4): 280–86. https://doi.org/10.1111/j.0908-8857.2005.03379.x.
Webster, D.R., and M.J. Weissburg. 2009. “The Hydrodynamics of Chemical Cues Among
Aquatic Organisms.” Annual Review of Fluid Mechanics 41 (1): 73–90.
https://doi.org/10.1146/annurev.fluid.010908.165240.
Webster, Richard J., Alison Callahan, Jean Guy J. Godin, and Thomas N. Sherratt. 2009.
“Behaviourally Mediated Crypsis in Two Nocturnal Moths with Contrasting Appearance.”
Philosophical Transactions of the Royal Society B: Biological Sciences 364 (1516): 503–10.
https://doi.org/10.1098/rstb.2008.0215.
White, Thomas E., Jochen Zeil, and Darrell J. Kemp. 2015. “Signal Design and Courtship

156
Presentation Coincide for Highly Biased Delivery of an Iridescent Butterfly Mating Signal.”
Evolution 69 (1): 14–25. https://doi.org/10.1111/evo.12551.
Whitehead, James Mather. 1987. “Vocally Mediated Reciprocity between Neighbouring Groups
of Mantled Howling Monkeys, Alouatta Palliata Palliata.” Animal Behaviour 35 (6): 1615–
27.
Wiebe, Karen L., and Alexander M. Chang. 2018. “Seeing Sunlit Owls in a New Light: Orienting
Snowy Owls May Not Be Displaying.” Ibis 160 (1): 62–70. https://doi.org/10.1111/ibi.12533.
Wiley, R. H., and D. G. Richards. 1982. “Adaptations for Acoustic Communciations in Birds:
Sound Transmission and Signal Detection.” Acoustic Communication in Birds.
http://link.springer.com/article/10.1007/BF02837868.
Wiley, R. Haven. 2016. “How Noise Determines the Evolution of Communication.” Animal
Behaviour 124: 307–13. https://doi.org/10.1016/j.anbehav.2016.07.014.
Wiley, R. Haven, and Douglas G. Richards. 1978. “Physical Constraints on Acoustic
Communication in the Atmosphere: Implications for the Evolution of Animal Vocalization.”
Behavioral Ecology and Sociobiology 3 (6): 69–94.
https://doi.org/10.1080/00986445.2011.534011.
Williams, David T., N. Straw, M. Townsend, a. S. Wilkinson, and a. Mullins. 2013. “Monitoring
Oak Processionary Moth Thaumetopoea Processionea L. Using Pheromone Traps: The
Influence of Pheromone Lure Source, Trap Design and Height above the Ground on Capture
Rates.” Agricultural and Forest Entomology 15: 126–34. https://doi.org/10.1111/afe.12005.
Wilson, David R., and James F. Hare. 2006. “The Adaptive Utility of Richardson’s Ground
Squirrel (Spermophilus Richardsonii) Short-Range Ultrasonic Alarm Signals.” Canadian
Journal of Zoology 84: 1322–30. https://doi.org/10.1139/z06-120.
Witzgall, Peter, Lukasz Stelinski, Larry Gut, and Don Thomson. 2008. “Codling Moth
Management and Chemical Ecology.” Annual Review of Entomology 53: 503–22.
https://doi.org/10.1146/annurev.ento.53.103106.093323.
Woods, William A, Holly Hendrickson, Jennifer Mason, and Sara M Lewis. 2007. “Energy and
Predation Costs of Firefly Courtship Signals.” The American Naturalist 170 (5): 702–8.
https://doi.org/10.1086/521964.
Yorzinski, J. L., G. L. Patricelli, M. L. Platt, and M. F. Land. 2015. “Eye and Head Movements
Shape Gaze Shifts in Indian Peafowl.” Journal of Experimental Biology, no. February 2016:
3771–76. https://doi.org/10.1242/jeb.129544.
Yorzinski, Jessica L., and Gail L. Patricelli. 2010. “Birds Adjust Acoustic Directionality to Beam
Their Antipredator Calls to Predators and Conspecifics.” Proceedings of the Royal Society B:
Biological Sciences 277 (1683): 923–32. https://doi.org/10.1098/rspb.2009.1519.
Yorzinski, Jessica L, Gail L Patricelli, Jason S Babcock, John M Pearson, and Michael L Platt.

157
2013. “Through Their Eyes: Selective Attention in Peahens during Courtship.” The Journal
of Experimental Biology 216 (Pt 16): 3035–46. https://doi.org/10.1242/jeb.087338.
Zuk, M., and G. R. Kolluru. 1998. “Exploitation of Sexual Signals by Predators And Parasitoids.”
The Quarterly Review of Biology 73 (4): 415–38. https://doi.org/10.1086/420412.
Zurek, Daniel B., Thomas W. Cronin, Lisa A. Taylor, Kevin Byrne, Mara L G Sullivan, and
Nathan I. Morehouse. 2015. “Spectral Filtering Enables Trichromatic Vision in Colorful
Jumping Spiders.” Current Biology 25 (10): R403-RR404.
https://doi.org/10.1016/j.cub.2015.03.033.
Zurek, Daniel B., and Ximena J. Nelson. 2012a. “Hyperacute Motion Detection by the Lateral
Eyes of Jumping Spiders.” Vision Research 66: 26–30.
https://doi.org/10.1016/j.visres.2012.06.011.
———. 2012b. “Saccadic Tracking of Targets Mediated by the Anterior-Lateral Eyes of Jumping
Spiders.” Journal of Comparative Physiology A: Neuroethology, Sensory, Neural, and
Behavioral Physiology 198 (6): 411–17. https://doi.org/10.1007/s00359-012-0719-0.
Zurek, Daniel B., Alan J. Taylor, Christopher S. Evans, and Ximena J. Nelson. 2010. “The Role
of the Anterior Lateral Eyes in the Vision-Based Behaviour of Jumping Spiders.” Journal of
Experimental Biology 213 (Pt 14): 2372–78. https://doi.org/10.1242/jeb.042382.