how the international tundra experiment (itex) contributes to ... og dokumenter/prosjekter... · 3....
TRANSCRIPT
1
How the International Tundra Experiment (ITEX)
contributes to understanding of Arctic biomass change
Arctic Biomass WorkshopLongyearbyen, October 2015
Ingibjörg S. Jónsdóttir

2
Uneven greening of the Arctic
• Regional variation in greening has been related to– Closeness to coastal areas /impact of sea ice decline,
• Bahtt et al. 2010, 2013, Dutrieux et al. 2012, – Large-scale climate variability.
• Bahtt et al. 2013
• What is driving variation in greening on landscape and local scales?
3
Outline
• What recent ITEX syntheses can tell us about local and landscape drivers of change
• What future ITEX networking and other networks, e.g. the Herbivory Network, can potentially reveal
4
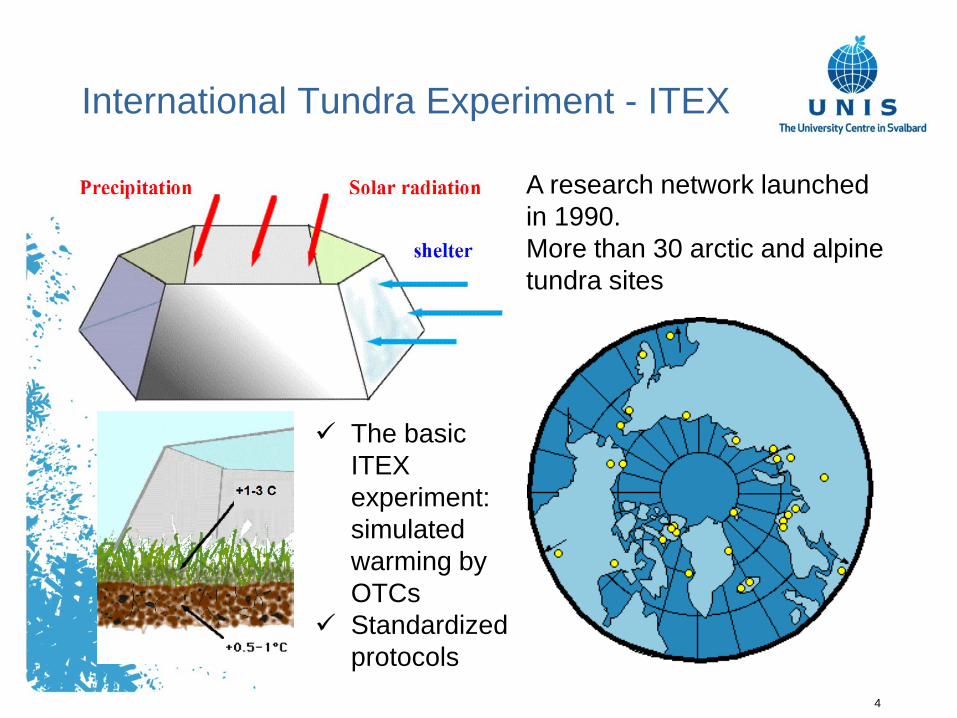
International Tundra Experiment - ITEX
The basic ITEX experiment: simulated warming by OTCs
Standardized protocols
A research network launched in 1990.More than 30 arctic and alpine tundra sites
5
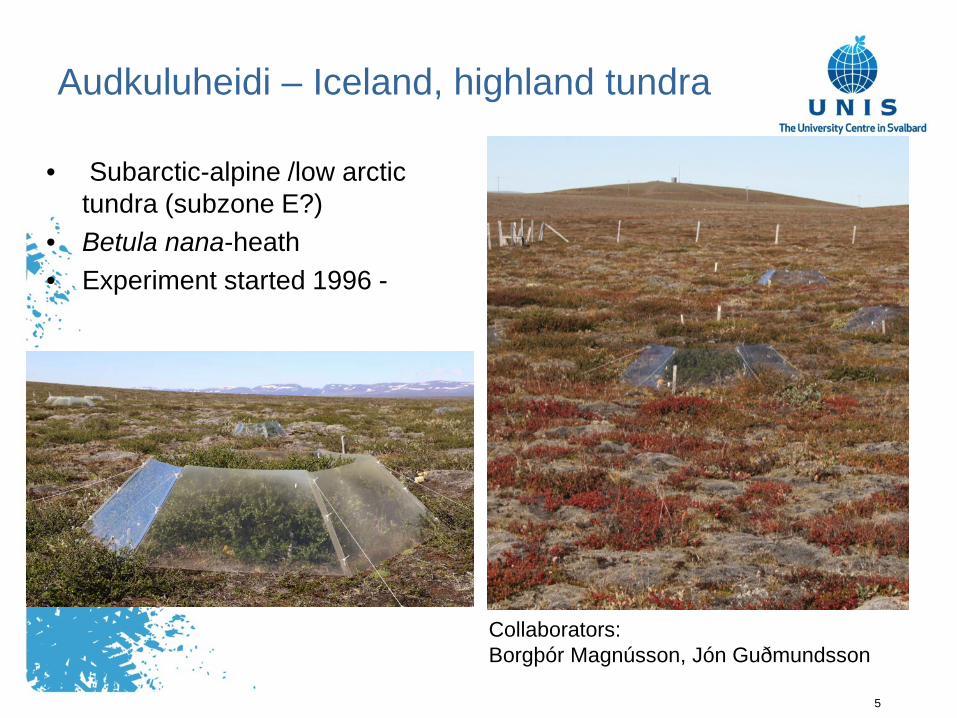
Audkuluheidi – Iceland, highland tundra
• Subarctic-alpine /low arctic tundra (subzone E?)
• Betula nana-heath• Experiment started 1996 -
Collaborators:Borgþór Magnússon, Jón Guðmundsson
6
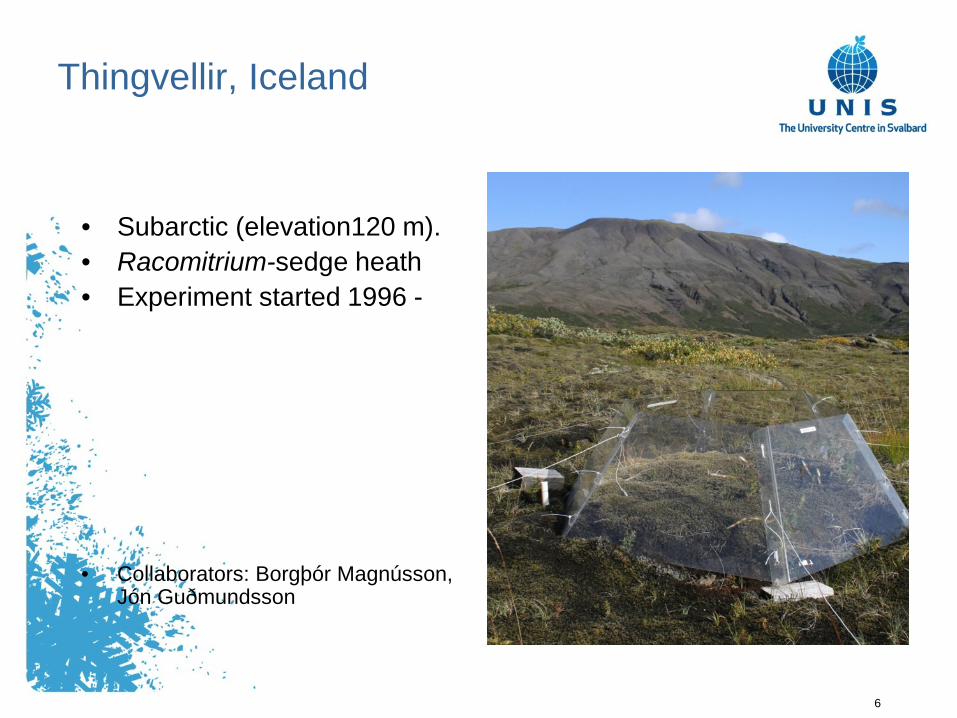
Thingvellir, Iceland
• Subarctic (elevation120 m).• Racomitrium-sedge heath• Experiment started 1996 -
• Collaborators: Borgþór Magnússon, Jón Guðmundsson
7
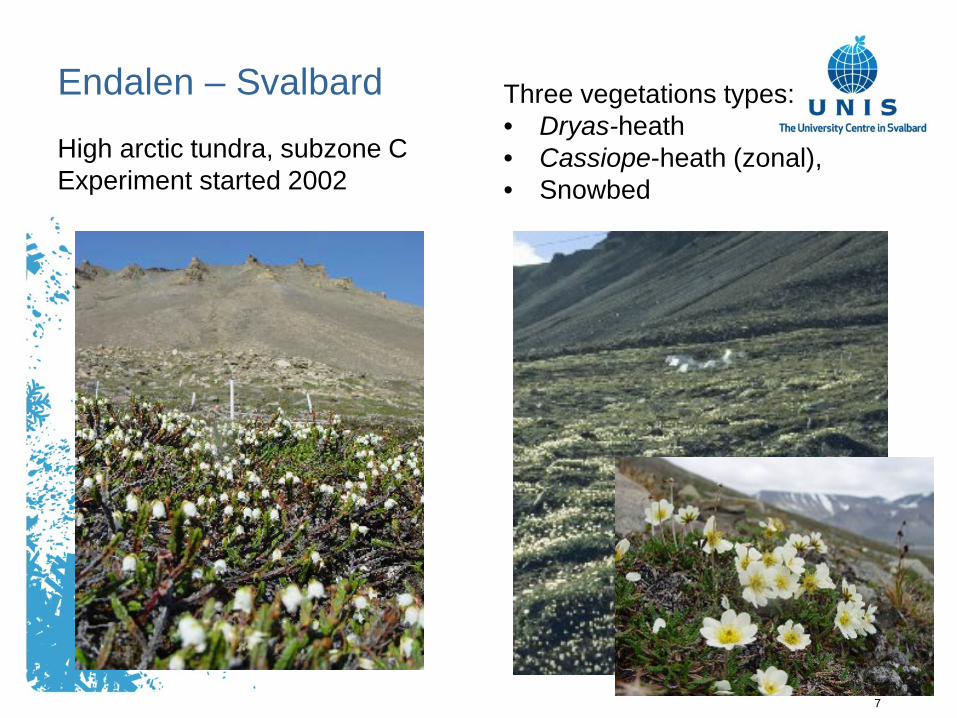
Endalen – Svalbard
High arctic tundra, subzone CExperiment started 2002
Three vegetations types:• Dryas-heath • Cassiope-heath (zonal), • Snowbed
8
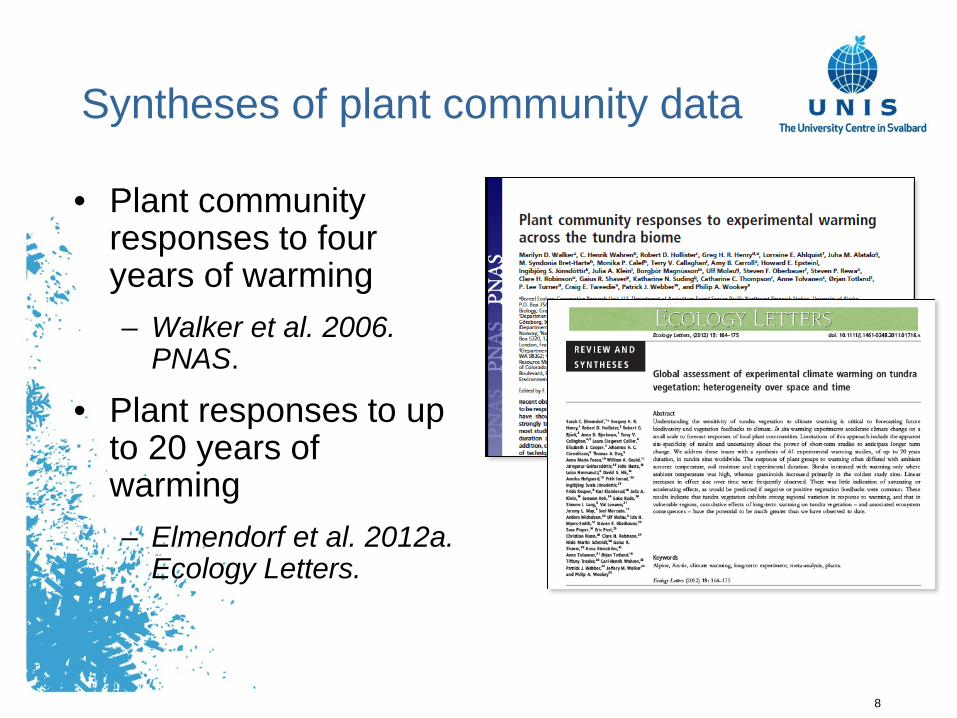
Syntheses of plant community data
• Plant community responses to four years of warming– Walker et al. 2006.
PNAS.
• Plant responses to up to 20 years of warming– Elmendorf et al. 2012a.
Ecology Letters.
9
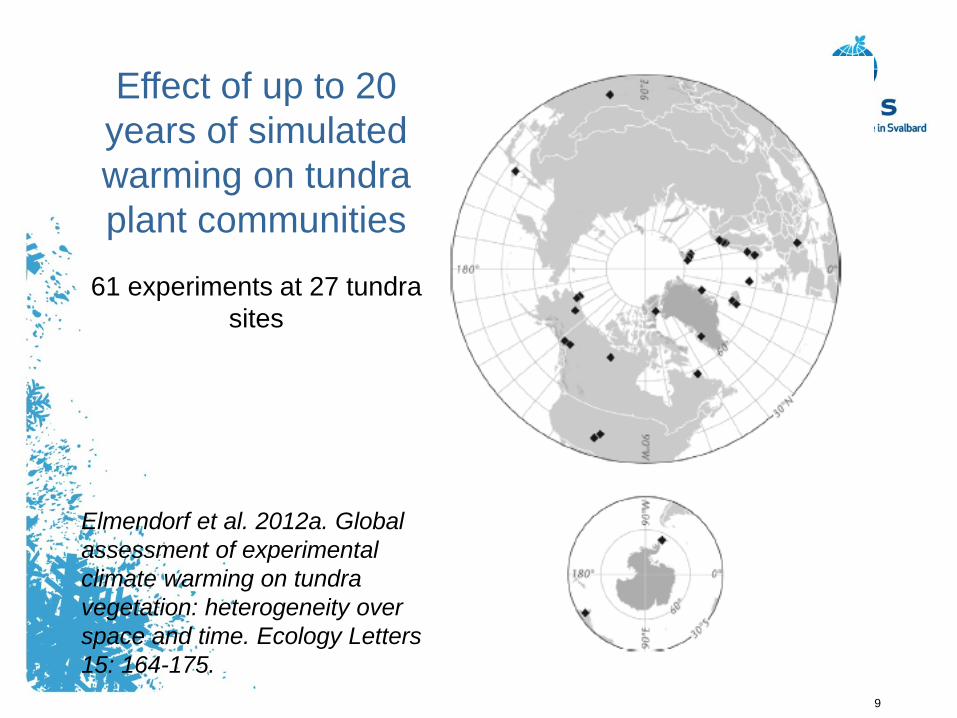
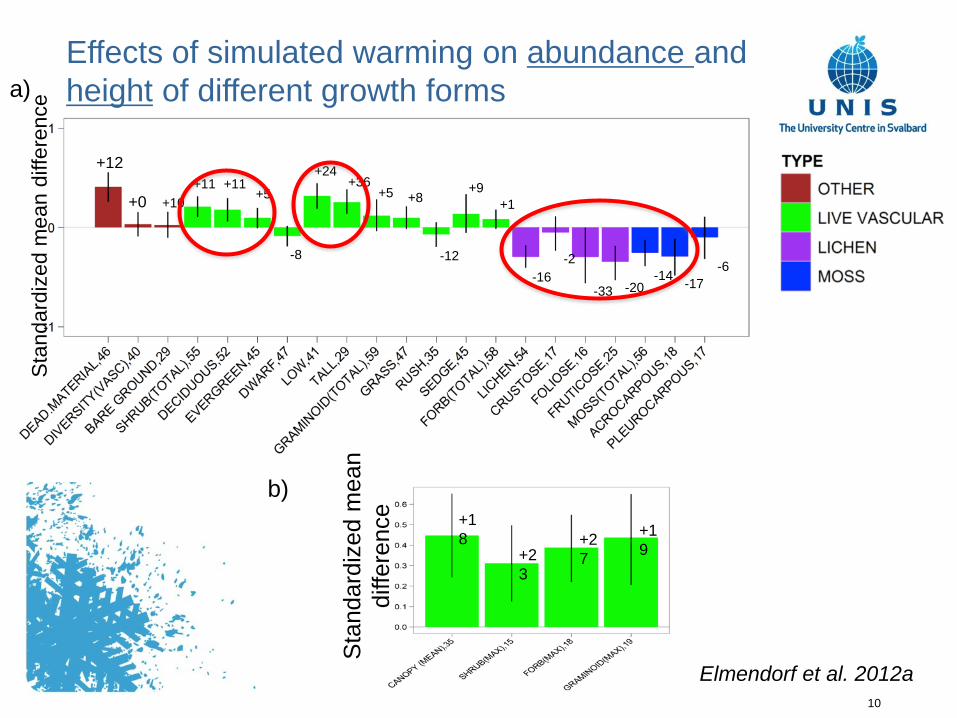
Effect of up to 20 years of simulated warming on tundra plant communities
61 experiments at 27 tundra sites
Elmendorf et al. 2012a. Global assessment of experimental climate warming on tundra vegetation: heterogeneity over space and time. Ecology Letters 15: 164-175.
10
Sta
ndar
dize
d m
ean
diffe
renc
e
+12
+0+11 +11
+5
+24+36
+5 +8
-12
+9+1
-16-2
-33 -20-14
-8
-17-6
+10
a)
+18
+23
+27
+19
b)
Sta
ndar
dize
d m
ean
diffe
renc
e
Effects of simulated warming on abundance and height of different growth forms
Elmendorf et al. 2012a
11
DRYHED
GE’
S g
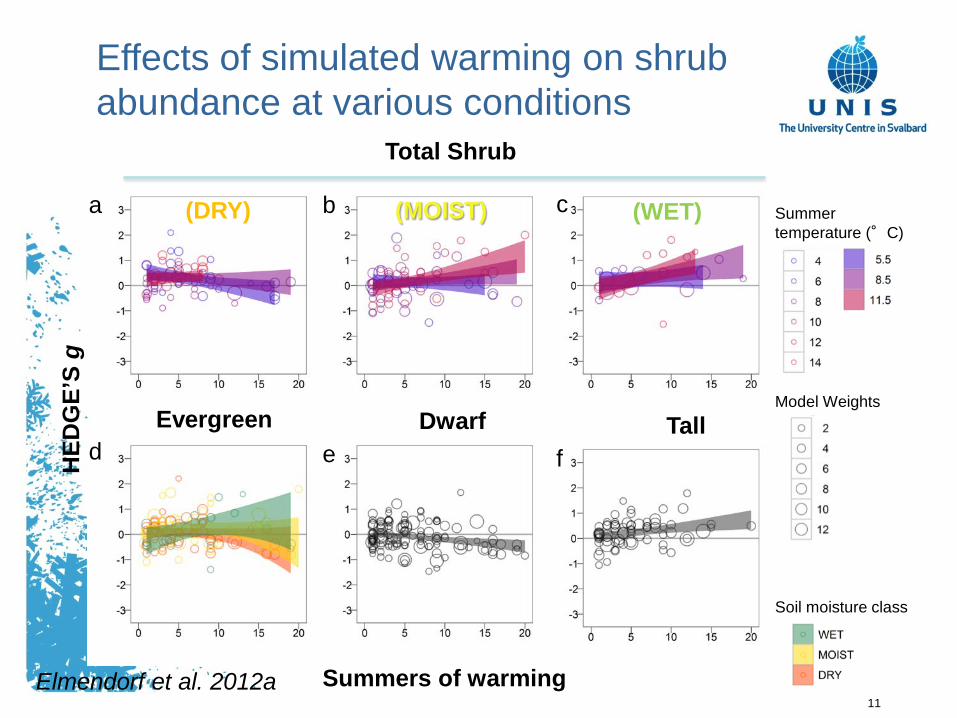
Total Shrub
Summers of warming
Summer temperature (°C)
Evergreen Dwarf Tall
(DRY) (MOIST) (WET)a b c
d e f
Model Weights
Soil moisture class
Effects of simulated warming on shrub abundance at various conditions
Elmendorf et al. 2012a

12
Lichen
Summers of warming
Moss Model Weights Soil moisture class
Summer temperature (°C)
Canopy heightDead plant
material
Effects of warming at different conditions
Elmendorf et al. 2012a
13
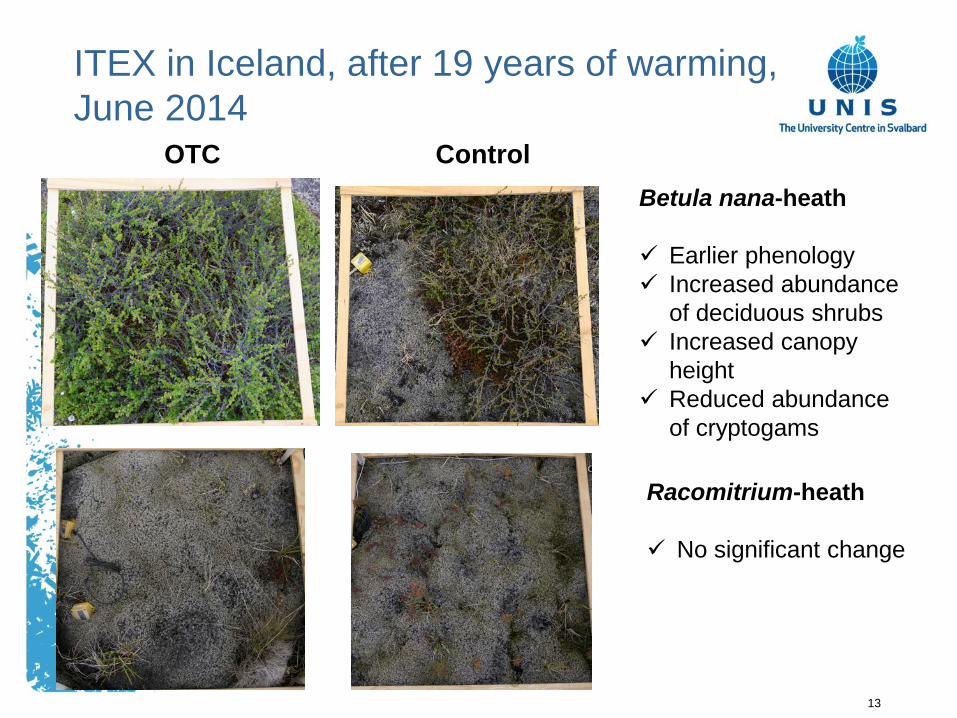
ITEX in Iceland, after 19 years of warming, June 2014
OTC ControlBetula nana-heath
Earlier phenology Increased abundance
of deciduous shrubs Increased canopy
height Reduced abundance
of cryptogams
Racomitrium-heath
No significant change
14
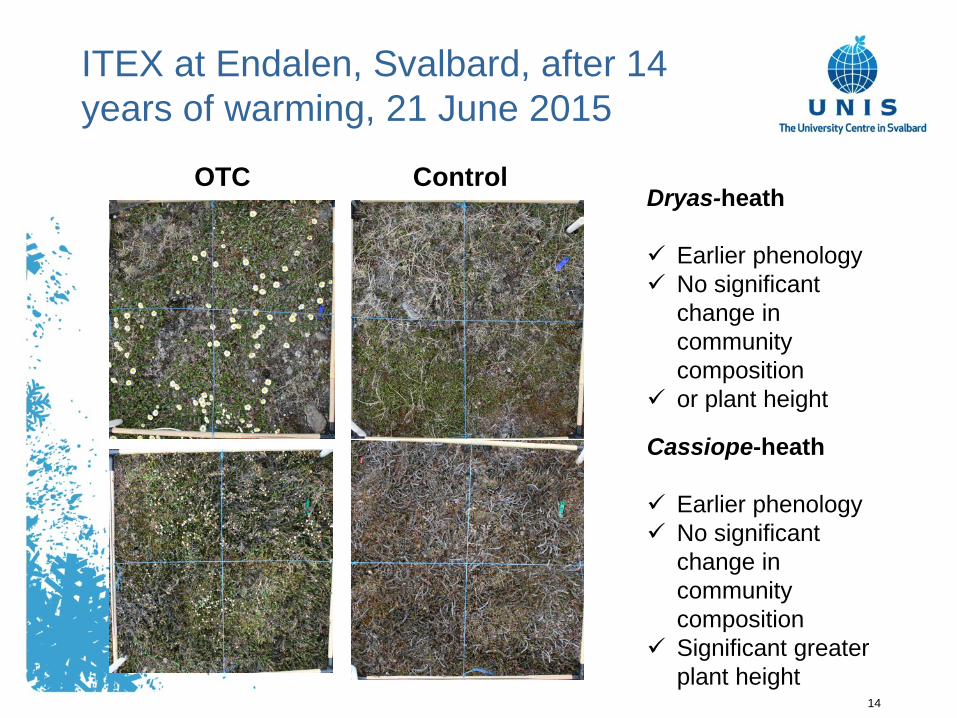
ITEX at Endalen, Svalbard, after 14 years of warming, 21 June 2015
OTC ControlDryas-heath
Earlier phenology No significant
change in community composition
or plant height
Cassiope-heath
Earlier phenology No significant
change in community composition
Significant greater plant height

15
Endalen, Svalbard 2009Effect of OTC warming on canopy height
0
0,5
1
1,5
2
2,5
3
3,5
BIS-L CAS-L DRY-L
CTL
OTC
Can
opy
heig
ht (c
m)
Plant CommunitySnowbed Cassiope Dryas
16
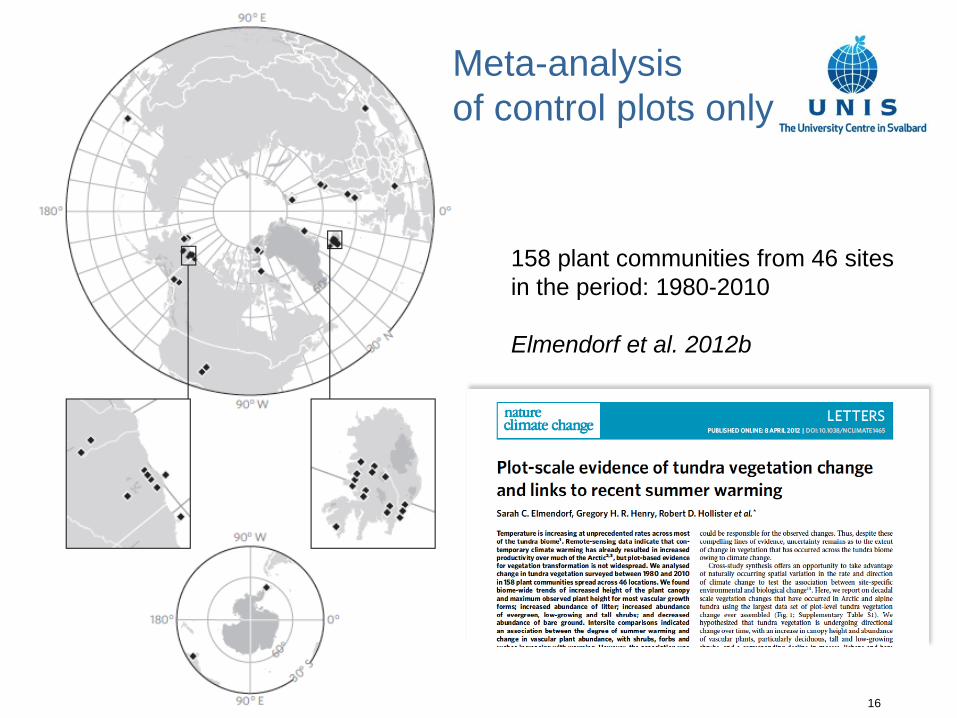
Meta-analysis of control plots only
158 plant communities from 46 sites in the period: 1980-2010
Elmendorf et al. 2012b
17
Cha
nge
in c
anop
y he
ight
(c
m/y
ear)
1.0
0.5
0.0
-0.5
Figure 2. P
roba
bilit
y of
incr
easi
ng
1.0
0.5
0.0
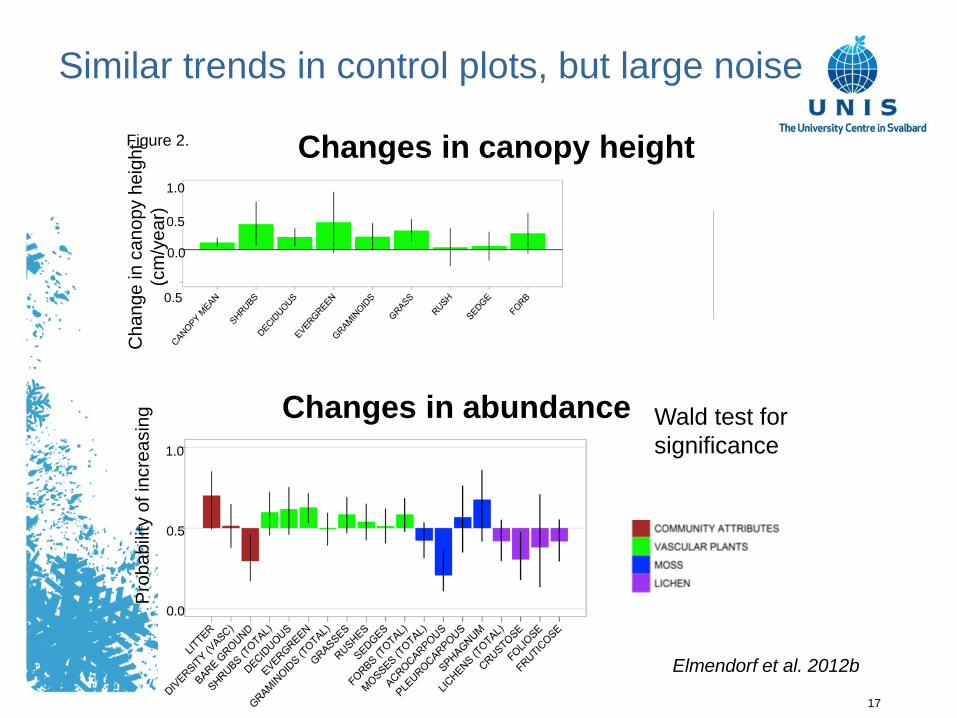
Changes in canopy height
Changes in abundance
Elmendorf et al. 2012b
Wald test for significance
Similar trends in control plots, but large noise
18
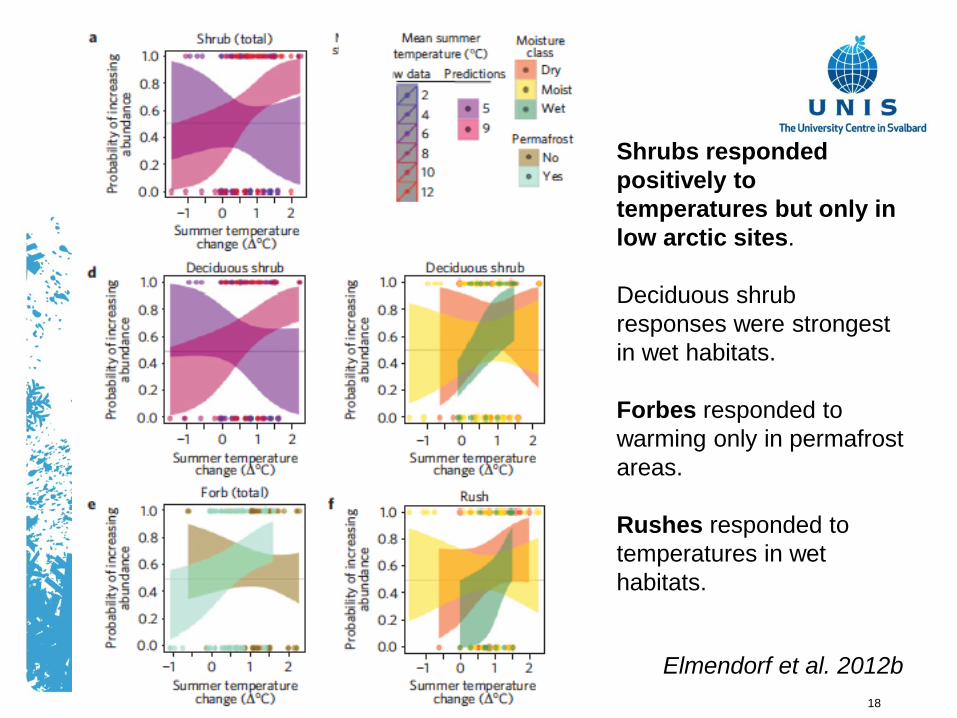
Shrubs responded positively to temperatures but only in low arctic sites.
Deciduous shrub responses were strongest in wet habitats.
Forbes responded to warming only in permafrost areas.
Rushes responded to temperatures in wet habitats.
Elmendorf et al. 2012b
19
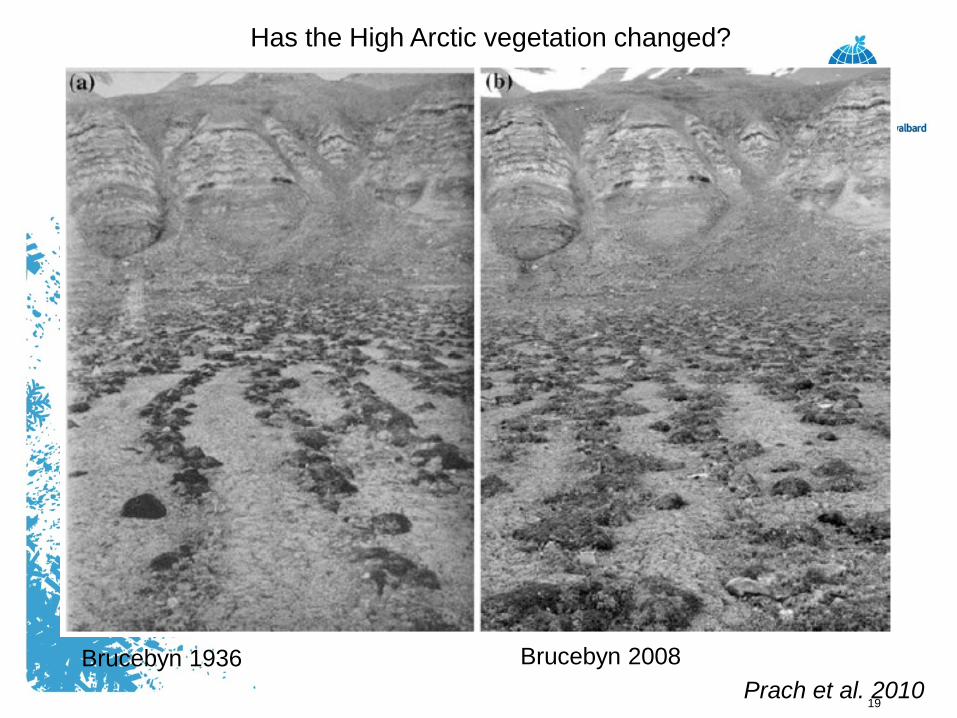
Has the High Arctic vegetation changed?
Brucebyn 1936 Brucebyn 2008Prach et al. 2010
20
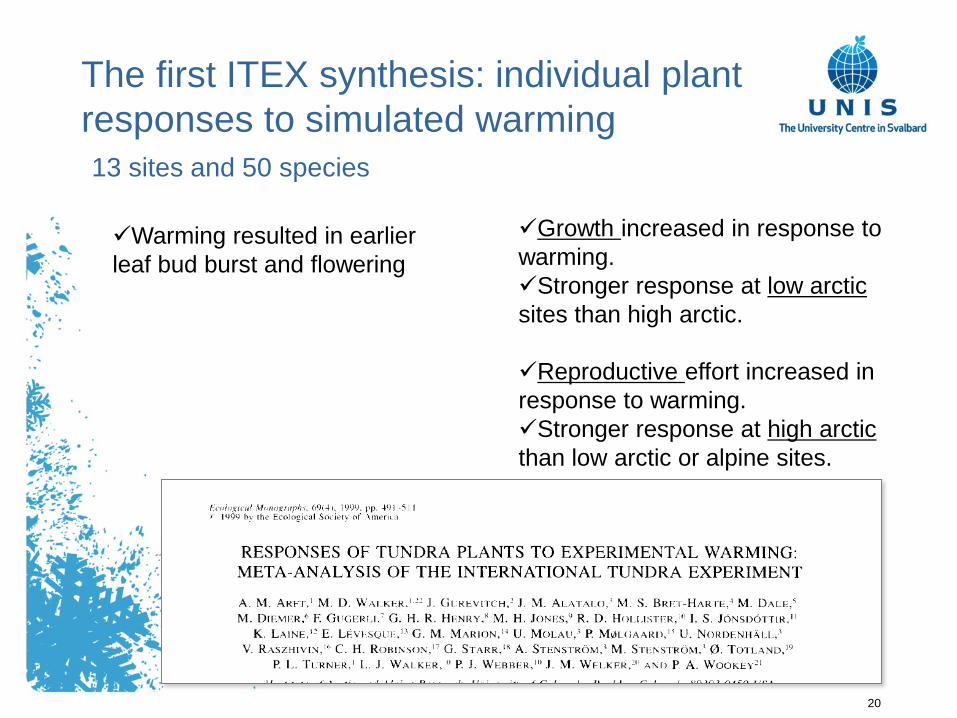
Growth increased in response to warming.Stronger response at low arctic sites than high arctic.
Reproductive effort increased in response to warming.Stronger response at high arctic than low arctic or alpine sites.
Warming resulted in earlier leaf bud burst and flowering
The first ITEX synthesis: individual plant responses to simulated warming13 sites and 50 species
21
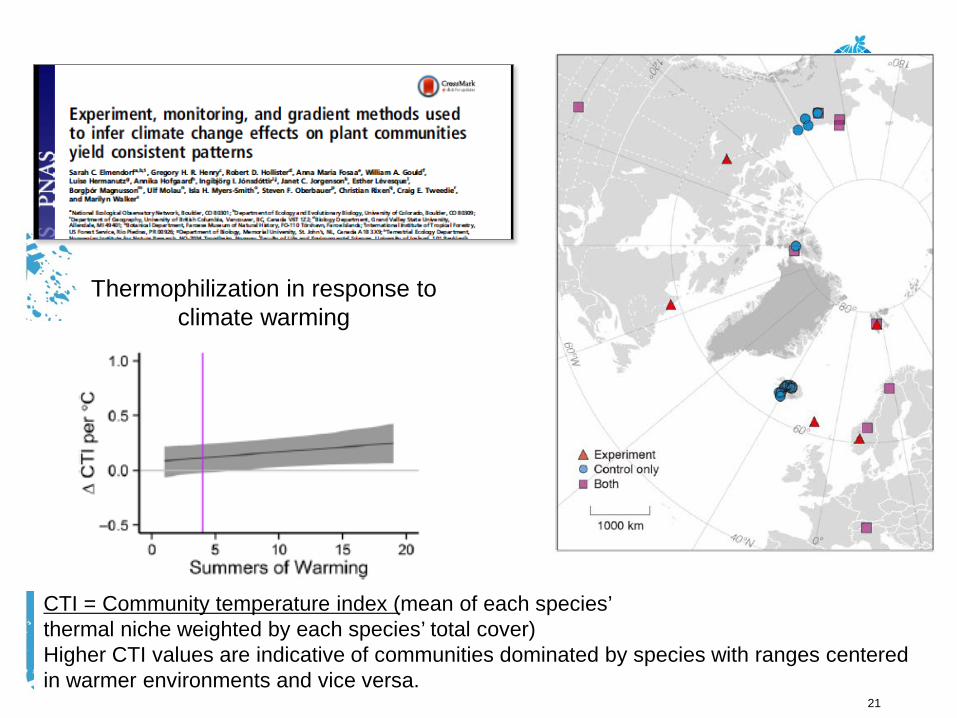
CTI = Community temperature index (mean of each species’thermal niche weighted by each species’ total cover)Higher CTI values are indicative of communities dominated by species with ranges centered in warmer environments and vice versa.
Thermophilization in response to climate warming
22
Drivers of change at landscapeand local scales
• Based on ITEX syntheses:– Summer temperatures – especially where summer T are
relatively high already and responsive shrubs already in place (in the Low Arctic)
– Soil moisture – strongest responses by shrubs in wet habitats
– Community change is related to thermophilization.
• Based on the high arctic Svalbard ITEX studies– Timing of snow melt – strongest plant height responses to
warming in habitats of intermediate timing of snow melt (zonal, Cassiope heath) compared to early (dry Dryasheath) and late melting snowbeds (moist).

23
Other drivers may modulate responses to climate warming
• Land use • Herbivory
– plant community responses
• Post 2013, Olofsson et al. 2009
– Ecosystem processes (carbon balance)
• Cahoon et al. 2012, Väisänen et al. 2014
24
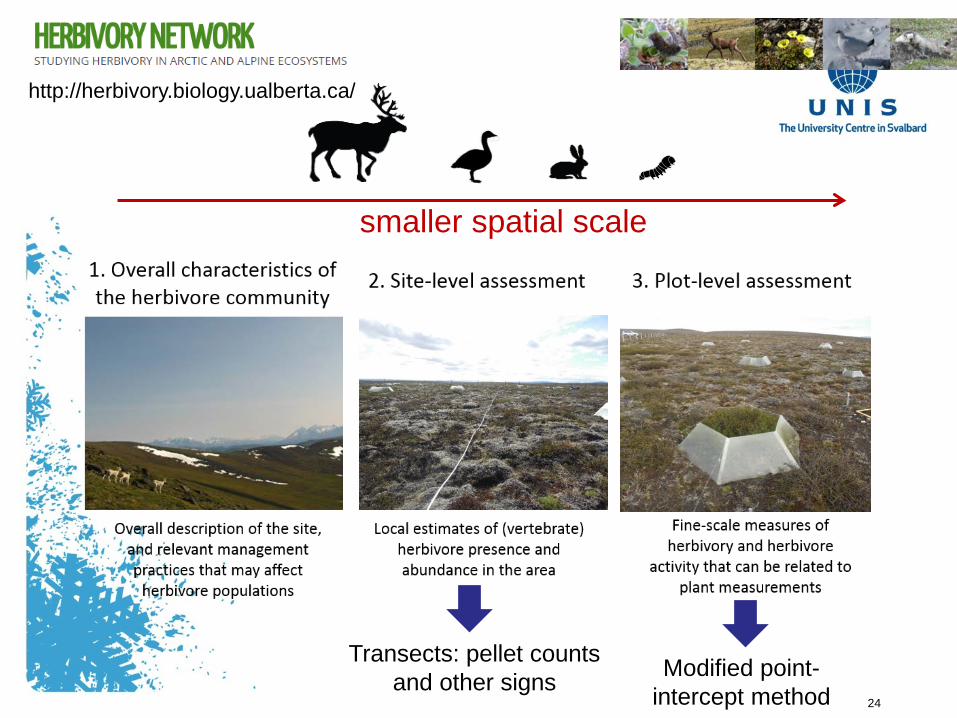
smaller spatial scale
Transects: pellet counts and other signs Modified point-
intercept method
http://herbivory.biology.ualberta.ca/
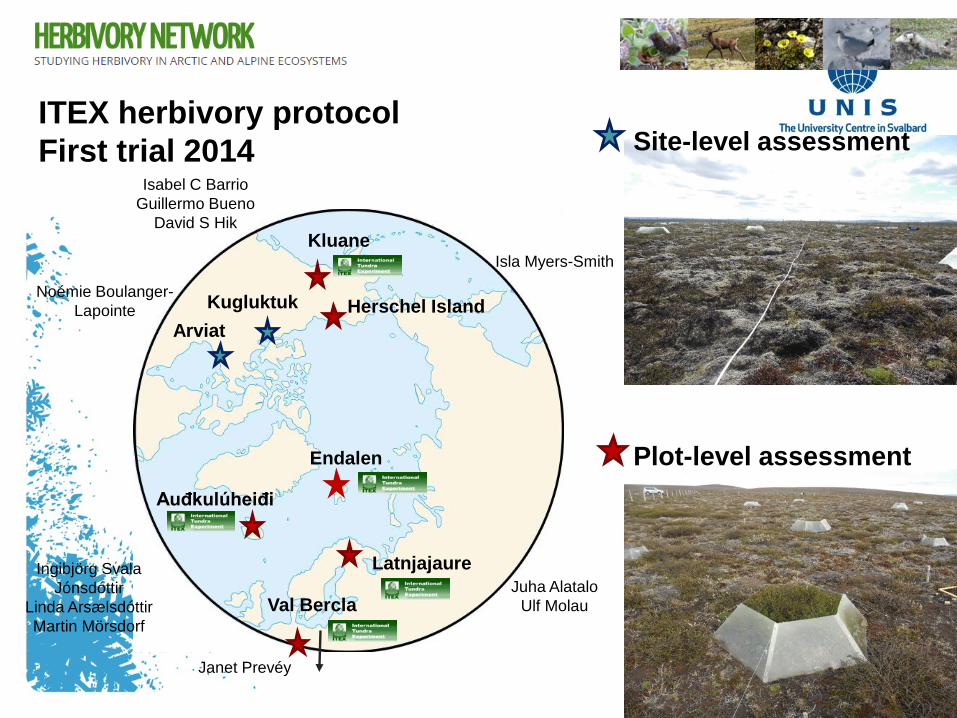
25
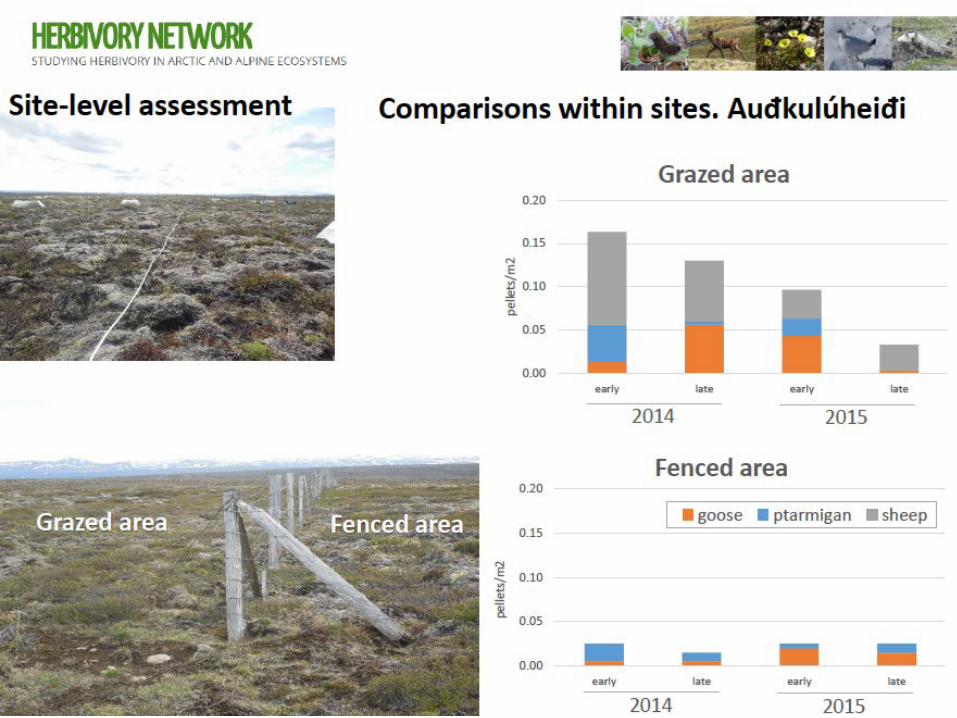
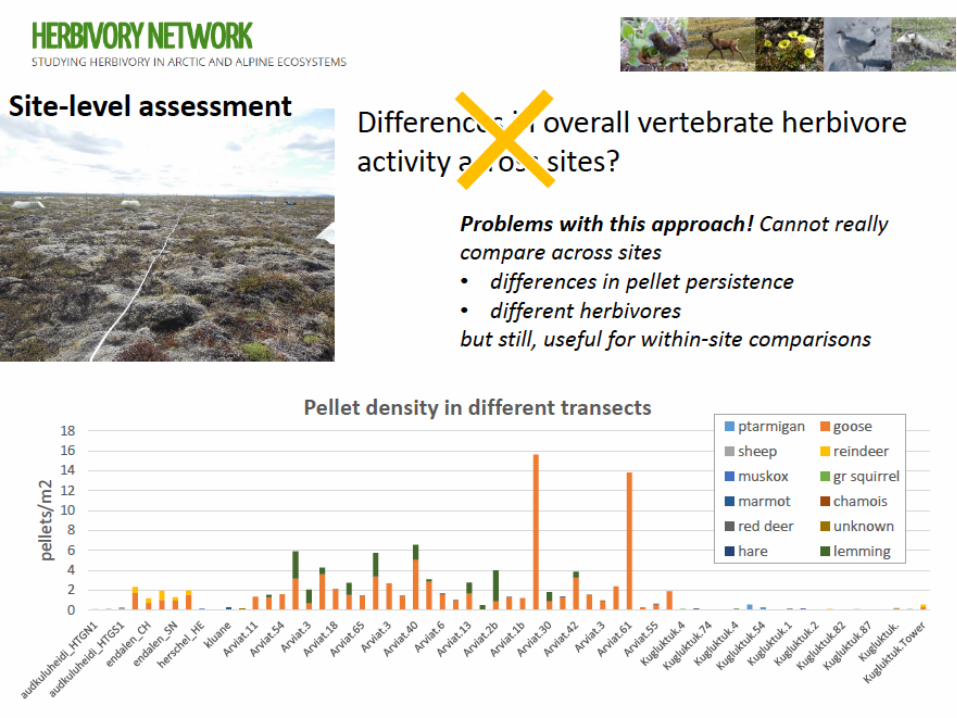
Site-level assessment
Plot-level assessment
Kluane
Isabel C BarrioGuillermo Bueno
David S Hik
Herschel Island
Isla Myers-Smith
Auđkulúheiđi
Ingibjörg Svala Jónsdóttir
Linda ArsælsdóttirMartin Mörsdorf
Endalen
Val Bercla
ArviatKugluktukNoémie Boulanger-
Lapointe
Janet Prevéy
LatnjajaureJuha Alatalo
Ulf Molau
ITEX herbivory protocolFirst trial 2014
26
27
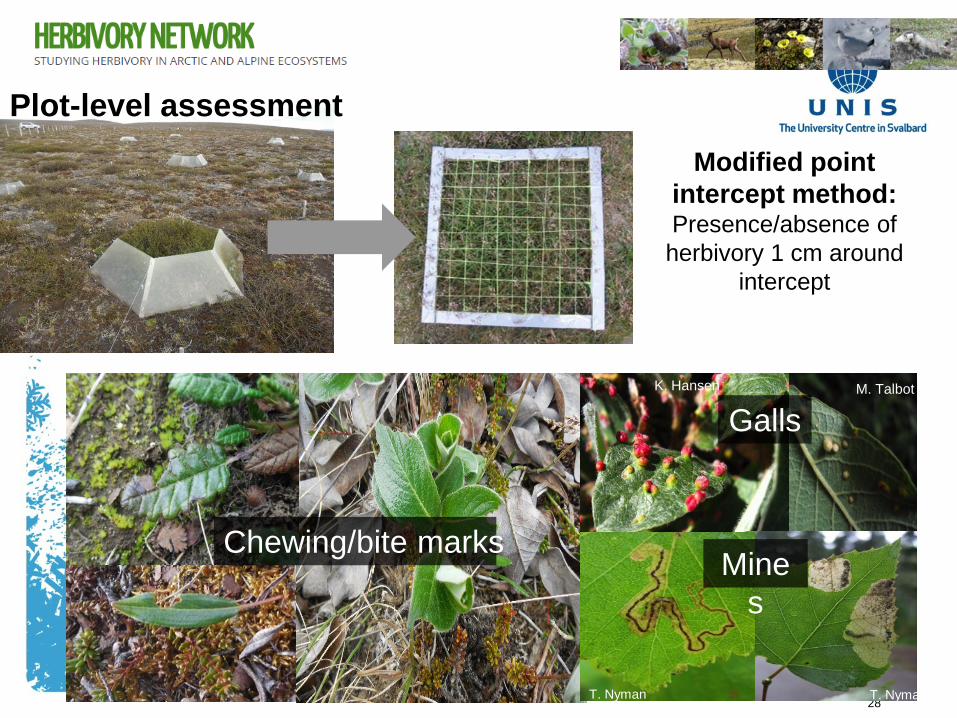
28
Plot-level assessmentModified point
intercept method: Presence/absence of herbivory 1 cm around
intercept
[pictures leaf damage]
K. Hansen M. Talbot
Galls
T. Nyman T. Nyman
Mines
Chewing/bite marks

29
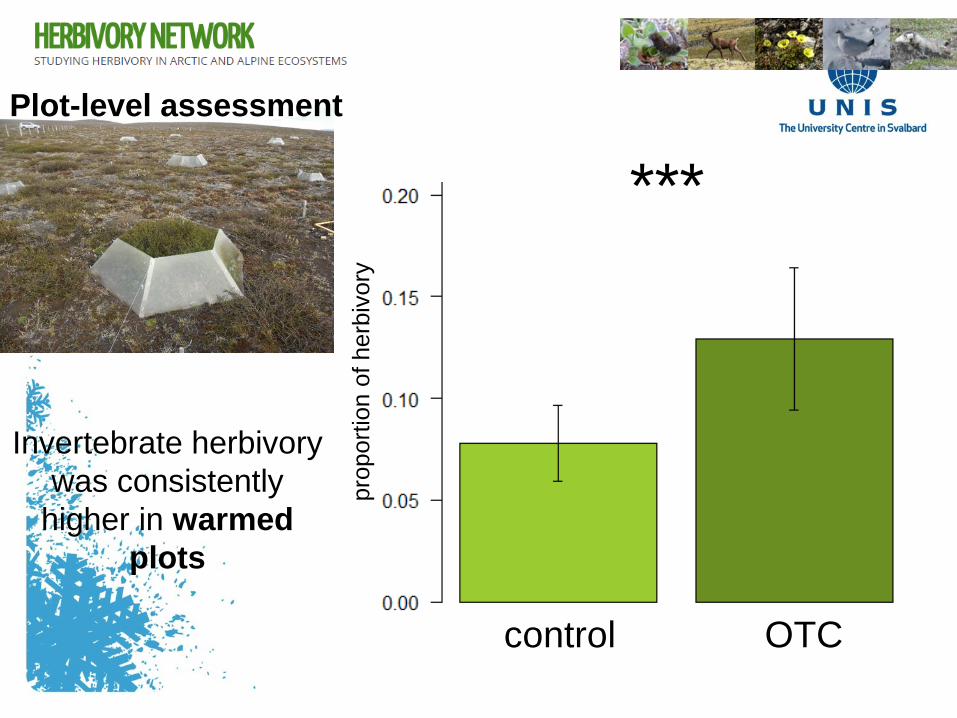
Plot-level assessmentOverall, the frequency of
invertebrate herbivory in the control plots was low (~5-10%)
and varied across sites(LM; SITE=1.785, p=0.002)
Endalen, Svalbard
Herschel IslandYukon, Canada
Latnjajaure, Sweden
KluaneYukon, Canada
Val BerclaSwitzerland
AudkuluheidiIceland
prop
ortio
n of
her
bivo
ry
30
Invertebrate herbivory was consistently
higher in warmed plots
Plot-level assessment
prop
ortio
n of
her
bivo
ry
***
control OTC
31
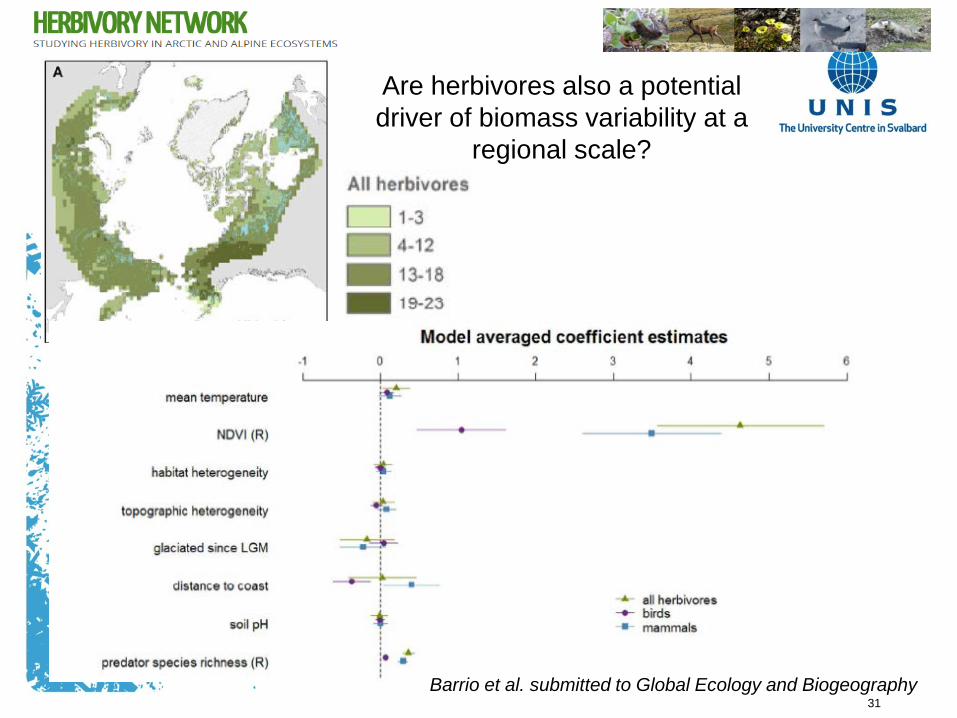
Are herbivores also a potential driver of biomass variability at a
regional scale?
Barrio et al. submitted to Global Ecology and Biogeography

32
Conclusions ….• The ITEX syntheses have demonstrated
– Sites that are already relatively warm (low arctic) respond more strongly to warming than colder sites (high arctic)
– the importance of the combined effect of summer temperatures and soil moisture as drivers of plant community change at various spatial scales.
• In addition, individual ITEX studies along natural gradients within landscapes have demonstrated the importance of timing of snow melt for plant height responses in the High Arctic.
• Changes in plant community compositions is due to thermophilization = species decline in cold adapted and increase in warm adapted species.
• Standardized protocols are being developed to disentangle the causal relationships between herbivory and plant community responses at various spatial scales