how to allocate marketing budgets better using customer journey analytics
TRANSCRIPT

The 10X: Practical Data Science for Smart Entrepreneurs
Meetup # 1: Marketing industry | Allocating marketing budgets better.

Plan of the meetupME
10X
ALLOCATING MARKETING BUDGETS BETTER

Me

My story [1/5]
My story in data science & analytics started back in high school, when I discovered my interest in mathematics…
I got 7 (the highest grade) in HL Mathematics (International Baccalaureate) and 41 points in total.
I was one of the 12 people to receive 7 nationwide in my exam session.

My story [2/5]
Interviewed by Oxford Uni, got an offer to study at London School of Economics, finally went on to study at Warsaw School of Economics.
During my BSc, I became further interested in data analysis, won some local competitions, joined the analytical mastermind group of prof. Balcerowicz (FOR).

My story [3/5]
Currently I’m a senior at two MSc programmes: data analysis & business informatics.
Graduating soon.
Theses about building a simulation engine for shipping industry (Python) & NLP tool to detect important e-mails (JS?).
Will present both papers at conferences in 2017.

My story [4/5]
I’ve been helping companies with digital analytics and data science for 1.5 years.
Sample projects I did:
- Mustache LLC - modelling data from e-mail newsletters; enhancing open rates and CTRs.
- Appsilon LLC - optimizing digital marketing analytics; improving lead gen.- Optimal energy LLC - marketing models, segmentation; improving lead gen.- ...

My story [5/5 finally...]
Huge data-related unknown unknowns among entrepreneurs and marketers.
Decided to change it.
That’s how 10X was born.

10X
The place for entrepreneurs and marketers to improve decision making and solve business problems with data.

Improving decisions making with knowledge- Workshop meetups once every 3-4 weeks (maybe more
often, depends on the workload).- Online webinars & courses (http://10xed.org).- Lectures by guests and experts and myself.- Tools (e.g. Google Chrome extension for Gmail → July).
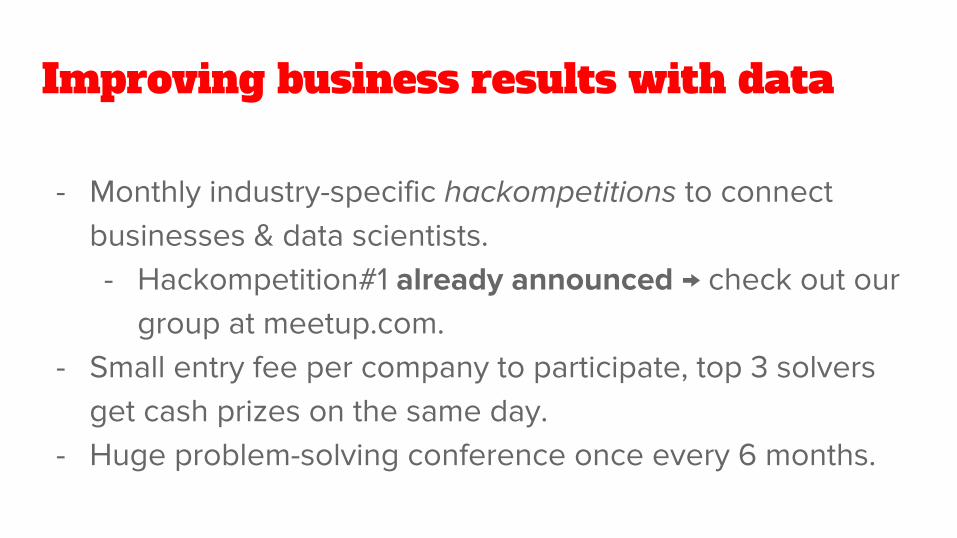
Improving business results with data
- Monthly industry-specific hackompetitions to connect businesses & data scientists.- Hackompetition#1 already announced → check out our
group at meetup.com.- Small entry fee per company to participate, top 3 solvers
get cash prizes on the same day.- Huge problem-solving conference once every 6 months.

ALLOCATING MARKETING BUDGETS BETTER

“I know my (macro) conversion rate, but I really feel that it’s just the tip of the iceberg …
I don’t know what’s under the surface and it drives me nuts.”
Here’s what I’ve heard several times from the entrepreneurs I’ve worked with:

And it got me thinking: why is it so…?
I decided to do some research and think about this problem.
Here’s what I’ve found.

First, let’s define the macroconversion rate.
“Macro metric” which describes the % of visitors / users who bought something.
In other words, I define macroconversion rate as this single metric that companies often try to optimize for relentlessly.

Problem#1: Conversion rate is
abused.(when used in isolation).

Problem#2: Conversion rate is an
example of pre-Internet business thinking.
What I mean here is this: 20 years ago, conversion rate was all we had. For example, if you owned a bike shop, you had no way of tracking non-commercial interactions between your brand and customers. You did not have much more data than sales receipts, and hence conversions were the only thing you could optimize for. But we are living in a totally different world now. You can track customer-brand interactions to a fine detail. Of course, raw macroconversions are still important, but there are additional metrics that matter.
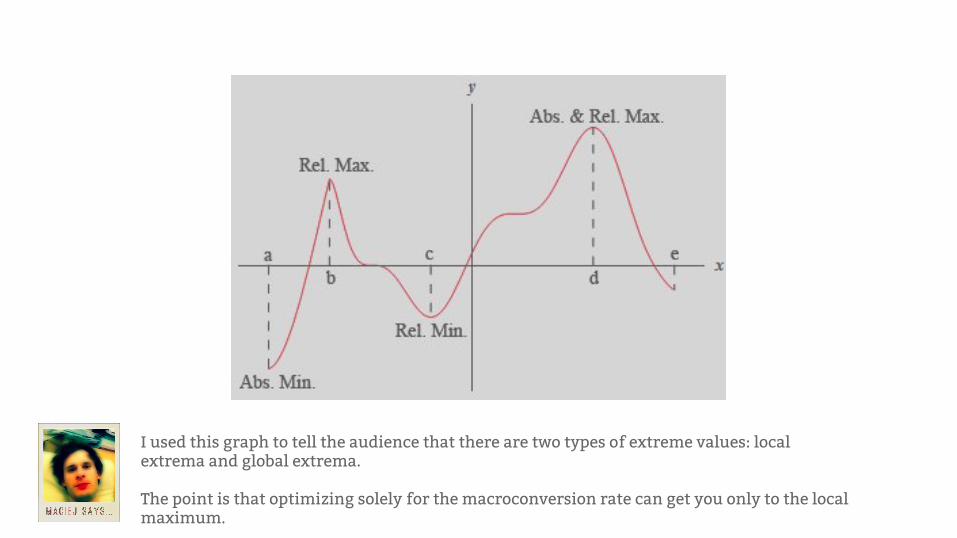
I used this graph to tell the audience that there are two types of extreme values: local extrema and global extrema.
The point is that optimizing solely for the macroconversion rate can get you only to the local maximum.

If you’re obsessively focused on your macroconversion rate, you’re optimizing for the
local maximum only.
And why?

Because ready-to-buy customers are just one
segment of your customers.
In mathematics, local maximum is defined as the maximum value within some small neighborhood.
The analogy for marketing is: optimizing for a small cohort of customers is like trying to find a maximum value within a small neighborhood.

Here are the groups of customers you’re blind to if you focus solely on your macroconversion rate:
- People who came to learn about your products- People who came to learn about you- People who came out of the serendipity of life…- In short: people who aren’t there to buy from you yet (majority of your customers!).
Here is a good visualization of various needs the macroconversion rate makes you blind to. Took it from here.

And it gets worse...- Macroconversion rate narrows your thinking to 20% of people who consider
buying at a given moment, but what about the remaining 80%? - Macroconversion rate makes you optimize for 2.5 out of 100 people on
average. - Macroconversion rate makes you focused on the short-term, but what about
the LTV or NPS?

Takeaway#1: Segmentation,Segmentation,Segmentation!
If you see your traffic as this homogenous flow of clicks, as the macroconversion rate thinking often demands, you risk getting suboptimal solutions.

If optimizing for the macroconversion rate is not
optimal, what is then?Optimize for the holistic customer
journey & both the macro AND microconversions along it!

If you account for all of your traffic, i.e. not only for the transaction-ready segment, and then optimize the entire customer journey, you’re maximizing chances of hitting your KPI’s global maximum.

Oopss… How do I do it?!

AIDA...(AttentionInterestDesireAction)
One good way to create customer journeys is to help yourself with various business frameworks. One such framework is AIDA. Rings a bell?

...is a bit selfish...Because it’s focused on you!
How about us, the customers?The problem with AIDA, however, is that it doesn’t say much about the real journey of your customers. AIDA is focused on your business needs, not the needs of your customers. So what’s the better way here?

We live in a different framework
We have real needs

STDC...(SeeThinkDoCare)The author of this framework is Avinash Kaushnik.
WE:“Where did you buy this watch?”“Oh, I saw Ronaldo wore it.”
“I’m thinking about going for a trip, where do I find cool deals hmm?”
“Bro, I’m booking those concert tickets for the next Saturday.”
“I love Apple products.”

Further links on STDC framework:
● See, Think, Do, Care Winning Combo: Content + Marketing + Measurement.● See-Think-Do: A content, marketing, measurement business framework.● Digital Marketing & Analytics: Five Deadly Myths De-mythified.

Additional note..
The distinction between AIDA & STDC framework is not just about naming.
The point is to look with empathy at the real needs of your customers as they progress along the path of interaction with your company.
It is about understanding how people feel and what contexts and situations they find themselves in along the customer journeys.

Remember segmentation?

See: segment#1Think: segment#2Do: segment#3Care: segment#4These high level segments should be chopped further into smaller segments based on various demographic and behavioral characteristics.

SEE THINK DO CARE
NO commercial intent.
E.g. exclusively the people who use cars.
See stage often happens subconsciously. If you want to move people from see to think, you should research both their conscious and subconscious motivations.

SEE THINK DO CARE
Subset of See with even the weakest intent load.
E.g. people who think they need a new car.
Always conscious.

SEE THINK DO CARE
Ready to buy.
Lion’s share of marketing today (although it’s changing…).
E.g. people who actively look for cars online.

SEE THINK DO CARE
A history of transactions.
LTV.
E.g. People who love Mercedes.
Or: people who love Mercedes and tell their friends about it.

See, Think, Do on a real website.Source: Occam Razor’s materials.
See-Think-Do framework in action.
See content:- Blog- Social media
Think content:- Wishlists- Stylists- Call
Do content:- Add to bag

STDC brings focus.
Oh, and only 1-2% of companies really use it.
Thinking in such a granular systematic way about sales and marketing is not common and can be a huge competitive advantage.

But let me now say something
controversial...

Content strategyMarketing strategy
Measurement strategy
These three strategies that have to be applied together or they won’t work.

Disregard the previous insight and you’ll:
Produce “do” content for the people in the “think” stage. Waste.
Try to engage “care” people with “see” tactics. Waste.
And so it goes….
This is very important. In the realm of decreasing attention spans of today’s customers and increasing competition, interaction points between the company and your customers are getting more valuable. Use them incorrectly and you’ll lose both the monetization potential as well as potential fans.

On our journey to the
global maximum let’s
talk about measurements
...

Stage 1st place metric 2nd place metric 3rd place metric
See % new visits # interactions # “talking about this”
Think Click-Thru rate (CTR)
Page depth / time on site
Bounce rate
Do Profit Macroconversion rate
Checkout abandonment rate
Care Customer lifetime value
Net promoter score
Repeat purchases
Talking about your measurement strategy...
Source: my own work + Occam’s Razor materials.
See metrics measure raw “eyeballs”. Are you being noticed?
Think metrics tell you whether people see your product as valuable at all.
Do metrics tell you how valuable is your product to your customers.
Care metrics measure the strength of relationship between the company and customers

Before we go any further, let’s do a quick review of the key metrics mentioned on the previous slide.
Metric Description
% new visits Proportion of first-time visits in all visits in a period of time
# interactions Platform-dependent. Likes/shares/+1’s/Instagram hearts/Follows ...
# “talking about this” Facebook metric; index showing likes, comments, shares for a Fanpage
Click-Thru rate (CTR) Number of times a piece of content (most often an ad) was clicked divided by the number times it was shown/viewed
Page depth / time on site / interactions per visit
Number of pages viewed during the user session / Average time spent by a visitor on a particular page / Average number of interactions per visit
Bounce rate Rate at which new visitors arrive at your website and leave without any further interactions. Negatively correlates with page depth, time on site and interactions
Profit Revenue - COGS
Macroconversion rate Macroconversion rate for the entire business (usually < 2.5%)
Checkout abandonment rate The number of abandoned shopping carts divided by the number of initiated shopping carts (from my experience ~ 60-70%)
Customer lifetime value Cumulative profit until churn
Net promoter score % company promoters - % company detractors (highly correlated with profitability)
Return visits / Repeat purchases
Purchases or visits by the same user over a period of time

So let’s move from measuring what the needs of the customers are to...
Managing marketing budgets better.

You can optimize marketing budgets by measuring both little macroconversions along your customers’ STDC journey and
that final macroconversion of theirs.

The flow:Research customer persona → Segment their needs,
behaviors and contexts with STDC framework → Map out microconversions & the macroconversion along the
STDC journey → Report & create funnel content → Optimize the marketing spend using Google Analytics
Start with the customer personas.
Decode what their characteristics, goals, needs and motivations are.
In the second step, apply STDC framework. The goal here is to answer two questions: 1) what information do my personas need along their STDC path, 2) where do they look for those information. Then, try to map out microconversions that push them through the funnel, all the way up to the macroconversion.
Finally, spend your marketing budgets on content that supports the chances of microconversions along the way. Then testing kicks in. A lot of it. If a given piece of content does not support a microconversion, iterate, improve. The best way to know whether microconversions work is to use Google Analytics, as shown on the next slide:

Google Analytics panel with microconversions. Source: Occam’s Razor materials.
Source: Kissmetrics blog

So why it’s important to focus both on micro and macroconversions?
- You can capture all four segments of the STDC framework, not just Do, as in measuring the macroconversion exclusively.
- You can essentially capture what happens during all visits, not just 20-30%.- You can really see what contents contribute to ROI. - You’ll have an understanding of why your customers use your product in the
first place.- You’ll be able to create a good customer journey system and optimize your
spend.

Closing words - how to create an optimized customer journey (finally).
- Segment your customers and their behaviours using the STDC framework. - List all the microconversions en route to the macroconversion.- Create content to push people from one microconversion to another, again
based on STDC framework and your strategy.- Methodically optimize microconversions completion rates over time via A/B
testing your content and call to actions, data science & modelling, etc.- If there’s a high bounce rate between any two microconversions, dive deeper
into STDC metrics I’ve listed earlier and come up with new content ideas based on the needs of your customers.

3 INTERESTING BIG DATA INSIGHTS

#1: 75% of enterprise leaders cite growth as the key source of value from analytics.
#2: 60% of enterprise leaders have some predictive analytics capabilities.
#3: 80% of enterprise leaders measure the impact of analytics investments.

See you on the next meetup.
If you want help setting up this STDC framework & Google Analytics for you business - write me a private message on meetup.com and let’s jump on a call.