how to assess iron deficiency anemia · percent).3 individuals also tend to absorb more iron when...
TRANSCRIPT

HOW TO ASSESS IRON DEFICIENCY ANEMIA
AND
USE THE HEMOCUE?
Susan E. Burger, PhD, MHS June N. Pierre-Louis, PhD, MPH August 2002
352 Park Avenue South Suite 1200 New York, NY 11201 212.532.0544 212.532.6014 fax www.hkworld.org


How to Assess Iron Deficiency Anemia and Use the HemoCueTM
i
Preface
Who should use this reference guide?
Iron deficiency is the most widespread nutritional problem in the world. More than two billion people are estimated to suffer from iron deficiency, mostly in developing countries. Governments and nongovernmental organizations that work in developing countries need data on anemia prevalence at provincial, district, and local levels in order to advocate for and justify the allocation of resources and to plan and evaluate iron interventions.
This reference guide has been specifically designed for use by private voluntary organizations and nongovernmental organizations that implement community-based development projects in health, nutrition, and agriculture at the local level. It may also be useful for local government offices. The guide is designed to help program managers of development projects to collect and analyze data and information on iron deficiency anemia.
What is included in the guide?
Chapter I includes basic background information on iron deficiency anemia and its public health importance, and the causes and consequences of iron deficiency. Chapter II explains how anemia prevalence is measured and describes a step-by-step process for collecting existing information about iron deficiency and anemia and its potential causes and for deciding whether to conduct an anemia survey. Chapter III describes step by step how to plan an anemia prevalence survey using the HemoCue? , including target groups and sampling methodology. Chapter IV provides detailed and practical information on using HemoCue? , including supplies, quality assurance, collecting a capillary blood sample (a drop of blood), and protocols to ensure the safety of survey workers and subjects. Chapter V describes a training protocol and standardization exercise that Helen Keller International adapted to ensure the accuracy and cons istency (reliability) of the HemoCue? measurements. The training protocol and standardization exercise enable trainers to correct errors and to select competent survey workers.
Why use the HemoCueTM?
The standard tests for anemia are measurement of hemoglobin concentration and hematocrit and clinical exams. Overall, the low-cost and accurate HemoCueTM is the best machine available to test for anemia in most field settings. Clinical exams are useful to detect severe anemia among individuals, but are not used to detect the prevalence of anemia in a population. Measuring hematocrit requires transporting capillary blood samples to a laboratory and a cold chain. The logistics and expenses of this can often be prohibitive for many community-based projects especially in rural areas. The HemoCueTM is a portable battery-operated machine, which measures hemoglobin concentration using a capillary blood sample, which is low-cost and accurate. Moreover, the results of the test are immediately available to be communicated to the individual who was tested.


How to Assess Iron Deficiency Anemia and Use the HemoCueTM
iii
Acknowledgments
This publication was made possible through the generous support of the Office of Private and Voluntary Cooperation, Bureau for Humanitarian Response, and the Office of Health and Nutrition of the Bureau for Global Programs of the United States Agency for International Development.
The authors gratefully acknowledge the contributions of the following individuals. Please note that the organizational affiliations of the contributors correspond to the time period during which this manual was written.
We recognize the assistance of Dr. Jere Haas, Division of Nutritional Sciences, Cornell University; Dr. Douglas Taren, Health Sciences Center, University of Arizona, Tucson; and Dr. Louis Pizzarello, Helen Keller International, who served as Technical Advisors during the early development of this manual. We have adapted a standardization protocol developed by Dr. Haas to ensure the accuracy and reliability of anthropometric measurements. We have modified checklists developed by Dr. Taren on the safety and use of the HemoCue? . Mr. Ibrahim Parvanta, also provided extensive advice in the development of this manual based on his experience training professionals and implementing surveys using the HemoCue? for the United States Centers for Disease Control and Prevention.
We also acknowledge the contributions of the following individuals and organizations who tested various protocols in the field that appear in the manual: Dr. Luis Benavente, Dr. Judiann McNulty, and the Project HOPE staff in Tarapoto, Peru; Dr. David Marsh, Ms. Karen Waltensperger, and the Save The Children staff in Nacala A Velha, Mozambique; Islamic African Relief Agency staff in Timbuktu, Mali; and Dr. Lourdes Fidalgo and Ms. Sonia Khan of the Department of Nutrition, Ministry of Health, and field staff in Mozambique. We greatly appreciate the contributions of our Helen Keller International colleagues who assisted with the field testing: Ms. Lynnda Kiess, Mr. Mugo Muita, Mr. Chad MacArthur, Mr. Shawn Baker, Dr. Mohammed Ag Bendech, Ms. Erin Dusch, and Ms. Zeina Sifri.
We thank the following experts who extensively and carefully reviewed the final draft: Mr. Ibrahim Parvanta, United States Centers for Disease Control and Prevention; Dr. Suzanne Harris and Ms. Dotty Foote, Human Nutrition Institute, International Life Sciences Institute; Ms. Leslie Elder, World Bank; Dr. Luis Benavente, Project HOPE; and Dr. Ian Darnton-Hill, Helen Keller Worldwide. We appreciate the expert advice and comments during various stages of development of the manual of the following individuals: Dr. Anne Swindale, the Food and Nutrition Technical Assistance Project; Dr. Almaz Sharmanov, Macro International; Ms. Rae Galloway, World Bank; Mr. Ibrahim Parvanta; Dr. Luis Benavente, Dr. Louis Pizzarello, Ms. Erin Dusch, and Ms. Kirsten Laursen.
We also wish to thank Ms. Mary Lou Hemming, the HemoCueTM Sales Representative for the New York area, who first demonstrated to us how to use the HemoCueTM, for answering countless questions about the equipment and supplies and for facilitating Helen Keller International’s work in the field.
The original idea for a reference guide on assessing iron deficiency anemia for program managers of Child Survival projects resulted from an assessment conducted by

Acknowledgements
iv
Helen Keller International in 1996 to determine the needs of private voluntary organizations for tools to improve micronutrient interventions. We received valuable feedback on the use of the HemoCueTM from the participants of regional micronutrient workshops for private voluntary organizations held in Niamey, Johannesburg, Manila, and Managua in 1997; and the participants of a HemoCueTM training workshop for West African Ministry of Health officials held in Niamey in 1999. The analysis of existing information on iron deficiency was presented at a meeting for private voluntary organizations held in Atlanta in 1997. The standardization protocol was presented at the International Nutritional Anemia Consultative Group Symposium held in Durban, South Africa, in 1999.
Any remaining errors are our own.
This manual was developed with support from the United States Agency for International Development, contract numbers FAO-0500-A-00-6001-00 and HRN-A-00-98-00013-00.

How to Assess Iron Deficiency Anemia and Use the HemoCueTM
a
Table of Contents
Chapter I: Why is Iron Deficiency a Public Health Problem? ............................................1
1 What are iron deficiency and iron deficiency anemia?...............................................1
2.What causes iron deficiency? ......................................................................................1 2.1. What diets are low in iron? ................................................................................1 2.2. What parasitic infections contribute to iron deficiency? ...................................4 2.3. What factors increase iron needs of women of reproductive age? ....................5 2.4. What factors increase iron needs during childhood? .........................................6
3.How many people are affected by iron deficiency anemia? .......................................7
4.What other factors contribute to anemia? ...................................................................7
5.What are the consequences of iron deficiency? ..........................................................9 5.1. How does iron deficiency anemia affect maternal and infant mortality? ..........9 5.2. How does iron deficiency anemia affect learning? ..........................................10 5.3. How does iron deficiency anemia affect labor productivity? ..........................11
Chapter II: What is the Extent of Iron Deficiency Anemia in a Given Project Area? .......15
1. How is iron deficiency as a public health problem defined? ....................................15
2. Where do I find existing information on iron deficiency anemia in a given project area? ..............................................................................................................19 Step 1. Check World Health Organization or United Nations Children’s Fund
data on the prevalence of anemia among pregnant women in the country where the project is located ..........................................................19
Step 2. Consult with international and national experts to obtain recent information on iron deficiency anemia in the country where the project is located ....................................................................................................20
Step 3. Collect case evidence about anemia in the project area.............................22 Step 4. Find out about local knowledge of anemia, supplement use, and beliefs
about blood collection................................................................................22 Step 5. Collect information on factors that influence iron deficiency ...................22
3. How many people are affected by iron deficiency anemia? .....................................24
Chapter III: How Do I Conduct an Anemia Survey? ..........................................................27
1. What method should I use to measure the prevalence of anemia? ...........................27
2. What should the sample size be? ..............................................................................29
3. What is included in a survey plan? ...........................................................................30 Step 1. Define the target groups .............................................................................30 Step 2. Define the survey area................................................................................32 Step 3. Determine when to conduct the survey......................................................33 Step 4. Develop a sampling plan to select communities, households, and target
group .........................................................................................................34
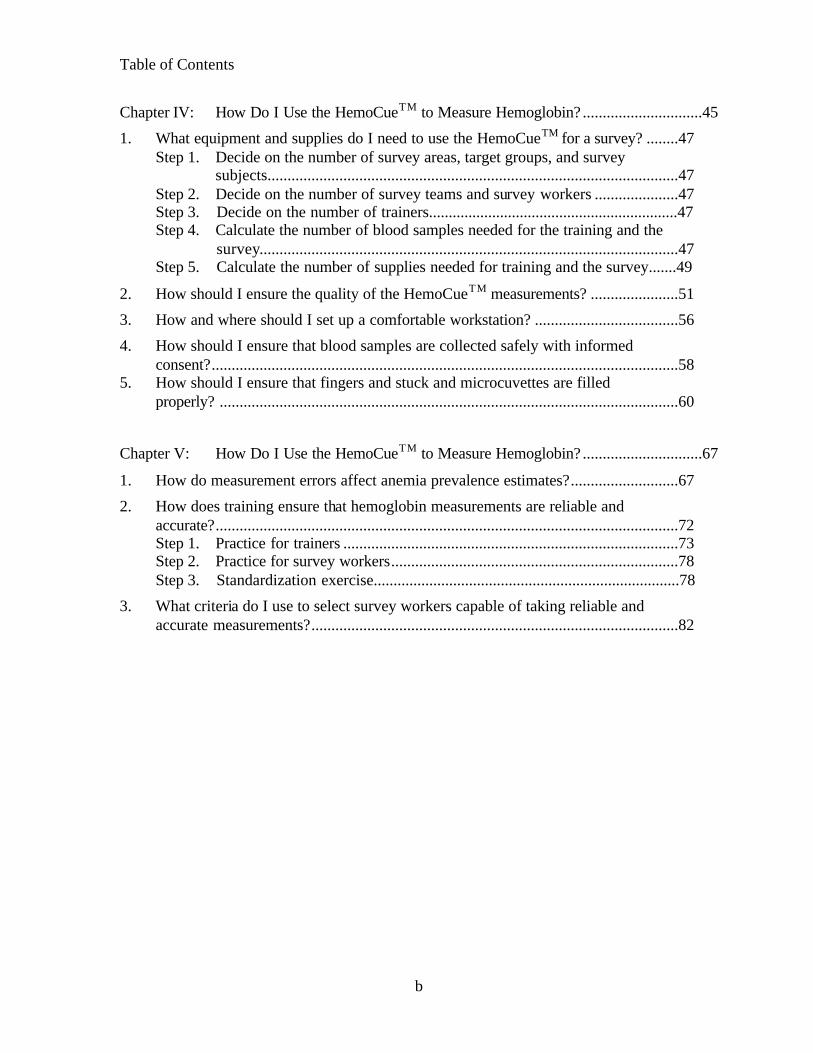
Table of Contents
b
Chapter IV: How Do I Use the HemoCueTM to Measure Hemoglobin? ..............................45
1. What equipment and supplies do I need to use the HemoCueTM for a survey? ........47 Step 1. Decide on the number of survey areas, target groups, and survey
subjects.......................................................................................................47 Step 2. Decide on the number of survey teams and survey workers .....................47 Step 3. Decide on the number of trainers...............................................................47 Step 4. Calculate the number of blood samples needed for the training and the
survey.........................................................................................................47 Step 5. Calculate the number of supplies needed for training and the survey.......49
2. How should I ensure the quality of the HemoCueTM measurements? ......................51
3. How and where should I set up a comfortable workstation? ....................................56
4. How should I ensure that blood samples are collected safely with informed consent?.....................................................................................................................58
5. How should I ensure that fingers and stuck and microcuvettes are filled properly? ...................................................................................................................60
Chapter V: How Do I Use the HemoCueTM to Measure Hemoglobin? ..............................67
1. How do measurement errors affect anemia prevalence estimates?...........................67
2. How does training ensure that hemoglobin measurements are reliable and accurate?....................................................................................................................72 Step 1. Practice for trainers ....................................................................................73 Step 2. Practice for survey workers........................................................................78 Step 3. Standardization exercise.............................................................................78
3. What criteria do I use to select survey workers capable of taking reliable and accurate measurements?............................................................................................82
How to Assess Iron Deficiency Anemia and Use the HemoCueTM
c
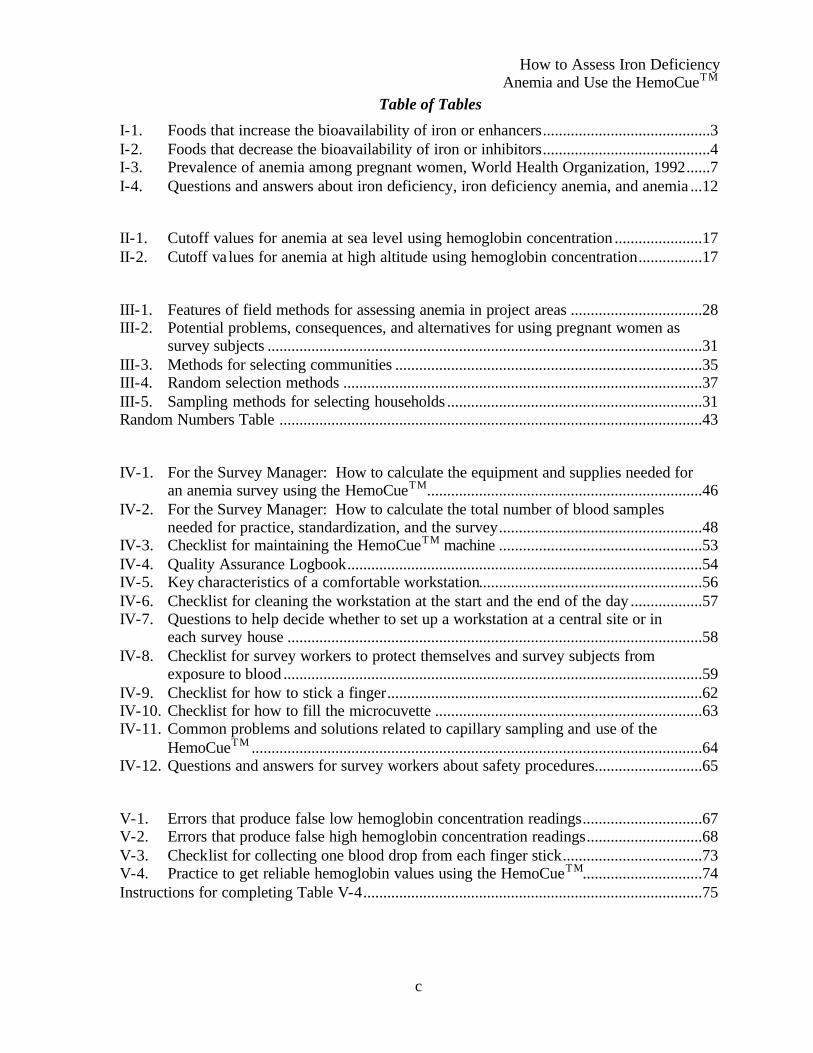
Table of Tables
I-1. Foods that increase the bioavailability of iron or enhancers..........................................3 I-2. Foods that decrease the bioavailability of iron or inhibitors..........................................4 I-3. Prevalence of anemia among pregnant women, World Health Organization, 1992......7 I-4. Questions and answers about iron deficiency, iron deficiency anemia, and anemia ...12
II-1. Cutoff values for anemia at sea level using hemoglobin concentration ......................17 II-2. Cutoff values for anemia at high altitude using hemoglobin concentration................17
III-1. Features of field methods for assessing anemia in project areas .................................28 III-2. Potential problems, consequences, and alternatives for using pregnant women as
survey subjects .............................................................................................................31 III-3. Methods for selecting communities .............................................................................35 III-4. Random selection methods ..........................................................................................37 III-5. Sampling methods for selecting households ................................................................31 Random Numbers Table ..........................................................................................................43
IV-1. For the Survey Manager: How to calculate the equipment and supplies needed for an anemia survey using the HemoCueTM.....................................................................46
IV-2. For the Survey Manager: How to calculate the total number of blood samples needed for practice, standardization, and the survey...................................................48
IV-3. Checklist for maintaining the HemoCueTM machine ...................................................53 IV-4. Quality Assurance Logbook.........................................................................................54 IV-5. Key characteristics of a comfortable workstation........................................................56 IV-6. Checklist for cleaning the workstation at the start and the end of the day ..................57 IV-7. Questions to help decide whether to set up a workstation at a central site or in
each survey house ........................................................................................................58 IV-8. Checklist for survey workers to protect themselves and survey subjects from
exposure to blood .........................................................................................................59 IV-9. Checklist for how to stick a finger...............................................................................62 IV-10. Checklist for how to fill the microcuvette ...................................................................63 IV-11. Common problems and solutions related to capillary sampling and use of the
HemoCueTM .................................................................................................................64 IV-12. Questions and answers for survey workers about safety procedures...........................65
V-1. Errors that produce false low hemoglobin concentration readings..............................67 V-2. Errors that produce false high hemoglobin concentration readings.............................68 V-3. Checklist for collecting one blood drop from each finger stick...................................73 V-4. Practice to get reliable hemoglobin values using the HemoCueTM..............................74 Instructions for completing Table V-4.....................................................................................75

Table of Tables
d
V-5. Checklist for collecting two blood drops from each finger stick .................................77 V-6. Standardization exercise to get accurate and reliable hemoglobin values using the
HemoCueTM .................................................................................................................79 Instructions for completing Table V-6.....................................................................................80 V-7. Variances of the HemoCueTM measurements ..............................................................83 Instructions for completing Table V-7.....................................................................................84 V-8. Variances of the HemoCueTM measurements in Mozambique, 1998 ..........................86
Table of Examples
III-1. Simple random sampling .............................................................................................36 III-2.a. Proportional-to-population size sampling ....................................................................38 III-2.b. Proportional-to-population size sampling: Add population sizes ...............................39
IV-1. For the Survey Manager: How to calculate the total number of blood samples needed for practice, standardization, and the survey...................................................49
IV-2. For the Survey Manager: How to calculate the supplies needed for an anemia survey using the HemoCueTM (n=900) ........................................................................50
IV-3. Completed Quality Assurance Logbook ......................................................................55 IV-4. Informed consent for screening an adult for anemia....................................................61
V-1. Practice to get reliable hemoglobin values using the HemoCueTM..............................76 V-2. Practice to get reliable hemoglobin values using the HemoCueTM..............................78 V-3. Standardization exercise to get accurate and reliable hemoglobin values using the
HemoCueTM .................................................................................................................81 V-4. Variances of the HemoCueTM measurements ..............................................................85

How to Assess Iron Deficiency Anemia and Use the HemoCueTM
e
Table of Diagrams
I-1. Changes in iron stores and hemoglobin concentration during development of iron deficiency and iron deficiency anemia...........................................................................2
I-2. Primary cause of iron deficiency. ..................................................................................2 I-3. Diets that are low in iron. ...............................................................................................3 I-4. Parasites that cause blood loss and iron deficiency. ......................................................4 I-5. Factors that increase the need for iron among women of reproductive age. .................5 I-6. Factors that increase the need for iron among children. ................................................6 I-7. Factors other than iron deficiency that contribute to anemia.........................................8 I-8. Benefits of iron. ............................................................................................................10
II-1. Bell-shaped curve of hemoglobin concentration in a population of nonpregnant women who are not iron deficient................................................................................16
II-2. Distribution of hemoglobin concentration among children in Huallaga Valley Peru 1997 compared to WHO cutoffs for anemia........................................................18
II-3. Distribution of hemoglobin concentration among men, women, and children in Huallaga Valley Peru 1997. .........................................................................................19
III-1. Costs of equipment and supplies for using the HemoCueTM machine compared to the hematocrit to assess the prevalence of anemia in a field survey. ...........................29
III-2. Common factors that contribute to anemia among men in developing areas. .............32
IV-1. Example of acceptable ranges for different control microcuvettes measured with the corresponding HemoCueTM machine. ....................................................................52
V-1. Reliable measurements of hemoglobin concentration using the HemoCueTM, Mozambique 1998........................................................................................................68
V-2. Unreliable measurements of hemoglobin concentration using the HemoCueTM, Mozambique 1998........................................................................................................69
V-3. Distribution of hemoglobin concentration among preschool children (6-59 months) according to the reliability of the HemoCueTM measurements, Mozambique 1998........................................................................................................70
V-4. Inaccurate measurements of hemoglobin concentration using the HemoCueTM, Mozambique 1998........................................................................................................71
V-5. Distribution of hemoglobin concentration among adult men according to the accuracy of the HemoCueTM measurements, Mozambique 1998 ................................72
Table of Decision Trees
II-1. Do I need to collect more data about anemia? .............................................................25
III-1. Do I need to include men in the sample for an anemia survey? ..................................33

How to Assess Iron Deficiency Anemia and Use the HemoCueTM
Chapter I: Why Is Iron Deficiency a Public Health Problem? Iron deficiency is a public health problem because it is widespread, it has serious consequences including death, and it can be prevented and treated.
1. What are iron deficiency and iron deficiency anemia? Iron depletion is the first phase in the development of iron deficiency that leads to
anemia. As Diagram I-1 on the next page illustrates, in the first phases of iron deficiency the iron stores in the body are progressively depleted. Iron is essential to synthesize hemoglobin, which is a protein in the blood that transports oxygen. Once the body stores of iron are used up, an individual begins to produce less hemoglobin. This is the second phase of iron deficiency. As iron deficiency develops further, it progressively leads to anemia.1 As shown in the third phase, anemia is diagnosed when an individual’s hemoglobin concentration falls below a specific cutoff value. Iron deficiency anemia is a reduction in the amount of red blood cells, which is caused by a lack of iron and which decreases the amount of oxygen transported to the cells of the body. In an individual with iron deficiency anemia, red blood cells are generally smaller than normal (microcytic) and paler than normal (hypochromic). Iron deficiency is not clinically apparent until anemia is severe even though functional consequences might already exist.2 The main signs and symptoms of anemia are lethargy, fatigue, shortness of breath, and pallor of the skin and inner eyelid.
2. What causes iron deficiency? As shown in Diagram I-2 on the bottom of the following page, the two main factors
that contribute to iron deficiency are: (i) loss of red blood cells as a result of blood loss, and (ii) low iron intake. Certain parasitic infections (discussed in Section 2.2, page 4) cause blood loss that results in iron deficiency. The dietary intake of iron is especially critical during phases of the life cycle when the need for iron is high, such as infancy and early childhood and the adolescent growth spurt, and during pregnancy and lactation.
2.1. What diets are low in iron? The iron in foods is classified as either heme iron, which is found in meat, or
nonheme iron, which is found in eggs, dairy products, and plant foods. The bioavailability of iron in the diet is the proportion of the iron that is absorbed and used by the body. Heme iron is absorbed much more (fifteen to thirty-five percent) than nonheme iron (two to twenty percent).3 Individuals also tend to absorb more iron when they have low stores than when they have adequate stores. Even so, absorption of iron can be inadequate when the iron content of the diet is exceptionally low or when the cereal content of the diet is high and the consumption of meat is negligible as shown in Diagram I-3 on page 3.4
1

Chapter I: Why is Iron Deficiency a Public Health Problem?
Diagram I-1. Changes in iron stores and hemoglobin concentration during development of iron deficiency and iron deficiency anemia.5
Iron stores
Increasing depletion of iron
Anemia can be detected
Hemoglobin concentration
level for diagnosis of anemia
Phase I
Phase II
Iron stores become depleted
Hemoglobin concentration declines
Phase III
Diagram I-2. Primary causes of iron deficiency.
Loss of red blood cells
Low iron intake
+High iron needs
Iron deficiency
2
How to Assess Iron Deficiency Anemia and Use the HemoCueTM
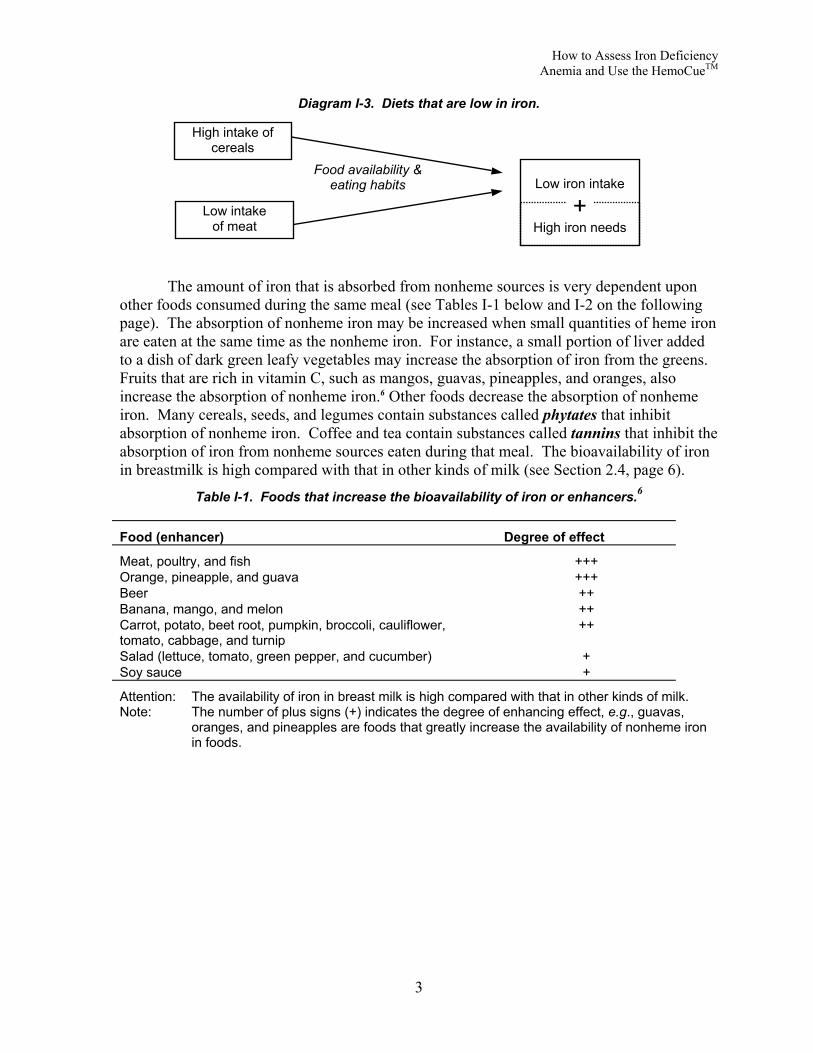
Diagram I-3. Diets that are low in iron.
Food availability & eating habits
Low intake of meat
High intake of cereals
Low iron intake
+High iron needs
The amount of iron that is absorbed from nonheme sources is very dependent upon other foods consumed during the same meal (see Tables I-1 below and I-2 on the following page). The absorption of nonheme iron may be increased when small quantities of heme iron are eaten at the same time as the nonheme iron. For instance, a small portion of liver added to a dish of dark green leafy vegetables may increase the absorption of iron from the greens. Fruits that are rich in vitamin C, such as mangos, guavas, pineapples, and oranges, also increase the absorption of nonheme iron.6 Other foods decrease the absorption of nonheme iron. Many cereals, seeds, and legumes contain substances called phytates that inhibit absorption of nonheme iron. Coffee and tea contain substances called tannins that inhibit the absorption of iron from nonheme sources eaten during that meal. The bioavailability of iron in breastmilk is high compared with that in other kinds of milk (see Section 2.4, page 6).
Table I-1. Foods that increase the bioavailability of iron or enhancers.6
Food (enhancer) Degree of effect
Meat, poultry, and fish +++ Orange, pineapple, and guava +++ Beer ++ Banana, mango, and melon ++ Carrot, potato, beet root, pumpkin, broccoli, cauliflower, tomato, cabbage, and turnip
++
Salad (lettuce, tomato, green pepper, and cucumber) + Soy sauce +
Attention: The availability of iron in breast milk is high compared with that in other kinds of milk. Note: The number of plus signs (+) indicates the degree of enhancing effect, e.g., guavas,
oranges, and pineapples are foods that greatly increase the availability of nonheme iron in foods.
3

Chapter I: Why is Iron Deficiency a Public Health Problem?
Table I-2. Foods that decrease the bioavailability of iron or inhibitors.6
Food (inhibitor) Degree of effect
Wheat bran and oats --- Tea and coffee --- Nuts and beans --- Soy protein --- Oregano --- Maize (tortilla, corn meal, and bran) --- Milk chocolate -- Milk and cheese -- Rice -- Eggs - Spinach -
Attention: The availability of iron in breast milk is high compared with that of other kinds of milk. Note: The number of minus signs (-) indicates the degree of inhibiting effect, e.g., tea and
coffee are foods that greatly decrease the availability of nonheme iron in foods.
2.2. What parasitic infections contribute to iron deficiency? Helminth (worm) infections contribute to iron deficiency among adults and children
as shown in Diagram I-4 below. Helminthes that cause the blood loss leading to iron deficiency include hookworm, schistosomiasis, and trichuriasis (whipworm).
Diagram I-4. Parasites that cause blood loss and iron deficiency. Hookworm,
schistosomiasis, & whipworm
Blood loss Loss of red blood cells
Hookworm infects 900 million people worldwide.7 Individuals are infected with hookworm when they walk barefoot on soil that has been contaminated with hookworm eggs where sanitation is poor. Hookworms attach to the wall of the intestine by teeth or cutting plates, causing blood loss from lesions and sucking.8
Schistosomiasis affects 200 million people worldwide, mostly in rural and agricultural areas.8 Individuals are infected with schistosomes when they stand or walk in water that has been contaminated with these parasites, usually as they carry out their daily activities, such as washing clothes, bathing, fishing, planting rice, or swimming. Schistosoma hematobium, which is common in Africa, causes blood loss in the urine. Schistosoma mansoni, which is common in Africa, the Middle East, and some countries in Latin America, causes blood loss in the stool. Schistosoma japonicum, which is present in China, the Philippines, and Indonesia, also causes blood loss in the stool.
Trichuris trichiura (whipworm) infects 500 million to one billion people, mainly in the tropics. Whipworm eggs are transmitted through contaminated food and soil. Trichuriasis causes blood loss and iron deficiency.8 In endemic areas, trichuriasis is usually most prevalent among children 5 to 14 years of age. Infections are associated with anemia due to damage to the wall of the intestines and possibly the worms sucking blood.
4

How to Assess Iron Deficiency Anemia and Use the HemoCueTM
2.3. What factors increase iron needs of women of reproductive age? Women need additional iron throughout pregnancy. Extra iron is needed for plasma
volume expansion, the placenta, and the transfer of iron to the fetus as shown in Diagram I-5 below. Even when the mother is iron deficient, iron will be preferentially transferred to the fetus. Some well-nourished women cannot meet their iron requirements during pregnancy while consuming a diet that includes fortified foods and highly bioavailable dietary iron; thus, the need for iron supplementation during pregnancy in both developed and developing countries. At the same time that the need for iron increases, pregnant women may be at higher risk for low iron intake than other members of the family because of food taboos during pregnancy.
Diagram I-5. Factors that increase the need for iron among women of reproductive age.
Blood loss
Intrahousehold food distribution
Pregnancy
Lactation > 6 months
Iron transferred to fetus
Menstruation/ hemorrhage
Iron transferred to breast milk
Low iron intake
+High iron needs
Taboos Pregnancy/ lactation
Low status of women
Loss of red blood cells
When not pregnant, about 10% of women of reproductive age are at risk of iron deficiency because of excessive blood loss during menstruation.9
This is not the case during the first six months of breastfeeding. Lactating women who are not already iron deficient are generally not at risk of developing iron deficiency.10 When women are breastfeeding frequently and exclusively, they are unlikely to menstruate. So they are protected from this loss of blood. The amount of iron that is transferred to breast milk during the first six months of lactation is about fourteen percent of an average woman’s iron stores. This is about half of what she would lose if she were menstruating.
Many women, however, are anemic after delivery. While they may not lose as much iron as they would if they were menstruating, they may still need additional iron to recover from depletion during pregnancy and to meet the additional needs for breastfeeding. Excessive blood loss at delivery (hemorrhage) can also contribute to the need for additional iron after pregnancy to replenish what has been lost from body iron stores.
When lactation continues beyond six months, women are at increased risk of developing iron deficiency even though their infants still need and benefit from the iron in breast milk. When lactating women do start to menstruate again, they need extra iron to replace both the losses during menstruation and the iron that is transferred to breast milk. If dietary iron intake is low, this places the mother at risk for iron deficiency.
5

Chapter I: Why is Iron Deficiency a Public Health Problem?
2.4. What factors increase iron needs during childhood? During childhood, inadequate intake of iron during periods of rapid growth is the
major cause of iron deficiency as shown in Diagram I-6 below.5 Infancy and early childhood is one period of rapid growth when the need for iron is great. Adolescence is another period of rapid growth when iron needs are dramatically increased.
Diagram I-6. Factors that increase the need for iron among children.
Low intake of iron-rich complementary foods
Infancy & early childhood
Rap
Adolescence
Low iron sPrematurity
The two main sources oduring the last trimester of pregbirth. Premature infants are at time to store an adequate amouinfant has inadequate iron storelast for the recommended six mPremature infants also need mo
Full-term infants are rarduring pregnancy.11 This is becmother is iron deficient. Neverassociated with an increased ris
Among full-term infantsbreast milk and iron stores are gof the iron in breast milk is absother milks or breast milk substinfluenced by maternal iron staat risk for iron deficiency at a yintroduction of iron-rich complrisk of iron deficiency.
When complementary fmay be displaced by a diet that complementary foods such as cyoung children are poor sourcemore years old does help protec
Lack of availability
TaboosLate intr
Growth spu
id growth
tores
f iron for infannancy and therisk for iron dent of iron durins at birth, breaonths even thore iron becaus
ely born anemause iron is actheless, anemik of prematuri
who are exclenerally adeq
orbed compareitutes.12 The itus. Infants wounger age thaementary food
oods are introdis not rich in hereal porridges of iron. Cont them from ir
Intrahousehold fooddistribution
oduction Low iron intake
+High iron needs
rt
ts are the iron that is acquired and stored iron that is ingested through breast milk after ficiency anemia because there is not enough g the last trimester of pregnancy. When an
st milk alone will not provide sufficient iron to ugh the iron in breast milk is readily absorbed. e they grow faster than term infants.
ic, even when their mothers were anemic tively transferred to the fetus even when the
a during pregnancy has been shown to be ty, low birth weight, and infant mortality.9
usively or predominantly breastfed, the iron in uate for about six months. About fifty percent d with about fourteen percent of the iron in ron concentration of breast milk is not ho are fed canned, powdered, or fresh milks are n infants who are exclusively breastfed. If s is delayed beyond six months, infants are at
uced at about six months of age, breast milk ighly bioavailable iron. Many of the
s or mashed bananas that are fed to infants and tinued breastfeeding until children are two or on deficiency because they continue to receive
6

How to Assess Iron Deficiency Anemia and Use the HemoCueTM
the readily absorbed iron from breast milk. Where iron-fortified complementary foods are not widely and regularly consumed by young children, routine iron supplementation is recommended beginning at six months.2
Adolescents are also at risk of iron deficiency if the diet is low in iron because they need extra iron for the growth spurt they undergo during this period. Anemia is highly prevalent among both adolescent boys and adolescent girls in developing countries.13 Adolescent girls need less iron than boys for their growth spurt5, but need more iron than boys to compensate for blood lost during menstruation.
3. How many people are affected by iron deficiency anemia? Iron deficiency is the most widespread nutritional problem in the world. More than
two billion people are estimated to suffer from iron deficiency, mostly in developing countries.14 The prevalence of anemia is commonly used to assess the severity of iron deficiency in a population. However, the assumption that iron deficiency is the main cause of anemia throughout the developing world is not certain where there are other contributing factors (discussed in Section 4, pages 7-9).14
In 1992, the World Health Organization (WHO) estimated that the prevalence of anemia among pregnant women was sixty percent in Asia, fifty-two percent in Africa, and thirty-nine percent in Latin America.15 The subregional prevalences are listed in Table I-3 below. The prevalence of anemia is, generally, ten to fifteen percent lower among women who are not pregnant than among women who are pregnant. The prevalence of anemia among preschool-aged children tends to be similar to that among pregnant women.
Table I-3. Prevalence of anemia among pregnant women, World Health Organization, 1992.16
Asia* Africa Latin America
Subregion Prevalence (%)
Subregion Prevalence (%)
Subregion Prevalence (%)
Overall 60 Overall 52 Overall 39 East 37 East 47 Caribbean 52 Southeast 63 Central 54 Central 42 South 75 North 53 South 37 West 50 Southern 35 West 56
* Excluding Japan, Australia, and New Zealand.
Iron deficiency is more widespread than iron deficiency anemia. For every person who is anemic, there is likely to be another person who is iron deficient, but not anemic. In other words, if the prevalence of anemia is fifty percent or more, the entire target population is likely to be iron deficient and in need of an iron intervention.16
4. What other factors contribute to anemia? There are other factors that contribute to anemia besides iron deficiency. These are
malaria, other nutrient deficiencies, and inherited hemoglobinapathies (a disorder of abnormal hemoglobin in the red blood cells) such as sickle cell anemia and thalassemia, as shown in Diagram I-7 on the following page. Additional laboratory tests and clinical
7

Chapter I: Why is Iron Deficiency a Public Health Problem?
histories are needed to distinguish these causes of anemia from iron deficiency. These tests will not be discussed in this reference guide. Because other nutrient deficiencies and malaria often are found concurrent with iron deficiency, this distinction may not be important for primary health care programs except to recognize that interventions to reduce anemia due to other causes, particularly malaria, are important in reducing the prevalence of anemia.2 Furthermore, the existence of several causes of anemia in a population increases the severity of anemia.
Diagram I-7. Factors other than iron deficiency that contribute to anemia.
Malaria
Hemoglobinopathies
Deficiencies in vitamin B12, folic acid, & vitamin A
Anemia
Every year, there are an estimated 300-500 million cases of malaria and over one million malaria deaths.17 Eighty-five percent of malaria deaths occur in Sub-Saharan Africa. Malaria is transmitted from person to person through the bite of an infected mosquito.
In endemic areas, malaria has been found to be associated with anemia that is not believed to be primarily due to iron deficiency.2 Malaria contributes to anemia by infecting and destroying red blood cells. Malaria also suppresses the synthesis of red blood cells in the bone marrow. Moreover, malarial parasites use iron for their own metabolism.18,19 The placenta tends to be heavily infected by malaria parasites during first pregnancies.20 When infection is severe among children, women in their first pregnancies, and school-age children, the association between malaria and iron deficiency anemia is particularly strong.21 Treatment of malaria has been shown to decrease anemia among children with malaria in Kenya and Malawi.22
Beyond iron deficiency, the nutritional factors that contribute to anemia other than iron deficiency are folic acid (folate), vitamin B12, and vitamin A deficiencies. Folic acid and vitamin B12 deficiencies cause megaloblastic anemia. In megaloblastic anemia, a late consequence of these deficiencies, red blood cells larger than normal and less abundant.
To support rapid growth, folate requirements increase in pregnancy. Megaloblastic anemia due to folate deficiency is most common during the third trimester of pregnancy. Megaloblastic anemia has been linked to an increased incidence of low birth weight and prematurity in India and South Africa.23 Folate deficiency during the periconceptual period is associated with birth defects called neural tube defects. The neural tube develops between 17 and 30 days of gestation, which is often before women know for sure that they are pregnant. Since the defect occurs before women know they are pregnant, women of reproductive age are advised to eat generous amounts of folate-rich foods, such as liver and other organ meats and fresh green vegetables because folate can be destroyed by prolonged cooking and by food processing. Cereal products are also fortified with folate in the United States. The United States Centers for Disease Control and Prevention now recommends that
8

How to Assess Iron Deficiency Anemia and Use the HemoCueTM
all women of reproductive age consume 400 µg of folate/day. The International Nutritional Anemia Consultative Group (INACG), WHO, and the United Nations Children’s Fund (UNICEF) recommend supplementation during pregnancy with 400 µg folate/day, along with 60 mg iron/day.2
Mild to moderate vitamin B12 deficiency has been recently reported to be widespread among women and children in rural Mexico.24 As discussed above, vitamin B12 deficiency causes megaloblastic anemia indistinguishable from that of folate deficiency. For this reason, folate supplementation can mask symptoms of vitamin B12 deficiency. Since severe vitamin B12 deficiency results in damage to the nervous system, supplementation with folic acid may mask serious problems. The recommended level of folate supplementation, however, is low enough so that it should not mask vitamin B12 deficiency.25 Vitamin B12 is only found in animal foods and microorganisms. Legumes and some forms of seaweed that contain microorganisms may contain vitamin B12. Deficiency may develop slowly over many years among vegetarians. Malabsorption is also a cause of vitamin B12 deficiency.
Vitamin A deficiency is a major public health problem in many areas of the world. While vitamin A deficiency is known to be highly prevalent among preschool children, the public health importance of vitamin A deficiency among pregnant women is increasingly being recognized. In some areas, the prevalence of night blindness among pregnant women has been found to be higher than the prevalence of night blindness among preschool children.26 Studies among pregnant women in Indonesia and of children in Guatemala showed an improvement in hemoglobin concentration of 0.4-0.6 g/dl in the group supplemented for two months with low doses of vitamin A (1,500-2,400 µg Retinol Equivalents/day) compared to the unsupplemented group.27 Iron supplements in addition to vitamin A supplements improved iron status even further.
5. What are the consequences of iron deficiency? Iron deficiency is not clinically apparent until anemia is severe even though
functional consequences may already exist.2 Anemia leads to a reduction in the transport of oxygen to the cells of the body. The main signs and symptoms of anemia are lethargy, fatigue, shortness of breath, and pallor of the skin and inner eyelid. When anemia is moderate to severe, the nail beds of the fingers, the palms, and the inside of the eyelids become pale.28 As anemia becomes more severe, anemic individuals may experience palpitations of the heart and heart failure.
In terms of public health, the consequences of severe anemia (with or without iron deficiency) are increased maternal and child mortality.29 A significant body of evidence also points to iron deficiency anemia (tissue iron deficiency) leading to impaired productivity and delayed child development. More evidence is needed in support of the suspected relationships between iron deficiency anemia and low birth weight and between iron deficiency anemia and infectious disease.
5.1. How does iron deficiency anemia affect maternal and infant mortality? Severe anemia among both women and infants is associated with an increased risk of
death. Because anemia generally worsens during pregnancy, even to the point of severe anemia, it is a cause of maternal mortality as shown in Diagram I-8 on the following page. In
9

Chapter I: Why is Iron Deficiency a Public Health Problem?
addition, anemia may be an underlying cause of maternal deaths that may not always be recognized in cases when the pregnancy or delivery increases the severity of anemia to the point that death occurs. One-quarter of maternal deaths in developing countries are due to indirect or underlying causes. The added stress of labor and complications along with severe anemia may cause the heart to be so starved of oxygen that it fails. Hemorrhage at delivery may be particularly dangerous for severely anemic women because they have less tolerance for blood loss. Hemorrhage accounts for twenty-eight percent of all obstetric deaths in developing countries. Further research might provide more clarity on whether the decrease in immune function associated with anemia might also contribute to maternal infections. Infections cause eleven percent of all maternal deaths in developing countries.30 Severe anemia during pregnancy has also been shown to increase the risk of infant mortality.31
Diagram I-8. Benefits of iron.
Increased capacity for
Improved capacity for
Iron
Increasedmaternalsurvival
5.2. HoInfant
development emotional statheir mothers.lack of interacwithout anem
Becauinfants and chdevelopmentaold may includelays in menhave not been
Amonshown to be awith attentioneliminate thes
Less severe anemia
Increased capacity to generate
income
physical worklearning
Increased infant survival
w does iron deficiency anemia affect learning? s with iron deficiency anemia have been shown to experience delays in mental compared to infants who are not anemic.32 Iron deficiency also affects the te of infants, making them more cautious and maintaining closer contact with 33 These infants may interact to a lesser degree with their environment, and the tion could impede their ability to learn. Among infants, iron deficiency
ia has not been associated with any developmental delays.33
se most brain development after birth occurs during the first two years of life, ildren younger than two years old are believed to be at higher risk of l delays than older children. Delays among children younger than two years de both mental and motor development. With the exception of one study, tal development observed in infants and toddlers with iron deficiency anemia shown to be fully reversed after the children were treated with iron.34
g preschool children (two to five years old) iron deficiency anemia has been ssociated with difficulty in discriminating between visually similar objects and span. Effective iron supplementation interventions have been shown to e learning problems.33 Among primary school children and adolescents (six
10

How to Assess Iron Deficiency Anemia and Use the HemoCueTM
years old and older) iron deficiency anemia has been associated with poor school achievement. Supplementation has been show to improve school measurements of verbal and other skills among these older children.
In addition, if anemic children are exposed to lead, they are at higher risk of lead poisoning than nonanemic children, as iron deficiency increases the absorption of metals including lead. Lead poisoning can cause irreversible neurological damage and learning and behavioral problems such as reduced intelligence, shortened attention span, and hyperactivity. Lead exposure is an increasing problem in urban areas in developing countries and near lead-related industries (e.g., gasoline, paint, plumbing, food cans, ceramic glaze, cosmetics) due to inadequately controlled industrial and vehicle emissions and unregulated cottage industries.35 Children may chew on objects that are covered with dust and soil containing lead. Lead poisoning can also occur by breathing lead in the air or by drinking contaminated water or eating contaminated food. Lead also crosses the placenta and is toxic for fetuses.2
5.3. How does iron deficiency anemia affect labor productivity? Mild to moderate iron deficiency anemia hinders the ability to carry out physical
work because energy use by the muscles is adversely affected. Numerous studies of male workers and a few studies of female workers have shown that iron deficiency anemia is associated with reduced physical work capacity. One study of female tea plantation workers who were anemic and received iron supplements showed that they were significantly more productive than anemic female workers who did not receive iron supplementation.36 This has important implications for economic development because a large proportion of both men and women living in poverty in developing countries devote long hours to physically demanding work, including, for women, farming, gardening, collecting water, gathering firewood, preparing food, and caring for young children. In addition, many of the jobs that provide cash income in developing countries are physically demanding.
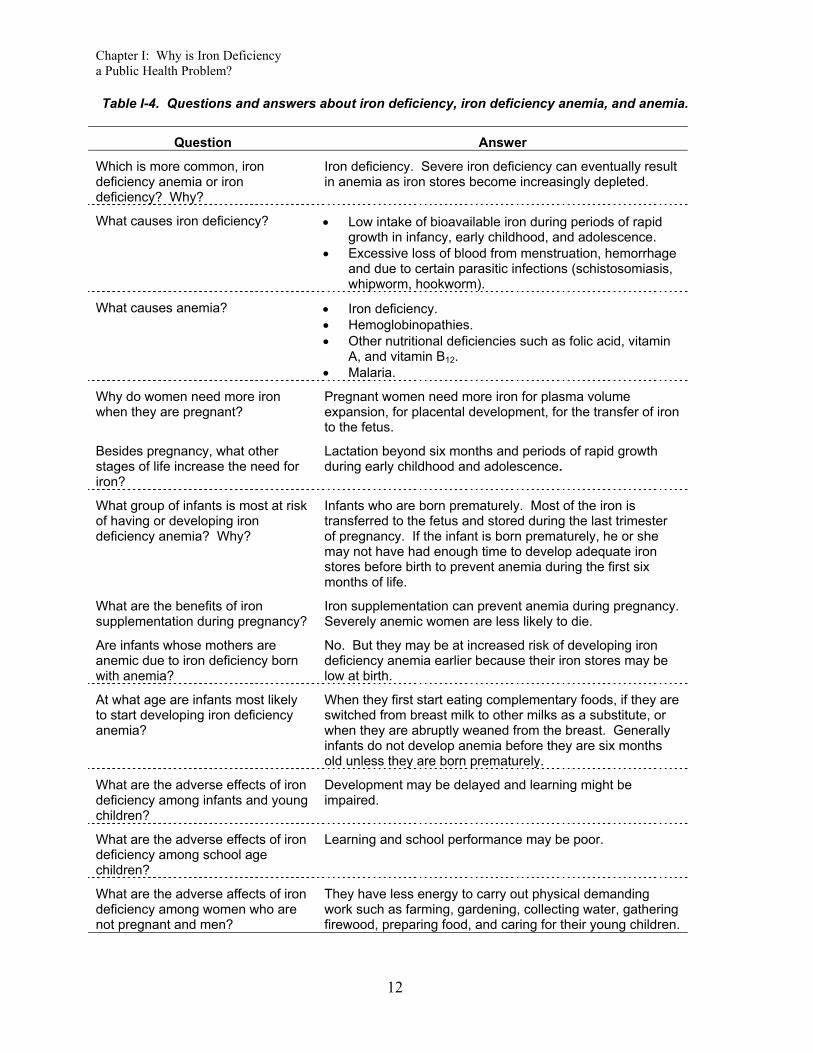
Table I-4 on the following page includes questions and answers about iron deficiency, iron deficiency anemia, and anemia, that summarize the key information in this chapter.
11
Chapter I: Why is Iron Deficiency a Public Health Problem?
12
Table I-4. Questions and answers about iron deficiency, iron deficiency anemia, and anemia.
Question Answer
Which is more common, iron deficiency anemia or iron deficiency? Why?
Iron deficiency. Severe iron deficiency can eventually result in anemia as iron stores become increasingly depleted.
What causes iron deficiency? • Low intake of bioavailable iron during periods of rapid growth in infancy, early childhood, and adolescence.
• Excessive loss of blood from menstruation, hemorrhage and due to certain parasitic infections (schistosomiasis, whipworm, hookworm).
What causes anemia? • Iron deficiency. • Hemoglobinopathies. • Other nutritional deficiencies such as folic acid, vitamin
A, and vitamin B12. • Malaria.
Why do women need more iron when they are pregnant?
Pregnant women need more iron for plasma volume expansion, for placental development, for the transfer of iron to the fetus.
Besides pregnancy, what other stages of life increase the need for iron?
Lactation beyond six months and periods of rapid growth during early childhood and adolescence.
What group of infants is most at risk of having or developing iron deficiency anemia? Why?
Infants who are born prematurely. Most of the iron is transferred to the fetus and stored during the last trimester of pregnancy. If the infant is born prematurely, he or she may not have had enough time to develop adequate iron stores before birth to prevent anemia during the first six months of life.
What are the benefits of iron supplementation during pregnancy?
Iron supplementation can prevent anemia during pregnancy. Severely anemic women are less likely to die.
Are infants whose mothers are anemic due to iron deficiency born with anemia?
No. But they may be at increased risk of developing iron deficiency anemia earlier because their iron stores may be low at birth.
At what age are infants most likely to start developing iron deficiency anemia?
When they first start eating complementary foods, if they are switched from breast milk to other milks as a substitute, or when they are abruptly weaned from the breast. Generally infants do not develop anemia before they are six months old unless they are born prematurely.
What are the adverse effects of iron deficiency among infants and young children?
Development may be delayed and learning might be impaired.
What are the adverse effects of iron deficiency among school age children?
Learning and school performance may be poor.
What are the adverse affects of iron deficiency among women who are not pregnant and men?
They have less energy to carry out physical demanding work such as farming, gardening, collecting water, gathering firewood, preparing food, and caring for their young children.

How to Assess Iron Deficiency Anemia and Use the HemoCueTM
13
1 International Nutritional Anemia Consultative Group. Guidelines for the Eradication of Iron Deficiency
Anemia. Washington, DC, 1977. 2 Stoltzfus RJ, ML Dreyfuss. Guidelines for the Use of Iron Supplements to Prevent and Treat Iron
Deficiency Anemia. International Nutritional Anemia Consultative Group. Washington, DC: International Life Sciences Institute Press, 1998.
3 Monsen ER Iron nutrition and absorption: Dietary factors which impact iron bioavailability. Journal of the American Dietetic Association, 88, 7, 1988.
4 Fairbanks VF. Iron in medicine and nutrition. In: Shils ME, JA Olson, M Shike (eds). Modern Nutrition in Health and Disease. 8th Edition. Philadelphia: Lea and Febiger, 1994.
5 Adapted from: International Nutritional Anemia Consultative Group. Guidelines for the Eradication of Iron Deficiency Anemia. Washington, DC, 1977.
6 Fairweather SJ. Bioavailability of iron. In: Opportunities for Micronutrient Interventions. Iron Interventions for Child Survival. Conference Proceedings, May 17-18, 1995.
7 World Health Organization. Report on Hookworm Infection and Anemia in Girls and Women. Geneva: Programme of Intestinal Parasitic Infections, 1994.
8 Stephenson LS. The Impact of Helminth Infections on Human Nutrition. London: Taylor and Francis, 1987.
9 United States Institute of Medicine. Nutrition During Pregnancy. Washington, DC: National Academy Press, 1990.
10 United States Institute of Medicine. Nutrition During Lactation. Washington, DC: National Academy Press, 1991.
11 Hytten FE, G Chamberlain (eds). Placental transfer. In: Clinical Physiology in Obstetrics. Oxford: Blackwell Scientific Publications, 1980.
12 Dallman PR, MA Siimes, A Stekel. Iron deficiency in infancy and childhood. American Journal of Clinical Nutrition, 32, 86-118, 1980.
13 Kurz K. Adolescent nutritional status in developing countries. Proceedings of the Nutrition Society, 55, 321-331, 1996.
14 United Nations Administrative Committee on Coordination Sub-Committee on Nutrition. Fourth Report on The World Nutrition Situation. Geneva, 2000.
15 World Health Organization. The Prevalence of Anaemia in Women. Geneva: Maternal Health and Safe Motherhood Programme, 1992.
16 Yip R. Iron deficiency: Contemporary scientific issues and international programmatic approaches. Journal of Nutrition, 124, 1479S-1490S, 1994.
17 World Health Organization. Roll Back Malaria Workshop Report, June 30, 2000.
18 Brabin BJ. The role of malaria in nutritional anemias. In: Fomon SF, S Zotkin (eds). Nutritional Anemias. Nestle Nutrition Workshop Series, Volume 30. New York: Vevey/Raven Press, 1992.
19 Matteelli A, F Donato, A Shein, JA Muchi, O Leopardi, L Astori, G Carosi. Malaria and anaemia in pregnant women in urban Zanzibar, Tanzania. Annals of Tropical Medicine and Parasitolog, 88, 5, 475-482, 1994.
20 Schulze KJ, RJ Stoltzfus, HM Chwaya, M Albonico. Performance of iron deficiency indicators in a holoendemic population. The FASEB Journal Abstracts. Abstract 4212, 1996.
21 Menendez C. Malaria and Anemia. In: Opportunities for Micronutrient Interventions. Iron Interventions for Child Survival. Conference Proceedings, May 17-18, 1995.

Chapter I: Why is Iron Deficiency a Public Health Problem?
14
22 Bloland PB, EM Lackritz, PN Kazembe, JBO Were, R Steketee, CC Campbell. Beyond chloroquine:
implications of drug resistance for evaluating malaria therapy efficacy and treatment policy in Africa. Journal of Infectious Diseases, 167, 932-937, 1993.
23 Bailey L. Folate in Health and Disease. New York: Marcel Dekker, 1995. 24 Allen L, J Rosado, J Casterline, H Martine, P Lopez, E Munoz, A Black. Vitamin B12 deficiency and
malabsorption are highly prevalent in rural Mexican communities. American Journal of Clinical Nutrition, 62, 5, 1013-1019, 199.
25 Allen L. (University of California, Davis). Personal communication, 1997. 26 Christian P, KP West, SK Khatry, LE Pradhan, LeClerq, RJ Stoltzfus, K Katz, ME Bentley, SR Shrestha.
Night blindness during pregnancy in Nepal: Links to nutrition and health. The FASEB JournalAbstracts, Abstract 1417, 1996.
27 Sommer A, KP West. Vitamin A Deficiency: Health, Survival, and Vision. New York: Oxford University Press, 1996.
28 Dusch E, R Galloway, E Achadi, I Jusa’at, C Sibale, C Franco, S Cousens, L Morison. Clinical screening may be a cost-effective way to screen for severe anemia. Food and Nutrition Bulletin, 20, 4, 409-416, 1999.
29 Beard J, RJ Stolzfus (eds). Iron-deficiency anemia: Reexamining the nature and magnitude of the public health problem. Journal of Nutrition. 131. 2S-II. 2001.
30 Maine D. Safe Motherhood Programs, Options and Issues. New York: Center for Population and Family Health, Columbia University, 1991.
31 Stolzfus RJ. 2001. Summary. Implications for research and programs. In: Bear J, and Stolzfus RJ (eds). Iron-defeciency anemia: Reexamining the nature and magnitude of the public health problem. Journal of Nutrition, 131, 2S-11, 697S, 2001.
32 Pollitt E. Iron deficiency and cognitive function. Annual Review of Nutrition. 13, 521-537, 1993. 33 Draper A. Child Development and Iron Deficiency: Early Action is Critical for Healthy Mental, Physical,
and Social Development. Rosslyn, VA: United States Agency for International Development, Partnership for Child Development, International Life Sciences Institute, Opportunities for Micronutrient Interventions, 1997.
34 Pollitt E. Early iron deficiency anemia and later mental retardation. American Journal of Clinical Nutrition, 69, 4-5, 1999.
35 Alliance to End Childhood Lead Poisoning. The Global Dimensions of Lead Poisoning. Washington, DC, 1994.
36 Leslie J. Improving the Nutrition of Women in the Third World. In: Pinstrup-Andersen P, D Pelletier, H Alderman (eds). Child Growth and Nutrition in Developing Countries. London: Cornell University Press, 1995.

How to Assess Iron Deficiency Anemia and Use the HemoCueTM
Chapter II: What is the Extent of Iron Deficiency Anemia in a Given Project Area?
Iron deficiency anemia is a major public health problem in virtually every country in the world, even in developed countries. Before developing an intervention to reduce iron deficiency anemia in a given project area, it is important to determine the extent of iron deficiency anemia in that area. Documenting the prevalence of anemia and the contribution of factors in the population that cause anemia is important not only in planning, evaluating, and justifying iron interventions, but also because it may help in securing funding. The assessment should be based on information that is already available and/or on new survey data that are collected on how many people are affected.
1. How is iron deficiency anemia as a public health problem defined?
The prevalence of anemia serves as an indicator of the magnitude of iron deficiency anemia in the population. The standard tests for anemia are measurement of hemoglobin concentration and hematocrit (measurement of packed cell volume). Hemoglobin concentration can be measured in a capillary blood sample by a portable battery-operated photometer called the HemoCue. The HemoCue measures the absorption of hemoglobin after conversion to hemiglobinazide by reagents present in special microcuvettes used with the photometer. Hematocrit is the ratio of the volume of red blood cells to total blood volume. This ratio is determined by centrifuging a capillary blood sample in a capillary tube, separating the red blood cells from plasma.
Where resources are available to collect and analyze other biochemical measurements of iron status, the following indicators can provide additional evidence that anemia is due iron deficiency. Even before anemia occurs, serum ferritin declines in response to depletion of iron stores. However, infections or inflammation can elevate serum ferritin values to normal or higher than normal levels in someone who is iron deficient. As anemia develops transferrin saturation drops, and free erythrocyte protoporphyrin rises. These additional indicators will not be discussed here because assessment at this level is generally beyond the scope of Child Survival projects. For further information on a variety of laboratory tests that can be used for assessment of iron deficiency and low iron stores see Anemia Detection in Health Services, Guidelines for Program Managers, 1996, Program for Appropriate Technology in Health, Seattle, Washington (www.path.org).
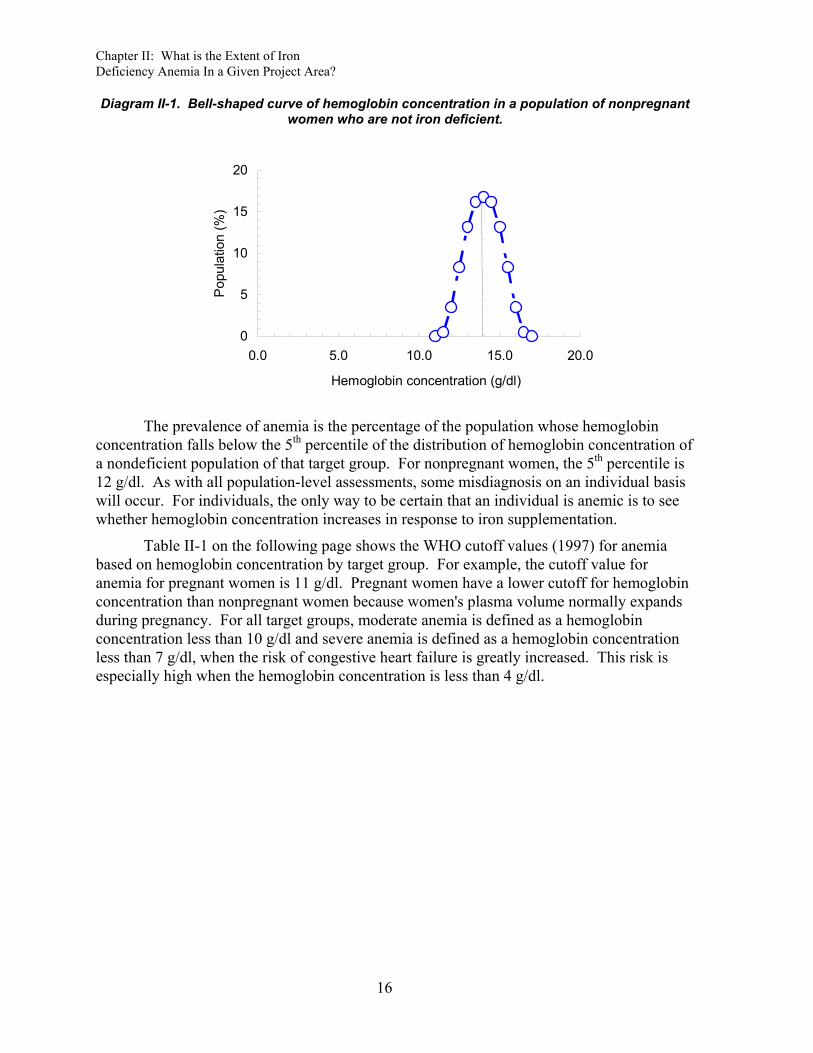
There is no specific hematocrit or hemoglobin value that is "normal" for all individuals. A group of individuals who are not iron deficient will have a range of hemoglobin concentrations from very low to very high. Most individuals, however, will have hemoglobin concentrations that are somewhere in the middle of the distribution. A distribution curve (such as Diagram II-1 on the following page) shows the frequency of the population that falls within increments of a measurement. In this case, the distribution curve depicts the frequency of hemoglobin concentrations that fall within increments of 0.5 g/dl for a population of women who are not pregnant and not iron deficient. This type of distribution is known as a bell-shaped curve, which is symmetrical.
15
Chapter II: What is the Extent of Iron Deficiency Anemia In a Given Project Area?
Diagram II-1. Bell-shaped curve of hemoglobin concentration in a population of nonpregnant women who are not iron deficient.
0
5
10
15
20
0.0 5.0 10.0 15.0 20.0
Hemoglobin concentration (g/dl)
Popu
latio
n (%
)
The prevalence of anemia is the percentage of the population whose hemoglobin
concentration falls below the 5th percentile of the distribution of hemoglobin concentration of a nondeficient population of that target group. For nonpregnant women, the 5th percentile is 12 g/dl. As with all population-level assessments, some misdiagnosis on an individual basis will occur. For individuals, the only way to be certain that an individual is anemic is to see whether hemoglobin concentration increases in response to iron supplementation.
Table II-1 on the following page shows the WHO cutoff values (1997) for anemia based on hemoglobin concentration by target group. For example, the cutoff value for anemia for pregnant women is 11 g/dl. Pregnant women have a lower cutoff for hemoglobin concentration than nonpregnant women because women's plasma volume normally expands during pregnancy. For all target groups, moderate anemia is defined as a hemoglobin concentration less than 10 g/dl and severe anemia is defined as a hemoglobin concentration less than 7 g/dl, when the risk of congestive heart failure is greatly increased. This risk is especially high when the hemoglobin concentration is less than 4 g/dl.
16

How to Assess Iron Deficiency Anemia and Use the HemoCueTM
Table II-1. Cutoff values for anemia at sea level using hemoglobin concentration.1
Target group Age Hemoglobin concentration (g/dl)
Women • Pregnant <11.0 • Not pregnant <12.0
Infantsa 6-11 months old <11.0
Children • Preschool 1-4 years (12-59 months) old <11.0 • School-age 5-11 years old <11.5 • School-age 12-13 years old <12.0
Men <13.0 a Hemoglobin is generally not measured in infants younger than six months old because iron
deficiency is rare except in low-birth-weight infants.
The above hemoglobin values must be adjusted at high altitudes (>1,500 m) because the normal hemoglobin concentration increases with altitude to compensate for the lower concentration of oxygen in the air (see Table II-2 below). The adjustment is particularly important when some of the project sites are at high altitude and others are at low altitude. If the values are not adjusted for high altitude, the prevalence of anemia will be underestimated in high-altitude areas.
Table II-2. Cutoff values for anemia at high altitudes using hemoglobin concentration.2
Hemoglobin concentration (g/dl) at: Target group Age > 1,500 m > 2,700 m
Women • Pregnant <12 <13 • Not pregnant <13 <14
Infantsa 6-12 months old <12 <13
Children • Preschool 1-4 years (12-59 months)
old <12 <13
• School-age 5-11 years old <12.5 <13.5 • School-age 12-13 years old <13 <14
Men <14 <15 a Hemoglobin is generally not measured among infants younger than six months old because iron
deficiency is rare except among low birth weight infants.
The severity of iron deficiency anemia in a population is judged based on the prevalence of anemia. A prevalence of 20% or greater is considered a high prevalence.3 When the prevalence of anemia among pregnant women is greater than or equal to 40%, iron supplementation is recommended for a longer period of time (nine months continuing into the postpartum period versus six months when the prevalence is less than 40%).1
Another way to look at anemia data is to look at the distribution curve. This shows the entire range of mild to severe anemia instead of just the percentage of the population that
17

Chapter II: What is the Extent of Iron Deficiency Anemia In a Given Project Area?
is below the cutoff point for anemia. Distribution curves can help program managers to evaluate several issues about anemia in their project areas.
First, distribution curves can be useful for evaluating the severity of the anemia. Vertical lines can be drawn at the cutoff point for anemia, moderate anemia, and severe anemia as shown in Diagram II-2 below. The distribution to the left of the dotted red line represents anemic children; that to the left of the dashed red line represents moderately anemic children; and that to the left of the solid red line represents severely anemic children.
Diagram II-2. Distribution of hemoglobin concentration among children in Huallaga Valley, Peru 1997 compared to WHO cutoff points for anemia. (Courtesy of Project HOPE).
0%
10%
20%
30%
40%
50%
0.0 5.0 10.0 15.0 20.0Hemoglobin (g/dl)
Popu
latio
n (%
)
anem
ia
mod
erat
e
seve
reWHO cutoff points
Second, the distribution curves of populations that have a high prevalence of anemia
are wider and are not symmetrical. The left-hand of the distribution, reflecting the anemic individuals in the population, has a longer tail than the right-hand. This kind of curve is called a skewed curve. A hemoglobin distribution curve that is asymmetrical with a tail to the left indicates that a portion of the project's target population is anemic.
Third, the entire distribution of hemoglobin concentration of a population with a high prevalence of anemia is shifted to the left of the distribution of a population that has a low prevalence of anemia. In other words, even the hemoglobin levels of individuals whose levels are above the cutoff for anemia in a population with a high prevalence of anemia can be improved because they are lower than they would have been if the population was not iron deficient. Improvement in the iron status of the target population as a result of iron intervention can easily be identified if the distribution curve for a target group whose curve was shifted to the left, is subsequently shifted to the right.
Fourth, distribution curves can also be useful for comparing different target groups. Diagram II-3 on the following page shows the distribution curves of hemoglobin concentration for men (open red triangles), women (open blue circles), and children (closed purple diamonds) from data collected in Huallaga Valley, Peru, by Project HOPE. Adult men will not have a high prevalence of anemia unless parasitic infections associated with anemia are prevalent. In this case, the distribution curves of men, women, and children tend
18

How to Assess Iron Deficiency Anemia and Use the HemoCueTM
to be of a similar shape, and all curves are shifted to the left of the distributions of hemoglobin concentration of a non-deficient population for their respective target group.
Diagram II-3. Distribution of hemoglobin concentration among men, women, and children in Huallaga Valley, Peru 1997. (Courtesy of Project HOPE).
0%
10%
20%
30%
40%
50%
-10 -5 0 5 10Difference from WHO cutoff for anemia (g/dl)
Popu
latio
n (%
)
childrenwomenadult men
2. Where do I find existing information on iron deficiency anemia in a given project area?
Review the following existing information even if it has already been decided to conduct a survey on iron deficiency anemia in the project area. Existing information can focus a survey questionnaire so that new information is collected rather than information that has already been gathered. The following steps 1-5 outline where to find existing information on iron deficiency anemia and what information to look for.4
Step 1. Check World Health Organization or United Nations Children's Fund data on the prevalence of anemia among pregnant women in the country where the project is located.
The goal of the United Nations Children’s Fund (UNICEF) and the WHO has been to reduce iron deficiency anemia in women by one-third of 1990 levels by the year 2000.
UNICEF recommends a national plan of action for nutrition. In countries where iron deficiency anemia is prevalent, this plan should include a specific program for preventing and controlling iron deficiency including supplementation, dietary improvement, food fortification, and other public health measures, particularly the control of hookworm infection.5 While iron supplementation is currently the dominant strategy, UNICEF is intensifying its efforts to fortify food with iron, particularly in Latin America and the Middle East. UNICEF stocks iron supplements for women and has limited stocks of iron supplements for children.
The WHO has produced authoritative documents on indicators and on strategies for iron deficiency control based on expert group recommendations and has conducted studies on iron deficiency throughout the world. The Maternal Health and Safe Motherhood
19

Chapter II: What is the Extent of Iron Deficiency Anemia In a Given Project Area?
Programme of the WHO has compiled information on the prevalence of anemia among pregnant women.6 See Table I-3 for regional and subregional prevalences.
Check as well with the WHO and UNICEF offices in the country where the project is located for updates on the national iron deficiency anemia situation.
Step 2. Consult with international and national experts to obtain recent information on iron deficiency anemia in the country where the project is located.
There probably are experts who have already worked on iron deficiency anemia in the country where the project is located. There are a number of international and national organizations that have staff with expertise in the area of iron deficiency anemia. The following organizations are starting points, which may be able to provide more information about iron deficiency in the country or area where the project is located:
• International Nutritional Anemia Consultative Group (INACG): INACG is dedicated to reducing the prevalence of iron deficiency and other nutritional anemias worldwide. INACG was established by the United States Agency for International Development (USAID) to guide international activities aimed at reducing nutritional anemias in the world. Over the past twenty-five years, INACG has sponsored scientific reviews of issues related to etiology, treat, and prevention of nutritional anemias. These reviews have resulted in a series of documents useful in guiding programs to control iron deficiency anemia. The contact address is:
INACG Secretariat International Life Sciences Research Foundation 1126 Sixteenth Street, NW Washington, DC 20036-4810 U.S.A.
Phone (202) 659-0789 Fax: (202) 659-3859
Website: www.ilsi.org
• USAID Micronutrient Support Project: The Micronutrient Support Project (MOST) provides technical assistance to selected governments on iron interventions, particularly supplementation of pregnant women with iron-folate, fortification of staple foods with iron, and assessment of iron deficiency anemia. The contact address is:
MOST International Science and Technology Institute, Inc. 1820 North Fort Meyer Drive, Suite 600 Arlington, VA 22209 U.S.A.
Phone (703) 807-0236 Fax (703) 807-1126
Email: [email protected]
20
How to Assess Iron Deficiency Anemia and Use the HemoCueTM
• USAID Mothercare Project: The Mothercare Project (1989-2000) provided extensive technical assistance to governments worldwide on iron interventions to reduce iron deficiency in women and published a highly informative quarterly newsletter. Mothercare materials, including over 140 project materials produced by the Mothercare Project in Kenya, Nigeria, Indonesia, Pakistan, Bolivia, Guatemala, Honduras, and other countries, are now housed at the Johns Hopkins University Media Materials Clearinghouse. Materials include flipcharts, pamphlets, posters, and audiotapes. Single copies can be requested free of charge. The contact address is:
Ms. Margaret D’Adamo, Librarian Johns Hopkins University Media Materials Clearinghouse 111 Market Place, Suite 310 Baltimore, MD 21202 U.S.A.
Phone (410) 659-6300 Fax (410) 659-6266
Email: [email protected]
• Demographic and health surveys: The Demographic and Health Surveys (DHS)implemented by the USAID MEASURE DHS+ Project at Macro International include anemia prevalence surveys. The contact address is:
DHS, Macro International 11785 Beltsville Drive Calverton, MD 20705 U.S.A.
Phone (301) 572-0200 Fax (301) 572-0999
Website: www.macroint.com/dhs Email: [email protected]
• Ministry of Health: In many countries, the Ministry of Health has a unit that is responsible for nutrition and sometimes specifically micronutrient programs. What are Ministry of Health policies and programs? Ministry offices involved in Safe Motherhood might also have information on iron supplementation coverage if distribution of iron-folate supplements is part of the program. Some Ministries of Health have set up a Health Information System that collects regular information on pregnancy, maternal mortality, low birth weight, and anemia.
• Local universities: Professors, medical students, or graduate students may be able to provide information about iron deficiency and anemia based on studies they have conducted. Professors or graduate students in nutritional sciences may have conducted studies on consumption of foods rich in iron or on foods that may enhance or inhibit absorption of iron. Ask professors or graduate students in agriculture whether they have conducted studies on the production or preservation of foods rich in iron.
21
Chapter II: What is the Extent of Iron Deficiency Anemia In a Given Project Area?
• Nongovernmental organizations: Other organizations similar to your own may also be implementing iron interventions. Check with other nongovernmental organizations to see what existing programs are doing.
Step 3. Collect case evidence about anemia in the project area.
Hospitals and clinics can be a useful source of information about anemia. Interview health service providers and laboratory technicians about cases of severe anemia or request permission to review the records on severe anemia cases. The best places to find information about anemia are hospitals and clinics that serve urban slums or poor rural areas.
Step 4. Find out about local knowledge of anemia, iron supplement use, and beliefs about blood collection.
Women sometimes know about the symptoms of anemia during pregnancy and have particular terms to describe anemia. Do women recognize the symptoms of anemia? How do they describe anemia? Do women recognize dizziness, fatigue, and weakness as health problems that intensify during pregnancy? Do women think that too little blood is a problem during pregnancy? Pica, which includes geophagia (the habit of eating clay or earth), occurs in individuals who are iron deficient.7 Project HOPE found this practice to be common in their Child Survival project area in Huallaga Valley, Peru, where the prevalence of iron deficiency is high.
Interviews with mothers and physicians can also be highly informative in terms of assessing the current status of iron deficiency control programs. For example, the United States Centers for Disease Control and Prevention found out from interviews that among the Palestinian populations in Gaza that, although mothers knew about iron supplements and gave them to their children, they believed it was only necessary to give iron supplements to their children when they were sick.
It is also important to know about local beliefs about blood collection before deciding to conduct a survey. For instance, Save The Children in Mozambique discovered that the local population believed that sucking blood could take away a person's soul. In another instance, project staff was told that they could only take blood samples in health centers, even though traditional birth attendants distributed iron-folate tablets to pregnant women in the community. Knowing about these beliefs in advance and discussing acceptable options with community leaders can influence the decision about whether or not to conduct a survey.
Step 5. Collect information on factors that influence iron deficiency.
♦ Parasites: The key parasitic infections that contribute to anemia are hookworm, schistosomiasis, and malaria. Check with medical schools or research institutes or individual experts for written reports and surveys on the prevalence of parasitic infections in the project area. The National Health Information System may collect regular information on the incidence of malaria in particular. Key informant interviews with health workers or laboratory workers might provide useful information. Hospital and clinic records are another potential source of information about parasitic infections but will probably be underreported. The government or nongovernmental organizations may have deworming coverage data for women or children.
22
How to Assess Iron Deficiency Anemia and Use the HemoCueTM
♦ Food availability, costs, and consumption: Find out about locally available foods that are rich in iron as well as other anemia-related nutrients such as vitamin B12, folic acid and vitamin A. The iron in foods is classified as either heme iron found in meat or nonheme iron found in eggs, dairy products, and plant foods. Look for or construct a seasonal crop calendar to find out when specific foods are available. What do these foods cost? Can people afford to buy these foods? Are there any food consumption surveys that report whether foods rich in these nutrients are eaten, and if so, how often and in what quantities? Look for qualitative studies on food preparation methods, food purchases, and food beliefs or conduct a group discussion to get information of food consumption practices. For further information on how to conduct a group discussion on food consumption practices, see How to Use the HKI Food Frequency Method, 1993, Helen Keller International, New York (hkworld.org). The specific food groups that are important are listed below.
• Fortified foods: Many processed foods can be fortified with iron. Infant cereals, wheat flour, and noodles may be fortified with iron. Breast milk substitutes are often fortified with a variety of nutrients. Milk products, margarine, and oils are sometimes fortified with vitamin A. In Latin America, sugar has been fortified with vitamin A.
• Animal foods: Liver, meat, poultry, and fish are rich in heme iron, which is more readily absorbed than nonheme iron. Liver is also a very good source of vitamin A, folic acid, and vitamin B12. Meat, poultry, and fish also contribute to vitamin B12 intake. Egg yolks are rich in nonheme iron as well as folic acid and vitamin B12. Butter does not contain iron, but is rich in vitamin A and vitamin B12.
• Plant foods: Staple cereals and dark green leafy vegetables (DGLVs) contain nonheme iron that may be more readily absorbed when consumed at the same time as iron enhancers (see examples below). Fresh DGLVs are also rich in folate. DGLVs can contribute to intake of beta-carotene, but the beta-carotene in orange and dark yellow fruits and vegetables (e.g. mangos, papaya, pumpkin, carrots, sweet potatoes) is more bioavailable than that in DGLVs.
• Iron enhancers (see Table I–1): Foods that enhance the absorption of nonheme iron include meat, poultry, or fish and foods that are rich in vitamin C such as oranges, guavas, pineapple, or papaya.
• Iron inhibitors (see Table I-2): Foods that inhibit the absorption of nonheme iron include cereals, beans, tea, and coffee.
♦ Exclusive breastfeeding: Look for reports and surveys that provide information on exclusive breastfeeding rates among infants younger than six months old. Exclusively breastfed infants receive breast milk or breast milk with vitamin drops but nothing else. Predominantly breastfed infants receive, in addition to breast milk, water and/or fruit juice but nothing else. Infants who are younger than four months old given breast milk substitutes or introduced to foods may develop iron deficiency anemia sooner than they would have had they been exclusively breastfed.
23

Chapter II: What is the Extent of Iron Deficiency Anemia In a Given Project Area?
♦ Duration of breastfeeding: Look for reports and surveys that provide information on the duration of breastfeeding. The median duration of breastfeeding is the age at which half of the infants have stopped breastfeeding.8 Breastfeeding should be continued until at least two years of age reducing the risk of iron deficiency among infants. Exclusive breastfeeding will reduce the risk of iron deficiency anemia among lactating women until six months, at which point their risk will increase.
♦ Vitamin A and other nutritional deficiencies: Check with local organizations that work on vitamin A deficiency for reports on surveys of night blindness and Bitot’s spots or serum retinol levels. Check the WHO estimates of the prevalence of vitamin A deficiency in the country. Hospital or clinic records may be a good source of information about clinical vitamin A deficiency. Key informant interviews with health workers or nutritionists may also provide useful information. Group discussions or interviews with community members to find out if there are local terms used to describe night blindness are also helpful. Information about folic acid and vitamin B12 deficiency may be harder to locate. Check with universities and nutrition institutes that might have conducted surveys of these nutrient deficiencies.
♦ Iron and vitamin A supplementation coverage: The government or nongovernmental organizations may have coverage data on iron supplementation of pregnant women, postpartum vitamin A supplementation, and vitamin A and iron supplementation of children under five.
3. Do I need to conduct an anemia survey (see Decision Tree II-1)?
Review the existing information on iron deficiency anemia to decide whether or not to collect new survey data. There are three main reasons to collect new survey data on anemia.
i) If there is little existing information about anemia in the country where the project is located, clearly new data about anemia prevalence need to be collected. Or if the information is dated, the factors that contribute to anemia might have changed.
ii) Even if information about anemia is available at the country level, it may not reflect the situation at the project level. For instance, if poverty is greater, parasitic infections are more prevalent or educational levels lower in the project area than in the country as a whole, anemia rates in the country may underestimate anemia rates in the project area.
iii) Sometimes even if there is national or regional level information suggesting that iron deficiency anemia is prevalent, local decision-makers may still need information at the local level. For instance, in the Philippines, the allocation of resources for health and nutrition interventions has been increasingly decentralized to provincial and municipal levels and provincial government officials and mayors have wanted anemia prevalence data specifically in their provinces and municipalities.
24

How to Assess Iron Deficiency Anemia and Use the HemoCueTM
Decision Tree II-1. Do I need to collect more data about anemia?
Yes
Yes
No
Are poverty, disease, & malnutrition in your project
area similar to the rest of the country?
No
Are there current data about anemia in
the project area?
No Yes
Are there current data about anemia in
the country?
Collect new mia survey dane ata
Use existing anemia data
25

Chapter II: What is the Extent of Iron Deficiency Anemia In a Given Project Area?
26
1 Stoltzfus RJ, ML Dreyfuss. Guidelines for the Use of Iron Supplements to Prevent and Treat Iron Deficiency Anemia. International Nutritional Anemia Consultative Group. Washington, DC: International Life Sciences Institute Press, 1998.
2 United States Institute of Medicine. Nutrition During Pregnancy and Lactation. An Implementation Guide. Washington, DC: National Academy Press, 1992.
3 Program for Appropriate Technology in Health. Anemia Detection in Health Services. Guidelines for Program Managers. Seattle, Washington, 1996.
4 Helen Keller International. In: Foote D, G Offutt. Technical Report on Anemia. Atlanta, Georgia: Program Against Micronutrient Malnutrition, Rollins School of Public Health, Emory University, 1997.
5 UNICEF/World Health Organization. World Summit for Children 1990-2000. Report, 1996. 6 World Health Organization. The Prevalence of Anaemia in Women. Geneva: Maternal Health and Safe
Motherhood Programme, 1992. 7 Dorland’s Illustrated Medical Dictionary. 27th Edition. Philadelphia: W.B. Saunders Company, 1988. 8 O’Gara C, MH Newsome, C Viadro (eds). Indicators for Reproductive Health Program Evaluation.
Chapel Hill, NC: Carolina Population Center, University of North Carolina, 1995.

How to Assess Iron Deficiency Anemia and Use the HemoCue
Chapter III: How Do I Conduct an Anemia Survey? To assess the prevalence of anemia and its public health importance in a project area,
the prevalence should be measured among a representative sample of subjects in order to generalize the results from the sample to the entire target population. This chapter explains how to choose a method to measure anemia prevalence, what the sample size should be, and how to develop a survey plan or protocol.1
1. What method should I use to measure the prevalence of anemia? The major features to consider in selecting a method to assess iron deficiency
include: (i) accuracy (sensitivity and specificity), (ii) the cost of equipment and supplies, (iii) the cost and logistics of transportation and analysis of blood samples, (iv) the safety of the survey workers and the study subjects, (v) training of the survey workers, and (vi) cultural considerations. The most widely used field methods are measurement of hemoglobin concentration with the HemoCue machine, collection of capillary blood samples for measurement of hematocrit, and clinical exams. Various features of these methods described in Table III-1 on the following page.
Clinical exams of the pallor (paleness) of the nail beds of the fingers, the palms, and the inside of the eyelids are used to diagnose anemia. The HemoCue is a photometer that measures the absorption of light after hemoglobin has been converted to hemiglobinazide by reagents present in special microcuvettes used with the photometer. The absorption of light is used to estimate the hemoglobin concentration. Hematocrit is the ratio of the volume of red blood cells to total blood volume. This ratio is determined by centrifuging a blood sample in a capillary tube, which separates the red blood cells from the plasma. Both the HemoCue machine and the analysis of hematocrit use capillary blood samples, which are an advantage in cultures where there are strong beliefs against taking venous blood.
Note in Table III-1 that using the HemoCue machine to measure hemoglobin concentration and collecting centrifuging capillary blood to analyze hematocrit are far more accurate than clinical exams, particularly in terms of sensitivity. Sensitivity refers to the proportion of survey subjects who are accurately diagnosed as anemic using a particular method (true positives) among the survey subjects who are actually anemic (true positives and false negatives). Specificity refers to the proportion of survey subjects diagnosed as not anemic (true negatives) using the method among those who are not actually anemic (true negatives and false positives). Clinical exams are not generally used for population-based surveys because the sensitivity of detecting anemic individuals is very low unless anemia is highly prevalent and severe.2,3
The use of the HemoCue has several advantages over use of hematocrit for field-based surveys. The HemoCue machine is light and portable and runs on batteries so it can be transported to the survey site where blood samples can be analyzed in the field without having to be transported to a laboratory. Moreover, the results of the test are available immediately. In contrast, the capillary blood samples needed to analyze hematocrit must be refrigerated and transported to the laboratory within a few hours of collection, which adds to the cost of the survey. Should the capillary tubes break during transport, the survey workers are at risk of exposure.
27

Chapter III: How Do I Conduct an Anemia Survey?
28

How to Assess Iron Deficiency Anemia and Use the HemoCue
The cost of equipment and recurring supplies for the HemoCueTM and hematocrit are also given in Table III-1 on page 28. As shown in Diagram III-1 below, the cost of a small survey (for example, 900 is the recommended sample size for an anemia survey of women of reproductive age and young children) is less for a survey of hemoglobin concentration using the HemoCue than for a survey of hematocrit. Although the capillary tubes for collecting blood samples to measure hematocrit are less expensive than the microcuvettes used to collect blood samples to measure hemoglobin concentration, the centrifuge needed to separate blood for the hematocrit is far more expensive than the HemoCue photometer. Diagram III-1. Costs of equipment and supplies for using the HemoCue machine compared
to the hematocrit to assess anemia prevalence in a field survey.
Hematocrit number of HemoCue Hematocrit0 0 570 15001 450 750 15402 900 930 15803 1350 1110 16204 1800 1290 16605 2250 1470 17006 2700 1650 17407 3150 1830 17808 3600 2010 18209 4050 2190 1860
10 4500 2370 1900$0
$500
$1,000
$1,500
$2,000
$2,500
0 1000 2000 3000 4000 5000Number of subjects
Cos
t in
US
$
HemoCueHematocrit
Safety and supplies for the use of the HemoCueTM are discussed in detail in Chapter IV and training is discussed in Chapter V.
2. What should the sample size be? We suggest a sample size of 450 subjects per target group (30 communities and 15
survey subjects from each target group in each community). Consult an epidemiologist or statistician if there is some reason to change this sample size. Note that EpiInfo can calculate sample size.
The sample size can be approximated by the following formula for population sizes greater than 10,000:
n = z2pq/d2
where n is the desired sample size; z is 1.96, which corresponds to the 95% confidence level; p is the estimated prevalence of anemia, set at 50%; q is 1-p; and d is the desired degree of accuracy, set at 0.05. The result is 384, which is increased somewhat to account for the design effect of cluster sampling.
29

Chapter III: How Do I Conduct an Anemia Survey?
3. What is included in a survey plan? The survey plan:
• defines the target group(s) (e.g., women of reproductive age); • defines the survey area; • defines when the survey will be conducted; • describes the sampling method used to select communities in the survey area; • describes the sampling method used to select eligible sample households; • describes the sampling method used to select eligible target group members.
Step 1. Define the target groups. Since pregnant women and young children are the first priority for iron interventions,
they would ideally be the first choice as survey subjects. These and other potential target groups are discussed below.
Pregnant women. Depending upon the birth rate in the given project area, it may be difficult to find
enough pregnant women in any one community to reach the minimum sample size. In order to decide whether to survey pregnant women, consider the problems of sampling this target group outlined in Table III-2 on the following page.
Women of reproductive age. An alternative to selecting pregnant women is to survey all women of reproductive
age. Women's iron status at the beginning of pregnancy is a good predictor of their iron status during pregnancy. One study has indicated that iron stores before pregnancy influence the development of anemia during pregnancy, as well as the effectiveness of iron supplements during pregnancy.4
Another alternative is a convenience sample of pregnant women for which the findings are then compared to the sample survey findings among nonpregnant women. Such a sample may not be representative of the target population, but it can give some indication of whether anemia is much more severe among pregnant women than among nonpregnant women. Pregnant women can be conveniently sampled at health centers that provide prenatal care.
The survey questionnaire can include additional information about whether the subject is lactating, length of time since her last delivery (if any), and the first day of her last menstrual period in order to identify women who are pregnant. This information can be used to classify women according to pregnancy status so that the appropriate cutoff value for anemia can be used. Information about the first day of the woman’s last menstrual period is also used to classify the trimester of pregnancy, which also influences hemoglobin concentration. The cutoff value is 11.0 g/dl for the first and third trimesters, and10.5 g/dl for the second trimester5.
The sample size in just one project area will not be large enough to compare the prevalence of anemia between pregnant women and nonpregnant women. If the anemia survey is conducted in multiple project areas (e.g., a national or regional survey), the sample size may be large enough by combining the data from all project areas. The combined data
30

How to Assess Iron Deficiency Anemia and Use the HemoCue
from multiple project areas should include at least 450 pregnant and 450 nonpregnant women.
Table III-2. Potential problems, consequences, and alternatives for using pregnant women as survey subjects.
Problem Consequence Alternative
It may be difficult to find enough pregnant women in each and every community surveyed.
The sample size may be too small to estimate the prevalence of anemia among pregnant women.
Go to the next nearest community to find more pregnant women to complete the sample.
In some cultures some women may be reluctant to admit that they are pregnant. Some women may not know that they are pregnant early in pregnancy.
The sample of women who report that they are pregnant may not be as anemic as the sample of women who are reluctant to admit that they are pregnant (e.g., unmarried mothers).
Provide training on how to ask questions about pregnancy in a sensitive manner, test the survey questions extensively, and consider whether female survey workers might elicit more truthful responses.
The percentage of women who are pregnant at any one time may be low. For example, only about 12% (43/350) of the sample of women of reproductive age were identified as pregnant in a Project HOPE survey in Peru.
It may cost too much money for travel and per diems to visit enough households to find an adequate sample size of pregnant women. For example, survey workers would have had to visit almost 3,000 households with women of reproductive age to find 350 pregnant women in the Project HOPE survey.
Consider using community health workers to identify all pregnant women in the community (i.e., create a pregnancy register) and select the sample using a random sampling method.
If community health workers are expected to identify pregnant women in the community, they may only identify those who use their services.
Pregnant women who have access to health services might not be as anemic as women who do not use health services.
Provide training and incentives for community health workers to identify all pregnant women in their service catchment areas.
Preschool children. As discussed in Chapter I, preschool children often have levels of anemia similar to
those of pregnant women. One approach, therefore, is to use data from women of reproductive age and assume that preschool children have a prevalence of anemia that is somewhat higher. But since iron interventions are not as commonly provided to preschool children, data on this group are generally needed to convince donors, government counterparts, project personnel, health care workers, or other decision-makers that interventions for this target group are a priority. Do not include infants who are younger than six months, as they are unlikely to be anemic unless they were premature. In addition, the standard cutoff values for hemoglobin concentration are not well established for infants younger than six months. Mothers may also be reluctant to have a blood sample taken from a very young infant. The group of survey subjects should be limited to infants and young children from six to fifty-nine months of age.
31

Chapter III: How Do I Conduct an Anemia Survey?
School-age children. School-age children may also be selected as survey subjects if school-based iron
supplementation is being considered as a means of improving school performance. In countries where school attendance is good, this may be the ideal group to improve the iron stores and status of adolescent girls before pregnancy. At least twenty-five percent of adolescent girls in developing countries will have their first child by the time they are nineteen years old.6
Men. Men have lower needs for iron than children and women of reproductive age and are
likely to consume more iron because the distribution the intrahousehold distribution of iron-rich foods often favors men. Thus, they do not generally have a high prevalence of anemia unless they have conditions other than low dietary intake of iron. If the prevalence of anemia among men is low (around five percent), this indicates that low dietary intake of iron is likely to be the main cause of iron deficiency among women and children. If the prevalence of anemia among men is higher and the distribution curve for men shows the same skewed pattern as that for women and children, then factors other than low dietary iron intake are likely to contribute to the prevalence of anemia in the target population. In developing areas of the world, the most commonly occurring nondietary factors contributing to anemia are parasites (see Diagram III-2 below).
Diagram III-2. Common factors that contribute to anemia among men in developing areas.
Iron deficiency
Loss of red blood cells
Hookworm, schistosomiasis, &
whipworm
Blood loss
Anemia
Destruction of red blood cells & other mechanisms
Malaria
The addition of men to a survey can be considered a qualitative assessment of whether parasitic infections associated with anemia are likely in the project area. If there is no information about parasites in the project area and the project does not have the human and financial resources to collect and analyze stool samples or there are cultural constraints to collecting stool samples, consider collecting data on anemia among men (see Decision Tree III-1 on the following page). If anemia is prevalent among men, then malaria, hookworm, whipworm, and/or schistosomiasis are likely to be prevalent in the project area.
Step 2. Define the survey area. For most projects, the project area defines the survey area. However, ethnicity,
economic development, urbanization, and climate can influence the types of foods that are eaten and exposure to parasites and hence, the prevalence of anemia. If these factors differ greatly in certain sections of the project area and there are adequate resources to conduct more than one survey, divide the project area into subareas and conduct a survey in each subarea. Logistics, funding, or other practical considerations may limit the size and number of the survey areas.
32

How to Assess Iron Deficiency Anemia and Use the HemoCue
Decision Tree III-1. Do I need to include men in the sample for an anemia survey?
Collect anemia data from men
Add periodic deworming to iron
interventions
No
Do I have the resources to collect and analyze stool
samples?
No
Collect data on hookworm,
whipworm, & schistosomiasis
Yes
Yes
Are there current data that hookworm, whipworm, and/or
schistosomiasis are prevalent in the project area?
Step 3. Determine when to conduct the survey. Schedule the survey during the time of day most convenient for the target groups to
participate. Find out the daily and weekly work schedule of subjects in the survey area. If the survey is conducted when certain groups are not at home, the sample might be biased. For instance, if many women farm all morning and afternoon, schedule the survey in the early morning and late afternoon or early evening so that all women are sampled. Women who farm may be more anemic than women who don’t farm, so in this setting, the prevalence of anemia could be underestimated if the survey is conducted during the day. Although one solution would be to return to the households in which target group members are first found not to be home, this process is very time consuming and not very practical. Holidays should also be excluded because the target groups may not be available.
Another alternative would be to consider going to where people gather during the daytime, such as the marketplace. This approach is sometimes used by the United States Centers for Disease Control and Prevention for sampling men. This is a convenience sample and, therefore, may not be representative of the target population, but it can give an indication of whether anemia is prevalent among men. In this case, check to make sure that any groups of men who might not go to the marketplace have not been left out.
The prevalence of iron deficiency may vary by season. Infections due to hookworm and schistosomiasis in endemic areas are present year round. Malaria, however, is
33

Chapter III: How Do I Conduct an Anemia Survey?
sometimes seasonal. Also, the availability of citrus fruits and other foods that enhance the absorption of iron may vary by season. If a survey of vitamin A deficiency will be conducted in conjunction with the anemia survey, schedule the survey to coincide with the period when vitamin A deficiency is most likely to be prevalent. The rainy season may also influence the logistics of the survey, making roads impassable.
Step 4. Develop a sampling plan to select communities, households, and target group members.
Select a representative sample of communities, eligible households, and eligible subjects in order to generalize the results from the sample to the entire target population. Someone with experience and formal training in sampling techniques should perform this step.
The sampling plan should include a description of how sampling units will be selected. A sampling unit is an item that is selected. Communities are considered one sampling unit, households are considered another sampling unit, and subjects are considered another sampling unit.
We recommend using cluster sampling. Cluster sampling means that a certain cluster of the population (often communities or neighborhoods) is selected and then subjects within that cluster are selected. If eligible subjects are sampled directly, without first selecting a specific number of community clusters, many more communities will have to be sampled and the survey will be much more costly and time consuming.
Step 4.a. Select 30 sample communities in each survey area.
In each of the survey areas, select 30 communities that are representative of that survey area. The first step is to define the term community in the project area. The definition depends upon the population density and layout of households in the project area. In urban areas with large, dense populations, communities may be defined as neighborhoods within a city. In rural areas with small, dispersed populations, communities may be villages or groups of villages.
After defining the term community, decide which sampling method to use to select communities (as described in Table III-3 on the following page). Are there census data available? If there are no census data available, then simple random sampling must be used. For instance, it was impossible to conduct a census in many areas of Mozambique during the war. The information on the population sizes of communities was so out of date that the only option available to the Ministry of Health was to use simple random sampling. In a similar situation, it is important to find out how many people live in each community from local authorities while the survey teams are collecting data. This information will be useful later during data analysis.
If census data are available, the next question is, “Do the communities in the project area have about the same population sizes?” If the communities have about the same population sizes, then it is also acceptable to use simple random sampling.
34

How to Assess Iron Deficiency Anemia and Use the HemoCue
35

Chapter III: How Do I Conduct an Anemia Survey?
If the population sizes of the communities vary considerably, then use proportional-to-population size (PPS) sampling. Simple random sampling may result in a sample that includes fewer large (more populous) communities than is reflected in the actual population because there is an equal chance of selecting either a large (more populous) or a small (less populous) community using this method. In contrast, there is a greater chance of selecting a sample of communities that reflects the actual population using PPS sampling because there is a greater chance of selecting the large (more populous) communities.
Sometimes the clusters that are selected cannot be surveyed. For instance, small (less populous) populations may have shrunk or disappeared, and census data may not reflect this. In some areas, the selected clusters may not be safe to visit because of a natural disaster or security problems. If the selected clusters cannot be visited, alternate clusters should be selected using the same method that was used to select the first 30 clusters. Do not simply select the next community on the list because it may have a population size dramatically different from that of the community originally selected.
Example of simple random sampling. To select communities using simple random sampling, make a table with two
columns as shown in Example III-1 below. List the names of all the communities in the survey area in the right-hand column and sequentially number the communities in the left-hand column.
Example III-1. Simple random sampling.
# Community name
1 Trapieng Rovieng 2 Cha 3 Dob Por 4 Trapieng Veng 5 Kompong Tria
… … 46 Svay Tong 47 Oh
Randomly select a number from one up to and including the total number of communities in the survey area using one of the random selection methods described in Table III-4 on the following page. If there are fewer than 100 communities, use equal-sized numbered slips of paper (chits). For instance, in the above example, make 47 chits and put them in a bag. Suppose chit #46 is picked out of the bag: Svay Tong would be selected as a survey site. Continue to select chits until 30 communities have been selected. If there are more than 100 communities in the survey area, use a Random Numbers Table. A Random Numbers Table is included on page 43 at the end of this chapter. See Table III-4 on the following page on how to use a Random Numbers Table.
36

How to Assess Iron Deficiency Anemia and Use the HemoCue
37
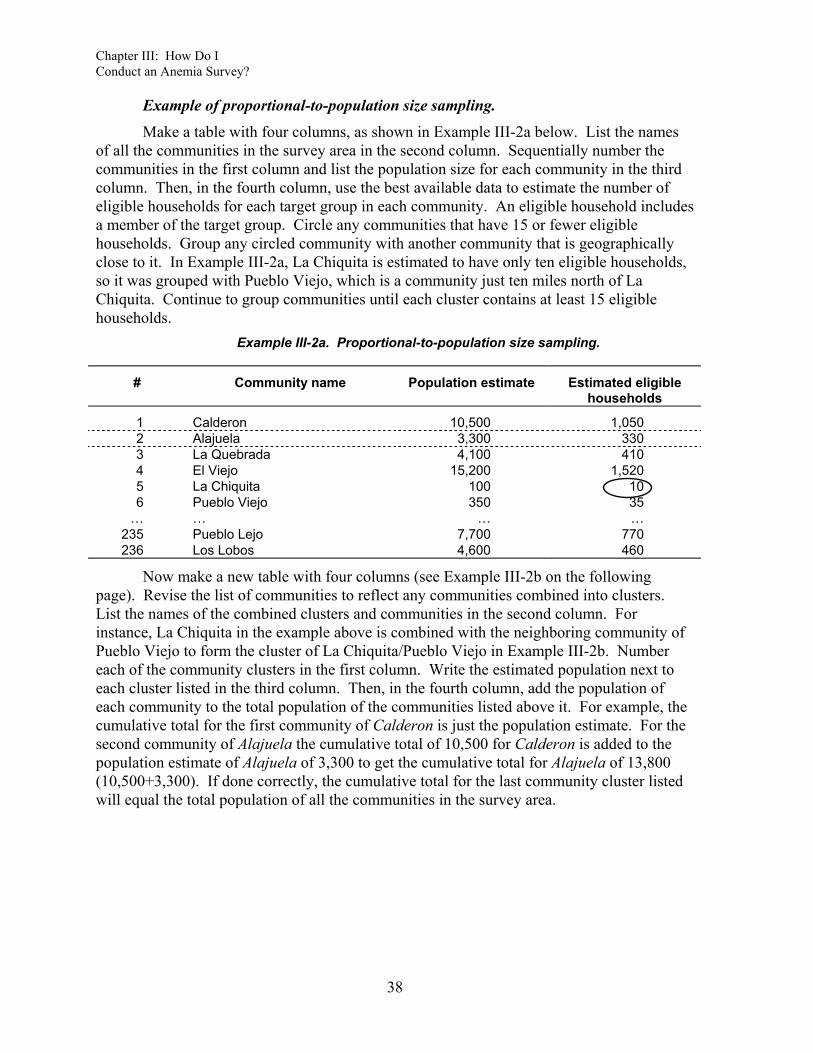
Chapter III: How Do I Conduct an Anemia Survey?
Example of proportional-to-population size sampling. Make a table with four columns, as shown in Example III-2a below. List the names
of all the communities in the survey area in the second column. Sequentially number the communities in the first column and list the population size for each community in the third column. Then, in the fourth column, use the best available data to estimate the number of eligible households for each target group in each community. An eligible household includes a member of the target group. Circle any communities that have 15 or fewer eligible households. Group any circled community with another community that is geographically close to it. In Example III-2a, La Chiquita is estimated to have only ten eligible households, so it was grouped with Pueblo Viejo, which is a community just ten miles north of La Chiquita. Continue to group communities until each cluster contains at least 15 eligible households.
Example III-2a. Proportional-to-population size sampling.
# Community name Population estimate Estimated eligible households
1 Calderon 10,500 1,050 2 Alajuela 3,300 330 3 La Quebrada 4,100 410 4 El Viejo 15,200 1,520 5 La Chiquita 100 10 6 Pueblo Viejo 350 35
… … … … 235 Pueblo Lejo 7,700 770 236 Los Lobos 4,600 460
Now make a new table with four columns (see Example III-2b on the following page). Revise the list of communities to reflect any communities combined into clusters. List the names of the combined clusters and communities in the second column. For instance, La Chiquita in the example above is combined with the neighboring community of Pueblo Viejo to form the cluster of La Chiquita/Pueblo Viejo in Example III-2b. Number each of the community clusters in the first column. Write the estimated population next to each cluster listed in the third column. Then, in the fourth column, add the population of each community to the total population of the communities listed above it. For example, the cumulative total for the first community of Calderon is just the population estimate. For the second community of Alajuela the cumulative total of 10,500 for Calderon is added to the population estimate of Alajuela of 3,300 to get the cumulative total for Alajuela of 13,800 (10,500+3,300). If done correctly, the cumulative total for the last community cluster listed will equal the total population of all the communities in the survey area.
38

How to Assess Iron Deficiency Anemia and Use the HemoCue
Example III-2b. Proportional-to-population size sampling: Add population sizes.
# Community name Population estimate Cumulative total
1 Calderon 10,500 10,500 2 Alajuela 3,300 13,800 3 La Quebrada 4,100 17,900 4 El Viejo 15,200 33,100 5 La Chiquita/Pueblo Viejo 450 33,550
… … … … 235 Pueblo Lejo 7,700 452,300 236 Los Lobos 4,600 456,900
Total 456,900 456,900
Next, divide the total population of the survey area by 30, the number of communities that will be sampled. The result is known as the “sampling frame number.” To select the first sample community, randomly pick a number from one through the “sampling frame number” from the Random Numbers Table on page 43 at the end of the chapter. See Table III-4 on page 37 for an example of how to use a Random Numbers Table. Select the community with the cumulative population closest to the number randomly picked. This is the first community selected. To select the next community, add the sampling frame number to the cumulative total of the first community selected. Select the community with the cumulative total closest to but not greater than this sum. Continue to add the “sampling frame number” to the cumulative total of the previous selection and then select the community with the cumulative total closest to but not greater than each sum. Continue until 30 survey communities are selected.
In Example III-2b above, the total population divided by 30 gives a sampling frame number of 15,230 (456,900 ÷ 30 = 15,230). Randomly picking a number one through 15,230, the number 12,484 is picked. Community #2, Alajuela, has the closest cumulative total (13,800) to the randomly picked number without exceeding it (12,484) and is the first community selected. The sampling frame number is then added to the selected community’s cumulative total (12,484 +15,230 = 27,714). Community #4, El Viejo, has the closest cumulative total (33,100) to this sum without exceeding it (27,714) and is the next selected community. This is continued until the sampling frame number (15,230) is added to the randomly picked number (12,484) for the twenty-ninth time (15,230 x 29 + 12,484 = 454,244). Community #236, Los Lobos, is the last community selected because it has the closest cumulative total to this sum.
Step 4.b. Select 15 eligible sample households in each cluster. An eligible household includes at least one member of the target group(s) of interest.
If the survey includes more than one target group, some households will have eligible survey subjects from more than one target group. When the survey includes multiple target groups, it is highly recommended to use one survey worker to look for households with eligible members for each target group.1 The reasons for this approach are as follows:
1 If the organization conducting the survey has a statistician or an epidemiologist who can conduct multiple regression analysis, there may be some additional research questions that can be answered by linking data
39

Chapter III: How Do I Conduct an Anemia Survey?
• Households with an eligible member for one target group may not have an eligible member for the other target groups. For instance, a household may have a woman of reproductive age, but not have preschool children. A household with an adult male may not have school-age children.
• There may not be enough households that have eligible members for all the target groups in the survey. For example, a community may have 25 households with women of reproductive age, 19 households with preschool children, 17 households with school-age children, and 20 households with adult men, but only nine households with an eligible member for each of the four target groups: a woman of reproductive age, a preschool child, a school-age child, and an adult male.
• Households that have eligible members for one target group may be different from those that have eligible members for another target group. For instance, women of reproductive age who have more recent blood loss during the delivery of a young preschool child may be more anemic than women of reproductive age who have a school-age child. On the other hand, women who have both a preschool child and a school-age child may have more severe anemia because they have had more pregnancies.
• It is confusing for survey workers to work with multiple questionnaires and target groups at the same time. If survey workers can specialize in identifying households with one particular target group, they will be less likely to make mistakes in selecting these survey subjects.
If the survey includes large communities (more than 200 eligible households), especially those spread over large distances, divide these communities into segments or sections with approximately the same number of households. For example, a community has an estimated 1,200 eligible households. The survey team leader divides the community into three sections of approximately 400 households each. In each of the sections, select a representative sample of five households (15 ÷ 3 = 5 households) using one of the methods described on the following page.
Households with an eligible member of a target group should be selected using the most appropriate sampling technique as described in Table III-5 on the following page. In order to decide which sampling method to use to select households, check with the health center and the authorities in each community to see whether there is a current map of all the households in the community. It may be possible to construct a map if the households are relatively close together and there is sufficient staff and time. If a map is available, randomly select households using the map. If no community map is available, select a random starting point in the community and continue to sample house-to-house.
for the various target groups within the same household. In order to link data for the various target groups, only households that have at least one eligible member from each target group should be selected.
40

How to Assess Iron Deficiency Anemia and Use the HemoCue
Table III-5. Sampling methods for selecting households.
Method Use when
Random selection from a community map Community maps of households are available
– or –
Households sufficiently close together to rapidly map
Random start house-to-house All households have relatively similar socioeconomic status and culture
Using a map of the community. When a map of the community is available, select 30 representative households using
one of the random methods described in Table III-4 on page 37. Mark the selected households on the map for the survey team. The survey team then consults the map to visit the households. If a selected household does not include an eligible member of the target group, the survey worker should select the neighboring household, always moving in one randomly selected direction.
Selecting a random starting point and continuing house-to-house. Find a central area within the community such as a central square or market area. Use
the random selection method described in Table III-4. Walk to the household farthest from the center of the community in the randomly selected direction. If a selected household does not include an eligible member of the target group, the survey worker should continue to the next neighboring household in the direction of the central area. Continue from house to house from the edge of the community back to the center. Visit every household until 15 households with eligible subjects have been identified. If the center of town is reached before 15 households have been selected, randomly select another direction and repeat the process again. If not enough households with eligible subjects are found in the community, continue selecting subjects in a neighboring community. Combine the information collected from both communities together as one community cluster.
Finally, convenience and logistics may influence the survey team while they are selecting households for the survey. If the survey team only selects subjects from the households that are most convenient to reach, they may end up with a sample of households that are better off than other households in the community. To counteract this tendency, always train the survey workers to use one of the sampling techniques and supervise their work to encourage them to continue using the technique despite any difficulties they may encounter.
Step 4.c. Select one eligible study subject for each target group per household. If the household includes more than one eligible member of a target group, select one
member using a random selection method as described in Table III-4. In some cultures, a household may include more than one member who is in the eligible target group. In such instances, choose just one member from the eligible target group. The reasons for selecting only one member of a target group from each household are:
41

Chapter III: How Do I Conduct an Anemia Survey?
• Members of the same household are likely to have similar dietary patterns and exposure to disease, so very little new information will be gained from interviewing more subjects in the same household.
• Individuals who doing domestic work are often busy, so if several women are selected from the same household the survey make take away an excessive amount of time from their collective household duties.
Once again, select a representative sample of subjects in order to make sure that the survey sample is not biased toward subjects who have higher or lower hemoglobin concentrations. For instance, older women of reproductive age may have had more pregnancies and be more anemic than younger women. So if the oldest eligible respondent in the household is always selected, the results will be very different from those of another survey worker who always selected the youngest eligible subject. The best way to select a representative sample when there are just a few individuals is to use chits or matches as described in Table III-4 on page 37. If only two eligible subjects are available, a coin toss can be used.
42
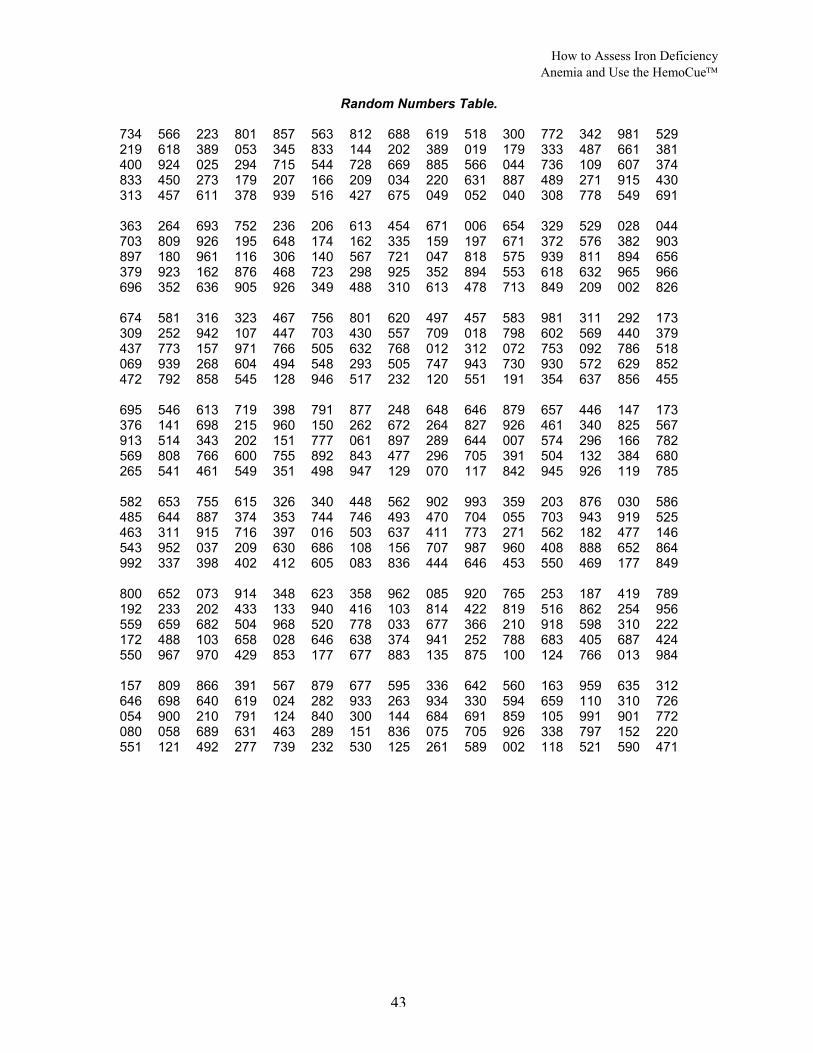
How to Assess Iron Deficiency Anemia and Use the HemoCue
Random Numbers Table. 734 566 223 801 857 563 812 688 619 518 300 772 342 981 529 219 618 389 053 345 833 144 202 389 019 179 333 487 661 381 400 924 025 294 715 544 728 669 885 566 044 736 109 607 374 833 450 273 179 207 166 209 034 220 631 887 489 271 915 430 313 457 611 378 939 516 427 675 049 052 040 308 778 549 691 363 264 693 752 236 206 613 454 671 006 654 329 529 028 044 703 809 926 195 648 174 162 335 159 197 671 372 576 382 903 897 180 961 116 306 140 567 721 047 818 575 939 811 894 656 379 923 162 876 468 723 298 925 352 894 553 618 632 965 966 696 352 636 905 926 349 488 310 613 478 713 849 209 002 826 674 581 316 323 467 756 801 620 497 457 583 981 311 292 173 309 252 942 107 447 703 430 557 709 018 798 602 569 440 379 437 773 157 971 766 505 632 768 012 312 072 753 092 786 518 069 939 268 604 494 548 293 505 747 943 730 930 572 629 852 472 792 858 545 128 946 517 232 120 551 191 354 637 856 455 695 546 613 719 398 791 877 248 648 646 879 657 446 147 173 376 141 698 215 960 150 262 672 264 827 926 461 340 825 567 913 514 343 202 151 777 061 897 289 644 007 574 296 166 782 569 808 766 600 755 892 843 477 296 705 391 504 132 384 680 265 541 461 549 351 498 947 129 070 117 842 945 926 119 785 582 653 755 615 326 340 448 562 902 993 359 203 876 030 586 485 644 887 374 353 744 746 493 470 704 055 703 943 919 525 463 311 915 716 397 016 503 637 411 773 271 562 182 477 146 543 952 037 209 630 686 108 156 707 987 960 408 888 652 864 992 337 398 402 412 605 083 836 444 646 453 550 469 177 849 800 652 073 914 348 623 358 962 085 920 765 253 187 419 789 192 233 202 433 133 940 416 103 814 422 819 516 862 254 956 559 659 682 504 968 520 778 033 677 366 210 918 598 310 222 172 488 103 658 028 646 638 374 941 252 788 683 405 687 424 550 967 970 429 853 177 677 883 135 875 100 124 766 013 984 157 809 866 391 567 879 677 595 336 642 560 163 959 635 312 646 698 640 619 024 282 933 263 934 330 594 659 110 310 726 054 900 210 791 124 840 300 144 684 691 859 105 991 901 772 080 058 689 631 463 289 151 836 075 705 926 338 797 152 220 551 121 492 277 739 232 530 125 261 589 002 118 521 590 471
43

Chapter III: How Do I Conduct an Anemia Survey?
44
1 The outline of the sampling plan for an anemia survey is based on previous work by Helen Keller International. See Rosen DS, NJ Haselow, NL Sloan. How to Use the HKI Food Frequency Method to Assess Community Risk of Vitamin A Deficiency. New York: Helen Keller International, 1993.
2 Dusch E, R Galloway, E Achadi, I Jus’at, C Sibale, C Franco, S Cousens, :L Morison. Clinical screening may be a cost-effective way to screen for severe anemia. Food and Nutrition Bulletin, 20, 4, 409-416, 1999.
3 Stoltzfus R et al. Clinical pallor is useful to detect severe anemia in populations where anemia is prevalent and severe. Journal of Nutrition, 129, 1675-1681, 1999.
4 Chew F, B Torun, FE Viteri. Comparison of weekly and daily iron supplementation to pregnant women in Guatemala. The FASEB Journal, Abstract A730, 1996.
5 Institute of Medicine. Nutrition During Pregnancy and Lactation: An Implementation Guide. National Academy Press, Wash DC, p 17, 1992.
6 Kurz K. Adolescent nutritional status in developing countries. Proceedings of the Nutrition Society, 55, 321-331, 1996.
How to Assess Iron Deficiency Anemia and Use the HemoCue
Chapter IV: How Do I Use the HemoCue to Measure Hemoglobin?
The HemoCue photometer measures hemoglobin concentration in a drop of capillary blood obtained by puncturing the fingertip with a lancet (finger stick).
1. What equipment and supplies do I need to use the HemoCue for a survey? Table IV-1 on the following page lists all the equipment and supplies needed for a
survey and training. The equipment and supplies for using the HemoCue should be ordered well in advance of training survey workers. Some important information to consider before purchasing specific supplies follows:
• Gloves: Gloves should fit snugly. Be sure to order the right size of latex gloves for the survey workers. Generally, males wear size medium or large, and females wear size small or medium.
• Lancets: A number of brands of high quality, single-use lancets are now available on the market. The lancet used often depends on the personal preference and experience of the user. Helen Keller International has used a spring retractable lancet called the Hemolance. The spring makes puncturing the finger easier. The retractable needle is safer. Pediatric (small-gauge) lancets are available and should be used on children younger than five years old because their skin is generally softer and their fingers are smaller. These lancets can be ordered from:
Hypoguard (formerly Chronimed) Minneapolis, MN
phone: 1 (800) 818-8877 website: www.hypoguard.com
• Batteries: Five new batteries allow about 120-150 hours of continuous operation of the photometer.
• Costs of the Hemocue: The costs of Hemocue machine and related supplies are listed in Chapter III, Table III-1 on page 28. Since the price of the Hemocue may change over time, check on current prices from either of the following contacts:
HemoCue US HemoCue AB 23263 Madero Box 1204 Mission Viejo, CA SE-262 23 92691 Ängelholm USA Sweden
phone: (800) 323-1674 phone: 46 431 45 82 00 fax: (949) 859-3066 fax: 46 431 45 82 00 tech support: (800) 426-7256 email: [email protected]
The quantity of equipment and supplies needed depends on the number of survey teams, survey subjects and blood samples collected as well as the amount of practice needed by trainers and survey workers. The survey manager should follow the Step 1-5 on pages 47-50 to calculate the number of supplies needed.
45

Chapter IV: How do I Use the HemoCue to Measure Hemoglobin?
Table IV-1. For the Survey Manager: How to calculate the equipment and supplies needed for an anemia survey using the HemoCue.
I II III Item # items per unit
Type of unit # units Total=I x II
a HemoCue Machine 1 survey team b Shoulder bag or back pack to carry
equipment and supplies 1 survey team
c New or recharged AA batteries (5 + 5 backup)
10 survey team
d Control microcuvette that matches the serial number of the HemoCue machine
1 survey team
e Quality Assurance Logbook 1 survey team f Bottle of alcohol 1 survey team g Disinfectant: Lysol spray or bleach 1 survey team h Roll of paper towels to disinfect the
worktable 1 survey team
i Soap for hand washing 1 survey team j Basin of water for hand washing 1 survey team k Cup to pour water over hands during
hand washing and rinsing 1 survey team
l Lightweight portable worktable. An additional table for notebooks and supplies is desirable
1 survey team
m Plastic sheet to drape over work table (paper towels can be used if the table is made of metal or plastic that can be cleaned with disinfectant)
1 survey team
n Tacks or tape to secure plastic sheet 1 survey team o Hard plastic Sharps Biohazard container
to dispose of lancets and microcuvettes 1 survey team
p Waste paper basket or trash can lined with a plastic bag for items contaminated with blood
1 survey team
q Pens 2 survey team r Clipboard for writing down responses to
the questionnaire 1 survey team
s Chairs for two survey workers and the subject
3 survey team
t A thick cloth or mat for survey subjects to lie down if they feel faint
1 survey team
u Sturdy folder to protect questionnaires 1 survey team
v Questionnaires 1 survey subjects+10%
w Microcuvettes 1 blood sample x Disposable sterile lancets 1 blood sample y Band-Aids 1 blood sample z Disposable (nonsterile) latex gloves 2 blood sample aa Gauze pads 5 cm x 5 cm (2 in x 2 in) 3 blood sample
46

How to Assess Iron Deficiency Anemia and Use the HemoCue
Step 1. Decide on the number of survey areas, target groups, and survey subjects.
The number of survey areas, target groups, and sample size were discussed in Chapter III. For most projects, the project area defines the survey area. Women of reproductive age, preschool children, school-age children, adolescents, and men are possible target groups. The recommended sample size is 450 survey subjects per target group.
Step 2. Decide on the number of survey teams and survey workers. Next, decide how many survey teams are needed. Each survey team has two survey
workers. For each survey team, we recommend that one survey worker measure hemoglobin concentration while the other survey worker administers the questionnaire and assists with supplies and recording information. If there is only one survey team, the results are likely to be more consistent. On the other hand, if there are more survey teams, less time is needed to conduct the survey. If there are more survey teams, training is very important to ensure consistency between teams. The experience of Helen Keller International staff has been that two survey teams can generally cover one project area with 30 community clusters and one target group in approximately three to four weeks. The amount of time depends on the distances between communities, the transportation available, the terrain, and the weather.
Step 3. Decide on the number of trainers. One trainer is recommended for every four survey workers. This ratio makes it
possible to conduct the standardization exercise (described in Chapter V, Section 2, Step 3, pages 78-82) in two to three days. It is a good idea to also train one or two additional survey workers as a backup in case a survey worker gets sick or cannot complete the survey work for some other reason.
Step 4. Calculate the number of blood samples needed for training and the survey.
Some of the supplies that are needed for an anemia survey using the HemoCue depend on the number of blood samples that will be collected. Table IV-2 on the following page shows how to calculate the total number of blood samples that will be collected for (i) training (see Chapter V, Section 2, pages 72-82), including practice and the standardization exercise and (ii) the survey. Prior to the training, each trainer should practice collecting two blood samples from each of ten people for a total of up to 20 samples (Column II, Row a). Each survey worker should practice collecting two blood samples from each of ten people for a total of up to 20 samples (Column II, Row b) and then should carry out a standardization exercise collecting three blood samples from each of ten volunteers, for a total of 30 samples (Column IV, Row b). Next calculate the number of blood samples needed for the survey (Row c). During the survey, only one blood sample is taken from each survey subject so the total number of samples equals the number of subjects in the survey. An additional 10% should be ordered in case trainers or survey workers need extra practice, some of the supplies are broken, or problems arise during the survey (Row e).
47

Chapter IV: How do I Use the HemoCue to Measure Hemoglobin?
Table IV-2. For the Survey Manager: How to calculate the total number of blood samples needed for practice, standardization, and the survey.
I II III IV V VI Item
# Practice Subtotal= I x II
Standardization exercise
Subtotal = I x IV
Total = III + V
a Trainers x 20 b Survey workers x 20 x 30 c Survey subjects
d Subtotal (a+b+c) e + 10% of subtotal
f Grand total (d+e)
Example IV-1 on the following page illustrates how to calculate the total number of blood samples to be collected by two trainers; ten survey workers (of whom eight will be selected based on their training performance); and 900 survey subjects (450 women of reproductive age and 450 children six months to five years of age).
• Enter the two trainers in Column I, Row a. Multiply this by the 20 practice blood samples in Column II, Row a. Enter the result of 40 (2 x 20) in Column III, Row a. Forty is also entered in Column VI, Row a.
• Enter the ten survey workers who will participate in training in Column I, Row b. Multiply this by the 20 practice blood samples in Column II, Row b. Enter the result of 200 (10 x 20) in Column III, Row b.
• Multiply the ten survey workers in Column I, Row b, by the 30 standardization blood samples in Column IV, Row b. Enter the result of 300 (10 x 30) in Column V, Row b.
• Add the subtotal of practice blood samples in Column III, Row b, to the subtotal of standardization blood samples in Column V, and Row b. Enter the result of 500 (200 + 300) in Column VI, Row a.
• Enter the 900 survey subjects in Column I, Row c. Nine hundred is also entered in Column VI, Row c.
• Add the numbers in Column VI, Rows a, b, and c. Enter the result of 1,440 (40 + 500 + 900) in Column VI, Row d.
• Multiply the 1,440 in Column VI, Row d by 10% (or 0.10). Enter the result of 144 (1,440 x 0.10) in Column VI, Row e.
• Add Column VI, Rows d and e and enter the result of 1,584 (1,440+144) in Column VI, Row f.
48
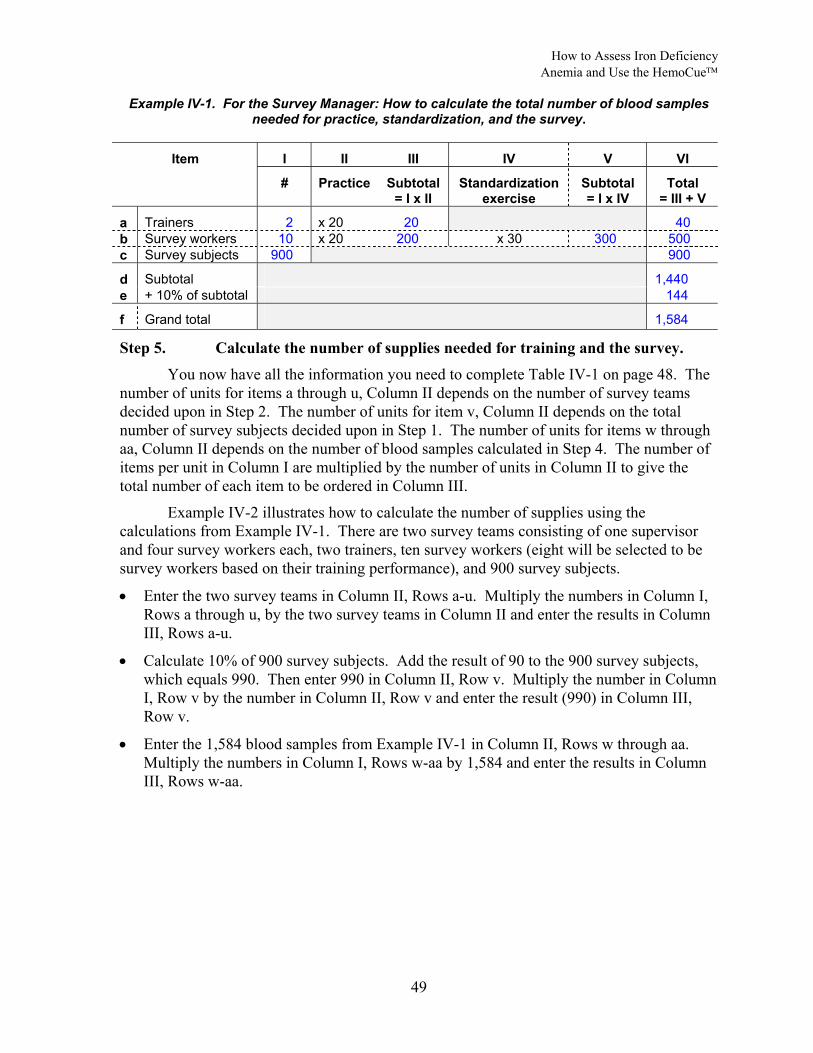
How to Assess Iron Deficiency Anemia and Use the HemoCue
Example IV-1. For the Survey Manager: How to calculate the total number of blood samples needed for practice, standardization, and the survey.
I II III IV V VI Item
# Practice Subtotal= I x II
Standardization exercise
Subtotal = I x IV
Total = III + V
a Trainers 2 x 20 20 40 b Survey workers 10 x 20 200 x 30 300 500 c Survey subjects 900 900
d Subtotal 1,440 e + 10% of subtotal 144
f Grand total 1,584
Step 5. Calculate the number of supplies needed for training and the survey. You now have all the information you need to complete Table IV-1 on page 48. The
number of units for items a through u, Column II depends on the number of survey teams decided upon in Step 2. The number of units for item v, Column II depends on the total number of survey subjects decided upon in Step 1. The number of units for items w through aa, Column II depends on the number of blood samples calculated in Step 4. The number of items per unit in Column I are multiplied by the number of units in Column II to give the total number of each item to be ordered in Column III.
Example IV-2 illustrates how to calculate the number of supplies using the calculations from Example IV-1. There are two survey teams consisting of one supervisor and four survey workers each, two trainers, ten survey workers (eight will be selected to be survey workers based on their training performance), and 900 survey subjects.
• Enter the two survey teams in Column II, Rows a-u. Multiply the numbers in Column I, Rows a through u, by the two survey teams in Column II and enter the results in Column III, Rows a-u.
• Calculate 10% of 900 survey subjects. Add the result of 90 to the 900 survey subjects, which equals 990. Then enter 990 in Column II, Row v. Multiply the number in Column I, Row v by the number in Column II, Row v and enter the result (990) in Column III, Row v.
• Enter the 1,584 blood samples from Example IV-1 in Column II, Rows w through aa. Multiply the numbers in Column I, Rows w-aa by 1,584 and enter the results in Column III, Rows w-aa.
49

Chapter IV: How do I Use the HemoCue to Measure Hemoglobin?
Example IV-2. For the Survey Manager: How to calculate the supplies needed for an anemia survey using the HemoCue (n=900).
I II III Item # items per unit
Type of unit # units Total=I x II
a HemoCue machine 1 survey team 2 2 b Shoulder bag or back pack to carry
equipment and supplies 1 survey team 2 2
c New or recharged AA batteries (5 + 5 backup)
10 survey team 2 20
d Control microcuvette that matches the serial number of the HemoCue machine
1 survey team 2 2
e Quality Assurance Logbook 1 survey team 2 2 f Bottle of alcohol 1 survey team 2 2 g Disinfectant: Lysol spray or bleach 1 survey team 2 2 h Roll of paper towels to disinfect the
worktable 1 survey team 2 2
i Soap for hand washing 1 survey team 2 2 j Basin of water for hand washing 1 survey team 2 2 k Cup to pour water over hands during
hand washing and rinsing 1 survey team 2 2
l Lightweight portable worktable. An additional table for notebooks and supplies is desirable
1 survey team 2 2
m Plastic sheet to drape over work table (paper towels can be used if the table is made of metal or plastic that can be cleaned with disinfectant)
1 survey team 2 2
n Tacks or tape to secure plastic sheet 1 survey team 2 2 o Hard plastic Sharps Biohazard container
to dispose of lancets and microcuvettes 1 survey team 2 2
p Waste paper basket or trash can lined with a plastic bag for items contaminated with blood
1 survey team 2 2
q Pens 2 survey team 2 4 r Clipboard for writing down responses to
the questionnaire 1 survey team 2 2
s Chairs for two survey workers and the subject
3 survey team 2 6
t A thick cloth or mat for survey subjects to lie down if they feel faint
1 survey team 2 2
u Sturdy folder to protect questionnaires 1 survey team 2 2
v Questionnaires 1 survey subject+10%
990 990
w Microcuvettes 1 blood sample 1,584 1,584 x Disposable sterile lancets 1 blood sample 1,584 1,584 y Band-Aids 1 blood sample 1,584 1,584 z Disposable (nonsterile) latex gloves 2 blood sample 1,584 3,168 aa Gauze pads 5 cm x 5 cm (2 in x 2 in) 3 blood sample 1,584 4,752
50

How to Assess Iron Deficiency Anemia and Use the HemoCue
2. How should I ensure the quality of HemoCue measurements? Quality assurance is the continuous review of all factors affecting the quality of
results from the collection of samples to the reading and recording of results. Quality assurance is necessary to:
• protect the safety of field workers and survey subjects; • maintain credibility of the results; • have a sound basis for making program decisions; and • protect and enhance the reputation of the organization.
The first way to ensure quality is to provide good training and supervision. A trainer should be designated to be responsible for ensuring the quality of training and monitoring of all survey workers who collect and analyze blood samples during the survey. The trainers should have some prior experience working in a laboratory taking blood samples with some knowledge of basic statistics and a demonstrated ability to teach skills to survey workers. Prior to training, the trainers should be able to demonstrate the ability to get consistent and accurate HemoCue measurements, and to follow safety procedures for the collection of capillary blood samples. The survey manager should work with the trainers to clarify safety procedures and the standardization exercise about a month before beginning the training.
Another important element of quality assurance is to check to make sure that the HemoCue equipment is maintained in good working order. If the hemoglobin concentration readings are not correct, then the survey results will not be correct. Each HemoCue machine comes with a control microcuvette that enables the user to know whether or not the machine is reading hemoglobin concentration correctly. The control microcuvette has the same serial number as the machine. Do not use a control microcuvette from one HemoCue machine with another machine; they are not interchangeable. It is important to check the serial number of the control microcuvette and the machine every time it is used. To facilitate this in the field, label the control microcuvette box and HemoCue machine with the same colored tape. The control microcuvette specifies the hemoglobin concentration and the acceptable range for readings from the HemoCue machine. If the value read from the machine is within the acceptable range, then the machine is still in good working order. Diagram IV-1 on the following page shows examples of the midpoint and the range of some control microcuvettes.
Dust and dried blood can cause the HemoCue machine to read the values incorrectly, so it is important to keep the machine clean, especially the microcuvette holder. The machine is very sturdy and if it well maintained, not dropped, or left in the sunlight, it can be operated for five to six years and can read tens of thousands of samples without replacement. Periodic servicing and calibration by an authorized dealer is a good idea after a survey to maintain the machine in top condition.
51

Chapter IV: How do I Use the HemoCue to Measure Hemoglobin?
Diagram IV-1. Example of acceptable ranges for different control microcuvettes measured with the corresponding HemoCue machine.
11.0
11.5
12.0
12.5
13.0
red tape blue tape yellow tapecontrol cuvette & machine
hem
oglo
bin
conc
entra
tion
(g/d
l) lower rangemidpointupper range
Acceptable range of hemoglobin concentration (g/dl) Control
microcuvette & machine lower range =
midpoint – 0.3 midpoint upper range =
midpoint + 0.3
red tape 12.1 12.4 12.7 blue tape 11.8 12.1 12.4 yellow tape 12.0 12.3 12.6
It is also important to use fresh, clean microcuvettes. Only one microcuvette should be removed at a time from the container with clean hands and the container should be shut after each microcuvette is removed in order to preserve the microcuvettes remaining in the container (there is desiccant inside the container underneath the cap). The container for the microcuvettes has a place to write the date that it is first opened. In cool dry climates, the microcuvettes will function properly for up to three months. In hot humid climates such as Indonesia and Bangladesh, Helen Keller International has found that the microcuvettes deteriorate much more quickly than three months. Keep the microcuvettes away from heat. At the other extreme, microcuvettes can also dry out due to very low humidity. This has happened at high altitudes in Peru. If the microcuvette has an oily appearance, it is an old microcuvette. To reduce wastage and to assure quality, we recommend ordering packages of 100 microcuvettes that have containers of 25 microcuvettes rather than packages of 200 microcuvettes that have containers of 50 microcuvettes, and discarding any containers that have been opened more than one week prior to use.
The tasks involved in maintaining the HemoCue machine are listed in Table IV-3 on the following page. The trainer should thoroughly review the checklist and practice the procedures for maintaining the HemoCue machine before training. Then, the trainer should review this checklist with the survey workers and used it to evaluate their skills during training. The survey supervisor should use this checklist to maintain the quality of the survey workers’ skills during the survey.
52

How to Assess Iron Deficiency Anemia and Use the HemoCue
Table IV-3. Checklist for maintaining the HemoCue machine.
Task Completed correctly? √
At the beginning of the workday • Visually inspect the HemoCue machine to make sure that it was cleaned at
the end of the previous day. If not, follow the cleaning procedures for the end of the day.
• Check the serial number on HemoCue machine and the control microcuvette. Make sure that the two numbers match. If they do match, record the serial number in the Quality Assurance logbook. If not, contact a supervisor.
• Record the acceptable range for the control microcuvette in the Quality Assurance Logbook.
• Turn on the HemoCue machine and place the control microcuvette into the microcuvette holder. Push the microcuvette holder in until it stops.
• Wait approximately 45 seconds for the value of the control microcuvette to appear in the HemoCue display window. Record the value in the Quality Assurance logbook. If the value is within 0.3 g/dl of the control value, proceed. If not, stop and call a supervisor. If the machine is clean, it may need to be replaced. Return the control microcuvette to its case and close it.
• Check the date on any microcuvette containers that have already been opened. If the containers were opened more than one week ago, do not use the microcuvettes. If a new microcuvette container is opened, write the date that it is opened on the line provided on the container. Record the date in the Quality Assurance Logbook
At the end of the workday • Wear gloves to gently remove the microcuvette holder from the machine. Wipe
the microcuvette holder with a gauze pad. Wash the microcuvette holder with disinfectant solution. Rinse the microcuvette holder thoroughly with water and allow it to air dry completely or dry it completely with gauze if necessary before re-inserting it in the HemoCue machine.
• Wipe the exterior of the HemoCue machine with soap and water. Do not use soap and water on the interior of the HemoCue machine. Record that the HemoCue machine was cleaned in the Quality Assurance Logbook.
• Do not clean the control microcuvette even with water. It should not get dirty if it is handled properly, i.e., always kept closed in its case except when testing the machine.
The Quality Assurance Logbook (Table IV-4 on the following page) is designed to record critical information to make sure that the HemoCue machine is maintained in good operating order throughout the survey. It is absolutely essential to ensure that survey workers maintain the Quality Assurance Logbook and that the supervisor checks it on a daily basis during the survey. This logbook will make it possible to check the survey results and discard any values from machines that have not been properly maintained. Example IV-3 on page 55 shows a completed Quality Assurance Logbook with two mistakes. The survey supervisor did not notice the first mistake, so the survey site had to be revisited. The survey supervisor noticed and corrected the second mistake.
53
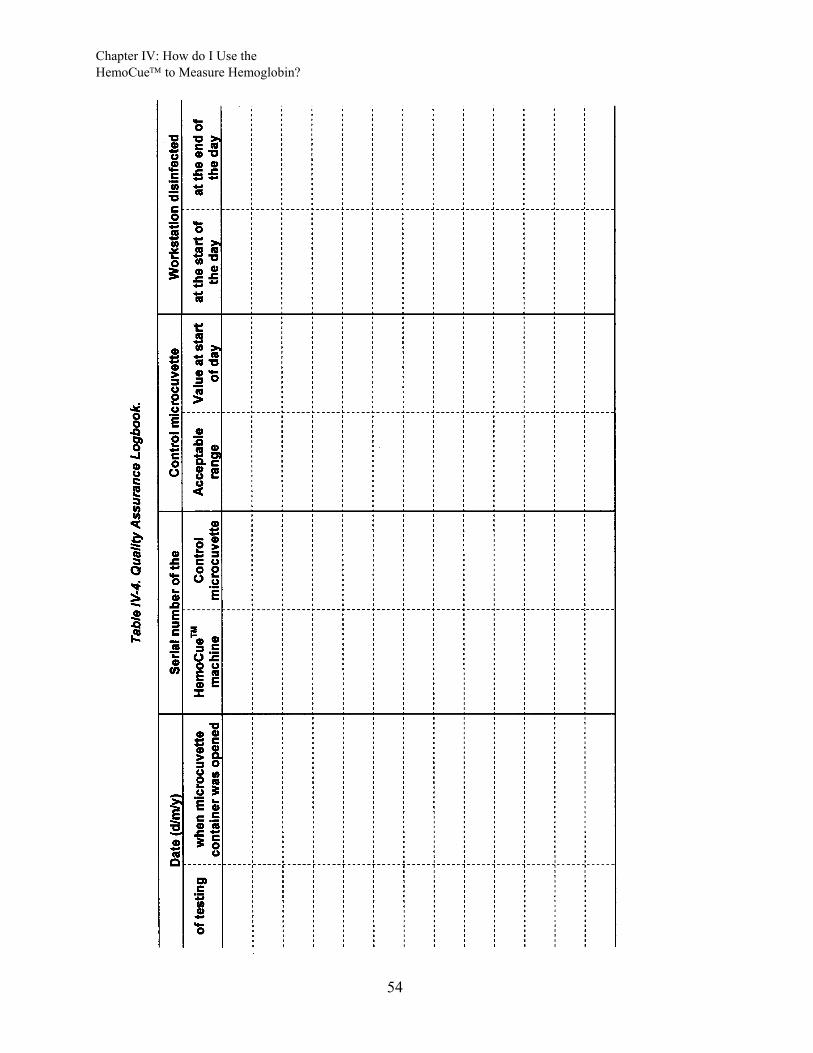
Chapter IV: How do I Use the HemoCue to Measure Hemoglobin?
54

How to Assess Iron Deficiency Anemia and Use the HemoCue
55

Chapter IV: How do I Use the HemoCue to Measure Hemoglobin?
3. How and where should I set up a safe and comfortable workstation? The key characteristics for a safe and comfortable workstation are listed in Table IV-
5 below. If possible, it is recommended that the survey manager and the HemoCue trainers visit several villages to plan the logistics of how to set up a safe and comfortable workstation prior to training.
Table IV-5. Key characteristics of a safe and comfortable workstation.
Characteristic Comments
Semi-private Select an area away from noise and confusion so that the survey worker can concentrate on taking the measurements. The area should not be so isolated that children cannot see other people. Often children will get scared if they are in a room with a stranger and cannot see family members or other familiar faces. Some children are also afraid of having their height or weight taken so select an area that is away from where any height or weights are being taken.
Comfortable for both worker and participant
Provide a chair for both the survey worker and the survey subject during the procedure. The survey worker should have plenty of room to set up the equipment and supplies. There should also be enough room in case the subject feels faint and needs to lie down.
Worktable easy to clean and maintain
Provide a table with a surface that can be sterilized. The surface of the table should be smooth, washable, and free of cracks. If a wood table is used then the surface should be entirely covered with a plastic sheet. This is because blood could get spilled and be absorbed into the wood. The plastic sheet should be tacked or taped to the table so that a child cannot pull on the plastic and spill the supplies.
Free of clutter Organize the work station in order to limit the chance of injuries or exposure to blood. The supplies should be organized so it is unlikely that the disinfectant solution gets knocked over. The Sharps biohazard container should be within easy reach so that the used lancets and microcuvettes can be thrown away immediately. Likewise, the waste basket for the disposal of used gauze etc should also be in easy reach.
Free of food or drink No food or drink is allowed at the workstation because of the possibility that the food or drink can be contaminated with blood or disinfectant.
The procedures for cleaning the workstation are described in Table IV-6 on the following page. The trainer should practice the procedures before training and thoroughly review the checklist with the survey workers and use it to evaluate their skills during training. The survey supervisor should use this checklist to maintain the quality of the survey workers’ skills during the survey.
The workstation can either be set up at a central site in each village or in each survey household. The advantages of using a central site in areas where there are long distances between households is that the workstation can be prepared in advance, the workstation only needs to be set up once every day, and survey workers do not need to transport all of the supplies from house to house.
56
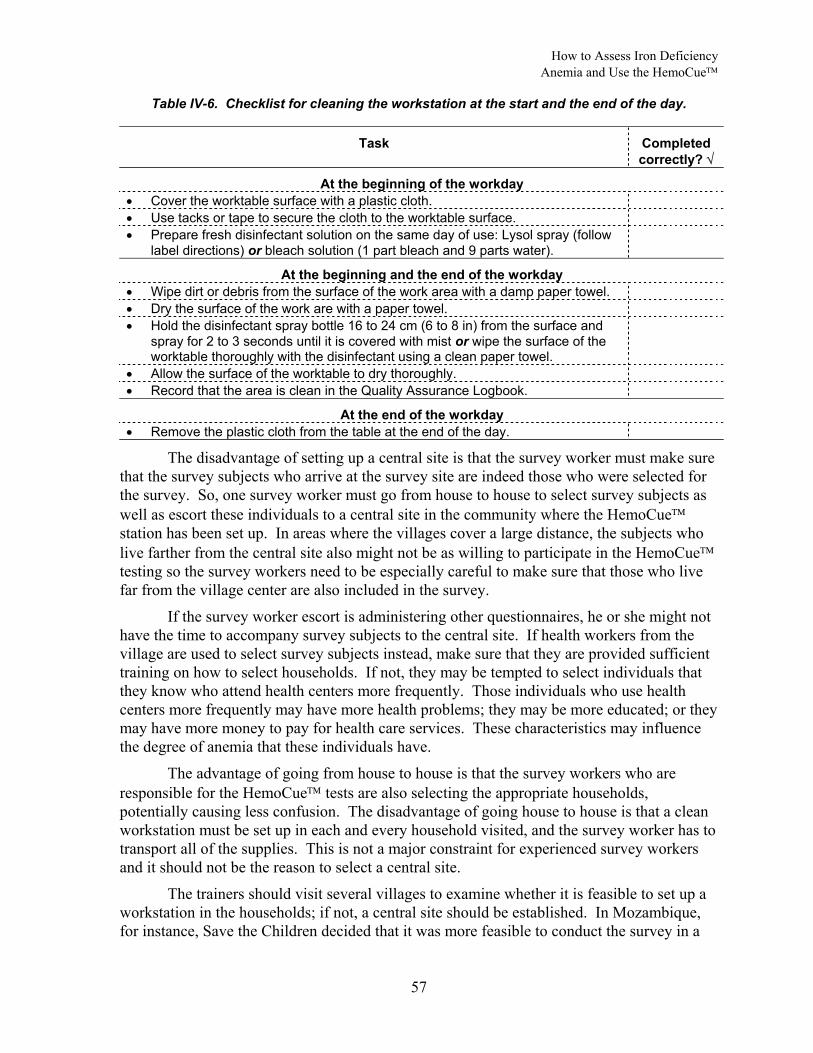
How to Assess Iron Deficiency Anemia and Use the HemoCue
Table IV-6. Checklist for cleaning the workstation at the start and the end of the day.
Task Completed correctly? √
At the beginning of the workday • Cover the worktable surface with a plastic cloth. • Use tacks or tape to secure the cloth to the worktable surface. • Prepare fresh disinfectant solution on the same day of use: Lysol spray (follow
label directions) or bleach solution (1 part bleach and 9 parts water).
At the beginning and the end of the workday • Wipe dirt or debris from the surface of the work area with a damp paper towel. • Dry the surface of the work are with a paper towel. • Hold the disinfectant spray bottle 16 to 24 cm (6 to 8 in) from the surface and
spray for 2 to 3 seconds until it is covered with mist or wipe the surface of the worktable thoroughly with the disinfectant using a clean paper towel.
• Allow the surface of the worktable to dry thoroughly. • Record that the area is clean in the Quality Assurance Logbook.
At the end of the workday • Remove the plastic cloth from the table at the end of the day.
The disadvantage of setting up a central site is that the survey worker must make sure that the survey subjects who arrive at the survey site are indeed those who were selected for the survey. So, one survey worker must go from house to house to select survey subjects as well as escort these individuals to a central site in the community where the HemoCue station has been set up. In areas where the villages cover a large distance, the subjects who live farther from the central site also might not be as willing to participate in the HemoCue testing so the survey workers need to be especially careful to make sure that those who live far from the village center are also included in the survey.
If the survey worker escort is administering other questionnaires, he or she might not have the time to accompany survey subjects to the central site. If health workers from the village are used to select survey subjects instead, make sure that they are provided sufficient training on how to select households. If not, they may be tempted to select individuals that they know who attend health centers more frequently. Those individuals who use health centers more frequently may have more health problems; they may be more educated; or they may have more money to pay for health care services. These characteristics may influence the degree of anemia that these individuals have.
The advantage of going from house to house is that the survey workers who are responsible for the HemoCue tests are also selecting the appropriate households, potentially causing less confusion. The disadvantage of going house to house is that a clean workstation must be set up in each and every household visited, and the survey worker has to transport all of the supplies. This is not a major constraint for experienced survey workers and it should not be the reason to select a central site.
The trainers should visit several villages to examine whether it is feasible to set up a workstation in the households; if not, a central site should be established. In Mozambique, for instance, Save the Children decided that it was more feasible to conduct the survey in a
57

Chapter IV: How do I Use the HemoCue to Measure Hemoglobin?
central cite than transport a portable table from house to house because many households did not have tables. The questions in Table IV-7 below provide some guidance to choosing one option over the other.
Table IV-7. Questions to help decide whether to set up a workstation in a central site or in each survey house.
Question If “Yes”, consider:
Do households have tables, chairs, and a semiprivate working area? setting up in each house Are households right next to each other? setting up in each house
Are poor households crowded with not much working area? setting up a central site Does it take a long time to go from house to house? setting up a central site Is it feasible to designate one survey worker to go from house to house to select eligible subjects and escort them to a central site and for one survey worker to take the HemoCue measurements?
setting up a central site
4. How should I ensure that blood samples are collected safely with informed consent? All blood samples and contaminated supplies should be handled extremely carefully
because blood is a potential source of infection. Universal precautions for the collection of blood, designed to prevent transmission of HIV, Hepatitis B Virus, and other blood-borne pathogens, should be observed.1
Survey workers should be trained to prevent accidents that could endanger them or the survey subjects. Before demonstrating how to collect blood, the trainers should review the procedures in Table IV-8 on the following page for protecting survey workers and survey subjects from exposure to blood. The trainer should practice the procedures prior to training, and then review the checklist with the survey workers and use it to evaluate their skills for during training.
58

How to Assess Iron Deficiency Anemia and Use the HemoCue
Table IV-8. Checklist for survey workers to protect themselves and survey subjects from exposure to blood.
Task Completed correctly? √
• Always wash your hands with soap and water at the start and end of the workday and dry your hands with a clean paper towel. Cover all cuts with Band-Aids to prevent any possibility of blood from survey subjects coming in contact with any cuts.
• Position yourself and the survey subject comfortably to protect against accidental spills and so that the survey subject is in no danger of injury should he or she faint. Face the patient and, if you are right-handed, be able to comfortably hold the subject’s finger with your left hand and use your right hand to work (or the reverse if you are left-handed).
• Always wear well-fitting disposable latex gloves when collecting the blood samples to protect against exposure to blood.
• Always your change gloves before and after collecting blood from each subject and dispose of the gloves at the end of testing each subject in order to protect the subject from being exposed to blood that could be on the gloves from the previous subject.
• Make sure that a disinfectant solution is within reach to immediately clean up any spilled blood.
• Immediately clean up any spills or blood with disinfectant so that survey workers and subjects do not touch any blood.
• Immediately dispose of any paper towels, gloves, gauze pads, or other supplies that have been contaminated with blood in the plastic lined wastebasket.
• Immediately dispose of used lancets and microcuvettes in the Sharps biohazard container to prevent accidents.
• A young child who is tested should be seated in the mother’s or other adult relative’s lap. Use pediatric lancets on children up to five years of age.
• If unprotected skin comes into contact with any blood, immediately flush the exposed area with a large amount of water and soap and notify the survey supervisor.
The trainer should be familiar with local beliefs about blood collection before beginning training. For instance, when Save the Children did the training for using the HemoCue in Mozambique, they discovered that the local population was concerned that “sucking blood” would take away a person's soul. Survey subjects have the right to refuse to have their finger stuck and their blood taken. Fears about taking blood need to be addressed prior to testing in order to make the survey subjects cooperative and comfortable. In some areas, people are concerned when personal information is collected about them. Survey subjects should be reassured that the information will be kept confidential.
Written informed consent should be obtained from all subjects. Informed consent includes:
• an explanation of the purpose of the test in terms that the survey subject can understand; • an explanation of the procedure and risk involved; • an explanation about the right to refuse to participate; and • an explanation about confidentiality.
59

Chapter IV: How do I Use the HemoCue to Measure Hemoglobin?
Example IV-4 on the following page is an informed consent form developed by Project Hope for a mostly literate population with good access to health care in Peru. The informed consent form should be adapted to local concepts about taking blood and knowledge about anemia, pre-tested to make sure it’s understood, and translated into the local language.
The informed consent form should also explain provisions for treatment of anemia. Anemic survey subjects should expect some follow-up. In the cases of severe anemia, provisions should be made for the survey subjects to seek medical care at the nearest health facility. Depending on the country and the organization conducting the survey, survey workers may refer less severe cases of anemia for proper treatment and follow-up at health facilities and/or they may provide iron-folate supplements according to government guidelines. Iron-folate supplements should be provided for this purpose. Iron-folate supplements procured from UNICEF cost about US $2 for 1,000 tablets. All anemic subjects should be counseled about the seriousness of anemia and the importance of taking iron tablets and follow-up at a health facility.
5. How should I ensure that fingers are stuck and microcuvettes are filled properly? The trainer should review the procedures for the finger stick and for filling the
microcuvette. Although survey workers may have already performed finger sticks for malaria smears or to collect blood spots on filter paper, sticking a finger to fill a microcuvette is different. It has been the experience of Helen Keller International that the technique of sticking the finger is the most difficult to master. Mistakes in how survey workers stick the finger can lead to incorrect hemoglobin concentration measurements. Common mistakes include:
• not warming the finger; • not waiting long enough for the alcohol to dry before sticking the finger; • not puncturing the finger adequately or deeply enough; and • squeezing the finger tip.
It is also important for survey workers to use caution in taking the finger stick to avoid exposure to blood. Table IV-9 on page 62 explains the procedures for how to safely stick a finger. The trainer should practice the procedures prior to training, and then review the checklist with the survey workers and use it to evaluate their skills during training. The survey supervisor should use this checklist to maintain the survey workers’ skills during the survey.
60

How to Assess Iron Deficiency Anemia and Use the HemoCue
Example IV-4. Informed Consent for Screening an Adult for Anemia.2
Aim of the Study
I give my consent to be screened for anemia by measuring a very small sample of my blood. I understand that the people who are conducting this screening are trying to find out information to develop a program to prevent and treat anemia in the community.
Procedures for the Collection of Blood Samples
I understand that a middle finger of my left hand (or right hand if I am left-handed) will be stuck with a small needle to collect a small drop of my blood. I understand that the needle will be disposed of after it is used. I understand that this needle may cause some temporary pain in my finger and that some people who see blood are upset. I understand that my skin will be disinfected with alcohol and disposable materials will be used to prevent any infection when the finger is stuck. I understand that the procedure is routinely used and presents almost no risk to me. The amount of blood that is sampled is very small and will not worsen any anemia that I may already have. I understand that there will be no more than one test done. The result of the screening will be communicated to me immediately after the blood sample is taken as well as information on what foods can prevent anemia. If I am anemic, I will be given iron supplements to treat the anemia. If my anemia is severe I will be referred to a health center for follow-up. I have been informed that in the case of any discomfort I can contact the Director of this project.
Withdrawal from Screening
I understand that I can refuse to participate in this screening at any time Confidentiality
I understand that my identity and the results of the analysis will not given to anyone except the team of survey workers
____________________ __________ ____________________
Participant Date Survey Worker
61

Chapter IV: How do I Use the HemoCue to Measure Hemoglobin?
Table IV-9. Checklist for how to stick a finger.
Task Completed correctly? √
• Remove your rings, watches and bracelets that you are wearing. Wash your hands with soap and water and dry your hands thoroughly with a clean paper towel. Cover any cuts with Band-Aids.
• Identify the survey subject by name or survey ID number. Briefly explain the procedure using the informed consent form. If the subject is uncomfortable with the procedure, answer any questions he/she may have. Make sure the subject knows that he/she is free to withdraw from the survey at any time.
• Seat the subject in the chair comfortably where there is no danger of falling should she or he faint. The subject should be sitting in a chair with her right or left hand below the heart and extended to your hand, as if to shake hands. The subject’s fingers should be straight but relaxed. You should face the patient and, if right-handed, be able to comfortably hold the subject’s hand with your left hand and use your right hand to work (or the reverse if you are left-handed). Do not hold the subject’s hand so tightly so as to obstruct blood flow.
• Assemble all supplies to be used on the worktable before testing and then put on a fresh pair of snug-fitting disposable latex gloves. Close the microcuvette container.
• Choose the subject’s middle or the ring finger for the finger stick. The finger should not be callused or swollen. Remove any rings that are on this finger because the ring might interfere with blood flow. Rings on other fingers do not have to be removed unless they are in the way of the tester.
• Feel the subject’s fingers for warmth. If the fingers are cold, rub the fingers vigorously or wrap them in a warm towel. If warm water is available you can also warm them by washing them in the warm water.
• Hold the subject’s finger for the finger stick. Use a rolling motion to massage the finger from the top knuckle towards the finger tip to increase blood flow.
• Clean the subject’s fingertip with a gauze pad wet with alcohol. The alcohol should remain on the skin for at least one minute before drying.
• Wipe the subject’s finger with a clean, dry gauze pad. Be sure the skin is completely dry, but do not touch the skin. Drying and wiping the finger vigorously helps stimulate blood flow.
• Hold the lancet with your middle finger and thumb and use the index finger to trigger the needle. The lancet is placed against the subject’s skin before puncturing it.
• Hold the subject’s finger and apply gentle pressure to firm the skin so that the lancet will go deeper into the finger. The fingertips are very sensitive because they have a lot of nerve endings. Stick the side of the fingertip rather than the pad of the fingertip.
• Use a rolling motion to massage the subject’s finger from the top knuckle towards the finger tip to increase blood flow. Apply pressure and puncture the finger with a sharp, quick motion. Apply gentle pressure to the wrist, palm, and top knuckle to initiate blood flow. Do not try to squeeze or rub the tip of the finger because you may dilute the blood drop with interstitial fluid.
Filling the microcuvette is also important for accurate readings of the hemoglobin concentration. It has been the experience of Helen Keller International that the step of filling microcuvette depends upon a good finger stick. The mistakes include waiting too long before filling the microcuvette, not filling the microcuvette completely, and air bubbles in the
62

How to Assess Iron Deficiency Anemia and Use the HemoCue
microcuvette. Table IV-10 below explains how to fill the microcuvette. The trainer should practice the procedures prior to training, review this checklist thoroughly with the survey workers and use it to evaluate their skills during training. The survey supervisor should use this checklist to maintain the survey workers’ skills during the survey.
Table IV-10. Checklist for how to fill the microcuvette.
Task Completed correctly? √
• Using a dry gauze pad, wipe away the first and second drop of blood with a clean gauze pad. If necessary, gently press the finger until another drop of blood appears. Sample the third drop. The drop of blood should be about the size of the microcuvette circle and large enough to fill it in one touch.
• Hold the finger in one hand. Place the tip of the microcuvette in the middle of the blood drop. Fill the microcuvette completely with a single drop of blood in one step. The microcuvette fills itself by capillary action.
• Inspect the microcuvette for air bubbles by holding it up to the light. If you see air bubbles, do not use the microcuvette. Never refill a partially filled microcuvette with same drop of blood because the blood may have started to clot and will have an incorrect reading. Throw the microcuvette away in the Sharps biohazard container. Refill a new microcuvette from the same finger puncture.
• Carefully wipe off any excess blood from the flat sides of the microcuvette with a clean gauze pad. Make sure no blood is sucked out of the microcuvette while wiping it.
• Place the filled microcuvette into the HemoCue microcuvette holder within one to three minutes of taking the sample, and no later than ten minutes. Gently slide the microcuvette holder into the machine until the stop point is reach. Do not “slam” the holder into position for reading. This may spray blood droplets, which hamper the reading.
• While the HemoCue machine is reading the sample, apply a Band-Aid to the puncture.
• After approximately 45 seconds, the hemoglobin value will appear on the display. Record this value. Dispose of the microcuvette immediately in the Sharps biohazard container after reading it.
• Dispose of the gloves and contaminated supplies in the lined wastebasket.
HemoCue Inc. has both a video and poster on proper technique. In order to obtain these, contact HemoCue (contact information is on page 45 at the beginning of this chapter).
Table IV-11 on the following page summarizes common problems encountered in using the HemoCueTM and solutions. Table IV-12 on page 65 lists some frequently asked questions about safety procedures.
63

Chapter IV: How do I Use the HemoCue to Measure Hemoglobin?
Table IV-11. Common problems and solutions related to capillary sampling and use of HemoCueTM.3
Problem Solution
Not preparing all needed materials before testing a subject.
Place microcuvette, alcohol swab, gauze pad, and lancet on work surface; turn on photometer; pull out the microcuvette holder to “locked” position so the digital screen reads “READY”; put on latex gloves.
Selecting a microcuvette from its container with finger wet with alcohol. The alcohol denatures the chemicals inside the microcuvette; thus, the selected microcuvette as well as others inside the container can be denatured.
Take microcuvette out of its container before handling a wet alcohol swab.
Not drying finger completely after disinfecting with alcohol. Since the HemoCueTM microcuvette only holds 10 µl of blood, its volume can be easily affected by even a trace of alcohol on the puncture site.
Firmly wipe the finger using a dry gauze pad. Firm wiping can also help stimulate blood flow to the subject’s finger tip.
A finger puncture that is too shallow. A deep puncture done with a quick stab will result in better blood flow and more rapid completion of the test.
Restricting blood flow to the subject’s fingertip following the finger stick.
Release the subject’s finger after the stick to allow blood flow; also hold the subject’s hand without squeezing and restricting blood flow to the finger tip.
Milking the subject’s finger. This will lead to mixing of interstitial fluids with the blood drop.
A good finger stick should result in spontaneous blood flow, negating the need to apply pressure to the finger. If stimulating blood flow is needed, apply gentle pressure with your thumb on the opposite side of the subject’s finger from the puncture site.
Not appropriately wiping off the first two blood drops. This may result in an unrepresentative blood sample being tested.
Firmly wipe off the first two large blood drops. Firm wiping will stimulate blood flow. Discarding the first two large drops will allow flow of representative blood sample after initial constriction of capillary bed following the finger stick.
Holding the microcuvette in inverted position (slit facing down) during filling. This can lead to air bubbles being trapped resulting in erroneous reading.
Hold the microcuvette with the slit facing up and the pointed tip touching the blood drop.
“Topping off” a partially filled microcuvette with repeated blood collection. The reagents in the microcuvette are denatured upon contact with the initial amount of blood; red cells of blood introduced later will not be adequately analyzed.
Allow a large blood drop to form on the subject’s finger so that it will completely fill the microcuvette in one motion. Once filled, hold the microcuvette in place for about 2-3 seconds longer to ensure complete filling.
Not cleaning off blood on outside of microcuvette before testing can result in erroneously high reading.
Wipe off excess blood from sides of microcuvette using a “butter knife” motion to ensure that blood from inside the microcuvette is not removed.
“Slamming” the microcuvette holder into place can lead to blood drops spattering inside the reading chamber.
Push the microcuvette holder gently into position. Once or twice a day clean the microcuvette holder with alcohol swab and completely dry before testing. Periodically clean the reading chamber with dry gauze.
64

How to Assess Iron Deficiency Anemia and Use the HemoCue
Table IV-12. Questions and answers for survey workers about safety procedures.
Question Answer
What should I do if blood is spilled?
Immediately clean up any spills or blood with disinfectant so that the survey workers and the survey subjects do not touch this blood.
What should I do with supplies that have some blood on them?
Immediately dispose of any paper towels, gloves, gauze pads, or other supplies that have been contaminated with blood in a plastic bag-lined waste basket.
What should I do with used lancets and microcuvettes?
Immediately dispose of used lancets and microcuvettes in the Sharps biohazard container.
How should I stick a child’s finger?
Have the child sit in his or her mother’s or another family member’s lap.
What should I do if blood gets on anyone’s skin?
If unprotected skin comes into contact with any blood, immediately flush the exposed area with a large amount of water and soap and notify the survey supervisor.
65

Chapter IV: How do I Use the HemoCue to Measure Hemoglobin?
66
1 United States Centers for Disease Control and Prevention. Perspectives in disease prevention and health promotion update: Universal precautions for prevention of transmission of Human Immunodeficiency Virus, Hepatitis B Virus, and other blood borne pathogens in health care settings. Morbidity and Mortality Weekly Report, 37, 24, 377-388, 1988.
2 Project HOPE, 1996. Child Survival Project, Huallaga Valley, Peru. 3 Parvanta I. Using the HemoCueTM. Monograph. Atlanta, Georgia: Division of Nutrition and Physical
Activity, National Center for Chronic Disease Prevention and Health Promotion, United States Centers for Disease Control and Prevention, 1999.

How to Assess Iron Deficiency Anemia and Use the HemoCue
Chapter V: How to Train Survey Workers to Take Reliable and Accurate HemoCue Measurements
There are two characteristics that should be sought in measurements:
• Reliability (or consistency) is how close repeated measurements, in this case, hemoglobin concentration, are to one another.
• Accuracy is how close the measurement of hemoglobin concentration is to the true hemoglobin concentration of the survey subject.
There is always some degree of measurement error using any method. The way to ensure that measurements are as reliable and accurate as possible is to practice good technique in sticking a finger and filling the microcuvette (as described in Chapter IV, Section 5, pages 60, 62, and 63). It is important that adequate training and practice for trainers and survey workers alike.
1. How do measurement errors affect anemia prevalence estimates?
When survey workers measure the hemoglobin concentration of individual subjects with minimal error, the estimate of the prevalence of anemia will be close to the true prevalence. When measurement errors are large and random, the estimated prevalence of anemia is likely to be higher than the actual prevalence. When measurement errors are biased, the estimated prevalence of anemia may be either higher or lower than the actual prevalence.
Errors in technique that produce readings on the HemoCueTM that are lower than the true hemoglobin concentration, lead to overestimates of the prevalence of anemia. Errors that cause false low hemoglobin concentration readings are described in Table V-1 below.
Table V-1. Errors that produce false low hemoglobin concentration readings.
Error in technique Explanation for low reading.
Finger still wet from the alcohol solution when punctured.
Blood diluted with alcohol.
Finger squeezed hard or “milked”. Blood drop diluted with interstitial fluid. Microcuvette contains air bubbles seen when held up to the light.
Concentration of red blood cells in the microcuvette lowered.
Errors in technique that produce readings on the HemoCueTM that are higher than the true hemoglobin concentration, lead to underestimates of the prevalence of anemia. Potential errors that cause false high hemoglobin concentration readings are described in Table V-2 on the following page.
67

How To Train Survey Workers to Take Reliable and Accurate HemoCue Measurements
Table V-2. Errors that produce false high hemoglobin concentration readings.
Error in technique Explanation for high reading
Microcuvette is incompletely filled, seen when held up to the light because of poor blood flow from a shallow finger stick.
Chemicals in the microcuvette not mixed with the reagents properly.
Microcuvette taken from a container that had been opened more than one week ago in a hot humid climate (or more than three months ago in a temperate climate).
Chemicals in the microcuvette have deteriorated.
Blood sample clots before the microcuvette was filled.
Blood was more concentrated than it should have been.
Measurement error can be due to unreliability or inaccuracy, or both. Diagram V-1 below illustrates reliable or consistent hemoglobin concentration measurements. Reliability is how close repeated measurements are close to one another. Two samples have been collected from each of five survey subjects and measured by the same survey worker. The filled blue circles indicate the values for sample 1. The open red circles indicate the values for sample 2. The difference between the two measurements from each of the same subjects is less than 0.5 g/dl. The solid blue line indicates the mean (or average) of the first five samples. The red dotted line indicates the mean of the second five samples. The mean values for the first and second samples are very similar.
Diagram V-1. Reliable measurements of hemoglobin concentration using the HemoCue™, Mozambique, 1998.
10.0
15.0
20.0
1 2 3 4 5Survey subject
hem
oglo
bin
conc
entra
tion
(g/d
l)
Sample 1 Sample 2Mean Sample 1 Mean Sample 2
Diagram V-2 on the following page illustrates unreliable or inconsistent measurements. As above, two samples have been collected from each of five survey subjects and measured by the same survey worker. Here, the difference between the two measurements from each of the subjects is greater than 0.5 g/dl. The mean values of the first and second samples, however, are similar.
68

How to Assess Iron Deficiency Anemia and Use the HemoCue
Diagram V-2. Unreliable measurements of hemoglobin concentration using the HemoCue™, Mozambique, 1998.
10.0
15.0
20.0
1 2 3 4 5Survey subject
Hem
oglo
bin
conc
entra
tion
(g/d
l)
Sample 1 Sample 2Mean Sample 1 Mean Sample 2
Since the mean values of the unreliable measurements in Diagram V-2 above are similar, you might wonder whether reliable measurements are really that important. The answer is, yes, they are!
Diagram V-3 on the following page shows the same population measured by two different survey teams, team 1 and team 2. The measurements taken by team 1, indicated by the solid blue triangles, were reliable hemoglobin measurements. The measurements taken by team 2, indicated by the open red triangles, were unreliable hemoglobin measurements. The cutoff value for anemia among children 6-59 months is also shown. The mean hemoglobin values for team 1 (11.0 g/dl) and for team 2 (11.7 g/dl), but the distribution curves are quite different. The distribution curve of team 1, the reliable measurements, is taller and has few values at the tails of the curve. The distribution curve of team 2, the unreliable measurements, is much shorter and wider. This is because some of the unreliable measurements will be smaller than the true values while others will be larger than the true values. The smaller and larger values will make the curve wider. Thus, the estimated prevalence of anemia according to team 2 (unreliable measurements) is 33% because the left-hand tail of this distribution curve is longer, while the estimated prevalence of anemia according to team 1 (reliable measurements) is only 21%.
69

How To Train Survey Workers to Take Reliable and Accurate HemoCue Measurements
Diagram V-3. Distribution of hemoglobin concentrations among preschool children (6-59 months) according to the reliability of the HemoCue™ measurements, Mozambique, 1998.
0%
10%
20%
30%
40%
50%
0.0 5.0 10.0 15.0 20.0Hemoglobin concentration (g/dl)
Prop
ortio
n of
chi
ldre
n (%
)Survey team 1
Survey team 2
anemia cutoff(reliable)
(unreliable)
Measurements must be accurate as well as reliable. Accuracy is how close a measurement of hemoglobin concentration is to the true hemoglobin concentration, which is possible to estimate only under carefully controlled conditions in a laboratory setting.
Diagram V-4 on the following page illustrates inaccurate measurements taken by a survey worker and a trainer. It is assumed that the trainer takes more accurate hemoglobin measurements than the survey worker, but this may not always be the case. Two samples have been collected from each of five survey subjects. The filled blue circles indicate the values for the survey worker. The filled red squares indicated the values for the trainer. None of the two hemoglobin measurements from the same subjects are within 0.5 g/dl of each other. The solid blue line indicates the mean (or average) of the five samples taken by the survey worker. The thick red line indicates the mean of the five samples taken by the trainer. The mean of the survey worker is more than 0.5 g/dl greater than the mean of the trainer.
70

How to Assess Iron Deficiency Anemia and Use the HemoCue
Diagram V-4. Inaccurate measurements of hemoglobin concentration using the HemoCue™, Mozambique, 1998.
5.0
10.0
15.0
1 2 3 4 5Survey subject
Hem
oglo
bin
conc
entra
tion
(g/d
l)Survey worker SupervisorMean Survey worker Mean SupervisorMean trainerMean survey worker
Diagram V-5 on the following page shows the same population measured by two different survey teams, team 1 and team 2. The measurements by team 1, indicated by the solid blue triangles, are accurate hemoglobin measurements. The measurements by team 2, indicated by the open red triangles, are inaccurate hemoglobin measurements. The cutoff value for anemia among adult men is also shown. The distribution curve of team 1, the accurate measurements, has about the same shape as the curve of team 2. However, the distribution curve of team 2 is shifted to the left of the curve of team 1. Measurement error usually leads to overestimates of anemia prevalence. The mean hemoglobin concentration of team 1 is 14.9 g/dl, which is quite different from the mean hemoglobin concentration of team 2, 13.9 g/dl. The difference in the estimated prevalence is very large because the distribution curve for the inaccurate measurements is to the left of the curve for the accurate measurements. The estimated anemia prevalence is 49% based on the inaccurate measurements and 14% based on the accurate measurements!
71

How To Train Survey Workers to Take Reliable and Accurate HemoCue Measurements
Diagram V-5. Distribution of hemoglobin concentrations among adult men according to the accuracy of the HemoCue™ measurements, Mozambique, 1998.
0%
10%
20%
30%
40%
50%
0.0 5.0 10.0 15.0 20.0Hemoglobin concentration (g/dl)
Prop
ortio
n of
men
(%)
Survey team 1
Survey team 2anemia cutoff
(inaccurate)
(accurate)
2. How does training enhance the reliability and accuracy of hemoglobin measurements?
The way to ensure that hemoglobin measurements are reliable and accurate is to practice under the guidance of an experienced trainer. Good technique was described in great detail in Chapter IV. Helen Keller International has developed and extensively tested the training protocol to practice (described in Steps 1-2, pages 73-78) and standardize (described in Step 3, pages 78-82) the measurement of hemoglobin concentration using the HemoCueTM.
In summary, the training protocol consists of three steps. First, trainers practice taking duplicate blood samples from each other and from volunteers until results are consistent. This should occur prior to training. Second, the training participants practice taking duplicate samples from each other and from volunteers until results are consistent. Third, each training participant takes duplicate blood samples from one finger stick from ten volunteers and the trainer takes another sample from a second finger stick from the same ten volunteers. The third step is a standardization exercise, which allows the trainer to pick the most competent survey workers by calculating the degree of reliability (intraobserver variance) and the degree of accuracy (interobserver variance) of the survey workers’ measurements.
There are two main sources of error in the measurement of the hemoglobin concentration:
• sticking the finger; and • filling the microcuvette.
72

How to Assess Iron Deficiency Anemia and Use the HemoCue
Sticking fingers and getting a large enough blood drop to fill the microcuvette are two of the most difficult and error-prone steps in using the HemoCue. It is extremely important to practice this technique until measurement error is within an acceptable range. Trainers and survey workers should first practice taking two finger sticks from the same person and then practice taking two blood drops from one finger stick. The two finger sticks should be taken from the same hand because different values may be obtained from different hands. Once finger sticking has been mastered, it will be possible to practice filling two microcuvettes with two consecutive blood drops from one finger stick. If the finger stick is not deep enough, the blood flow will be inadequate to fill two microcuvettes.
Unfortunately, finger sticks involve a certain amount of pain and discomfort on the part of the volunteer. Be sure to inform the volunteers in advance if the tester will stick their fingers twice. Helen Keller International staff has found that multiple finger sticks can be difficult even for highly motivated volunteers.
Step 1. Practice for trainers. The first step of training is for trainers to practice to learn and relearn the technique
before every new training and survey. If there is more than one trainer, they should first practice on each other to get comfortable with the procedure.
Then the trainers should practice on volunteers, collecting one blood drop from each of two finger sticks per volunteer. The trainers should continue to practice until each trainer collects two consecutive samples that are within 0.5 g/dl of each other. This practice reduces stick-to-stick variability. The procedures for practice collecting one blood drop from each finger stick are described in Table V-3 below.
Table V-3. Checklist for collecting one blood drop from each finger stick.
Task Completed correctly? √
• Stick the selected finger with the lancet. • Wipe away the first drop of blood with a clean gauze pad. • Wipe away the second drop of blood with the same gauze pad. • Fill the microcuvette with third drop and take a reading. • Repeat the above procedures for the second finger stick.
Table V-4 on the following page is a recording form for these comparisons, which is followed by the instructions for how it should be completed. Record that the tester is the “trainer” and fill in Part A. Duplicate finger sticks. If the readings from two samples are not within 0.5 g/dl of each other, the potential reasons for the differences should be noted in the last column of the recording form as shown in Example V-1 on page 75.
A second sample that is consistently lower (resulting in a negative difference) or higher (resulting in a positive difference) than the first sample from the same volunteers indicates that the trainer might be continually making the same type of error, which will bias the results. In Example V-1, the differences between the first and second samples do not show any consistent errors that could lead to bias.
73

How To Train Survey Workers to Take Reliable and Accurate HemoCue Measurements
74
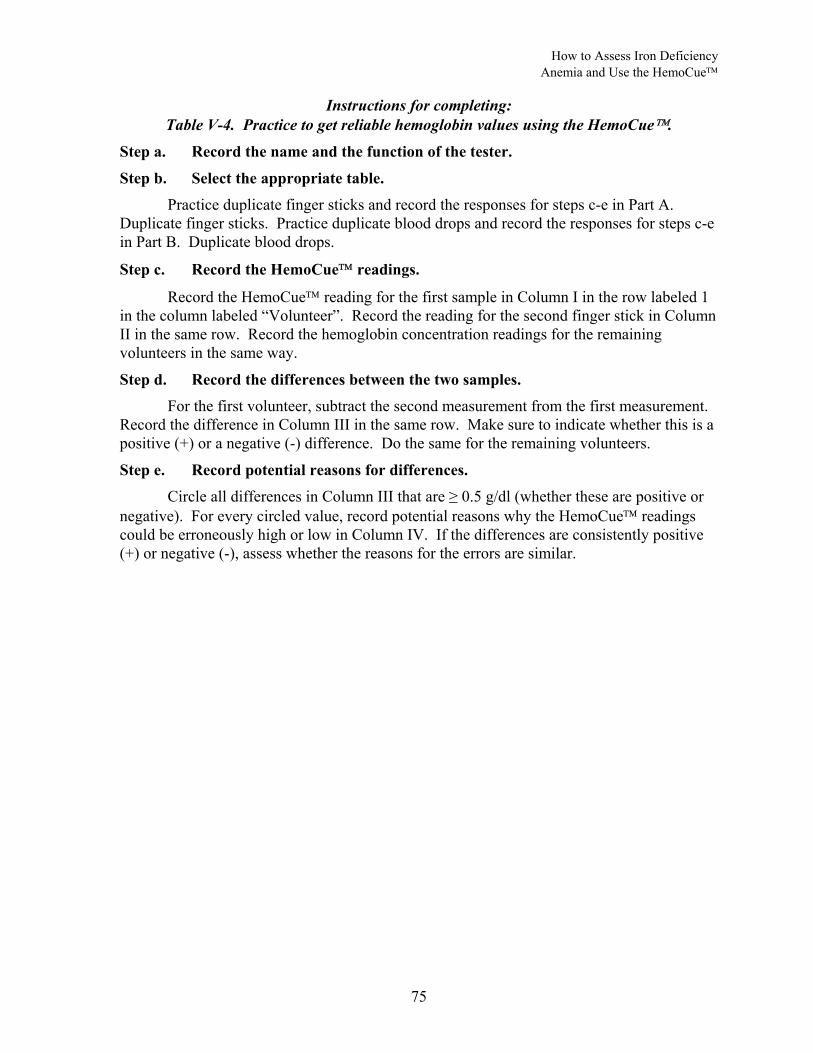
How to Assess Iron Deficiency Anemia and Use the HemoCue
Instructions for completing: Table V-4. Practice to get reliable hemoglobin values using the HemoCue.
Step a. Record the name and the function of the tester.
Step b. Select the appropriate table. Practice duplicate finger sticks and record the responses for steps c-e in Part A.
Duplicate finger sticks. Practice duplicate blood drops and record the responses for steps c-e in Part B. Duplicate blood drops.
Step c. Record the HemoCue readings.
Record the HemoCue reading for the first sample in Column I in the row labeled 1 in the column labeled “Volunteer”. Record the reading for the second finger stick in Column II in the same row. Record the hemoglobin concentration readings for the remaining volunteers in the same way.
Step d. Record the differences between the two samples. For the first volunteer, subtract the second measurement from the first measurement.
Record the difference in Column III in the same row. Make sure to indicate whether this is a positive (+) or a negative (-) difference. Do the same for the remaining volunteers.
Step e. Record potential reasons for differences. Circle all differences in Column III that are ≥ 0.5 g/dl (whether these are positive or
negative). For every circled value, record potential reasons why the HemoCue readings could be erroneously high or low in Column IV. If the differences are consistently positive (+) or negative (-), assess whether the reasons for the errors are similar.
75

How To Train Survey Workers to Take Reliable and Accurate HemoCue Measurements
76

How to Assess Iron Deficiency Anemia and Use the HemoCue
Next, the trainers should practice collecting two blood drops from one finger stick from volunteers. The checklist in Table V-5 below describes the steps for collecting two blood drops from each finger stick. The trainers should continue to practice until each collects two consecutive samples that are within 0.5 g/dl of each other. This practice reduces the drop-to-drop variability.
Table V-5. Checklist for collecting two blood drops each finger stick.
NOTE: FOR PRACTICE AND STANDARDIZATION ONLY - NOT FOR ACTUAL SURVEY
Task Completed correctly? √
• Stick the selected finger with the lancet. • Wipe away the first drop of blood with a clean gauze pad. • Wipe away the second drop of blood with the same gauze pad. • Fill the first microcuvette with the third drop. • Quickly wipe away any remaining blood from the third drop. • Fill the second microcuvette with the fourth drop. • Read the first microcuvette. • Read the second microcuvette.
Use Table V-4 on page 74 to also record the measurements from practice collecting two blood drops from one finger stick. Fill in Part B, Duplicate blood drops, as shown in Example V-1 on page 76. A shallow finger stick might make it more difficult to obtain an adequate blood flow to collect the second sample from the same finger stick. When the second samples are consistently higher or lower than the first samples, the finger sticking technique should be reviewed carefully (see Chapter IV, Section 5, pages 60-64). Squeezing the finger to get enough blood for the second samples, as illustrated by the negative differences in Example V-1, would result in hemoglobin concentrations that are lower than for first samples. Other errors such as not filling the second microcuvette completely or allowing the blood to clot in the second microcuvette, while measuring the first microcuvette, would result in hemoglobin concentrations that are lower than for first samples (see Tables V-1 and V-2 on pages 67-68).
Generally, an individual can master each technique (collecting consistent measurements from one drop from each of two finger sticks and collecting consistent measurements from two drops from each finger stick) by practicing on five volunteers. So the total number of volunteers needed for each trainer is ten.
The volunteers should be similar in age and gender to the subjects that will be selected in the survey. If young children are to be selected, trainers and survey workers will need to practice sticking young children while their mothers hold them. The fingers of young children often bleed more than those of older children or adults. If women or men who work in the fields are to be included in the sample, trainers and survey workers will need to practice sticking tough calloused fingers. Volunteers can be found in clinic settings, medical or nursing schools, schools, market places or other situations where a large number of people are gathered in one location. The trainers and survey workers should not be distracted by survey sampling methods while they are concentrating on mastering the skills in taking reliable and accurate hemoglobin readings.
77

How To Train Survey Workers to Take Reliable and Accurate HemoCue Measurements
Step 2. Practice for survey workers. The second step of training for survey workers to practice in order to learn the
technique during the initial training and relearn the technique before every new survey. The survey workers should first practice on each other to get comfortable with the procedure.
After becoming comfortable with the procedures, survey workers should then practice on volunteers, collecting one blood drop from each of two finger sticks. The procedures for practice collecting one blood drop from each of two finger sticks are described in Table V-3 on page 73. The survey workers should continue to practice until each collects two consecutive samples that are within 0.5 g/dl of each other to reduce the stick-to-stick variability. Record the name and function of the tester in Table V-4 on page 74 as shown in Example V-2 below. Then fill in Part A of Table V-4 by following the instructions on page 75.
Example V-2. Practice to get reliable hemoglobin values using the HemoCue.
Name of tester: Aissa ............................ Function of tester: survey worker ......... (Trainer or survey worker)
After completing the practice with duplicate finger sticks, the survey workers should practice collecting two blood drops from one finger stick. The procedures for collecting two blood drops from each finger stick are described in Table V-5 on the previous page. The survey workers should continue to practice until each collects two consecutive samples that are within 0.5 g/dl of each other. This practice reduces the drop-to-drop variability. Fill in Part B of Table V-4 by following the instructions on page 75.
Step 3. Standardization exercise. The third step of training is a standardization exercise. The standardization exercise
consists of each survey worker taking duplicate blood drops from one finger stick from each of ten volunteers, and the trainer taking another blood sample from a second finger stick from the same ten volunteers. Each survey worker should carry out a standardization exercise with the trainer during training and again before every new survey. Ideally, the trainer should also carry out a standardization exercise to make sure that his or her measurements are reliable and accurate. If this is possible during a trainer of trainers, it should be done.
First, the survey worker takes two sample blood drops from a single finger stick of a volunteer (as described in Table V-5 on the previous page). Next, the trainer takes a third sample from a second finger stick from the same volunteer. This procedure is repeated on ten volunteers for each survey worker. Ten volunteers are needed for each survey worker for the standardization exercise.
Table V-6 on the following page is the recording form for comparisons between measurements taken by the survey workers and the trainer(s), followed by the instructions for completing this table on page 80. If the readings from the two samples collected by the survey worker are not within 0.5 g/dl of each other, the potential reasons for the differences should be noted in Column IV as shown in Example V-3.
78

How to Assess Iron Deficiency Anemia and Use the HemoCue
79
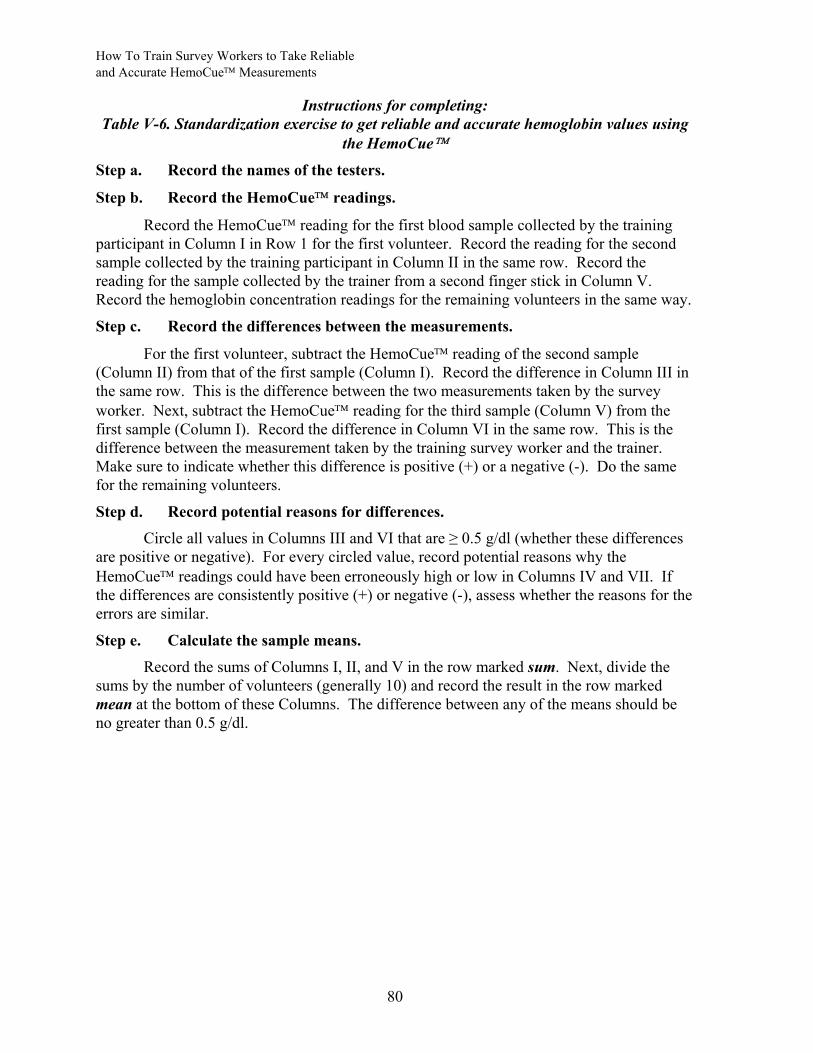
How To Train Survey Workers to Take Reliable and Accurate HemoCue Measurements
Instructions for completing: Table V-6. Standardization exercise to get reliable and accurate hemoglobin values using
the HemoCue
Step a. Record the names of the testers.
Step b. Record the HemoCue readings.
Record the HemoCue reading for the first blood sample collected by the training participant in Column I in Row 1 for the first volunteer. Record the reading for the second sample collected by the training participant in Column II in the same row. Record the reading for the sample collected by the trainer from a second finger stick in Column V. Record the hemoglobin concentration readings for the remaining volunteers in the same way.
Step c. Record the differences between the measurements.
For the first volunteer, subtract the HemoCue reading of the second sample (Column II) from that of the first sample (Column I). Record the difference in Column III in the same row. This is the difference between the two measurements taken by the survey worker. Next, subtract the HemoCue reading for the third sample (Column V) from the first sample (Column I). Record the difference in Column VI in the same row. This is the difference between the measurement taken by the training survey worker and the trainer. Make sure to indicate whether this difference is positive (+) or a negative (-). Do the same for the remaining volunteers.
Step d. Record potential reasons for differences. Circle all values in Columns III and VI that are ≥ 0.5 g/dl (whether these differences
are positive or negative). For every circled value, record potential reasons why the HemoCue readings could have been erroneously high or low in Columns IV and VII. If the differences are consistently positive (+) or negative (-), assess whether the reasons for the errors are similar.
Step e. Calculate the sample means. Record the sums of Columns I, II, and V in the row marked sum. Next, divide the
sums by the number of volunteers (generally 10) and record the result in the row marked mean at the bottom of these Columns. The difference between any of the means should be no greater than 0.5 g/dl.
80

How to Assess Iron Deficiency Anemia and Use the HemoCue
81

How To Train Survey Workers to Take Reliable and Accurate HemoCue Measurements
Large differences between the survey worker’s measurements of duplicate blood samples are an indication of unreliability. In Example V-3 on the previous page, the differences between the survey worker’s measurements of duplicate samples from four out of the ten volunteers were ≥ 0.5 g/dl, which indicates that this survey worker did not measure hemoglobin concentration reliably. Large differences that are consistently positive (+) or consistently negative (-) may be an indication that the survey worker has not yet mastered the finger sticking technique. There were more negative (three) than positive differences (one) between samples measured by the survey worker in Example V-3. The type of errors (not filling the microcuvette and squeezing the finger) might be a result of shallow finger sticks.
Large differences between the blood samples measured by the survey worker and those measured by the trainer that are consistently positive (+) or negative (-) are an indication of inaccuracy. In Example V-3 on the previous page, half the differences (five out of ten) between the measurements taken by the survey worker and the trainer were ≥ 0.5 g/dl and most of these (four out of five) were negative. The trainer only made one error while the survey worker made four errors, which indicates that this survey worker’s measurements were inaccurate as well as unreliable.
3. What criteria do I use to select survey workers capable of taking reliable and accurate measurements?
The trainer and survey manager should evaluate the capability of the training participants based on the reliability and accuracy of their measurements. Reliability is evaluated by calculating the variance (standard deviation squared) of the differences between the duplicate samples measured by the survey worker. Accuracy is evaluated by calculating the variance of the differences between the samples measured by the survey worker and those measured by the trainer.
The variance of the differences between the duplicate samples measured by the survey workers (intraobserver variance) should be less than 0.5. Because variance is a squared number, this means that measurements are within 0.7 g/dl of each other. If the intraobserver variance is 0.5 or greater, the survey worker must continue to practice. The variance of the differences between the samples measured by the survey worker and those measured by the trainer (interobserver variance) should be less than 1.0. If the interobserver variance is 1.0 or greater, the survey worker should continue to practice. If, after more practice, a survey worker still cannot achieve these variances, then he/she should not be selected to stick fingers. He/she may be selected, however, to administer questionnaires or for other survey activities.
Table V-7 on the following page is a recording form for calculating the intraobserver variance of the differences between the duplicate samples measured by the survey worker and the interobserver variance of the differences between the samples measured by the survey worker and those measured by the trainer. The instructions for completing Table V-7 on page 84 describe how to calculate the variances. A completed table is shown in Example V-4 on page 85.
82

How to Assess Iron Deficiency Anemia and Use the HemoCue
83
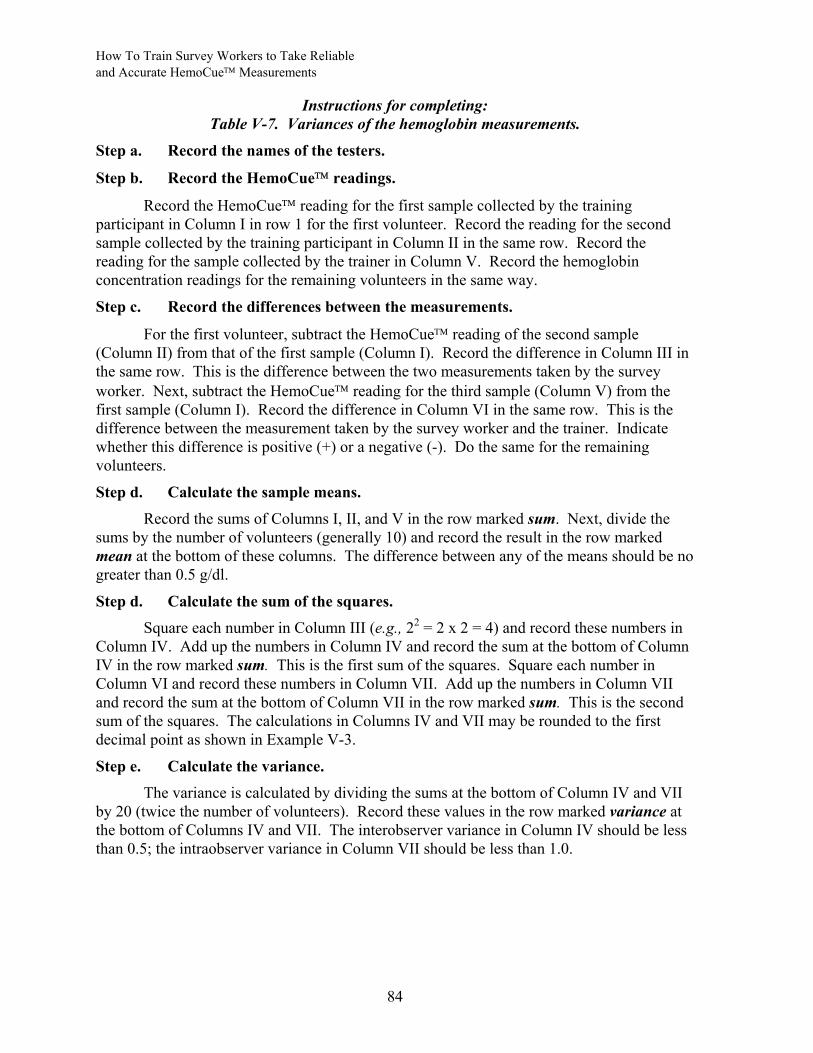
How To Train Survey Workers to Take Reliable and Accurate HemoCue Measurements
Instructions for completing: Table V-7. Variances of the hemoglobin measurements.
Step a. Record the names of the testers.
Step b. Record the HemoCue readings.
Record the HemoCue reading for the first sample collected by the training participant in Column I in row 1 for the first volunteer. Record the reading for the second sample collected by the training participant in Column II in the same row. Record the reading for the sample collected by the trainer in Column V. Record the hemoglobin concentration readings for the remaining volunteers in the same way.
Step c. Record the differences between the measurements.
For the first volunteer, subtract the HemoCue reading of the second sample (Column II) from that of the first sample (Column I). Record the difference in Column III in the same row. This is the difference between the two measurements taken by the survey worker. Next, subtract the HemoCue reading for the third sample (Column V) from the first sample (Column I). Record the difference in Column VI in the same row. This is the difference between the measurement taken by the survey worker and the trainer. Indicate whether this difference is positive (+) or a negative (-). Do the same for the remaining volunteers.
Step d. Calculate the sample means. Record the sums of Columns I, II, and V in the row marked sum. Next, divide the
sums by the number of volunteers (generally 10) and record the result in the row marked mean at the bottom of these columns. The difference between any of the means should be no greater than 0.5 g/dl.
Step d. Calculate the sum of the squares. Square each number in Column III (e.g., 22 = 2 x 2 = 4) and record these numbers in
Column IV. Add up the numbers in Column IV and record the sum at the bottom of Column IV in the row marked sum. This is the first sum of the squares. Square each number in Column VI and record these numbers in Column VII. Add up the numbers in Column VII and record the sum at the bottom of Column VII in the row marked sum. This is the second sum of the squares. The calculations in Columns IV and VII may be rounded to the first decimal point as shown in Example V-3.
Step e. Calculate the variance. The variance is calculated by dividing the sums at the bottom of Column IV and VII
by 20 (twice the number of volunteers). Record these values in the row marked variance at the bottom of Columns IV and VII. The interobserver variance in Column IV should be less than 0.5; the intraobserver variance in Column VII should be less than 1.0.
84

How to Assess Iron Deficiency Anemia and Use the HemoCue
85
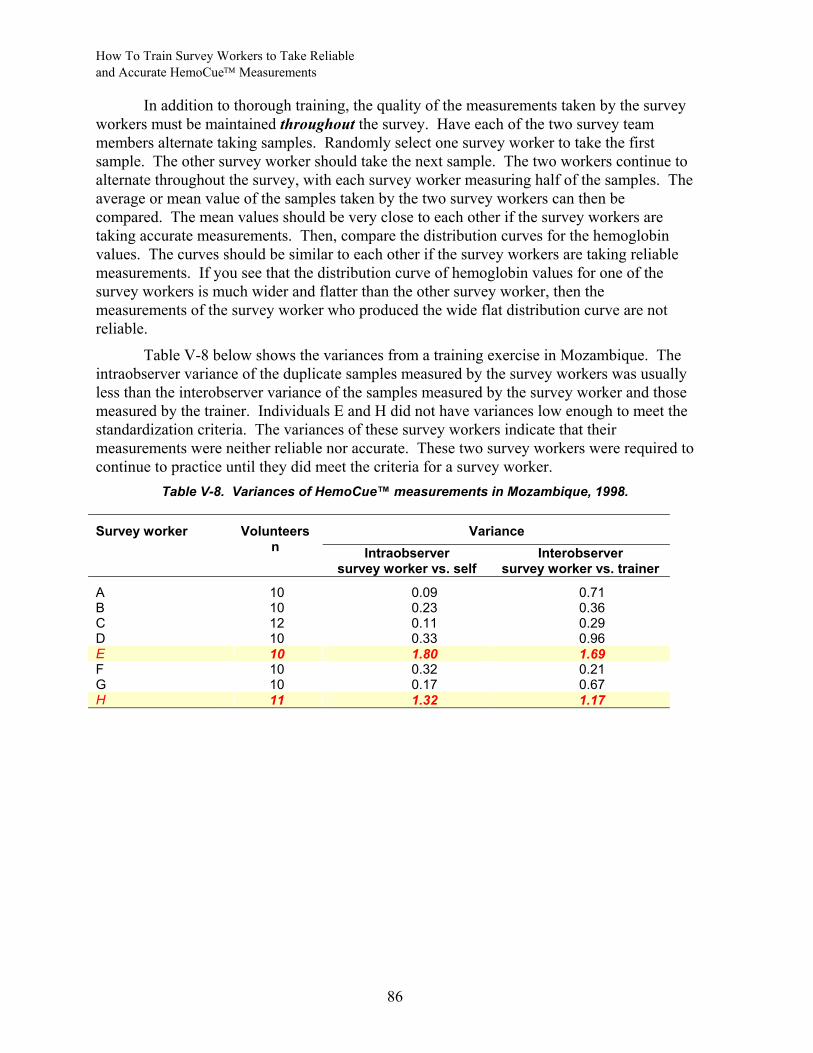
How To Train Survey Workers to Take Reliable and Accurate HemoCue Measurements
86
In addition to thorough training, the quality of the measurements taken by the survey workers must be maintained throughout the survey. Have each of the two survey team members alternate taking samples. Randomly select one survey worker to take the first sample. The other survey worker should take the next sample. The two workers continue to alternate throughout the survey, with each survey worker measuring half of the samples. The average or mean value of the samples taken by the two survey workers can then be compared. The mean values should be very close to each other if the survey workers are taking accurate measurements. Then, compare the distribution curves for the hemoglobin values. The curves should be similar to each other if the survey workers are taking reliable measurements. If you see that the distribution curve of hemoglobin values for one of the survey workers is much wider and flatter than the other survey worker, then the measurements of the survey worker who produced the wide flat distribution curve are not reliable.
Table V-8 below shows the variances from a training exercise in Mozambique. The intraobserver variance of the duplicate samples measured by the survey workers was usually less than the interobserver variance of the samples measured by the survey worker and those measured by the trainer. Individuals E and H did not have variances low enough to meet the standardization criteria. The variances of these survey workers indicate that their measurements were neither reliable nor accurate. These two survey workers were required to continue to practice until they did meet the criteria for a survey worker.
Table V-8. Variances of HemoCue™ measurements in Mozambique, 1998.
Variance Survey worker Volunteers n Intraobserver
survey worker vs. self Interobserver
survey worker vs. trainer
A 10 0.09 0.71 B 10 0.23 0.36 C 12 0.11 0.29 D 10 0.33 0.96 E 10 1.80 1.69 F 10 0.32 0.21 G 10 0.17 0.67 H 11 1.32 1.17