how to get a newer, better fleet gary hatfield mercury associates
TRANSCRIPT
How to Get a Newer, Better Fleet
Gary HatfieldMercury Associates
Why do fleets get too old?– Lack of replacement funding– Inadequate replacement planning– Lack of structured approach – Poor data– Failure or inability of fleet
manager to communicate the problem to upper management and CFO
© 2014 Mercury Associates
Why is the timely replacement of vehicles important?
– Getting a newer, better fleet– Projecting a positive image– Managing total costs of vehicle
ownership– Minimizing fleet maintenance costs– Improving safety and technology– Improving employee productivity– Reducing fuel consumption and
emissions– Improving utilization of vehicles– Reducing the need for spare vehicles
© 2014 Mercury Associates
Why aren’t vehicles replaced in a timely manner?
– Choice of financing approach affects decisions:
• Pay before you go versus pay as you go (purchase vs. lease)
• Sunk cost versus ongoing depreciation– Focus on marginal M&R cost versus total
cost– Lack of understanding of vehicle life-
cycle costs and how to compute the ideal cycle
– Lack of understanding of the magnitude and volatility of fleet replacement costs
– Lack of understanding of the impact of vehicle age on vehicle performance
© 2014 Mercury Associates

How do we fix the problem?1. Right-size and Right-type the
fleet (VAM)2. Optimize replacement cycles for
each type of vehicle3. Compute the cost difference
between current and optimal replacement cycles
4. Use the cost savings to make the business case for sufficient capital funding
5. Develop a long-range capital-funding plan
6. Alternatively, lease instead of buy
© 2014 Mercury Associates
1. Right-size and Right-Type the Fleet (VAM for Federal fleets)• GSA provides VAM guidance for eliminating
unnecessary or non-essential vehicles from an agency's fleet inventory – FMR Bulletin B-30
• Ensure lifecycle cost-effectiveness (lease vs. own; optimized replacement cycles for owned)
• VAM must address composition of light duty fleets (i.e., vehicle types and sizes)
• Agencies must determine their optimal fleet inventory (including alternatively fueled vehicles) using the VAM and post on agency websites
• Agencies must develop and submit fleet management plans annually for achieving their inventory targets © 2014 Mercury Associates
Total Cost of Ownership – TCO:
– Essential for determining optimum replacement cycle
– Used for comparing buying vs. leasing
– Aggregated total of all costs of owning and operating a vehicle over a given life span (lifecycle)
– Includes all fixed and variable costs
© 2014 Mercury Associates
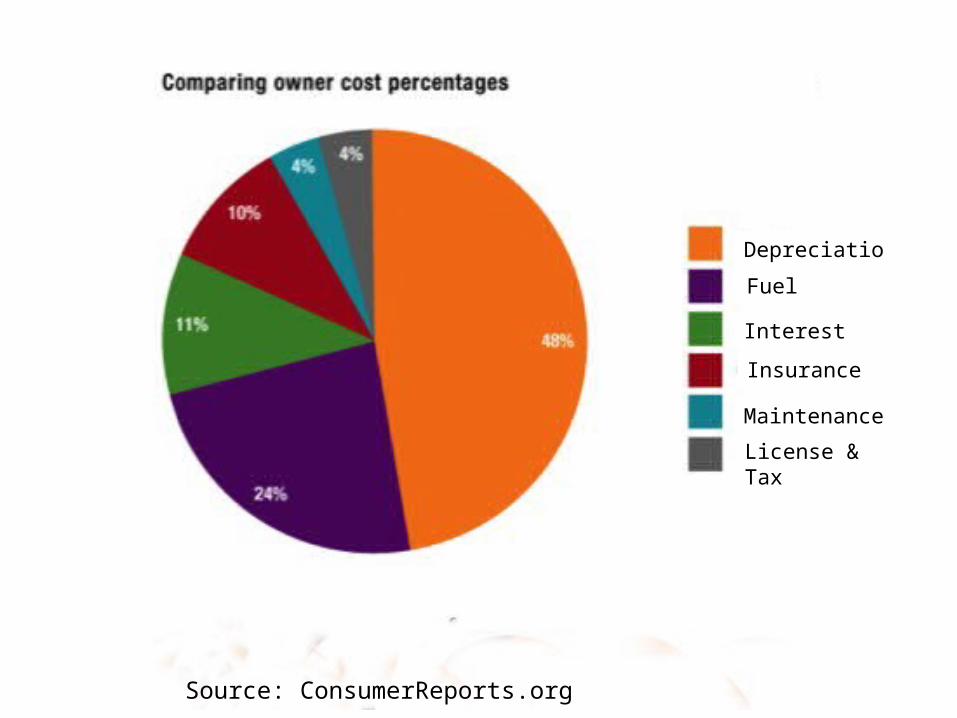
Source: ConsumerReports.org
Depreciation
Fuel
Interest
Insurance
Maintenance
License & Tax
• Fixed Costs:– Depreciation = purchase
price + upfitting cost – resale value
– Taxes, insurance, license
• Variable Costs– Fuel– Maintenance & repair –
never include accident costs
• TCO must include ALL costs!
© 2014 Mercury Associates
2. Optimizing Vehicle Replacement Cycles
– Reduces fleet cost– Makes business case for
replacement funding– Usually results in a newer,
safer, more fuel-efficient fleet
– Establishes the lifecycle that minimizes Equivalent Annual Cost (EAC)
– Specifies the year (age) vehicle should be sold
© 2014 Mercury Associates
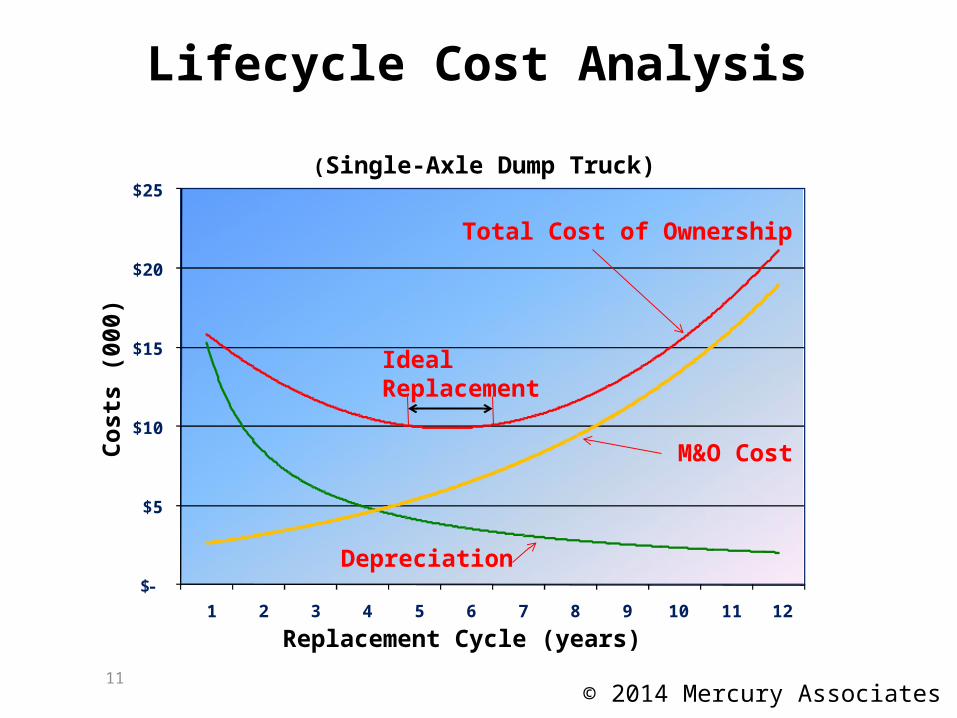
Lifecycle Cost Analysis
11
$-
$5
$10
$15
$20
$25
1 2 3 4 5 6 7 8 9 10 11 12
Co
sts
(000
)
Replacement Cycle (years)
(Single-Axle Dump Truck)
Total Cost of Ownership
M&O Cost
Depreciation
Ideal Replacement
© 2014 Mercury Associates
Determining Cost Savings– Develop your Lifecycle Cost
Analysis model (LCA - get help from your CFO office or fleet expert if needed)
– Choose a class of vehicles with large population – the more the better
– Gather all required data elements– Run the LCA model to determine
optimal replacement age– Compare existing cycle EAC with
optimum cycle EAC and compute annual cost savings
– Multiply annual cost savings per vehicle x number of vehicles© 2014 Mercury Associates
13
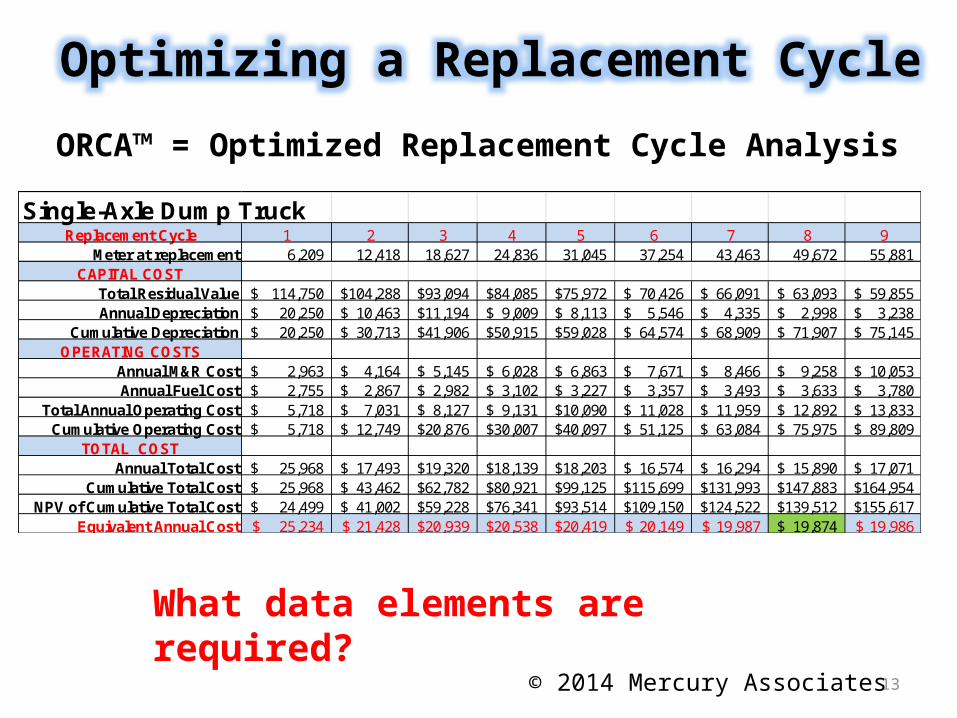
ORCA™ = Optimized Replacement Cycle Analysis
Optimizing a Replacement Cycle
Single-Axle Dump TruckReplacement Cycle 1 2 3 4 5 6 7 8 9
Meter at replacement 6,209 12,418 18,627 24,836 31,045 37,254 43,463 49,672 55,881 CAPITAL COST
Total Residual Value 114,750$ 104,288$ 93,094$ 84,085$ 75,972$ 70,426$ 66,091$ 63,093$ 59,855$ Annual Depreciation 20,250$ 10,463$ 11,194$ 9,009$ 8,113$ 5,546$ 4,335$ 2,998$ 3,238$
Cumulative Depreciation 20,250$ 30,713$ 41,906$ 50,915$ 59,028$ 64,574$ 68,909$ 71,907$ 75,145$ OPERATING COSTS
Annual M&R Cost 2,963$ 4,164$ 5,145$ 6,028$ 6,863$ 7,671$ 8,466$ 9,258$ 10,053$ Annual Fuel Cost 2,755$ 2,867$ 2,982$ 3,102$ 3,227$ 3,357$ 3,493$ 3,633$ 3,780$
Total Annual Operating Cost 5,718$ 7,031$ 8,127$ 9,131$ 10,090$ 11,028$ 11,959$ 12,892$ 13,833$ Cumulative Operating Cost 5,718$ 12,749$ 20,876$ 30,007$ 40,097$ 51,125$ 63,084$ 75,975$ 89,809$
TOTAL COSTAnnual Total Cost 25,968$ 17,493$ 19,320$ 18,139$ 18,203$ 16,574$ 16,294$ 15,890$ 17,071$
Cumulative Total Cost 25,968$ 43,462$ 62,782$ 80,921$ 99,125$ 115,699$ 131,993$ 147,883$ 164,954$ NPV of Cumulative Total Cost 24,499$ 41,002$ 59,228$ 76,341$ 93,514$ 109,150$ 124,522$ 139,512$ 155,617$
Equivalent Annual Cost 25,234$ 21,428$ 20,939$ 20,538$ 20,419$ 20,149$ 19,987$ 19,874$ 19,986$
What data elements are required?
© 2014 Mercury Associates
14
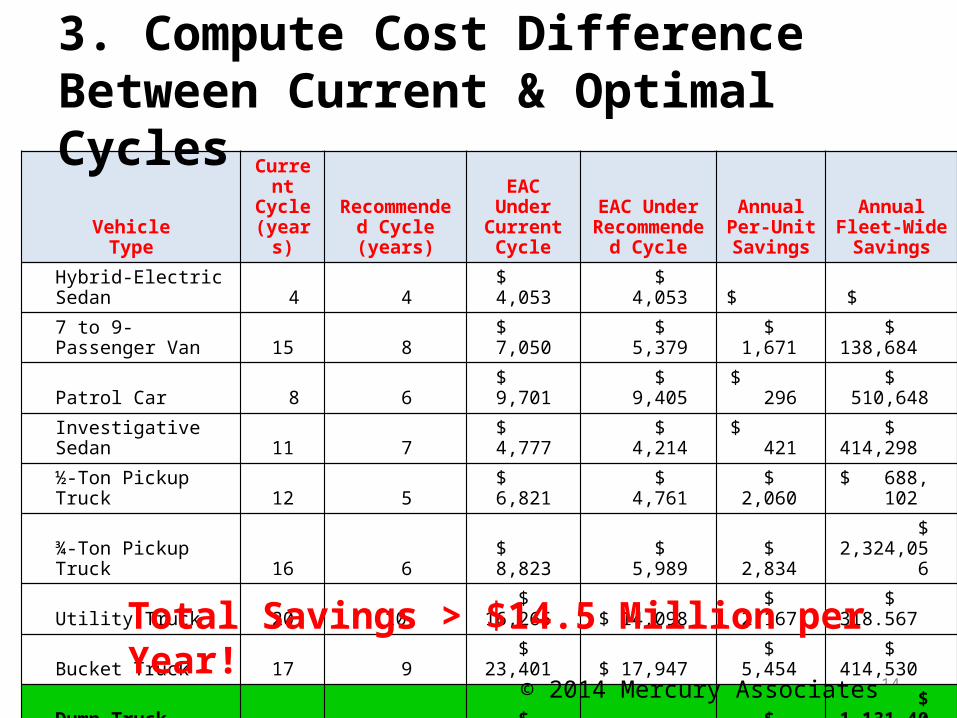
VehicleType
Current Cycle
(years)Recommended
Cycle (years)
EAC Under Current
Cycle
EAC Under Recommended
Cycle
Annual Per-Unit Savings
Annual Fleet-Wide Savings
Hybrid-Electric Sedan 4 4 $ 4,053 $ 4,053 $ $ 7 to 9-Passenger Van 15 8 $ 7,050 $ 5,379 $ 1,671 $ 138,684 Patrol Car 8 6 $ 9,701 $ 9,405 $ 296 $ 510,648Investigative Sedan 11 7 $ 4,777 $ 4,214 $ 421 $ 414,298 ½-Ton Pickup Truck 12 5 $ 6,821 $ 4,761 $ 2,060 $ 688, 102 ¾-Ton Pickup Truck 16 6 $ 8,823 $ 5,989 $ 2,834 $ 2,324,056Utility Truck 20 10 $ 16,265 $ 14,098 $ 2,167 $ 318.567 Bucket Truck 17 9 $ 23,401 $ 17,947 $ 5,454 $ 414,530 Dump Truck (165) 20 8 $ 26,731 $ 19,874 $ 6,857 $ 1,131,405Refuse Truck 9 4 $ 124,945 $ 79,672 $ 45,273 $ 5,794,962
Ambulance 4 2 $ 27,944 $ 23,246 $ 4,698 $ 483,873Fire Pumper Truck 16 9 $ 77,195 $ 48,344 $ 28,851 $ 3,289,031
Total Savings > $14.5 Million per Year!
3. Compute Cost Difference Between Current & Optimal Cycles
© 2014 Mercury Associates
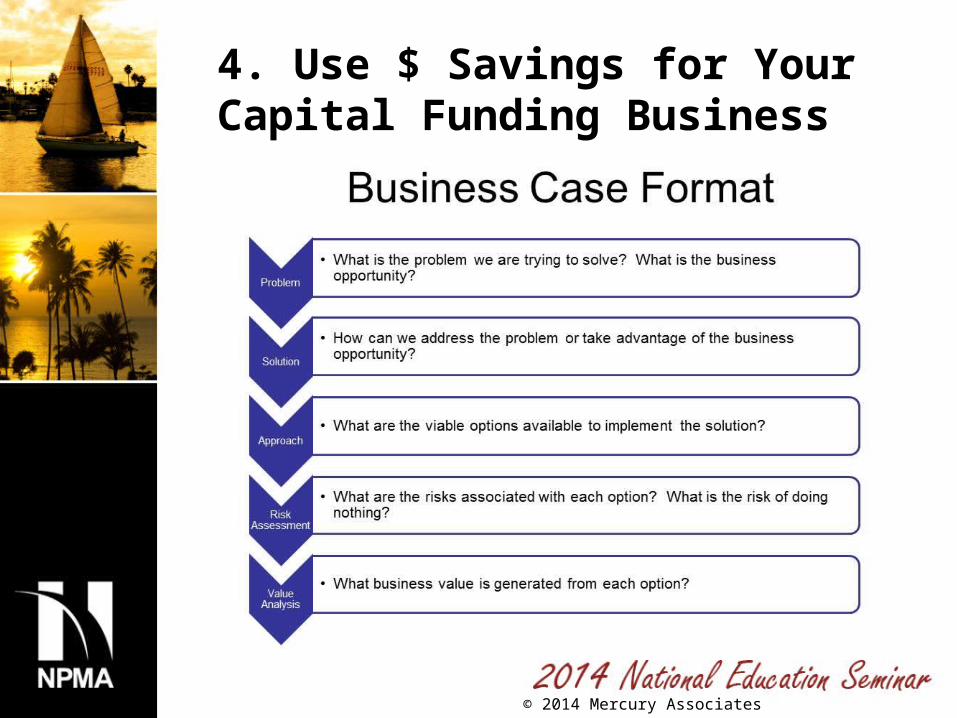
4. Use $ Savings for Your Capital Funding Business Case
© 2014 Mercury Associates
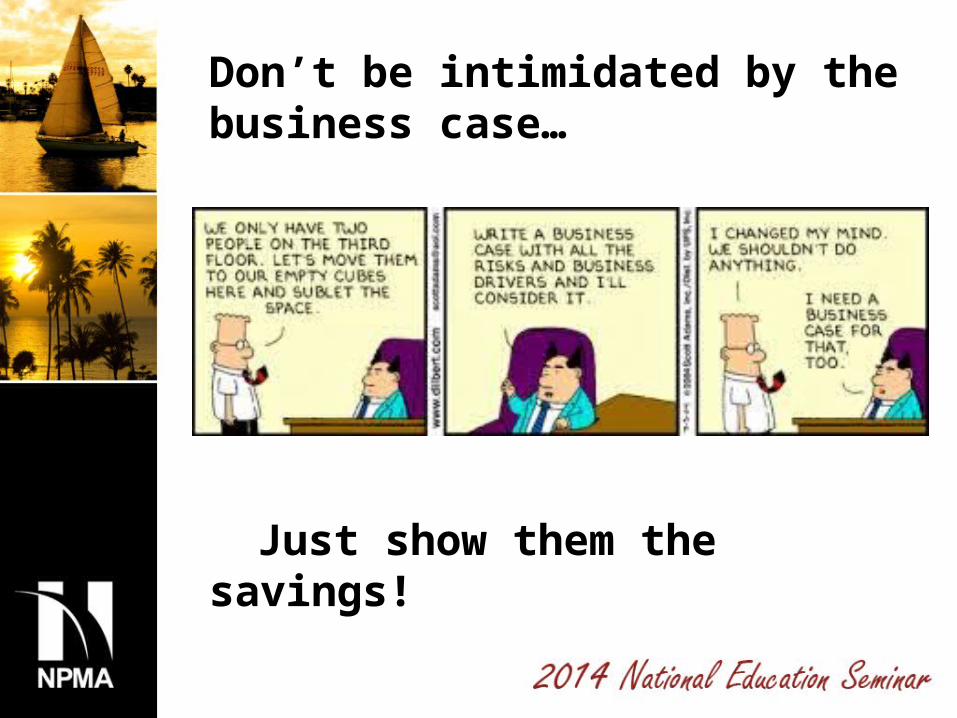
Don’t be intimidated by the business case…
Just show them the savings!
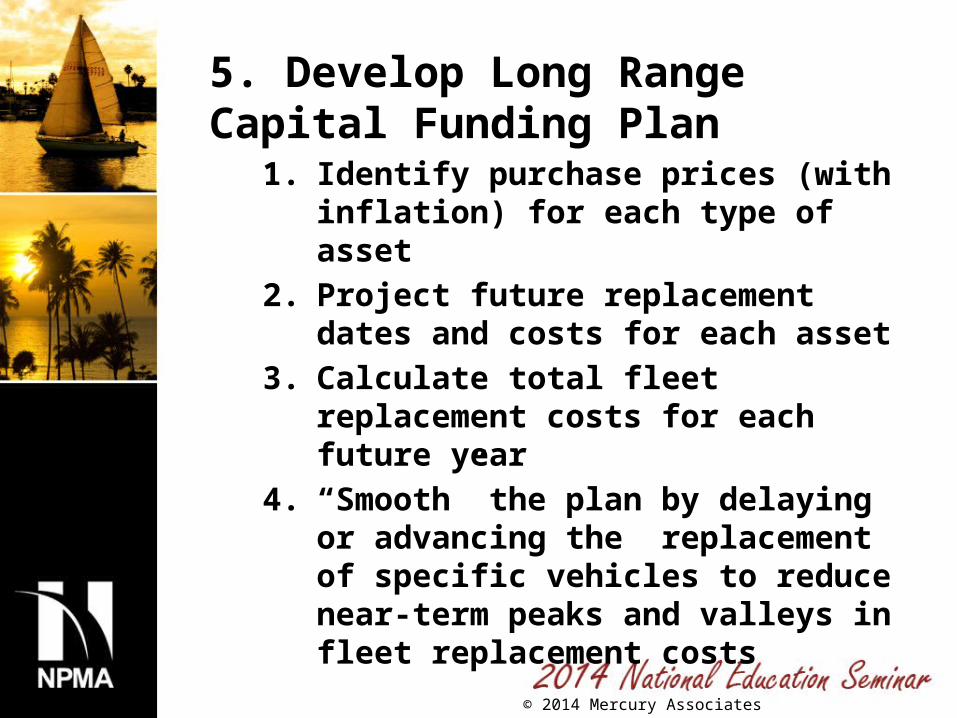
5. Develop Long Range Capital Funding Plan
1. Identify purchase prices (with inflation) for each type of asset
2. Project future replacement dates and costs for each asset
3. Calculate total fleet replacement costs for each future year
4. “Smooth” the plan by delaying or advancing the replacement of specific vehicles to reduce near-term peaks and valleys in fleet replacement costs
© 2014 Mercury Associates
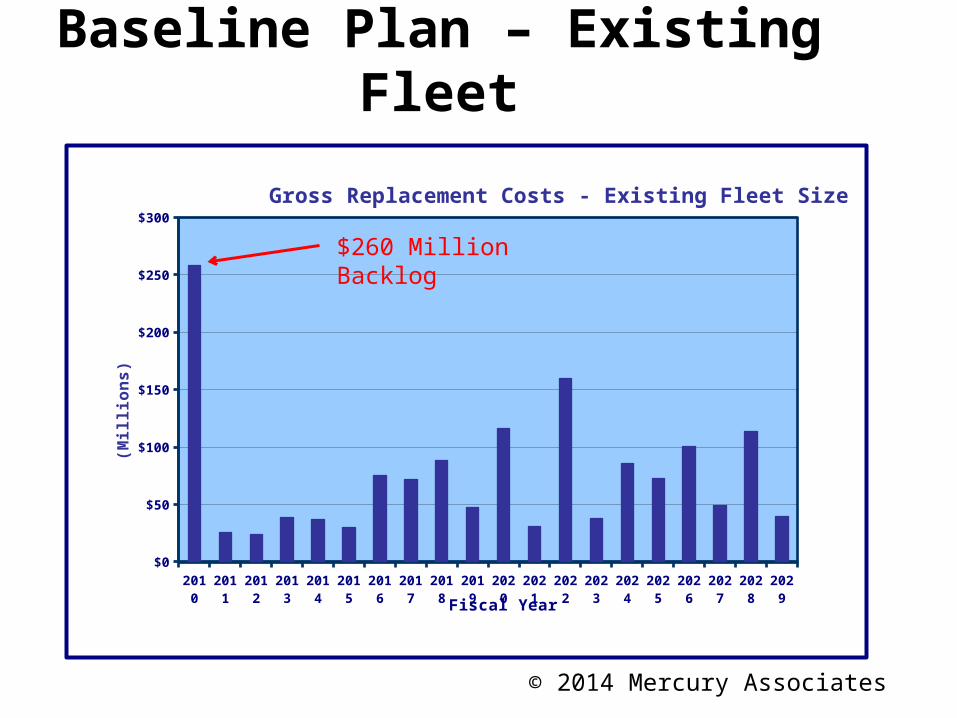
Baseline Plan – Existing Fleet
2010 2011 2012 2013 2014 2015 2016 2017 2018 2019 2020 2021 2022 2023 2024 2025 2026 2027 2028 2029$0
$50
$100
$150
$200
$250
$300
Gross Replacement Costs - Existing Fleet Size
Fiscal Year
(Mill
ion
s)
$260 Million Backlog
© 2014 Mercury Associates
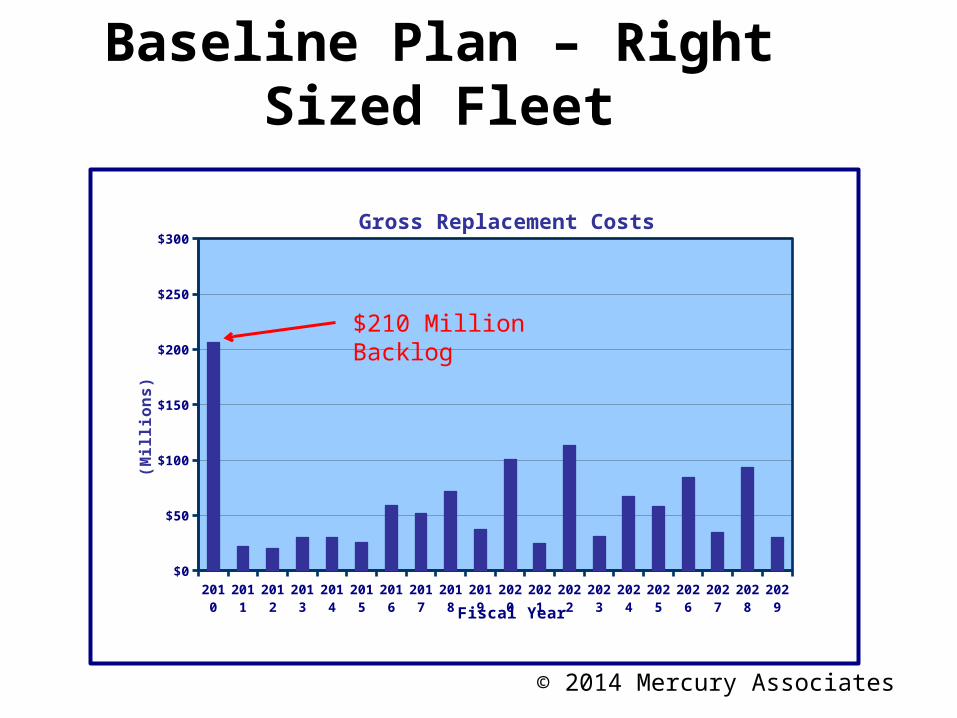
Baseline Plan – Right Sized Fleet
20102011201220132014201520162017201820192020202120222023202420252026202720282029$0
$50
$100
$150
$200
$250
$300Gross Replacement Costs
Fiscal Year
(Mill
ion
s)
$210 Million Backlog
© 2014 Mercury Associates
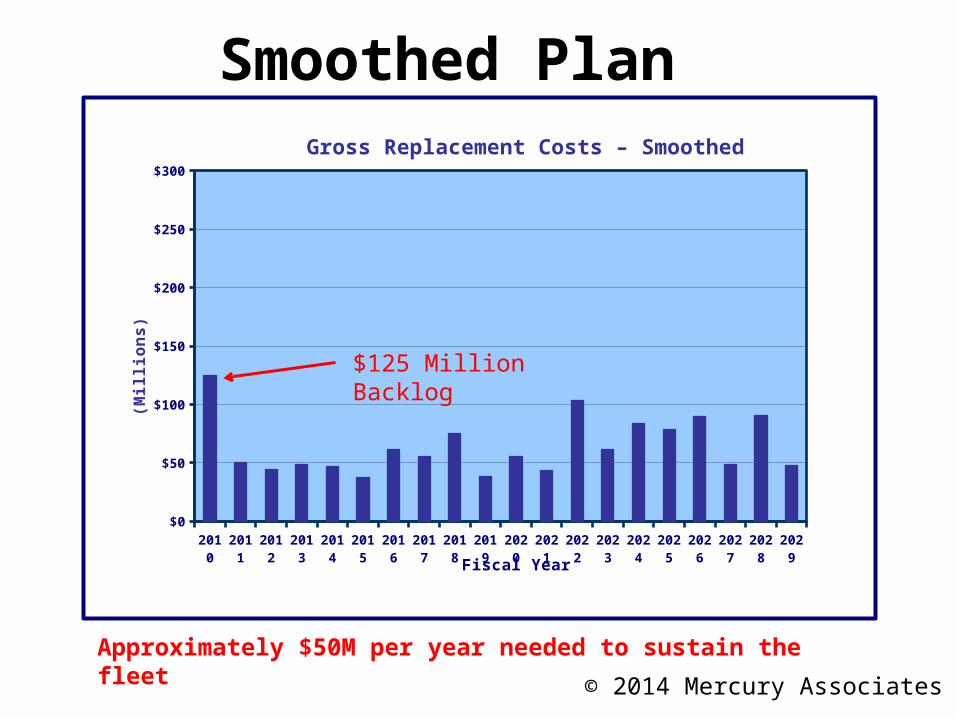
Smoothed Plan
2010 2011 2012 2013 2014 2015 2016 2017 2018 2019 2020 2021 2022 2023 2024 2025 2026 2027 2028 2029$0
$50
$100
$150
$200
$250
$300
Gross Replacement Costs – Smoothed
Fiscal Year
(Mill
ion
s)
$125 Million Backlog
Approximately $50M per year needed to sustain the fleet
© 2014 Mercury Associates
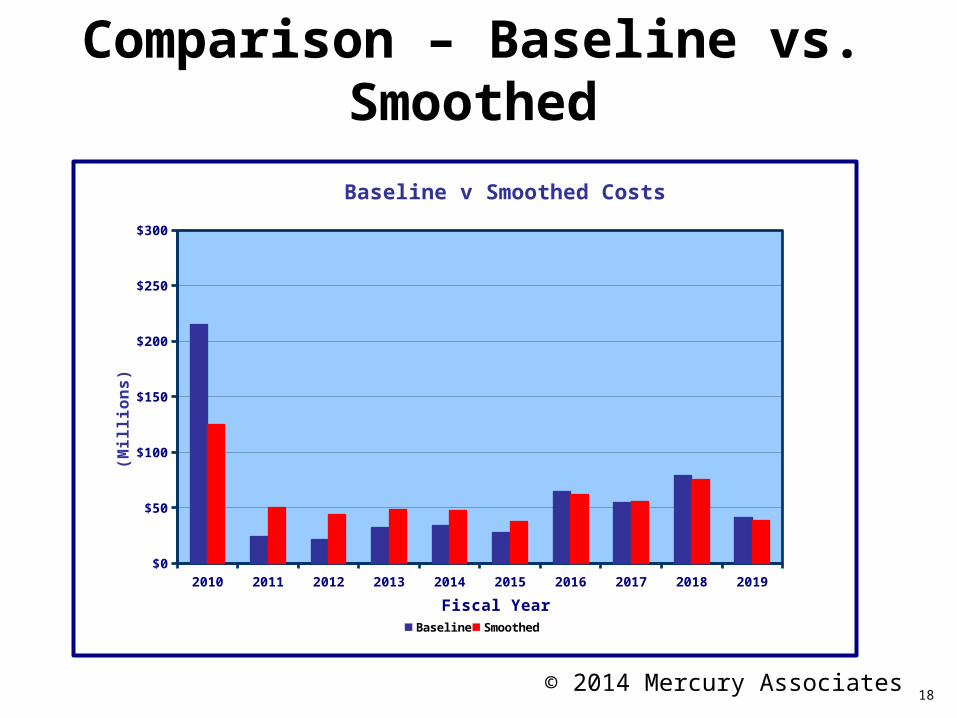
Comparison – Baseline vs. Smoothed
2010 2011 2012 2013 2014 2015 2016 2017 2018 2019$0
$50
$100
$150
$200
$250
$300
Baseline v Smoothed Costs
Baseline Smoothed
Fiscal Year
(Mill
ion
s)
18© 2014 Mercury Associates
How do we get more capital $ for fleet replacement?1. Empirically identify optimal vehicle
replacement cycles2. Develop a plan that quantifies long-
term fleet replacement costs3. Identify total fleet costs under
different levels of replacement spending
4. Work with the CFO to show potential savings with proper investment
Every excess dollar spent on a fleet due to suboptimal replacement practices is a dollar that cannot be devoted to an agency’s primary mission!
© 2014 Mercury Associates
Summary– An old, costly fleet did not
happen overnight and cannot be fixed quickly
– Optimize replacement cycles– Develop long-term capital plan– Establish a 5-year plan for fleet
renewal
© 2014 Mercury Associates

MERCURY ASSOCIATES, INC.
“Specializing in the science of fleet management.”
For more information, contact:
Gary HatfieldVice President, Federal Fleet Consulting
(941-685-6907)
24