how to localizet he critical isthmus in vt ablation … · 2019-10-28 · ten patients admitted for...
TRANSCRIPT

HOW TO LOCALIZE THE CRITICAL ISTHMUS IN VT ABLATION
Using Imaging
Alberto Battaglia MDElectrophysiology Laboratory, Cardiology Department.
Cardinal Massaia Hospital, Asti, Italy

Disclosure
Speaker name:
Alberto Battaglia
I do not have any potential conflict of interest

Zipes et al Clinical Arrhythmology and Electrophysiology Elsevier 2012
Substrate
Circulation. 1993 Oct;88(4 Pt 1):1647-70

Bunch J Cardiovasc Electrophysiol 2010;21:678–684Real time ICE images provide accurate chamber
geometries and scar boundaries of the left ventricle
Eighteen patients underwent VT ablation with real time ICE mapping from the right atrium and ventricle with online 3D-
image reconstruction of scar segments

Rupa Bala et al Circ Arrhythm Electrophysiol. 2011;4:667-673
18 patients with NICM and recurrent VT compared to a control group of 30 patients with structurally normal hearts who underwent ICE imaging for other ablation procedures
In all patients, the epicardial scar identified by
electroanatomicmapping correlated with the echogenic area identified on ICE imaging. ICE imaging identified
no areas ofincreased
echogenicity in the control group

J Am Coll Cardiol 2008;52:839–42
This study was designed to compare electroanatomic mapping (EAM) and magnetic resonance imaging
(MRI) with delayed contrast enhancement (DCE) data for
delineation of post-infarct scars
Ten patients admitted for post-infarct VT ablation underwent both a left ventricle DCE MRI and a sinus-rhythm 3-dimensional EAM
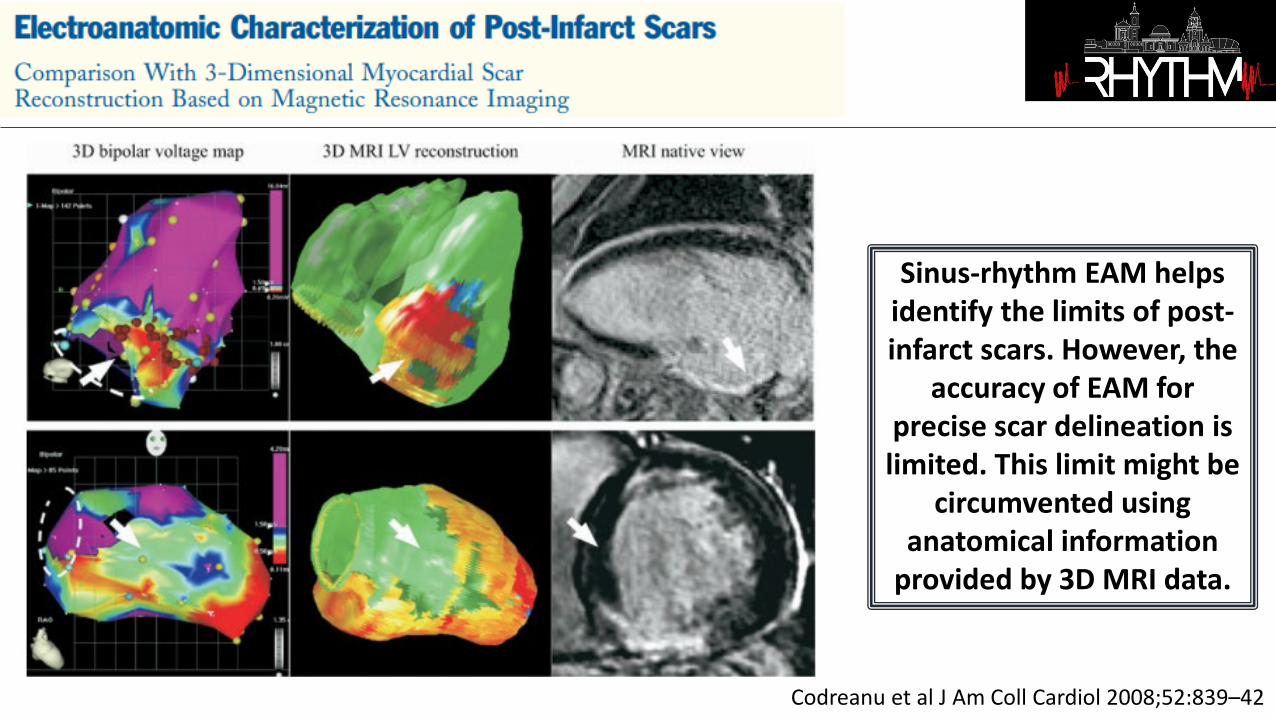
Codreanu et al J Am Coll Cardiol 2008;52:839–42
Sinus-rhythm EAM helps identify the limits of post-infarct scars. However, the
accuracy of EAM for precise scar delineation is limited. This limit might be
circumvented using anatomical information
provided by 3D MRI data.

Wijnmaalen et al European Heart Journal (2011) 32, 104–114
Fifteen patients without implantable cardiac defibrillator (14 males, 64+9 years) referred for VT ablation after myocardial
infarction underwent CE-MRI.
Local bipolar and unipolar voltages decreased with increasing scar transmurality and were influenced by scar heterogeneity.
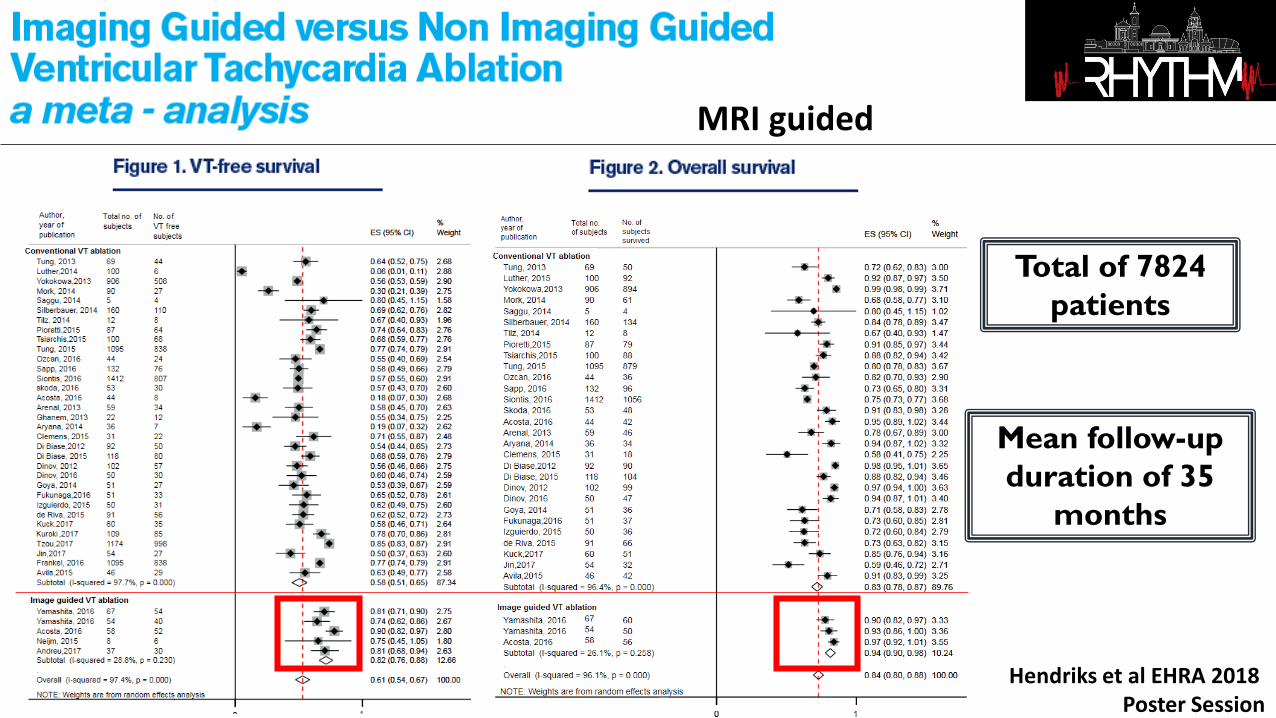
Hendriks et al EHRA 2018 Poster Session
Total of 7824patients
Mean follow-up duration of 35
months
MRI guided

21 patients with healed myocardial infarction and VT
Fernández-Armenta et al Circ Arrhythm Electrophysiol. 2013;6:528-537
A 3D high-resolution 3T ce-CMR was performed
The ce-CMR–defined BZ channels
identified 74% of the critical isthmus of
clinical VTs and 50% of all the conducting channels identified in electroanatomic
maps.
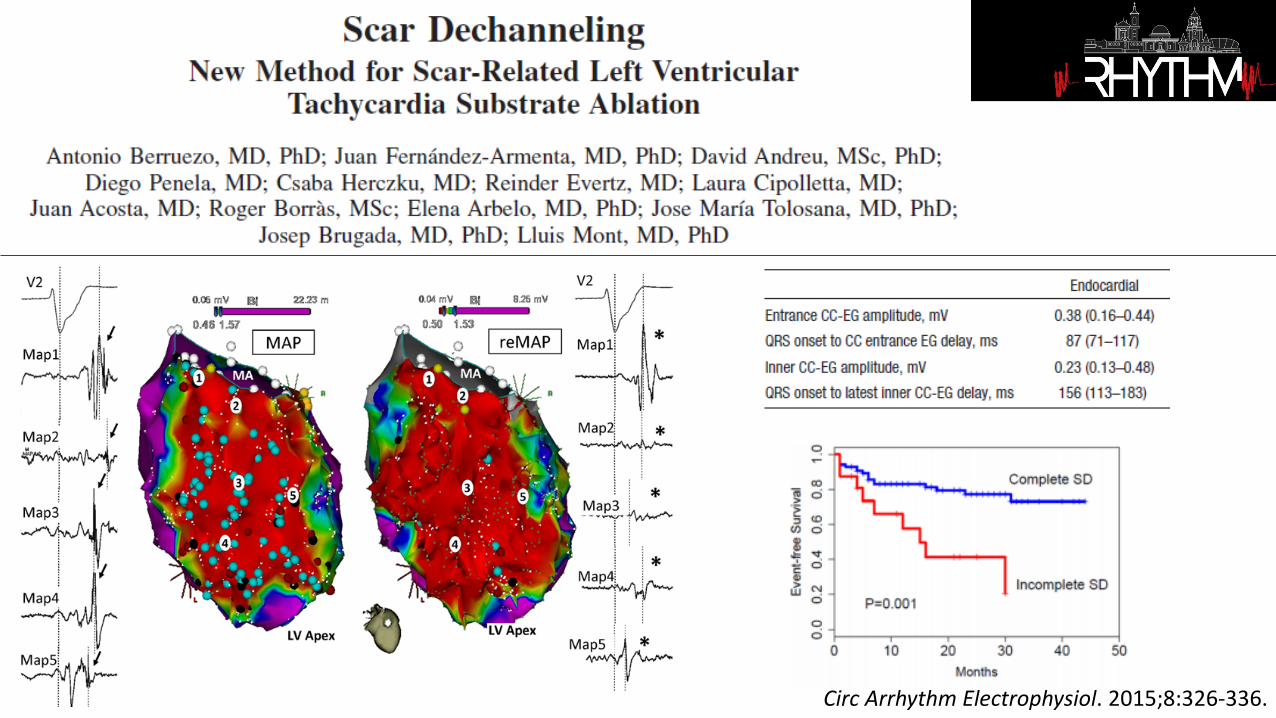
Circ Arrhythm Electrophysiol. 2015;8:326-336.

Piers SRD et al Circ Arrhythm Electrophysiol. 2013;6:875-883
19 consecutive patients with NICM undergoing ceMRI and VT ablation were included
Two typical scar patterns (anteroseptal and inferolateral) account for 89% of arrhythmogenic substrates in patients with nonischemic cardiomyopathy
Anteroseptal scars were, in general, most effectively approached from the aortic root or anteroseptal left ventricular endocardium, whereas inferolateral
scars frequently required an epicardial approach

Komatsu et al Circ Arrhythm Electrophysiol. 2013;6:342-350
LAVA were located within the WT <5 mm (87%) or at its border (100%within 23 mm). Very late LAVA (>100 ms) were exclusively detected within the
thinnest area (93% in the WT<3 mm).
13 consecutive postinfarction patients undergoing MDCT before ablation

Yamashita et al J Cardiovasc Electrophysiol, Vol. 27, pp. 699-708, June 2016
Image integration is feasible in large
series of patients, provides
information on VT substrate, and
impacts procedural management, particularly in
ARVC/NICM, and in case of epicardial
approach.

Yamashita et al J Cardiovasc Electrophysiol, Vol. 27, pp. 699-708, June 2016
A total of 116 consecutive patients (67 ICM; 30 NICM; 19 ARVC) underwentVT ablation with image integration (MDCT 91%; CMR 30%; both 22%)
Substrate was defined as wall thinning on MDCT and late gadolinium-enhancement on CMR in ICM/NICM, and as myocardial hypoattenuation on MDCT in ARVC

Takigawa et al Heart Rhythm 2019 In press
9 post-infarction patients with 10 complete VT
activation maps (cycle length 429 ± 77ms) created using high-resolution mapping.
Three dimensionally-reconstructed WT maps from CT were merged
with the activation map during sinus rhythm (SR)
and VT.

Takigawa et al Heart Rhythm 2019 In press
VT isthmuses were always found in CT
channels (100% sensitivity), and half of CT channels hosted VT isthmuses (PPV 51%). Longer and thinner
(but >1 mm) CT channels were
significantly associated with VT isthmuses

Our simulation framework has an
application in VT RFA intervention planning. It
could be used to guide EP explorations and even
predict ablation targets pre-operatively
Europace 2018 Nov 1;20(suppl_3):iii94-iii101
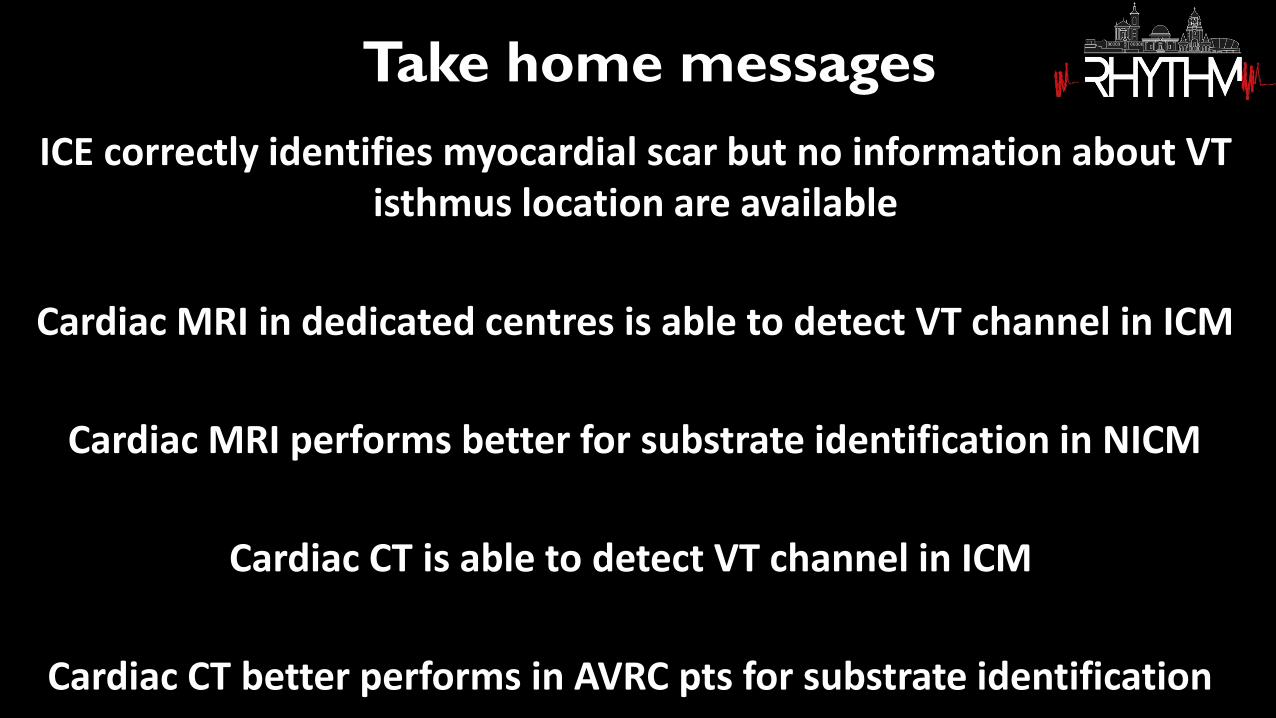
ICE correctly identifies myocardial scar but no information about VT isthmus location are available
Cardiac MRI in dedicated centres is able to detect VT channel in ICM
Cardiac MRI performs better for substrate identification in NICM
Cardiac CT is able to detect VT channel in ICM
Cardiac CT better performs in AVRC pts for substrate identification
Take home messages

Thanks for the attention