how to obtain more information - sector source
TRANSCRIPT
How to obtain more information
Specific inquiries about this product and related statistics or services should be directed to: Small Business and SpecialSurveys Division, Statistics Canada, Ottawa, Ontario, K1A 0T6, (Toll-free 1 877 679-2746) (fax: 613 951-1572).
For information on the wide range of data available from Statistics Canada, you can contact us by calling one of ourtoll-free numbers. You can also contact us by e-mail or by visiting our website.
National inquiries line 1 800 263-1136National telecommunications device for the hearing impaired 1 800 363-7629Depository Services Program inquiries 1 800 700-1033Fax line for Depository Services Program 1 800 889-9734E-mail inquiries [email protected] www.statcan.ca
Information to access the product
This product, Catalogue no. 61-533-XPE, is published occasionally as a standard printed publication at a price ofCAN$20.00.
This product, Catalogue no. 61-533-XIE, is available for free. To obtain single issues, visit our Web site at www.statcan.caand select Our Products and Services.
The printed version of this publication can be ordered
• by phone (Canada and United States) 1 800 267-6677• by fax (Canada and United States) 1 877 287-4369• by e-mail [email protected]• by mail Statistics Canada
Finance DivisionR.H. Coats Bldg., 6th floor120 Parkdale AvenueOttawa, ON K1A 0T6
• In person at the Statistics Canada Regional Centre nearest you, or from authorised agents and bookstores.
When notifying us of a change in your address, please provide both old and new addresses.
Standards of service to the public
Statistics Canada is committed to serving its clients in a prompt, reliable and courteous manner and in the officiallanguage of their choice. To this end, the Agency has developed standards of service which its employees observe inserving its clients. To obtain a copy of these service standards, please contact Statistics Canada toll free at 1 800263-1136. The service standards are also published on www.statcan.ca under About Statistics Canada > Providingservices to Canadians.

Published by authority of the Minister responsible for Statistics Canada
© Minister of Industry, 2005
All rights reserved. The content of this publication may be reproduced, in whole or in part, and byany means, without further permission from Statistics Canada, subject to the following conditions:that it is done solely for the purposes of private study, research, criticism, review, newspapersummary, and/or for non-commercial purposes; and that Statistics Canada be fully acknowledgedas follows: Source (or “Adapted from”, if appropriate): Statistics Canada, name of product,catalogue, volume and issue numbers, reference period and page(s). Otherwise, no part of thispublication may be reproduced, stored in a retrieval system or transmitted in any form or by anymeans, electronic, mechanical, photocopy, for any purposes, without the prior written permissionof Licensing Services, Marketing Division, Statistics Canada, Ottawa, Ontario, Canada K1A 0T6.
September 2004
Revised edition June 2005
Catalogue no. 61-533-XPEISBN 0-660-19420-1
Catalogue no. 61-533-XIEISBN 0-662-39318-x
Frequency: Occasional
Ottawa
La version française de cette publication est disponible sur demande.
Statistics CanadaSmall Business and Special Surveys DivisionBusiness and Trade Statistics Field
Cornerstones of Community:Highlights of the National Surveyof Nonprofit and VoluntaryOrganizations2003 revised
Note of appreciation
Canada owes the success of its statistical system to a long-standing partnership betweenStatistics Canada, the citizens of Canada, its businesses and governments. Accurate and timelystatistical information could not be produced without their continued cooperation and goodwill.
2 Statistics Canada – Catalogue No. 61-533
Cornerstones of Community: Highlights of the National Survey of Nonprofit and Voluntary Organizations
Symbols
The following standard symbols are used in Statistics Canada publications:
. not available for any reference period
.. not available for a specific reference period
… not applicable
0 true zero or a value rounded to zero
0s value rounded to 0 (zero) where there is a meaningful distinction between true zero and the value that was rounded
p preliminary
r revised
x suppressed to meet the confidentiality requirements of the Statistics Act
E use with caution
F too unreliable to be published
Statistics Canada – Catalogue No. 61-533 3
Cornerstones of Community: Highlights of the National Survey of Nonprofit and Voluntary Organizations
AuthorsMichael H. Hall, Margaret L. de Wit, David Lasby and David McIverCanadian Centre for Philanthropy
Terry Evers, Chris Johnston and Julie McAuleyStatistics Canada
Katherine ScottCanadian Council on Social Development
Guy Cucumel, Louis Jolin and Richard NicolAlliance de recherche universités-communautés en économie sociale à l’Université du Québec à Montréal
Loleen Berdahl and Rob RoachCanada West Foundation
Ian DaviesCapacity Development Network, University of Victoria
Penelope RoweCommunity Services Council of Newfoundland and Labrador
Sid FrankelVoluntary and Non-Profit Sector Organization of Manitoba
Kathy BrockPublic Policy and the Third Sector, School of Policy Studies, Queen’s University
Vic MurraySchool of Public Administration, University of Victoria
AcknowledgementsWe would like to acknowledge many people who contributed to the research and the preparation of this report.
At the Canadian Centre for Philanthropy, Cathy Barr and Eli Malinsky assisted with the development of the surveyinstrument and the preliminary data analysis. Jason Moreton and Barbara Brownlee helped with data analysis and reportproduction.
Shirley Lenton, Peter Wright, Linda Lefebvre, Sophie Arsenault and Pierre Caron from Statistics Canada assisted with allphases of this project.
We would like to express our appreciation to the members of the Research Steering Committee of the Voluntary SectorInitiative (VSI) Capacity Joint Table for their advice and support: Adriana Davies, Heritage Community Foundation(Co-chair); Roger Boe, Correctional Services Canada (Co-chair); David Boyd-Thomas, Vancouver General Hospital andUniversity of British Columbia Hospital Foundation; Don McRae, Canadian Heritage; Barry Schmidl, P.E.I. Council of theDisabled; Paddy Bowen and Marlene Deboisbriand, Volunteer Canada; and Jo Sutton, Womenspace. Secretariatrepresentatives of the Research Steering Committee include Sabrina Guerin, Nancy Amos, Roberta Bustard, Liz Hong-Farrell, Liz Neiman and Raphael Ogom of Human Resources Development Canada. Greg Bamford represented theSocial Development Directorate, Human Resources Development Canada, throughout the project.

4 Statistics Canada – Catalogue No. 61-533
Cornerstones of Community: Highlights of the National Survey of Nonprofit and Voluntary Organizations
We are also grateful to Andrew Green and S. Wojciech Sokolowski at the Centre for Civil Society Studies, Johns HopkinsUniversity for their advice on the design of the survey instrument and other aspects of the research.
Finally, we would like to thank the 13,000 nonprofit and voluntary organizations that participated in the survey.
This research was undertaken in response to a request for proposals issued under the VSI, a joint undertaking of thevoluntary sector and the Government of Canada. Its long-term objective is to strengthen the voluntary sector’s capacityto meet future challenges and to enhance the relationship between the sector and the federal government to better serveCanadians. The National Survey of Nonprofit and Voluntary Organizations is being conducted under the auspices of theVSI Capacity Joint Table, one of seven joint tables created to do the work of the VSI.
The research was supported by funding from the Capacity Joint Table, through the Social Development PartnershipsProgram of the Government of Canada.
Statistics Canada – Catalogue No. 61-533 5
Cornerstones of Community: Highlights of the National Survey of Nonprofit and Voluntary Organizations
ForewordNonprofit and voluntary organizations, an important element of Canadian society, often address needs and interests ofcitizens that governments and the private sector do not. Although the presence of these organizations is felt in virtuallyevery community, they have not been studied extensively. We have little knowledge of their numbers, their contributions,or the resources they require to fulfill their missions.
The information collected by the National Survey of Nonprofit and Voluntary Organizations (NSNVO) is essential forseveral reasons. It will help address concerns that the potential social, economic and cultural contributions of theseorganizations to Canadian communities are not being fully realized and recognized. The research is a critical first steptowards enabling evidence-based policy development by governments and others to strengthen nonprofit and voluntaryorganizations. It will also provide individual nonprofit and voluntary organizations with benchmark data against which tocompare their experiences and characteristics. Last but not least, it will offer Canadians a richer understanding of the rolethat nonprofit and voluntary organizations play in their lives.
The NSNVO was funded by the federal government’s Voluntary Sector Initiative. The objectives of the NSNVO are:
• to collect comprehensive information about the breadth of the nonprofit and voluntary sector in Canada, itscharacteristics and its areas of activity, and
• to improve our understanding of the challenges that organizations may be experiencing with respect to their capacityto achieve their missions.
The NSNVO was undertaken by a consortium of nine organizations: the Canadian Centre for Philanthropy (as the leadorganization); l’Alliance de recherche universités-communautés en économie sociale, l’Université du Québec à Montréal;Canada West Foundation; Canadian Council on Social Development; Capacity Development Network, University ofVictoria; Community Services Council, Newfoundland and Labrador; School of Policy Studies, Queen’s University;Secretariat on Voluntary Sector Sustainability at the Manitoba Voluntary Sector Initiative; and Statistics Canada.
Qualitative research was conducted to identify issues for the survey to address and to make an initial assessment of thevarious strengths of nonprofit and voluntary organizations as well as the challenges they face in fulfilling their missions.This phase of the research involved a literature review and a series of focus groups and key informant interviews. Ourfindings showed that nonprofit and voluntary organizations believed they had many strengths, particularly the ability totap the resources of committed volunteers and paid staff.1 But participants also reported that they were having considerabledifficulty obtaining the appropriate financial and human resources to deliver their programs and services to Canadians.These findings guided the development of the survey questionnaire for the quantitative phase of the research.
In 2003, representatives of approximately 13,000 incorporated nonprofit organizations and registered charities2 weresurveyed by Statistics Canada. They were asked to report on the characteristics of their organizations and the factorsthat influenced the capacity of their organization to achieve its mission. The data presented in this report have beenweighted to provide estimates for the estimated 161,000 incorporated nonprofit and voluntary organizations and registeredcharities in Canada.3
The survey provides the most comprehensive profiling of nonprofit and voluntary organizations ever undertaken inCanada and, given its scale, it may be the most comprehensive study conducted in the world. It breaks significantmethodological ground by creating, for the first time, a sample frame that makes possible valid estimates of all incorporatednonprofit and voluntary organizations and registered charities in Canada.
1. See M.H. Hall et al., 2003, The Capacity to Serve: A Qualitative Study of the Challenges Facing Canada’s Nonprofit and Voluntary Sector, Toronto,Canadian Centre for Philanthropy.
2. Registered charities are organizations that have obtained registered charitable status from the Government of Canada. A more detaileddescription may be found in Appendix A.
3. Additional information about the methodology employed in the collection and analyses of the data is contained in Appendix B.
6 Statistics Canada – Catalogue No. 61-533
Cornerstones of Community: Highlights of the National Survey of Nonprofit and Voluntary Organizations
The NSNVO provides essential baseline data about nonprofit and voluntary organizations, including
• their numbers and geographic distribution• their areas of activity, the populations they serve and the extent to which they provide public benefits• the financial and human resources on which they rely• problems they report about their capacity to fulfill their missions.
It also complements information gathered by the National Survey on Giving, Volunteering and Participating,4 whichtracks the donations and volunteer support that Canadians provide to nonprofit and voluntary organizations.
This study is intended to begin filling some of the gaps in our knowledge about nonprofit and voluntary organizations.From it, a picture emerges of a set of organizations that provide services that are critical to the quality of life in ourcommunities. Most nonprofit and voluntary organizations are a product of the engagement of individual citizens and theirvoluntary contributions of time and money. In many ways they help to define who we are as Canadians.
4. The survey is generally conducted every three years and has been renamed the Canada Survey of Giving, Volunteering and Participating forfuture iterations.
Statistics Canada – Catalogue No. 61-533 7
Cornerstones of Community: Highlights of the National Survey of Nonprofit and Voluntary Organizations
Table of contents
Page
Introduction ............................................................................................................................................... 8
Key findings............................................................................................................................................... 10
Key characteristics .................................................................................................................................... 13
Financial resources ................................................................................................................................... 22
Human resources ...................................................................................................................................... 32
Organizational capacity ............................................................................................................................. 44
Conclusions .............................................................................................................................................. 55
Appendix A – Glossary .............................................................................................................................. 58
Appendix B – Methodology ........................................................................................................................ 65
Appendix C – Revenues of non-profit organizations ................................................................................... 69

8 Statistics Canada – Catalogue No. 61-533
Cornerstones of Community: Highlights of the National Survey of Nonprofit and Voluntary Organizations
IntroductionThe National Survey of Nonprofit and Voluntary Organizations (NSNVO) provides the first national portrait of the manythousands of nonprofit and voluntary organizations that are the cornerstones of Canadian communities. It reveals a setof organizations that are widely diverse in nature, touching virtually every aspect of Canadians’ lives. These organizationshave a significant economic presence and serve as vehicles for citizen engagement, involving millions of Canadians intheir activities as members, volunteers and financial donors. However, many nonprofit and voluntary organizations reportsignificant challenges to their capacity to fulfill their missions and achieve their organizational objectives.
An estimated 161,000 nonprofit and voluntary organizations operated in Canada in 2003. They include a wide variety oforganizations, such as day-care centres, sports clubs, arts organizations, social clubs, private schools, hospitals, foodbanks, environmental groups, trade associations, places of worship, advocates for social justice, and groups that raisefunds to cure diseases. Just over half are registered as charities by the federal government, which allows them to beexempt from a variety of taxes and enables their donors to claim tax credits for donations made.
What they have in common is their pursuit of goals to serve the public or their members, as well as an institutional formthat does not allow the profits to be distributed to owners or directors.
Nonprofit and voluntary organizations,1 for the purposes of this study, are defined as organizations that meet all thefollowing criteria:
• non-governmental (i.e., are institutionally separate from governments)• non-profit distributing (i.e., do not return any profits generated to their owners or directors)2
• self-governing (i.e., are independent and able to regulate their own activities)• voluntary (i.e., benefit to some degree from voluntary contributions of time or money)• formally incorporated or registered under specific legislation with provincial, territorial or federal governments.3
The scope of the NSNVO excludes grass-roots organizations or citizens’ groups that are not formally incorporated orregistered with provincial, territorial or federal governments.4 It also excludes some registered charities that are consideredto be public sector agencies (e.g., school boards, public libraries and public schools).
1. Many terms are used to describe the various organizations that are of interest to the NSNVO—voluntary, nonprofit, charities, third sector, civilsociety, and community-based. We have chosen the term ‘nonprofit and voluntary.’ For a discussion of these terms and a rationale for using them,see A.R. Febbraro, M.H. Hall and M. Parmegianni, 1999, The Voluntary Health Sector in Canada: Developing a Typology—Definition and ClassificationIssues, Ottawa, Canadian Centre for Philanthropy, Canadian Policy Research Networks, The Coalition of National Voluntary Organizations andHealth Canada.
2. A small number of co-operatives were also included in the study. J. Quarter, 1993, Canada’s Social Economy, Co-operatives, Non-profits andOther Community Enterprises, Toronto, James Lorimer notes that some co-operatives—including credit unions and groups that deal with farmmarketing and food retailing—do allow members to hold shares in the organization. The mission of these organizations is typically not tomaximize profits and, unlike the shares of a business, the shares of such co-operatives do not entitle holders to dividends of any year-endsurplus.
3. These criteria have been adapted from the International Classification of Nonprofit Organizations—see L.M. Salamon and H.K. Anheier, 1997,Defining the Nonprofit Sector: A Cross-national Analysis, Manchester, N.Y., Manchester University Press.
4. These grass-roots organizations undoubtedly play an important role in communities. Many incorporated nonprofit and voluntary organizationslikely had their beginnings as less formal citizen groups. They have been excluded from the study because of the substantial difficultiesidentifying and locating them. Incorporated organizations are more likely to have some degree of permanence and to be able to respond totargeted initiatives to improve their capacity to serve the Canadian public.
Statistics Canada – Catalogue No. 61-533 9
Cornerstones of Community: Highlights of the National Survey of Nonprofit and Voluntary Organizations
What type of information does the NSNVO provide?
The NSNVO provides a comprehensive picture of the role that nonprofit and voluntary organizations play in Canadianlife. It documents their numbers and regional distributions,5 the areas in which they work, the populations they serve, theextent to which they provide public benefits, the financial resources they rely on, their role as employers, and the volunteersthey engage. It also identifies the challenges organizations report with respect to their capacity to achieve their missions.The information has implications for the development of public policy pertaining to nonprofit and voluntary organizations,and provides a benchmark for future studies of this important set of institutions.
5. While allowing for regional comparisons, information on the size of communities in which organizations operated was not collected. As a result,analyses of rural–urban variations are not possible.
10 Statistics Canada – Catalogue No. 61-533
Cornerstones of Community: Highlights of the National Survey of Nonprofit and Voluntary Organizations
Key findingsSeveral themes emerge from the results of the National Survey of Nonprofit and Voluntary Organizations (NSNVO).Clearly, the story of nonprofit and voluntary organizations is really a story about how Canadians come together to buildcommunity, address collective needs and work for the benefit of the public. Nonprofit and voluntary organizations tend tooccupy specific niches: most have a local focus, and many concentrate on addressing the needs of specific segments ofthe population. Collectively, however, these organizations have a very broad scope of activities, and they touch almostevery aspect of Canadian life.
There are also clear differences between
• organizations that have relatively large revenues and those with very modest revenues• organizations that depend on governments for their funding and those that do not• organizations that rely mainly on volunteers to achieve their missions and those that rely on paid staff.
The characteristics of these organizations also vary somewhat according to the province or territory in which they arelocated.
The story of nonprofit and voluntary organizations is also a story about challenges. A majority of the organizations whoparticipated in this study report having problems fulfilling their missions and achieving their organizational objectives.These findings suggest that many organizations may be struggling to provide the public with all of the benefits they havethe potential to offer.
Nonprofit and voluntary organizations are vehicles for citizen engagement
The interests, talents and energies of individual Canadians drive nonprofit and voluntary organizations. Virtually allorganizations are governed by boards of volunteer directors, which define the missions and objectives of theseorganizations. More than half of all organizations are run completely through the contributions of volunteers—in the formof donations of both time and money. Collectively, these organizations draw on more than 2 billion volunteer hours,1 theequivalent of more than 1 million full-time jobs, and more than $8 billion in individual donations to provide their programs,services and products. Canadians have also taken out a total of 139 million memberships in nonprofit and voluntaryorganizations, an average of 4 memberships per person. These findings suggest that one of the hallmarks of nonprofitand voluntary organizations is their connection to community through the participation of individual citizens.
Nonprofit and voluntary organizations focus on community and provide public benefits
Nonprofit and voluntary organizations tend to be focussed on providing services within their own neighbourhood, city,town or rural municipality. Most provide services or products to people. Many of these organizations serve the generalpublic, but many also target their services to specific populations such as children, youth, seniors or persons withdisabilities. While the vast majority have people as members, just 27% provide these members with special benefitsother than voting rights or receiving a newsletter; only a minority report that their members benefit most from the servicesthey provide. Finally, more than half of all organizations are registered as charities, a privilege conferred only on organizationswhose activities are clearly directed to public rather than private benefit.
Their scope of activities is broad
Governed as they are by the interests of individual Canadians, nonprofit and voluntary organizations touch on virtuallyevery aspect of Canadian life. Their primary areas of activity are Sports and recreation (21% of all organizations),Religion (19%), Social services (12%), Grant-making, fundraising, and voluntarism promotion (10%), Arts and culture
1. This estimate is based on the total number of volunteer hours that organizations reported receiving. It should be noted that The National Surveyof Giving, Volunteering and Participating estimates that Canadians volunteered a total of 1.1 billion hours in 2000. (See M.H. Hall, L. McKeown andK. Roberts, 2001, Caring Canadians, Involved Canadians: Highlights from the 2000 National Survey of Giving, Volunteering and Participating,Catalogue no. 71-542-XPE, Ottawa, Statistics Canada.)
Statistics Canada – Catalogue No. 61-533 11
Cornerstones of Community: Highlights of the National Survey of Nonprofit and Voluntary Organizations
(9%), and Development and housing (8%). They also include Hospitals, Universities and colleges, Law, advocacy andpolitics, Environment, Education and research, Health, and International organizations. Because of their broad scope,they are very diverse with regard to the size and sources of their revenues and the degree to which they depend on paidstaff versus volunteers.
Nonprofit and voluntary organizations have a substantial economic presence
With revenues totalling $112 billion, nonprofit and voluntary organizations play a substantial role in the Canadian economy.2Although one-third of this is attributable to a relatively small number of Hospitals and Universities and colleges, theremaining organizations still report revenues of $75 billion. Nonprofit and voluntary organizations are also significantemployers, with paid staff totalling just over 2 million people.3
Larger organizations receive the bulk of resources
A small percentage of organizations command most of the resources that flow to nonprofit and voluntary organizations.The 1% of organizations that have annual revenues of $10 million or more receive 59% of all revenues. Almost three-quarters of all volunteers are engaged by the 6% of organizations that have volunteer complements over 200. The 13%of organizations with revenues over $500,000 receive 41% of all volunteer hours.
Larger organizations are more dependent on government funding
Forty-nine percent of all revenues reported by nonprofit and voluntary organizations comes from governments, with 40%coming from provincial sources. Earned income from non-governmental sources accounts for 35% of revenues; gifts anddonations account for 13%. Organizations with larger revenues are generally more likely than others to depend ongovernment funding; those with relatively smaller annual revenues depend more on earned income from non-governmentalsources and gifts and donations. Setting aside Hospitals and Universities and colleges, 36% of the remaining organizations’revenues comes from government, 43% from earned income from non-governmental sources, 17% from gifts anddonations, and 4% from other sources.
The big are getting bigger
Generally, the larger the organization is in terms of revenues, the more likely it is to report increased revenues, a growingnumber of volunteers, and a higher number of paid staff in 2003 than in 2000. Smaller organizations, however, are morelikely to report unchanged or declining revenues over the same period, fewer volunteers, and stable levels of paid staff.
Funding varies by area of activity
Hospitals, Universities and colleges, and Social service organizations tend to depend more on government funding.Business and professional associations and unions, Sports and recreation, Arts and culture, and Development andhousing organizations rely more on earned income from non-governmental sources. However, Religion, International,and Grant-making, fundraising and voluntarism promotion organizations depend more on gifts and donations.
Financial and human resources vary by area of activity
Organizations have substantially different profiles of resource usage. For example, Hospitals and Universities and collegescommand 33% of all revenues, employ 34% of all paid staff, and engage 2% of volunteers. Sports and recreation andReligion organizations, however, account for 12% of revenues, 12% of paid staff, and 38% of all volunteers.
Resources do not appear to be declining, but may still be inadequate
More than three-quarters of organizations report that their revenues and the number of volunteers they engage eitherremained stable or increased from 2000 to 2003. Among organizations with paid staff, more than 80% report that theirnumber of employees has either remained stable or has increased. However, this does not mean that these resourcesare adequate. Many organizations report problems fulfilling their mission, and significant numbers also report difficultiesbecause of increasing demand for services or products.
2. The calculation of revenues includes transfers between nonprofit and voluntary organizations.3. This number may include paid staff working for more than one organization, in which case they would be counted more than once in the total.
12 Statistics Canada – Catalogue No. 61-533
Cornerstones of Community: Highlights of the National Survey of Nonprofit and Voluntary Organizations
4. Organizations that had been in existence for at least three years were asked about difficulties pertaining to funding from governments, foundationsor corporations.
Capacity problems may keep organizations from fulfilling their missions
Organizations report substantial problems relating to their capacity to engage volunteers and obtain funding, which maylimit their ability to contribute to their communities. A majority report difficulty planning for the future, difficulty recruitingthe types of volunteers the organization needs, and difficulty obtaining board members. Close to half report difficultyretaining volunteers, difficulty obtaining funding from other organizations such as government, foundations or corporations,and difficulty obtaining funding from individual donors. Many of these problems tend to be most frequently reported bythe 46% of organizations with revenues of $30,000 to $499,999. However, difficulty obtaining funding from governments,foundations or corporations increases as an organization’s revenues increase. These problems are generally least likelyto be reported by those organizations having the lowest revenues.
The 48% of organizations that reported receiving funding from governments, foundations or corporations between 2000and 2003 report substantial difficulties with respect to this funding.4 More than 60% report problems due to reductions ingovernment funding, unwillingness of funders to fund core operations (e.g., long-term programs, administrative expenses)and overreliance on project funding. At least 25% indicate that these problems are serious. Most of these problemsappear to be associated with government funding, which comprises the bulk of the funding they receive from thesesources.
The geographic distribution of nonprofit and voluntary organizations
The distribution of organizations varies across the country. More organizations are located in Quebec (29%) and Ontario(28%) than in any other province or territory. However, relative to their populations, smaller provinces and territories tendto have larger numbers of organizations than do the larger ones. For example, Quebec has more organizations thanOntario relative to its population. Ontario appears, nevertheless, to command a substantial share of revenues (43% of allrevenues), volunteers (40%) and employees (47%). In addition, the sources of the revenues of organizations vary.Government is the major source of funding for organizations everywhere but Alberta, New Brunswick and the territories,all of which rely more on earned income from non-governmental sources. Organizations in the territories, Newfoundlandand Labrador, and Manitoba are more likely than others to report capacity problems.
The following pages outline the key characteristics of nonprofit and voluntary organizations, their revenues and theirhuman resources, and the capacity challenges they report. They demonstrate the unique features of this set of organizationsand the challenges they are experiencing as they attempt to fulfill their missions and serve the Canadian public.
Statistics Canada – Catalogue No. 61-533 13
Cornerstones of Community: Highlights of the National Survey of Nonprofit and Voluntary Organizations
Key characteristics
Introduction
Nonprofit and voluntary organizations are very diverse, in both their areas of activity and their organizational characteristics.But underlying their differences is a common characteristic—they are instruments for Canadians’ collective action andengagement in civic life.
With their broad scope of activities, nonprofit and voluntary organizations work to address the full range of human needs,improving the quality of our lives and providing essential services on which Canadians have come to depend. Forexample, they provide social services, ranging from day-care centres for children and services for youth to caring forseniors. They also provide opportunities for Canadians to become engaged in their communities by participating insports, recreation or the arts or by addressing social and environmental issues. Nonprofit and voluntary organizationsprovide education and training, housing and shelter, and provide places for people to attend to their spiritual needs. Manyaddress the needs of specific segments of the population, such as persons with disabilities, new Canadians or thehomeless. These organizations often extend our social safety net to catch those who are not served by government orprivate programs and services.
One of the distinguishing features of many nonprofit and voluntary organizations is that they are collectively ‘owned’ bytheir members, who do not receive a share in any revenues that their organizations may generate. The membership ofmost organizations is composed of individual people; for others, membership is typically made up of other organizations.Most organizations have no restrictions on who can join, and they work to provide benefits to the public rather thanfocussing exclusively on their own members. Generally, membership in a nonprofit or voluntary organization does notresult in special benefits other than voting rights or newsletters for those who join.
Nonprofit and voluntary organizations operate in every province and territory in Canada. The majority have a local focus,providing services within a neighbourhood, city, town or rural municipality. However, a significant number reach beyondtheir own locality and in some cases beyond the borders of the country.
What do organizations do?
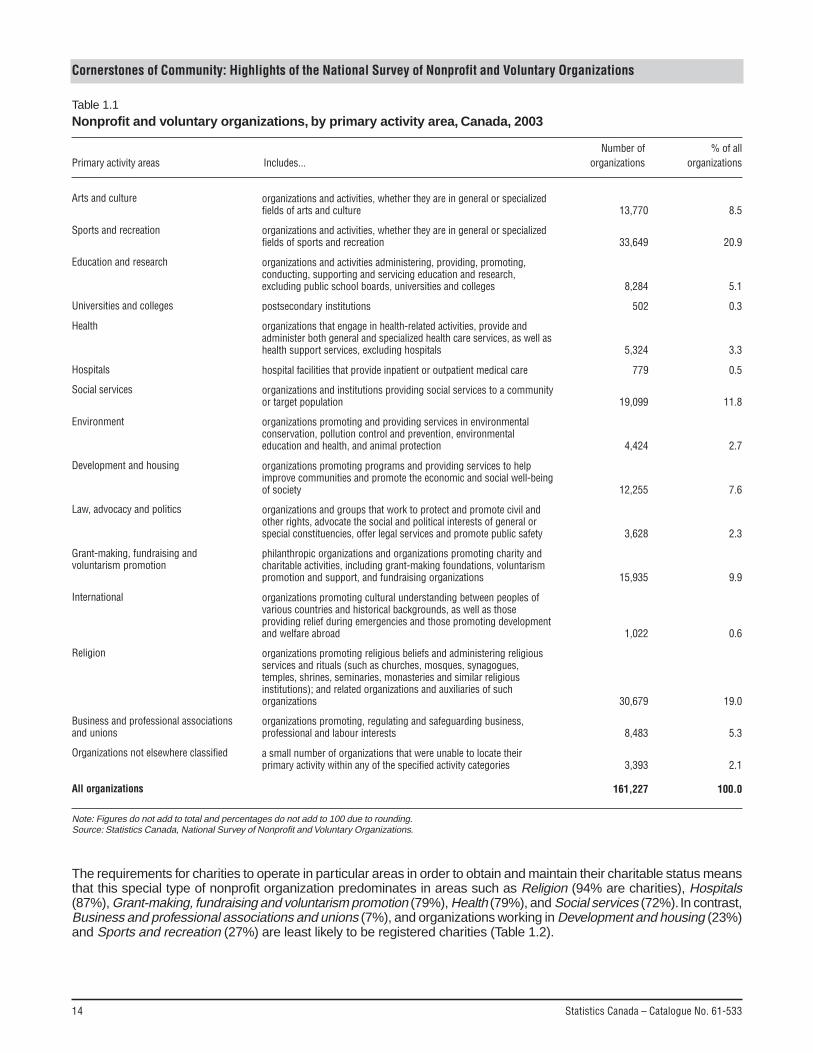
The diversity of Canadian nonprofit and voluntary organizations becomes apparent when they are classified according totheir area of primary economic activity (Table 1.1).1 The two largest categories of organizations are those operating in theareas of Sports and recreation (21% of organizations) and Religion (19%). Other common areas of activity include Socialservices (12%), Grant-making, fundraising and voluntarism promotion (10%), Arts and culture (9%), and Developmentand housing (8%). The remaining categories comprise 5% or less of all nonprofit and voluntary organizations.
How are organizations legally constituted?
Important legal differences among nonprofit and voluntary organizations may influence the types of activities they undertakeand their ability to access resources. A key distinction is between those organizations that are registered charities andthose that are not. Registered charities are able to provide receipts for donations that donors can use to claim tax credits.This gives registered charities an advantage over other nonprofit and voluntary organizations in their ability to attractdonations from individual Canadians as well as corporations. Moreover, registered charities benefit from the provisionthat charitable foundations can disburse funds only to qualified donees, of which registered charities are the largestsingle group. Registered charities may also be exempted from paying income tax and property taxes. As well, they maybe eligible to receive partial rebates on the payment of federal taxes on goods and services and provincial sales taxes insome provinces. To maintain their charitable status, these organizations must fulfill certain requirements, such as devotingthe bulk of their revenues or resources to charitable activities, filing annual information returns to the Canada RevenueAgency and refraining from partisan political advocacy. The Canada Revenue Agency reports approximately 80,000registered charities in Canada. Approximately 84% of all registered charities are incorporated.
1. The classification is based on the International Classification of Nonprofit Organizations (ICNPO) (see L.M. Salamon and H.K. Anheier, 1997,Defining the Nonprofit Sector: A Cross-national Analysis, Manchester, N.Y., Manchester University Press). More detailed information about theICNPO is in Appendix A.
14 Statistics Canada – Catalogue No. 61-533
Cornerstones of Community: Highlights of the National Survey of Nonprofit and Voluntary Organizations
Table 1.1Nonprofit and voluntary organizations, by primary activity area, Canada, 2003
Number of % of allPrimary activity areas Includes... organizations organizations
Arts and culture
Sports and recreation
Education and research
Universities and colleges
Health
Hospitals
Social services
Environment
Development and housing
Law, advocacy and politics
Grant-making, fundraising andvoluntarism promotion
International
Religion
Business and professional associationsand unions
Organizations not elsewhere classified
All organizations
organizations and activities, whether they are in general or specializedfields of arts and culture
organizations and activities, whether they are in general or specializedfields of sports and recreation
organizations and activities administering, providing, promoting,conducting, supporting and servicing education and research,excluding public school boards, universities and colleges
postsecondary institutions
organizations that engage in health-related activities, provide andadminister both general and specialized health care services, as well ashealth support services, excluding hospitals
hospital facilities that provide inpatient or outpatient medical care
organizations and institutions providing social services to a communityor target population
organizations promoting and providing services in environmentalconservation, pollution control and prevention, environmentaleducation and health, and animal protection
organizations promoting programs and providing services to helpimprove communities and promote the economic and social well-beingof society
organizations and groups that work to protect and promote civil andother rights, advocate the social and political interests of general orspecial constituencies, offer legal services and promote public safety
philanthropic organizations and organizations promoting charity andcharitable activities, including grant-making foundations, voluntarismpromotion and support, and fundraising organizations
organizations promoting cultural understanding between peoples ofvarious countries and historical backgrounds, as well as thoseproviding relief during emergencies and those promoting developmentand welfare abroad
organizations promoting religious beliefs and administering religiousservices and rituals (such as churches, mosques, synagogues,temples, shrines, seminaries, monasteries and similar religiousinstitutions); and related organizations and auxiliaries of suchorganizations
organizations promoting, regulating and safeguarding business,professional and labour interests
a small number of organizations that were unable to locate theirprimary activity within any of the specified activity categories
13,770 8.5
33,649 20.9
8,284 5.1
502 0.3
5,324 3.3
779 0.5
19,099 11.8
4,424 2.7
12,255 7.6
3,628 2.3
15,935 9.9
1,022 0.6
30,679 19.0
8,483 5.3
3,393 2.1
161,227 100.0
Note: Figures do not add to total and percentages do not add to 100 due to rounding.Source: Statistics Canada, National Survey of Nonprofit and Voluntary Organizations.
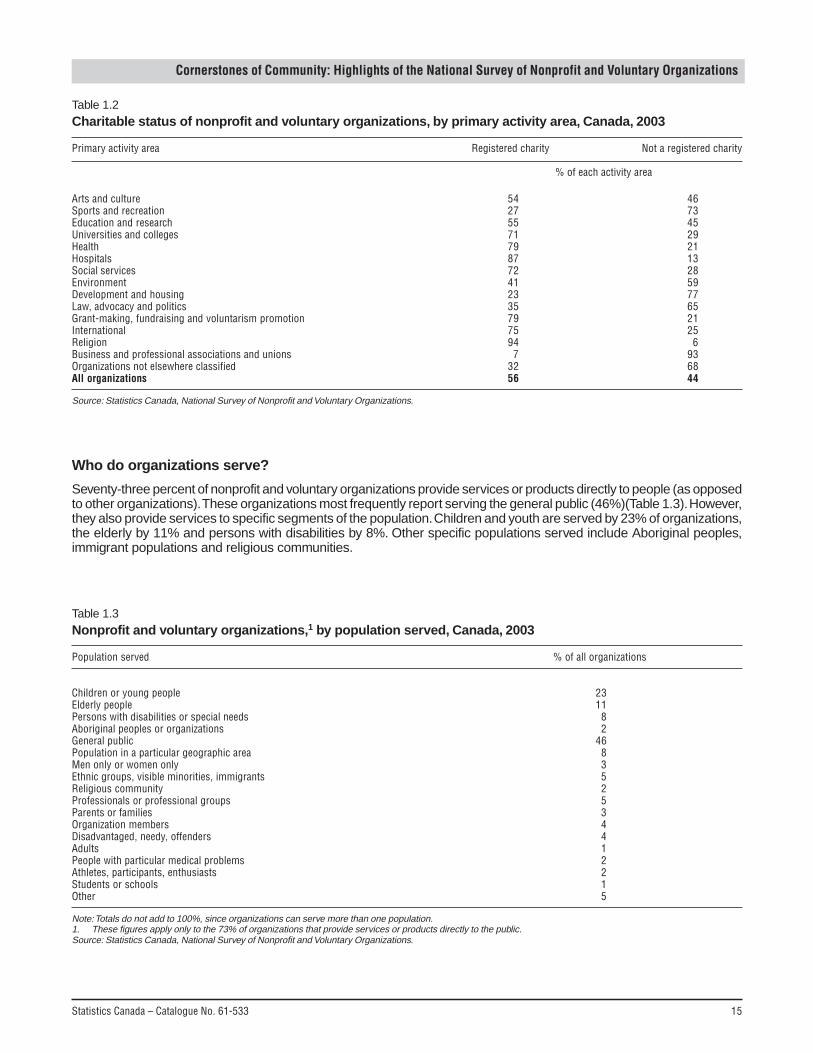
The requirements for charities to operate in particular areas in order to obtain and maintain their charitable status meansthat this special type of nonprofit organization predominates in areas such as Religion (94% are charities), Hospitals(87%), Grant-making, fundraising and voluntarism promotion (79%), Health (79%), and Social services (72%). In contrast,Business and professional associations and unions (7%), and organizations working in Development and housing (23%)and Sports and recreation (27%) are least likely to be registered charities (Table 1.2).
Statistics Canada – Catalogue No. 61-533 15
Cornerstones of Community: Highlights of the National Survey of Nonprofit and Voluntary Organizations
Table 1.2Charitable status of nonprofit and voluntary organizations, by primary activity area, Canada, 2003
Primary activity area Registered charity Not a registered charity
% of each activity area
Arts and culture 54 46Sports and recreation 27 73Education and research 55 45Universities and colleges 71 29Health 79 21Hospitals 87 13Social services 72 28Environment 41 59Development and housing 23 77Law, advocacy and politics 35 65Grant-making, fundraising and voluntarism promotion 79 21International 75 25Religion 94 6Business and professional associations and unions 7 93Organizations not elsewhere classified 32 68All organizations 56 44
Source: Statistics Canada, National Survey of Nonprofit and Voluntary Organizations.
Who do organizations serve?
Seventy-three percent of nonprofit and voluntary organizations provide services or products directly to people (as opposedto other organizations). These organizations most frequently report serving the general public (46%)(Table 1.3). However,they also provide services to specific segments of the population. Children and youth are served by 23% of organizations,the elderly by 11% and persons with disabilities by 8%. Other specific populations served include Aboriginal peoples,immigrant populations and religious communities.
Table 1.3Nonprofit and voluntary organizations,1 by population served, Canada, 2003
Population served % of all organizations
Children or young people 23Elderly people 11Persons with disabilities or special needs 8Aboriginal peoples or organizations 2General public 46Population in a particular geographic area 8Men only or women only 3Ethnic groups, visible minorities, immigrants 5Religious community 2Professionals or professional groups 5Parents or families 3Organization members 4Disadvantaged, needy, offenders 4Adults 1People with particular medical problems 2Athletes, participants, enthusiasts 2Students or schools 1Other 5
Note: Totals do not add to 100%, since organizations can serve more than one population.1. These figures apply only to the 73% of organizations that provide services or products directly to the public.Source: Statistics Canada, National Survey of Nonprofit and Voluntary Organizations.
16 Statistics Canada – Catalogue No. 61-533
Cornerstones of Community: Highlights of the National Survey of Nonprofit and Voluntary Organizations
Many organizations have been established with the purpose of serving particular populations. For example, 42% ofEducation and research organizations report serving children and youth, as do 37% of Social services organizations.Other organizations offer their services more broadly. For example, Religion (73%) and Arts and culture (68%) organizationsare more likely than others to report serving the general public.
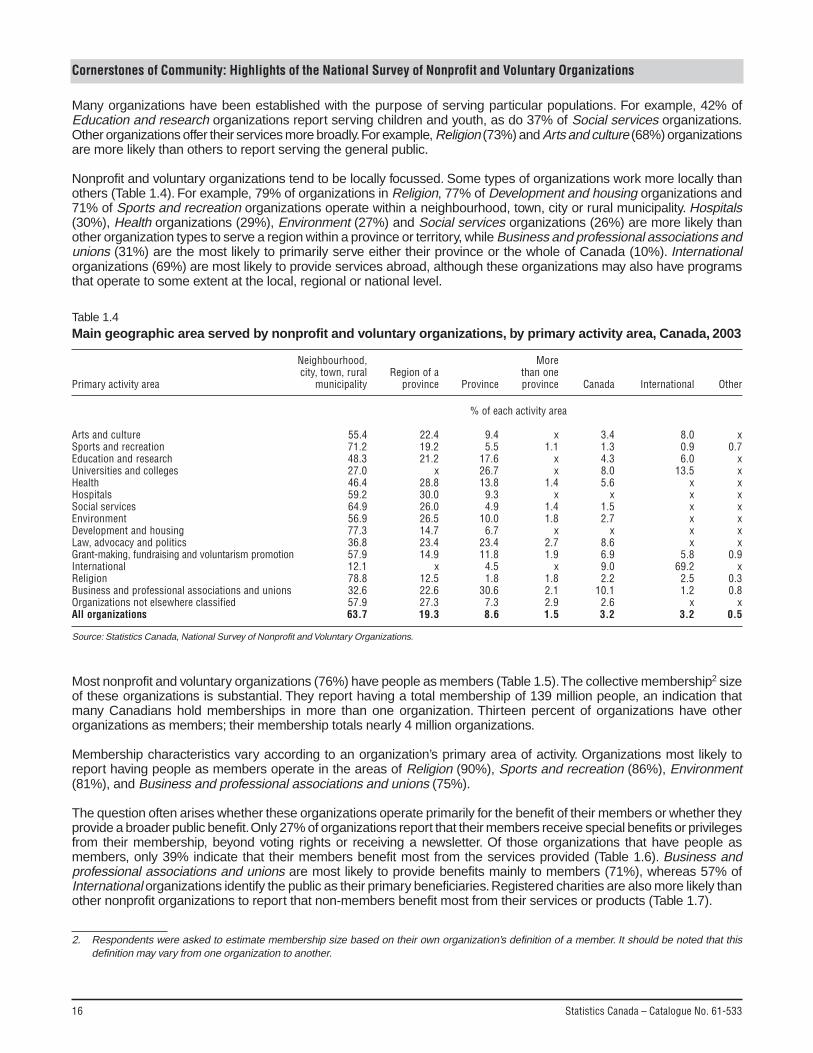
Nonprofit and voluntary organizations tend to be locally focussed. Some types of organizations work more locally thanothers (Table 1.4). For example, 79% of organizations in Religion, 77% of Development and housing organizations and71% of Sports and recreation organizations operate within a neighbourhood, town, city or rural municipality. Hospitals(30%), Health organizations (29%), Environment (27%) and Social services organizations (26%) are more likely thanother organization types to serve a region within a province or territory, while Business and professional associations andunions (31%) are the most likely to primarily serve either their province or the whole of Canada (10%). Internationalorganizations (69%) are most likely to provide services abroad, although these organizations may also have programsthat operate to some extent at the local, regional or national level.
Table 1.4Main geographic area served by nonprofit and voluntary organizations, by primary activity area, Canada, 2003
Neighbourhood, Morecity, town, rural Region of a than one
Primary activity area municipality province Province province Canada International Other
% of each activity area
Arts and culture 55.4 22.4 9.4 x 3.4 8.0 xSports and recreation 71.2 19.2 5.5 1.1 1.3 0.9 0.7Education and research 48.3 21.2 17.6 x 4.3 6.0 xUniversities and colleges 27.0 x 26.7 x 8.0 13.5 xHealth 46.4 28.8 13.8 1.4 5.6 x xHospitals 59.2 30.0 9.3 x x x xSocial services 64.9 26.0 4.9 1.4 1.5 x xEnvironment 56.9 26.5 10.0 1.8 2.7 x xDevelopment and housing 77.3 14.7 6.7 x x x xLaw, advocacy and politics 36.8 23.4 23.4 2.7 8.6 x xGrant-making, fundraising and voluntarism promotion 57.9 14.9 11.8 1.9 6.9 5.8 0.9International 12.1 x 4.5 x 9.0 69.2 xReligion 78.8 12.5 1.8 1.8 2.2 2.5 0.3Business and professional associations and unions 32.6 22.6 30.6 2.1 10.1 1.2 0.8Organizations not elsewhere classified 57.9 27.3 7.3 2.9 2.6 x xAll organizations 63.7 19.3 8.6 1.5 3.2 3.2 0.5
Source: Statistics Canada, National Survey of Nonprofit and Voluntary Organizations.
Most nonprofit and voluntary organizations (76%) have people as members (Table 1.5). The collective membership2 sizeof these organizations is substantial. They report having a total membership of 139 million people, an indication thatmany Canadians hold memberships in more than one organization. Thirteen percent of organizations have otherorganizations as members; their membership totals nearly 4 million organizations.
Membership characteristics vary according to an organization’s primary area of activity. Organizations most likely toreport having people as members operate in the areas of Religion (90%), Sports and recreation (86%), Environment(81%), and Business and professional associations and unions (75%).
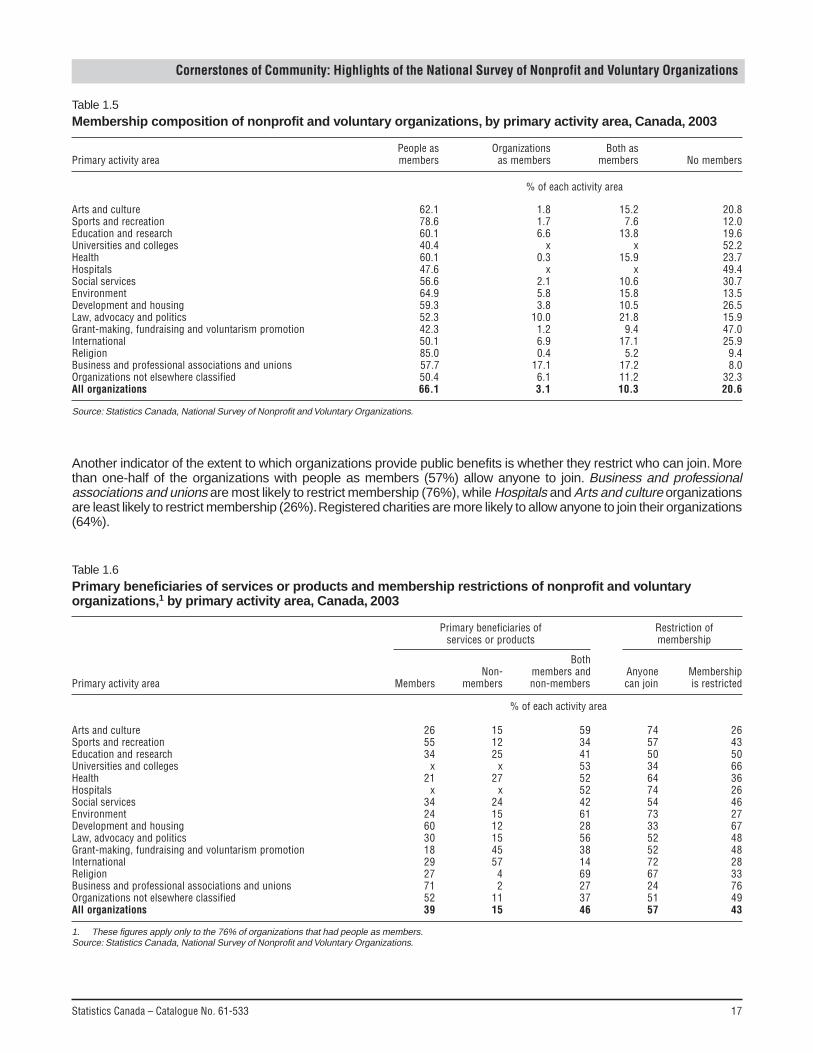
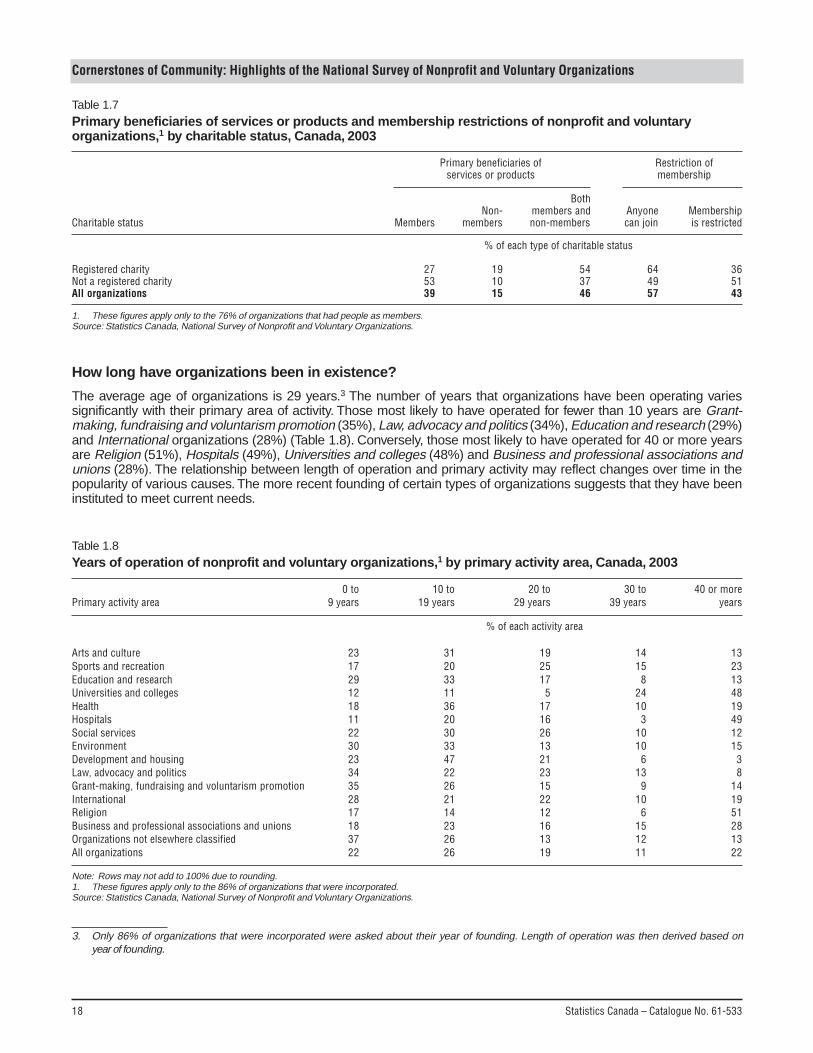
The question often arises whether these organizations operate primarily for the benefit of their members or whether theyprovide a broader public benefit. Only 27% of organizations report that their members receive special benefits or privilegesfrom their membership, beyond voting rights or receiving a newsletter. Of those organizations that have people asmembers, only 39% indicate that their members benefit most from the services provided (Table 1.6). Business andprofessional associations and unions are most likely to provide benefits mainly to members (71%), whereas 57% ofInternational organizations identify the public as their primary beneficiaries. Registered charities are also more likely thanother nonprofit organizations to report that non-members benefit most from their services or products (Table 1.7).
2. Respondents were asked to estimate membership size based on their own organization’s definition of a member. It should be noted that thisdefinition may vary from one organization to another.
Statistics Canada – Catalogue No. 61-533 17
Cornerstones of Community: Highlights of the National Survey of Nonprofit and Voluntary Organizations
Another indicator of the extent to which organizations provide public benefits is whether they restrict who can join. Morethan one-half of the organizations with people as members (57%) allow anyone to join. Business and professionalassociations and unions are most likely to restrict membership (76%), while Hospitals and Arts and culture organizationsare least likely to restrict membership (26%). Registered charities are more likely to allow anyone to join their organizations(64%).
Table 1.5Membership composition of nonprofit and voluntary organizations, by primary activity area, Canada, 2003
People as Organizations Both asPrimary activity area members as members members No members
% of each activity area
Arts and culture 62.1 1.8 15.2 20.8Sports and recreation 78.6 1.7 7.6 12.0Education and research 60.1 6.6 13.8 19.6Universities and colleges 40.4 x x 52.2Health 60.1 0.3 15.9 23.7Hospitals 47.6 x x 49.4Social services 56.6 2.1 10.6 30.7Environment 64.9 5.8 15.8 13.5Development and housing 59.3 3.8 10.5 26.5Law, advocacy and politics 52.3 10.0 21.8 15.9Grant-making, fundraising and voluntarism promotion 42.3 1.2 9.4 47.0International 50.1 6.9 17.1 25.9Religion 85.0 0.4 5.2 9.4Business and professional associations and unions 57.7 17.1 17.2 8.0Organizations not elsewhere classified 50.4 6.1 11.2 32.3All organizations 66.1 3.1 10.3 20.6
Source: Statistics Canada, National Survey of Nonprofit and Voluntary Organizations.
Table 1.6Primary beneficiaries of services or products and membership restrictions of nonprofit and voluntaryorganizations,1 by primary activity area, Canada, 2003
Primary beneficiaries of Restriction ofservices or products membership
BothNon- members and Anyone Membership
Primary activity area Members members non-members can join is restricted
% of each activity area
Arts and culture 26 15 59 74 26Sports and recreation 55 12 34 57 43Education and research 34 25 41 50 50Universities and colleges x x 53 34 66Health 21 27 52 64 36Hospitals x x 52 74 26Social services 34 24 42 54 46Environment 24 15 61 73 27Development and housing 60 12 28 33 67Law, advocacy and politics 30 15 56 52 48Grant-making, fundraising and voluntarism promotion 18 45 38 52 48International 29 57 14 72 28Religion 27 4 69 67 33Business and professional associations and unions 71 2 27 24 76Organizations not elsewhere classified 52 11 37 51 49All organizations 39 15 46 57 43
1. These figures apply only to the 76% of organizations that had people as members.Source: Statistics Canada, National Survey of Nonprofit and Voluntary Organizations.
18 Statistics Canada – Catalogue No. 61-533
Cornerstones of Community: Highlights of the National Survey of Nonprofit and Voluntary Organizations
Table 1.7Primary beneficiaries of services or products and membership restrictions of nonprofit and voluntaryorganizations,1 by charitable status, Canada, 2003
Primary beneficiaries of Restriction ofservices or products membership
BothNon- members and Anyone Membership
Charitable status Members members non-members can join is restricted
% of each type of charitable status
Registered charity 27 19 54 64 36Not a registered charity 53 10 37 49 51All organizations 39 15 46 57 43
1. These figures apply only to the 76% of organizations that had people as members.Source: Statistics Canada, National Survey of Nonprofit and Voluntary Organizations.
How long have organizations been in existence?
The average age of organizations is 29 years.3 The number of years that organizations have been operating variessignificantly with their primary area of activity. Those most likely to have operated for fewer than 10 years are Grant-making, fundraising and voluntarism promotion (35%), Law, advocacy and politics (34%), Education and research (29%)and International organizations (28%) (Table 1.8). Conversely, those most likely to have operated for 40 or more yearsare Religion (51%), Hospitals (49%), Universities and colleges (48%) and Business and professional associations andunions (28%). The relationship between length of operation and primary activity may reflect changes over time in thepopularity of various causes. The more recent founding of certain types of organizations suggests that they have beeninstituted to meet current needs.
Table 1.8Years of operation of nonprofit and voluntary organizations,1 by primary activity area, Canada, 2003
0 to 10 to 20 to 30 to 40 or morePrimary activity area 9 years 19 years 29 years 39 years years
% of each activity area
Arts and culture 23 31 19 14 13Sports and recreation 17 20 25 15 23Education and research 29 33 17 8 13Universities and colleges 12 11 5 24 48Health 18 36 17 10 19Hospitals 11 20 16 3 49Social services 22 30 26 10 12Environment 30 33 13 10 15Development and housing 23 47 21 6 3Law, advocacy and politics 34 22 23 13 8Grant-making, fundraising and voluntarism promotion 35 26 15 9 14International 28 21 22 10 19Religion 17 14 12 6 51Business and professional associations and unions 18 23 16 15 28Organizations not elsewhere classified 37 26 13 12 13All organizations 22 26 19 11 22
Note: Rows may not add to 100% due to rounding.1. These figures apply only to the 86% of organizations that were incorporated.Source: Statistics Canada, National Survey of Nonprofit and Voluntary Organizations.
3. Only 86% of organizations that were incorporated were asked about their year of founding. Length of operation was then derived based on year of founding.
Statistics Canada – Catalogue No. 61-533 19
Cornerstones of Community: Highlights of the National Survey of Nonprofit and Voluntary Organizations
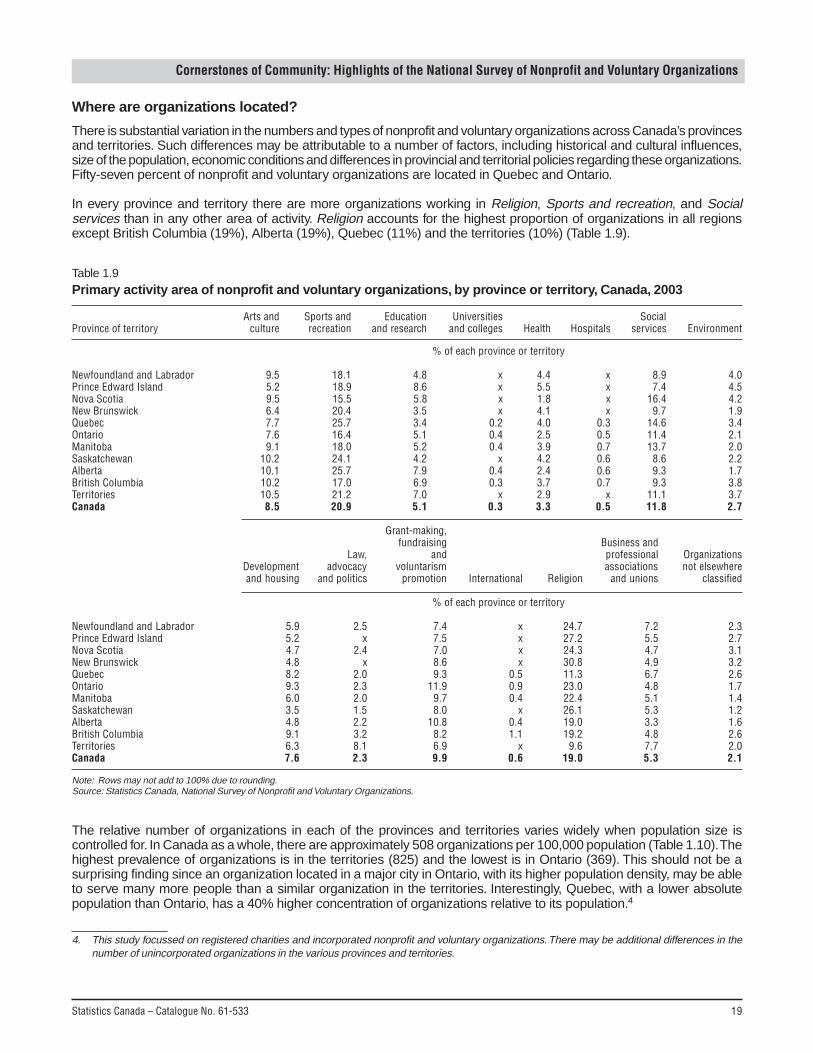
Where are organizations located?
There is substantial variation in the numbers and types of nonprofit and voluntary organizations across Canada’s provincesand territories. Such differences may be attributable to a number of factors, including historical and cultural influences,size of the population, economic conditions and differences in provincial and territorial policies regarding these organizations.Fifty-seven percent of nonprofit and voluntary organizations are located in Quebec and Ontario.
In every province and territory there are more organizations working in Religion, Sports and recreation, and Socialservices than in any other area of activity. Religion accounts for the highest proportion of organizations in all regionsexcept British Columbia (19%), Alberta (19%), Quebec (11%) and the territories (10%) (Table 1.9).
Table 1.9Primary activity area of nonprofit and voluntary organizations, by province or territory, Canada, 2003
Arts and Sports and Education Universities SocialProvince of territory culture recreation and research and colleges Health Hospitals services Environment
% of each province or territory
Newfoundland and Labrador 9.5 18.1 4.8 x 4.4 x 8.9 4.0Prince Edward Island 5.2 18.9 8.6 x 5.5 x 7.4 4.5Nova Scotia 9.5 15.5 5.8 x 1.8 x 16.4 4.2New Brunswick 6.4 20.4 3.5 x 4.1 x 9.7 1.9Quebec 7.7 25.7 3.4 0.2 4.0 0.3 14.6 3.4Ontario 7.6 16.4 5.1 0.4 2.5 0.5 11.4 2.1Manitoba 9.1 18.0 5.2 0.4 3.9 0.7 13.7 2.0Saskatchewan 10.2 24.1 4.2 x 4.2 0.6 8.6 2.2Alberta 10.1 25.7 7.9 0.4 2.4 0.6 9.3 1.7British Columbia 10.2 17.0 6.9 0.3 3.7 0.7 9.3 3.8Territories 10.5 21.2 7.0 x 2.9 x 11.1 3.7Canada 8.5 20.9 5.1 0.3 3.3 0.5 11.8 2.7
Grant-making,fundraising Business and
Law, and professional OrganizationsDevelopment advocacy voluntarism associations not elsewhereand housing and politics promotion International Religion and unions classified
% of each province or territory
Newfoundland and Labrador 5.9 2.5 7.4 x 24.7 7.2 2.3Prince Edward Island 5.2 x 7.5 x 27.2 5.5 2.7Nova Scotia 4.7 2.4 7.0 x 24.3 4.7 3.1New Brunswick 4.8 x 8.6 x 30.8 4.9 3.2Quebec 8.2 2.0 9.3 0.5 11.3 6.7 2.6Ontario 9.3 2.3 11.9 0.9 23.0 4.8 1.7Manitoba 6.0 2.0 9.7 0.4 22.4 5.1 1.4Saskatchewan 3.5 1.5 8.0 x 26.1 5.3 1.2Alberta 4.8 2.2 10.8 0.4 19.0 3.3 1.6British Columbia 9.1 3.2 8.2 1.1 19.2 4.8 2.6Territories 6.3 8.1 6.9 x 9.6 7.7 2.0Canada 7.6 2.3 9.9 0.6 19.0 5.3 2.1
Note: Rows may not add to 100% due to rounding.Source: Statistics Canada, National Survey of Nonprofit and Voluntary Organizations.
4. This study focussed on registered charities and incorporated nonprofit and voluntary organizations. There may be additional differences in thenumber of unincorporated organizations in the various provinces and territories.
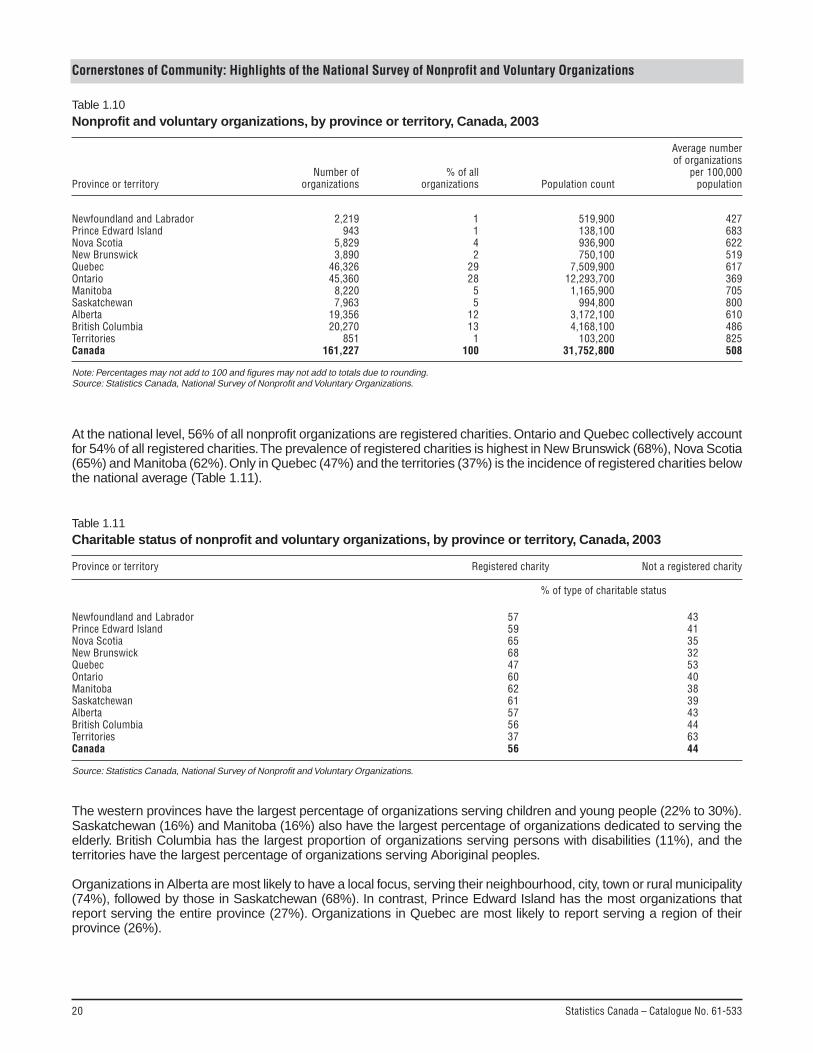
The relative number of organizations in each of the provinces and territories varies widely when population size iscontrolled for. In Canada as a whole, there are approximately 508 organizations per 100,000 population (Table 1.10). Thehighest prevalence of organizations is in the territories (825) and the lowest is in Ontario (369). This should not be asurprising finding since an organization located in a major city in Ontario, with its higher population density, may be ableto serve many more people than a similar organization in the territories. Interestingly, Quebec, with a lower absolutepopulation than Ontario, has a 40% higher concentration of organizations relative to its population.4
20 Statistics Canada – Catalogue No. 61-533
Cornerstones of Community: Highlights of the National Survey of Nonprofit and Voluntary Organizations
At the national level, 56% of all nonprofit organizations are registered charities. Ontario and Quebec collectively accountfor 54% of all registered charities. The prevalence of registered charities is highest in New Brunswick (68%), Nova Scotia(65%) and Manitoba (62%). Only in Quebec (47%) and the territories (37%) is the incidence of registered charities belowthe national average (Table 1.11).
Table 1.10Nonprofit and voluntary organizations, by province or territory, Canada, 2003
Average numberof organizations
Number of % of all per 100,000Province or territory organizations organizations Population count population
Newfoundland and Labrador 2,219 1 519,900 427Prince Edward Island 943 1 138,100 683Nova Scotia 5,829 4 936,900 622New Brunswick 3,890 2 750,100 519Quebec 46,326 29 7,509,900 617Ontario 45,360 28 12,293,700 369Manitoba 8,220 5 1,165,900 705Saskatchewan 7,963 5 994,800 800Alberta 19,356 12 3,172,100 610British Columbia 20,270 13 4,168,100 486Territories 851 1 103,200 825Canada 161,227 100 31,752,800 508
Note: Percentages may not add to 100 and figures may not add to totals due to rounding.Source: Statistics Canada, National Survey of Nonprofit and Voluntary Organizations.
Table 1.11Charitable status of nonprofit and voluntary organizations, by province or territory, Canada, 2003
Province or territory Registered charity Not a registered charity
% of type of charitable status
Newfoundland and Labrador 57 43Prince Edward Island 59 41Nova Scotia 65 35New Brunswick 68 32Quebec 47 53Ontario 60 40Manitoba 62 38Saskatchewan 61 39Alberta 57 43British Columbia 56 44Territories 37 63Canada 56 44
Source: Statistics Canada, National Survey of Nonprofit and Voluntary Organizations.
The western provinces have the largest percentage of organizations serving children and young people (22% to 30%).Saskatchewan (16%) and Manitoba (16%) also have the largest percentage of organizations dedicated to serving theelderly. British Columbia has the largest proportion of organizations serving persons with disabilities (11%), and theterritories have the largest percentage of organizations serving Aboriginal peoples.
Organizations in Alberta are most likely to have a local focus, serving their neighbourhood, city, town or rural municipality(74%), followed by those in Saskatchewan (68%). In contrast, Prince Edward Island has the most organizations thatreport serving the entire province (27%). Organizations in Quebec are most likely to report serving a region of theirprovince (26%).
Statistics Canada – Catalogue No. 61-533 21
Cornerstones of Community: Highlights of the National Survey of Nonprofit and Voluntary Organizations
Summary
Nonprofit and voluntary organizations work in a diverse range of areas. Organizations operating in the area of Sports andrecreation and Religion are the most common, followed by those working in Social services and Grant-making, fundraisingand voluntarism promotion. About half of organizations are registered charities.
Most nonprofit and voluntary organizations provide services close to home, within their neighbourhood, city, town or ruralmunicipality. Most organizations report serving the general public, but many also deliver services to specialized groups.The overwhelming majority of organizations provide services or products directly to individual Canadians. Most reportthat membership is open to anyone wanting to join, that they do not restrict their services to that membership, and thatmembers are not the primary beneficiaries of the services provided.
Ontario and Quebec account for the majority of nonprofit and voluntary organizations, a finding that is not surprisingsince nearly two-thirds of the Canadian population live in these two provinces. However, looking at the number oforganizations relative to the size of population in each province provides a somewhat different perspective. The numberof organizations per 100,000 people is actually the lowest in Ontario and highest in the territories, the region with thesmallest number of organizations.
22 Statistics Canada – Catalogue No. 61-533
Cornerstones of Community: Highlights of the National Survey of Nonprofit and Voluntary Organizations
Financial resources
Introduction
In addition to the contributions that nonprofit and voluntary organizations make to Canadian communities and our qualityof life, they have a substantial economic presence. Nonprofit and voluntary organizations reported a total of $112 billionin yearly revenues in 2003.1 One-third of these revenues was reported by the less than 1% of organizations that areHospitals and Universities and colleges. The remaining 99% of organizations reported $75 billion in total revenues.
While many nonprofit and voluntary organizations earn income by providing goods and services for a fee, some alsodepend substantially on governments—particularly provincial governments—for funding. Smaller organizations rely heavilyon donations of money and in-kind donations of goods and services.
How is revenue distributed across organizations?
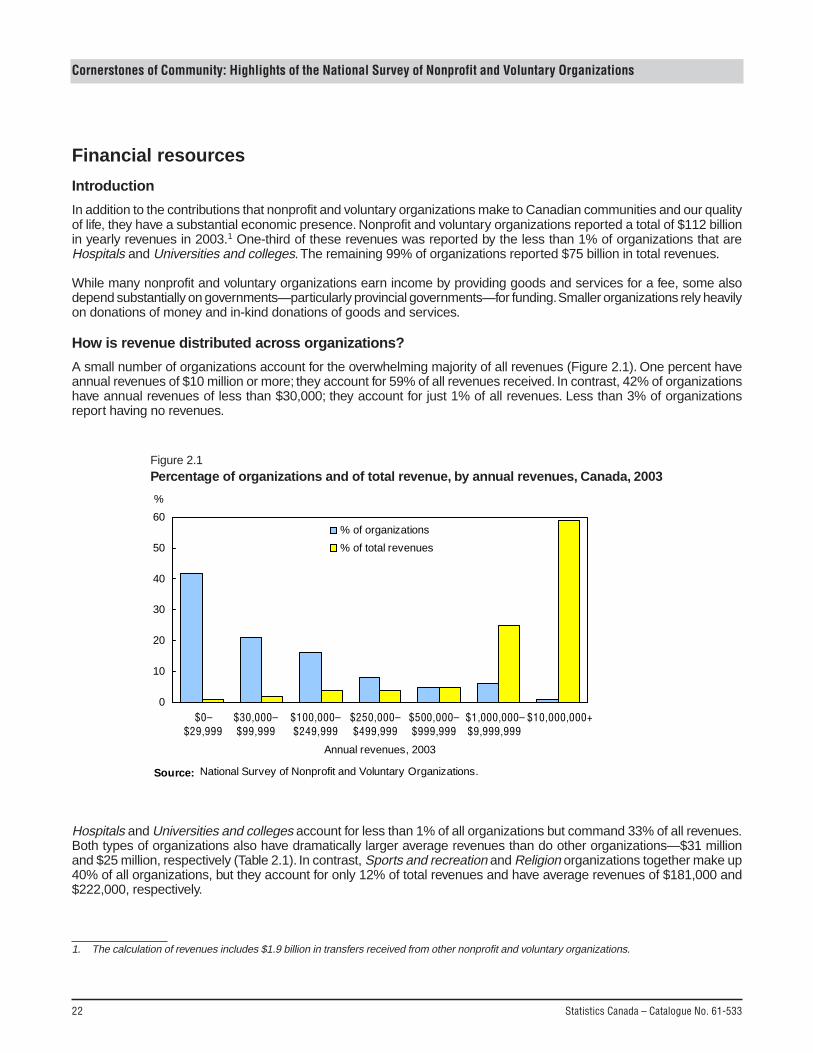
A small number of organizations account for the overwhelming majority of all revenues (Figure 2.1). One percent haveannual revenues of $10 million or more; they account for 59% of all revenues received. In contrast, 42% of organizationshave annual revenues of less than $30,000; they account for just 1% of all revenues. Less than 3% of organizationsreport having no revenues.
1. The calculation of revenues includes $1.9 billion in transfers received from other nonprofit and voluntary organizations.
0
10
20
30
40
50
60
$0–$29,999
$30,000– $99,999
$100,000– $249,999
$250,000– $499,999
$500,000– $999,999
$1,000,000– $9,999,999
$10,000,000+
% of organizations
% of total revenues
%
Source: National Survey of Nonprofit and Voluntary Organizations.
Annual revenues, 2003
Figure 2.1Percentage of organizations and of total revenue, by annual revenues, Canada, 2003
Hospitals and Universities and colleges account for less than 1% of all organizations but command 33% of all revenues.Both types of organizations also have dramatically larger average revenues than do other organizations—$31 millionand $25 million, respectively (Table 2.1). In contrast, Sports and recreation and Religion organizations together make up40% of all organizations, but they account for only 12% of total revenues and have average revenues of $181,000 and$222,000, respectively.
Statistics Canada – Catalogue No. 61-533 23
Cornerstones of Community: Highlights of the National Survey of Nonprofit and Voluntary Organizations
Registered charities represent 56% of organizations, account for 63% of all revenues reported and typically have largeraverage total revenues than do organizations that are not registered as charities. Such differences in revenues may beattributable to the tax exemptions that registered charities registered charities receive and their ability to offer donors theopportunity to claim tax credits for donations.
Table 2.1Revenues of nonprofit and voluntary organizations, by primary activity area and charitable status,Canada, 2003
Primary activity areaAll All
organizations revenues Total Average
% % $ millions $
Arts and culture 8.5 3.1 3,427 248,908Sports and recreation 20.9 5.4 6,078 180,637Education and research 5.1 5.9 6,592 795,663Universities and colleges 0.3 11.1 12,381 24,647,015Health 3.3 8.2 9,174 1,723,082Hospitals 0.5 21.9 24,451 31,387,311Social services 11.8 10.0 11,146 583,599Environment 2.7 1.0 1,131 255,753Development and housing 7.6 5.9 6,625 540,657Law, advocacy and politics 2.3 1.3 1,403 386,623Grant-making, fundraising and voluntarism promotion 9.9 7.4 8,253 517,916International 0.6 1.1 1,253 1,225,492Religion 19.0 6.1E 6,805E 221,813E
Business and professional associations and unions 5.3 9.7 10,770 1,269,601Organizations not elsewhere classified 2.1 1.9 2,105 620,189All organizations 100.0 100.0 111,596 692,163
Charitable statusRegistered charity 55.7 63.3 70,613 786,094Not a registered charity 44.3 36.7 40,982 573,987All organizations 100.0 100.0 111,596 692,163
Note: Percentages may not add to 100 and figures may not add to totals due to rounding.Source: Statistics Canada, National Survey of Nonprofit and Voluntary Organizations.
How do organizations generate revenue?
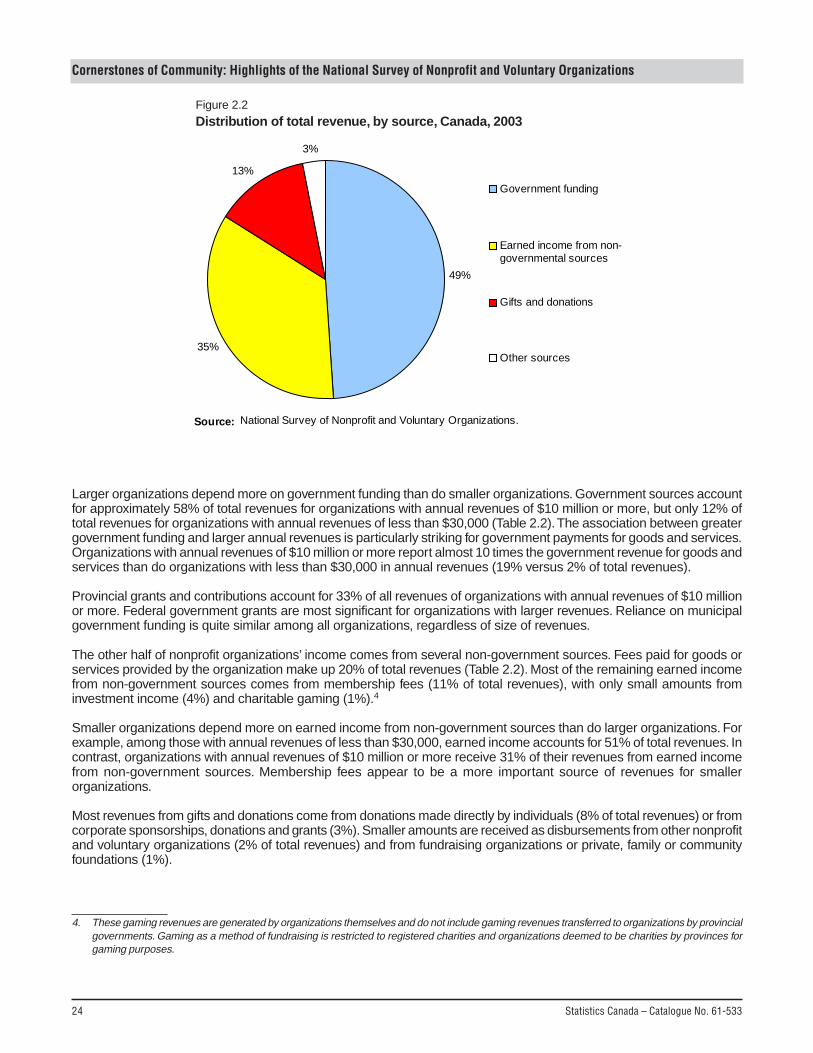
Governments provide 49% of the funds that organizations receive; 35% of revenue is earned income from non-governmentsources, generated by memberships and sales of goods and services (Figure 2.2).2 Thirteen percent of all revenue isreceived in the form of gifts and donations from individuals, corporations and other organizations. Excluding Hospitalsand Universities and colleges, 36% of revenues come from government, 43% from earned income from non-governmentsources, 17% from gifts and donations, and the remaining 4% from other sources.
Forty percent of the funding for all organizations comes from provincial governments. The federal government provides7% of all funding, and municipal governments, 2%. Of the funding coming from government, almost two-thirds is in theform of grants and contributions (31% of total revenues for nonprofit and voluntary organizations). The remaining revenues(18% of total revenues) from government are received as payment for goods and services that nonprofit and voluntaryorganizations have delivered.3
2. Earned income excludes government revenue sources, but includes such items as charitable gaming, membership fees or dues, fees for goodsand services and earnings from endowments or investments, including interest income.
3. Government grants and contribution agreements can also be used to pay for the delivery of goods and services on behalf of government.
24 Statistics Canada – Catalogue No. 61-533
Cornerstones of Community: Highlights of the National Survey of Nonprofit and Voluntary Organizations
Larger organizations depend more on government funding than do smaller organizations. Government sources accountfor approximately 58% of total revenues for organizations with annual revenues of $10 million or more, but only 12% oftotal revenues for organizations with annual revenues of less than $30,000 (Table 2.2). The association between greatergovernment funding and larger annual revenues is particularly striking for government payments for goods and services.Organizations with annual revenues of $10 million or more report almost 10 times the government revenue for goods andservices than do organizations with less than $30,000 in annual revenues (19% versus 2% of total revenues).
Provincial grants and contributions account for 33% of all revenues of organizations with annual revenues of $10 millionor more. Federal government grants are most significant for organizations with larger revenues. Reliance on municipalgovernment funding is quite similar among all organizations, regardless of size of revenues.
The other half of nonprofit organizations’ income comes from several non-government sources. Fees paid for goods orservices provided by the organization make up 20% of total revenues (Table 2.2). Most of the remaining earned incomefrom non-government sources comes from membership fees (11% of total revenues), with only small amounts frominvestment income (4%) and charitable gaming (1%).4
Smaller organizations depend more on earned income from non-government sources than do larger organizations. Forexample, among those with annual revenues of less than $30,000, earned income accounts for 51% of total revenues. Incontrast, organizations with annual revenues of $10 million or more receive 31% of their revenues from earned incomefrom non-government sources. Membership fees appear to be a more important source of revenues for smallerorganizations.
Most revenues from gifts and donations come from donations made directly by individuals (8% of total revenues) or fromcorporate sponsorships, donations and grants (3%). Smaller amounts are received as disbursements from other nonprofitand voluntary organizations (2% of total revenues) and from fundraising organizations or private, family or communityfoundations (1%).
4. These gaming revenues are generated by organizations themselves and do not include gaming revenues transferred to organizations by provincialgovernments. Gaming as a method of fundraising is restricted to registered charities and organizations deemed to be charities by provinces forgaming purposes.
Figure 2.2Distribution of total revenue, by source, Canada, 2003
49%
35%
13%
3%
Government funding
Earned income from non-governmental sources
Gifts and donations
Other sources
Source: National Survey of Nonprofit and Voluntary Organizations.
Statistics Canada – Catalogue No. 61-533 25
Cornerstones of Community: Highlights of the National Survey of Nonprofit and Voluntary Organizations
Smaller organizations also rely more upon gifts and donations for revenues than do larger organizations. Gifts anddonations account for about one-third of total revenues among organizations with annual revenues of less than $250,000,but for just 8% of revenues for organizations earning $10 million or more. This pattern is driven almost exclusively byfluctuations in individual donations; other types of gifts and donations are relatively constant, regardless of the size ofrevenues.
Table 2.2Sources of revenue of nonprofit and voluntary organizations, by annual revenues, Canada, 2003
$30,000 $100,000 $250,000 $500,000 $1,000,000Less than to to to to to $10,000,000 All
Sources of revenue Revenues $30,000 $99,999 $249,999 $499,999 $999,999 $9,999,999 or more organizations
$ millions % of all sources
Revenues from governmentGovernment payments for goods and services
Federal 1,629 0 1 1 2 4 2 1 1Provincial 17,203 1 2 2 6 9 17 18 15Municipal 1,035 1 1 1 1 2 2 1 1Other government 85
E0 0 0 0 0 0 0 0
Total government payments for goods and services 19,952 2 4 4 9 15 20 19 18
Government grants and contributionsFederal 6,040 2 2 4 5 6 5 6 5Provincial 26,944 5 8 12 11 13 12 33 24Municipal 1,068
E3 2 2 2 2 2 0 1
Other government 156 0 0 0 0 0 0 0 0Total government grants and contributions 34,208 9 12 18 18 20 19 39 31
Total revenues from government 54,160 12 16 21 27 35 39 58 49
Earned income from non-governmental sourcesCharitable gaming 1,243 7 8 5 4 2 1 0 1Membership fees 12,034 22 17 16 14 14 13 9 11Fees for goods or services 21,845 17 16 18 21 23 21 19 20Investment income (including interest) 4,173 5 4 4 4 3 4 4 4
Total earned income from non-governmentalsources 39,294 51 44 43 43 42 39 31 35
Gifts and donationsIndividual donations 8,370
E23 25 25 20 12 10 4 8
Fundraising organizations and family communityfoundations 1,138 2 2 2 1 2 2 1 1
Disbursements from other nonprofit organizations 1,935 3 3 2 2 2 2 1 2Corporate sponsorships, donations or grants 2,815 4 3 3 3 2 3 2 3
Total gifts and donations 14,258 31 34 32 26 18 17 8 13Total other income 3,883 6 6 4 4 4 5 2 3
Source: Statistics Canada, National Survey of Nonprofit and Voluntary Organizations.
The types of revenues that organizations depend on to do their work vary according to the organization’s area of primaryactivity (Table 2.3). Government is a major source of revenues for Hospitals (82% of total revenues), Health (70%), Socialservices (66%) and Universities and colleges (56%). In contrast, organizations in Sports and recreation (12%) andReligion (8%), as well as Business and professional associations and unions (7%), receive comparatively small amountsof their total revenues from government.
Provincial governments provide significant funding for organizations that work in areas where the government hasconstitutional responsibility for delivery of services, such as Hospitals, Health, Universities and colleges and Socialservices. For Hospitals and Universities and colleges, the bulk of this funding comes in the form of provincial governmentgrants and contributions (49% of total revenues for Hospitals, and 42% for Universities and colleges). For Health andSocial services organizations, provincial government funding is much more evenly distributed between grants andcontributions on the one hand and payments for goods and services on the other.
26 Statistics Canada – Catalogue No. 61-533
Cornerstones of Community: Highlights of the National Survey of Nonprofit and Voluntary Organizations
Most organizations rely more on provincial government funding than they do on funding from federal or municipal sources.Exceptions are International and Law, advocacy and politics organizations, which receive a larger proportion of theirrevenues from the federal government than do other organizations, and which receive these mostly in the form of grants.Municipal governments account for only a small percentage of funding for most organizations. Organizations with thegreatest reliance on municipal funding are those working in the areas of Environment (9% of total revenues), Socialservices (6%), Arts and culture (6%) and Development and housing (6%).
Although governments are the largest source of funding for many organizations, those classified as Business andprofessional associations and unions, Sports and recreation, Arts and culture, Development and housing and Environmentdepend heavily on earned income from non-government sources. Within the earned income from non-governmentsources category, two sources of revenues tend to be most important: fees for goods and services, and membership feesand dues. The former provides a substantial percentage of total revenues for Arts and culture (42%), Development andhousing (40%) and Environment organizations (35%). The latter is a relatively larger source of revenue for Business andprofessional associations and unions (69%), Sports and recreation (25%) and Law, advocacy and politics (24%)organizations. The other two types of earned income from non-government sources—charitable gaming receipts andinvestment income—provide modest amounts of revenues for most organizations. However, Grant-making, fundraisingand voluntarism promotion organizations receive 22% of total revenues in the form of investment income, and Sportsand recreation organizations obtain 7% of revenues from charitable gaming.
Gifts and donations are a substantial source of revenues for Religion (accounting for 64% of total revenues), International(39%) and Grant-making, fundraising and voluntarism promotion organizations (32%). For most, these revenues comefrom individual donations. Corporate sponsorships, donations and grants are significant sources of revenue for Sportsand recreation (15% of total revenues), Arts and culture (8%) and Grant-making, fundraising and voluntarism promotionorganizations (5%).
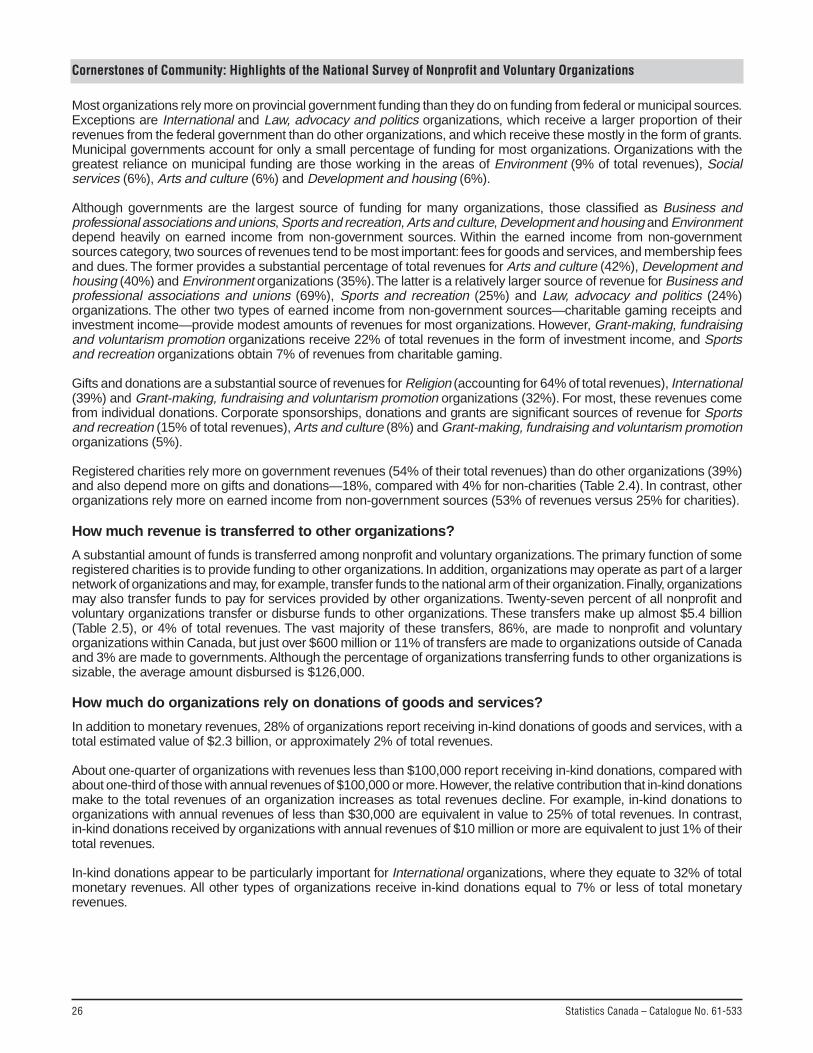
Registered charities rely more on government revenues (54% of their total revenues) than do other organizations (39%)and also depend more on gifts and donations—18%, compared with 4% for non-charities (Table 2.4). In contrast, otherorganizations rely more on earned income from non-government sources (53% of revenues versus 25% for charities).
How much revenue is transferred to other organizations?
A substantial amount of funds is transferred among nonprofit and voluntary organizations. The primary function of someregistered charities is to provide funding to other organizations. In addition, organizations may operate as part of a largernetwork of organizations and may, for example, transfer funds to the national arm of their organization. Finally, organizationsmay also transfer funds to pay for services provided by other organizations. Twenty-seven percent of all nonprofit andvoluntary organizations transfer or disburse funds to other organizations. These transfers make up almost $5.4 billion(Table 2.5), or 4% of total revenues. The vast majority of these transfers, 86%, are made to nonprofit and voluntaryorganizations within Canada, but just over $600 million or 11% of transfers are made to organizations outside of Canadaand 3% are made to governments. Although the percentage of organizations transferring funds to other organizations issizable, the average amount disbursed is $126,000.
How much do organizations rely on donations of goods and services?
In addition to monetary revenues, 28% of organizations report receiving in-kind donations of goods and services, with atotal estimated value of $2.3 billion, or approximately 2% of total revenues.
About one-quarter of organizations with revenues less than $100,000 report receiving in-kind donations, compared withabout one-third of those with annual revenues of $100,000 or more. However, the relative contribution that in-kind donationsmake to the total revenues of an organization increases as total revenues decline. For example, in-kind donations toorganizations with annual revenues of less than $30,000 are equivalent in value to 25% of total revenues. In contrast,in-kind donations received by organizations with annual revenues of $10 million or more are equivalent to just 1% of theirtotal revenues.
In-kind donations appear to be particularly important for International organizations, where they equate to 32% of totalmonetary revenues. All other types of organizations receive in-kind donations equal to 7% or less of total monetaryrevenues.

Statistics Canada – Catalogue No. 61-533 27
Cornerstones of Community: Highlights of the National Survey of Nonprofit and Voluntary Organizations
Table 2.3Sources of revenue of nonprofit and voluntary organizations, by primary activity area, Canada, 2003
Arts and Sports and Education Universities SocialSources of revenue culture recreation and research and colleges Health Hospitals services Environment
% of all sourcesRevenues from governmentGovernment payments for goods and services
Federal 1 1 1 1 2 0 2 4Provincial 2 2 7 6 29 32 28 3Municipal 0 1 0 0 1 0 5 8Other government 0 0 0 0 1 0 0 0Total government payments for goods and services 4 3 9 7 33 33 35 15
Government grants and contributionsFederal 7 2 17 7 6 0 3 5Provincial 11 5 20 42 31 49 26 6Municipal 6 2 0 0 0 0 2 1Other government 0 0 0 0 0 0 0 0Total government grants and contributions 24 9 37 49 38 49 31 12
Total revenues from government 28 12 46 56 70 82 66 27
Earned income from non-governmental sourcesCharitable gaming 4 7 1 0 0 0 1 1Membership fees 3 25 5 3 1 0 4 7Fees for goods or services 42 31 32 28 16 10 13 35Investment income (including interest) 1 2 1 2 1 3 1 1
Total earned income from non-governmental sources 50 65 40 32 18 14 20 44
Gifts and donationsIndividual donations 7 3 5 2 5 0 4 15Fundraising organizations and family community
foundations 1 0 1 0 1 0 3 2Disbursements from other nonprofit organizations 1 1 1 3 1 1 1 4Corporate sponsorships, donations or grants 8 15 2 2 3 0 2 2
Total gifts and donations 17 20 9 7 9 2 11 23Total other income 5 3 4 5 2 2 3 6
Grant-making, Business andfundraising and professional Organizations
Development Law and voluntarism associations not classified Alland housing advocacy promotion International Religion and unions elsewhere organizations
% of all sourcesRevenues from governmentGovernment payments for goods and services
Federal 4 16 0 6 0 1 9 1Provincial 19 6 2 1 2 3 4 15Municipal 2 1 0 0 0 0 3 1Other government 0 0 0 0 0 0 0 0Total government payments for goods and services 26 22 2 7 2 4 15 18
Government grants and contributionsFederal 7 12 19 32 0 2 2 5Provincial 7 13 9 2 4
E1 7 24
Municipal 4 0 0 0 2E
0 0 1Other government 0 0 0 0 0 0 0 0Total government grants and contributions 19 25 28 35 6
E3 9 31
Total revenues from government 44 47 30 42 8E
7 24 49
Earned income from non-governmental sourcesCharitable gaming 0 2 4 0 1 0 1 1Membership fees 6 24 1 3 9 69 4 11Fees for goods or services 40 13 7 8 9 14 62 20Investment income (including interest) 3 2 22 2 5 2 2 4
Total earned income from non-governmental sources 50 41 35 13 24 85 69 35
Gifts and donationsIndividual donations 0 5 21 30 57
E0 2 8
Fundraising organizations and family community foundations 1 1 3 2 1 0 0 1Disbursements from other nonprofit organizations 1 1 4 4 5 0 1 2Corporate sponsorships, donations or grants 0 2 5 3 1 1 0 3
Total gifts and donations 2 9 32 39 64E
2 4 13Total other income 4 3 3 7 5 5 3 3
Note: Percentages may not add to 100 due to rounding.Source: Statistics Canada, National Survey of Nonprofit and Voluntary Organizations.
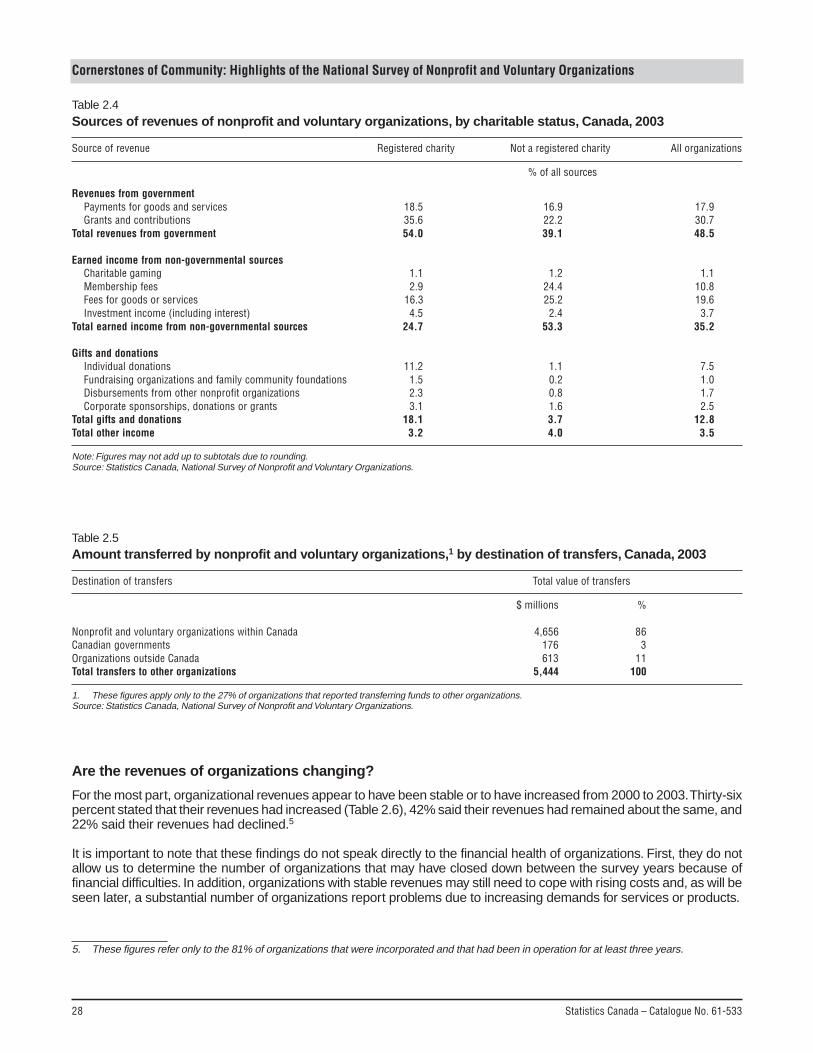
28 Statistics Canada – Catalogue No. 61-533
Cornerstones of Community: Highlights of the National Survey of Nonprofit and Voluntary Organizations
Table 2.4Sources of revenues of nonprofit and voluntary organizations, by charitable status, Canada, 2003
Source of revenue Registered charity Not a registered charity All organizations
% of all sources
Revenues from governmentPayments for goods and services 18.5 16.9 17.9Grants and contributions 35.6 22.2 30.7
Total revenues from government 54.0 39.1 48.5
Earned income from non-governmental sourcesCharitable gaming 1.1 1.2 1.1Membership fees 2.9 24.4 10.8Fees for goods or services 16.3 25.2 19.6Investment income (including interest) 4.5 2.4 3.7
Total earned income from non-governmental sources 24.7 53.3 35.2
Gifts and donationsIndividual donations 11.2 1.1 7.5Fundraising organizations and family community foundations 1.5 0.2 1.0Disbursements from other nonprofit organizations 2.3 0.8 1.7Corporate sponsorships, donations or grants 3.1 1.6 2.5
Total gifts and donations 18.1 3.7 12.8Total other income 3.2 4.0 3.5
Note: Figures may not add up to subtotals due to rounding.Source: Statistics Canada, National Survey of Nonprofit and Voluntary Organizations.
Table 2.5Amount transferred by nonprofit and voluntary organizations,1 by destination of transfers, Canada, 2003
Destination of transfers Total value of transfers
$ millions %
Nonprofit and voluntary organizations within Canada 4,656 86Canadian governments 176 3Organizations outside Canada 613 11Total transfers to other organizations 5,444 100
1. These figures apply only to the 27% of organizations that reported transferring funds to other organizations.Source: Statistics Canada, National Survey of Nonprofit and Voluntary Organizations.
5. These figures refer only to the 81% of organizations that were incorporated and that had been in operation for at least three years.
Are the revenues of organizations changing?
For the most part, organizational revenues appear to have been stable or to have increased from 2000 to 2003. Thirty-sixpercent stated that their revenues had increased (Table 2.6), 42% said their revenues had remained about the same, and22% said their revenues had declined.5
It is important to note that these findings do not speak directly to the financial health of organizations. First, they do notallow us to determine the number of organizations that may have closed down between the survey years because offinancial difficulties. In addition, organizations with stable revenues may still need to cope with rising costs and, as will beseen later, a substantial number of organizations report problems due to increasing demands for services or products.
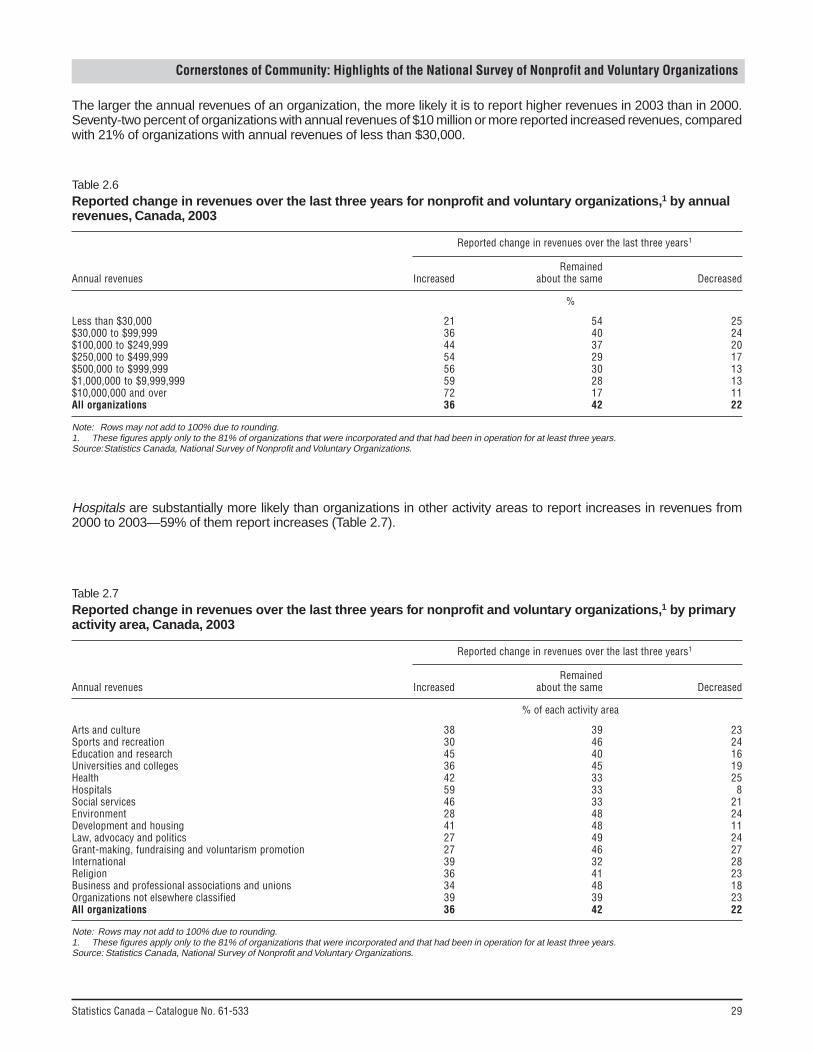
Statistics Canada – Catalogue No. 61-533 29
Cornerstones of Community: Highlights of the National Survey of Nonprofit and Voluntary Organizations
The larger the annual revenues of an organization, the more likely it is to report higher revenues in 2003 than in 2000.Seventy-two percent of organizations with annual revenues of $10 million or more reported increased revenues, comparedwith 21% of organizations with annual revenues of less than $30,000.
Table 2.6Reported change in revenues over the last three years for nonprofit and voluntary organizations,1 by annualrevenues, Canada, 2003
Reported change in revenues over the last three years1
RemainedAnnual revenues Increased about the same Decreased
%
Less than $30,000 21 54 25$30,000 to $99,999 36 40 24$100,000 to $249,999 44 37 20$250,000 to $499,999 54 29 17$500,000 to $999,999 56 30 13$1,000,000 to $9,999,999 59 28 13$10,000,000 and over 72 17 11All organizations 36 42 22
Note: Rows may not add to 100% due to rounding.1. These figures apply only to the 81% of organizations that were incorporated and that had been in operation for at least three years.Source:Statistics Canada, National Survey of Nonprofit and Voluntary Organizations.
Hospitals are substantially more likely than organizations in other activity areas to report increases in revenues from2000 to 2003—59% of them report increases (Table 2.7).
Table 2.7Reported change in revenues over the last three years for nonprofit and voluntary organizations,1 by primaryactivity area, Canada, 2003
Reported change in revenues over the last three years1
RemainedAnnual revenues Increased about the same Decreased
% of each activity area
Arts and culture 38 39 23Sports and recreation 30 46 24Education and research 45 40 16Universities and colleges 36 45 19Health 42 33 25Hospitals 59 33 8Social services 46 33 21Environment 28 48 24Development and housing 41 48 11Law, advocacy and politics 27 49 24Grant-making, fundraising and voluntarism promotion 27 46 27International 39 32 28Religion 36 41 23Business and professional associations and unions 34 48 18Organizations not elsewhere classified 39 39 23All organizations 36 42 22
Note: Rows may not add to 100% due to rounding.1. These figures apply only to the 81% of organizations that were incorporated and that had been in operation for at least three years.Source: Statistics Canada, National Survey of Nonprofit and Voluntary Organizations.
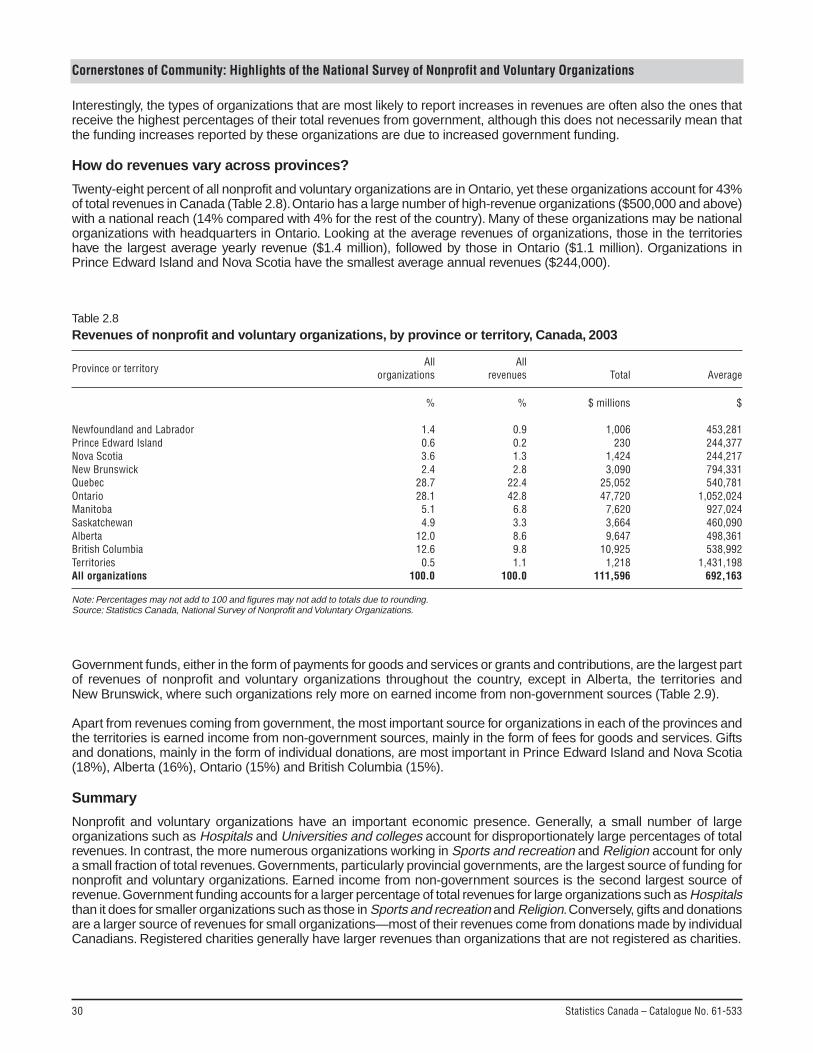
30 Statistics Canada – Catalogue No. 61-533
Cornerstones of Community: Highlights of the National Survey of Nonprofit and Voluntary Organizations
Interestingly, the types of organizations that are most likely to report increases in revenues are often also the ones thatreceive the highest percentages of their total revenues from government, although this does not necessarily mean thatthe funding increases reported by these organizations are due to increased government funding.
How do revenues vary across provinces?
Twenty-eight percent of all nonprofit and voluntary organizations are in Ontario, yet these organizations account for 43%of total revenues in Canada (Table 2.8). Ontario has a large number of high-revenue organizations ($500,000 and above)with a national reach (14% compared with 4% for the rest of the country). Many of these organizations may be nationalorganizations with headquarters in Ontario. Looking at the average revenues of organizations, those in the territorieshave the largest average yearly revenue ($1.4 million), followed by those in Ontario ($1.1 million). Organizations inPrince Edward Island and Nova Scotia have the smallest average annual revenues ($244,000).
Table 2.8Revenues of nonprofit and voluntary organizations, by province or territory, Canada, 2003
Province or territoryAll All
organizations revenues Total Average
% % $ millions $
Newfoundland and Labrador 1.4 0.9 1,006 453,281Prince Edward Island 0.6 0.2 230 244,377Nova Scotia 3.6 1.3 1,424 244,217New Brunswick 2.4 2.8 3,090 794,331Quebec 28.7 22.4 25,052 540,781Ontario 28.1 42.8 47,720 1,052,024Manitoba 5.1 6.8 7,620 927,024Saskatchewan 4.9 3.3 3,664 460,090Alberta 12.0 8.6 9,647 498,361British Columbia 12.6 9.8 10,925 538,992Territories 0.5 1.1 1,218 1,431,198All organizations 100.0 100.0 111,596 692,163
Note: Percentages may not add to 100 and figures may not add to totals due to rounding.Source: Statistics Canada, National Survey of Nonprofit and Voluntary Organizations.
Government funds, either in the form of payments for goods and services or grants and contributions, are the largest partof revenues of nonprofit and voluntary organizations throughout the country, except in Alberta, the territories andNew Brunswick, where such organizations rely more on earned income from non-government sources (Table 2.9).
Apart from revenues coming from government, the most important source for organizations in each of the provinces andthe territories is earned income from non-government sources, mainly in the form of fees for goods and services. Giftsand donations, mainly in the form of individual donations, are most important in Prince Edward Island and Nova Scotia(18%), Alberta (16%), Ontario (15%) and British Columbia (15%).
Summary
Nonprofit and voluntary organizations have an important economic presence. Generally, a small number of largeorganizations such as Hospitals and Universities and colleges account for disproportionately large percentages of totalrevenues. In contrast, the more numerous organizations working in Sports and recreation and Religion account for onlya small fraction of total revenues. Governments, particularly provincial governments, are the largest source of funding fornonprofit and voluntary organizations. Earned income from non-government sources is the second largest source ofrevenue. Government funding accounts for a larger percentage of total revenues for large organizations such as Hospitalsthan it does for smaller organizations such as those in Sports and recreation and Religion. Conversely, gifts and donationsare a larger source of revenues for small organizations—most of their revenues come from donations made by individualCanadians. Registered charities generally have larger revenues than organizations that are not registered as charities.

Statistics Canada – Catalogue No. 61-533 31
Cornerstones of Community: Highlights of the National Survey of Nonprofit and Voluntary Organizations
Table 2.9Sources of revenue of nonprofit and voluntary organizations, by province or territory, Canada, 2003
Newfoundland Princeand Edward Nova New British
Source of revenue Labrador Island Scotia Brunswick Quebec Ontario Manitoba Saskatchewan Alberta Columbia Territories Canada
% of each source
Revenues from governmentPayments for goods and services 13 10 28 32 9 21 17 18 18 21 7 18Grants and contributions 39 42 19 8 51 24 37 37
E14 28 28 31
Total revenues from government 52 52 47 41 60 45 54 56 33 49 35 49
Earned incomeCharitable gaming 2 3 2 1 0 1 1 5 3 1 1 1Membership fees 8 6 9 7 8 13 11 7 12 8 1 11Fees for goods or services 19 14 18 26 16 19 15 18 31 20 57 20Investment income (including interest) 2 2 3 19 3 3 8 1 3 2 1 4
Total earned income fromnon-governmental sources 31 25 32 52 28 36 34 31 49 31 60 35
Gifts and donationsIndividual donations 7 14 13 4 3 9 7 8 10 10 1 8Fundraising organizations and family
community foundations 0 1 1 0 1 1 1 0 1 1 0 1Disbursements from other nonprofit
organizations 6 1 3 1 2 2 1 1 2 2 3 2Corporate sponsorships, donations
or grants 1 2 2 0 2 3 1 1 4 2 0 3Total gifts and donations 14 18 18 6 8 15 10 10 16 15 4 13Total other income 2 4 3 2 4 4 2 3 2 5 1 3
Note: Percentages may not add to subtotals due to rounding.Source: Statistics Canada, National Survey of Nonprofit and Voluntary Organizations.
Most organizations report that their revenues have either increased or remained the same between 2000 and 2003.Hospitals are more likely than other types of organizations to report rising revenues; International, Grant-making, fundraisingand voluntarism promotion, and Health organizations are most likely to report declining revenues. Larger organizationsare much more likely than smaller organizations to report that revenues have increased; smaller organizations are morelikely to report decreased revenues.
In-kind donations appear to be a particularly important source of support for smaller organizations.
Relative to their numbers, Ontario-based organizations receive a greater share of total revenues than do those locatedelsewhere. Quebec-based organizations have proportionately lower revenues. Organizations in the territories and Ontariohave the largest average revenues while those in Prince Edward Island and Nova Scotia have the smallest. Contrary tothe pattern elsewhere, organizations in the territories, New Brunswick and Alberta rely most on revenues from earnedincome from non-government sources as opposed to revenues from government sources.

32 Statistics Canada – Catalogue No. 61-533
Cornerstones of Community: Highlights of the National Survey of Nonprofit and Voluntary Organizations
Human resources
Introduction
Many nonprofit and voluntary organizations consider their volunteers and paid staff to be one of their greatest strengths,1and the NSNVO demonstrates how important both are. Virtually all nonprofit and voluntary organizations rely on volunteersto some degree, and more than half rely solely on volunteers to fulfill their mission.2 Many Canadians volunteer for morethan one organization. As a result, nonprofit and voluntary organizations report a combined volunteer complement ofover 19 million3 that contribute more than 2 billion hours of volunteer time,4 or the equivalent of more than 1 million full-time jobs.5 From the perspective of an individual organization, this represents an average of 14,492 hours, or 7.5 full-timejobs per year.
Although just under half of all organizations have paid employees, these organizations employ a total of 2 million people.6One-third of these people are employed by Hospitals and Universities and colleges, which make up less than 1% of allorganizations.
How much do organizations rely on volunteers?
Volunteers serve a variety of functions in nonprofit and voluntary organizations. Ninety-three percent of volunteers areengaged exclusively in activities such as delivering, or helping to deliver, programs and services and engaging in fundraisingand campaigning activities. Collectively, these volunteers account for 91% of volunteer hours. While 31% of these volunteersgive their time only once or twice a year, for example, to do campaigning or fundraising, 69% are more frequentlyengaged by the organizations for which they volunteer.
The remaining 7% of volunteers are engaged in governance, serving on the organization’s board of directors.7 In fact, for20% of organizations, all of their volunteers are involved in governance activities. Collectively, volunteers involved ingovernance account for 9% of all volunteer hours.
Although nearly all organizations make use of volunteers, most volunteers are concentrated among a relatively smallnumber of organizations: 73% are engaged by the 6% of organizations that have volunteer complements of 200 or more(Table 3.1).
Sports and recreation organizations account for 28% of all volunteers and 23% of total volunteer hours (Table 3.2),although these organizations account for only 21% of nonprofit and voluntary organizations. In contrast, Religionorganizations account for 11% of volunteers and 12% of volunteer hours, but make up 19% of nonprofit and voluntaryorganizations.
1. M.H. Hall et al., 2003, The Capacity to Serve: A Qualitative Study of the Challenges Facing Canada’s Nonprofit and Voluntary Organizations,Toronto, Canadian Centre for Philanthropy.
2. For the purposes of this report, volunteers include volunteer board members, unless otherwise specified.3. Because people may volunteer with more than one organization, the number of volunteers that organizations engage exceeds the number of
volunteers in the population. The National Survey of Giving, Volunteering and Participating estimates that 6.5 million Canadians volunteer overthe course of a year (M.H. Hall, L. McKeown and K. Roberts, 2001, Caring Canadians, Involved Canadians: Highlights from the 2000 NationalSurvey of Giving, Volunteering and Participating, Catalogue no. 71-542-XPE, Ottawa, Statistics Canada.).
4. This estimate is based on the total number of volunteer hours that organizations reported receiving. It should be noted that The NationalSurvey of Giving, Volunteering and Participating (see reference in note 3 above) estimates that Canadians volunteered a total of 1.1 billionhours in 2000.
5. Full-time equivalencies were calculated using a 40-hour work week and 48 work weeks per year.6. This includes 884,129 part-time employees. Some employees may work for more than one organization.7. Volunteer board members may also contribute to their organizations in activities other than governance.
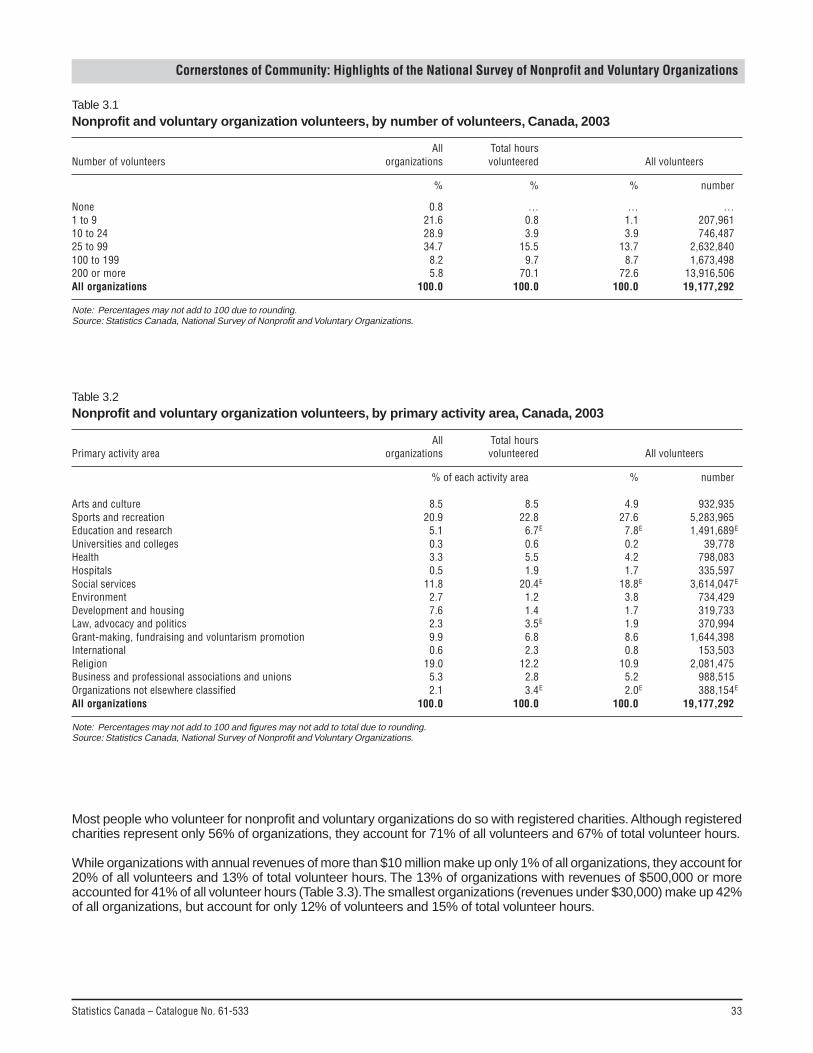
Statistics Canada – Catalogue No. 61-533 33
Cornerstones of Community: Highlights of the National Survey of Nonprofit and Voluntary Organizations
Table 3.1Nonprofit and voluntary organization volunteers, by number of volunteers, Canada, 2003
All Total hoursNumber of volunteers organizations volunteered All volunteers
% % % number
None 0.8 … … …1 to 9 21.6 0.8 1.1 207,96110 to 24 28.9 3.9 3.9 746,48725 to 99 34.7 15.5 13.7 2,632,840100 to 199 8.2 9.7 8.7 1,673,498200 or more 5.8 70.1 72.6 13,916,506All organizations 100.0 100.0 100.0 19,177,292
Note: Percentages may not add to 100 due to rounding.Source: Statistics Canada, National Survey of Nonprofit and Voluntary Organizations.
Table 3.2Nonprofit and voluntary organization volunteers, by primary activity area, Canada, 2003
All Total hoursPrimary activity area organizations volunteered All volunteers
% of each activity area % number
Arts and culture 8.5 8.5 4.9 932,935Sports and recreation 20.9 22.8 27.6 5,283,965Education and research 5.1 6.7E 7.8E 1,491,689E
Universities and colleges 0.3 0.6 0.2 39,778Health 3.3 5.5 4.2 798,083Hospitals 0.5 1.9 1.7 335,597Social services 11.8 20.4E 18.8E 3,614,047E
Environment 2.7 1.2 3.8 734,429Development and housing 7.6 1.4 1.7 319,733Law, advocacy and politics 2.3 3.5E 1.9 370,994Grant-making, fundraising and voluntarism promotion 9.9 6.8 8.6 1,644,398International 0.6 2.3 0.8 153,503Religion 19.0 12.2 10.9 2,081,475Business and professional associations and unions 5.3 2.8 5.2 988,515Organizations not elsewhere classified 2.1 3.4E 2.0E 388,154E
All organizations 100.0 100.0 100.0 19,177,292
Note: Percentages may not add to 100 and figures may not add to total due to rounding.Source: Statistics Canada, National Survey of Nonprofit and Voluntary Organizations.
Most people who volunteer for nonprofit and voluntary organizations do so with registered charities. Although registeredcharities represent only 56% of organizations, they account for 71% of all volunteers and 67% of total volunteer hours.
While organizations with annual revenues of more than $10 million make up only 1% of all organizations, they account for20% of all volunteers and 13% of total volunteer hours. The 13% of organizations with revenues of $500,000 or moreaccounted for 41% of all volunteer hours (Table 3.3). The smallest organizations (revenues under $30,000) make up 42%of all organizations, but account for only 12% of volunteers and 15% of total volunteer hours.

34 Statistics Canada – Catalogue No. 61-533
Cornerstones of Community: Highlights of the National Survey of Nonprofit and Voluntary Organizations
How have volunteer levels changed between 2000 and 2003?
Most organizations (54%) report little change in their number of volunteers8 from 2000 to 2003 (Table 3.4): 28% report anincrease, and 18% report a decline. Organizations with large volunteer complements (100 volunteers or more) are themost likely to report an increase in the number of volunteers.
Table 3.3Nonprofit and voluntary organization volunteers, by annual revenues, Canada, 2003
All Total hoursAnnual revenues organizations volunteered All volunteers
% of each revenue category % number
Less than $30,000 41.5 14.5 11.7 2,244,583$30,000 to $99,999 21.3 11.0 10.4 1,996,220$100,000 to $249,999 16.3 23.6E 26.4E 5,069,313E
$250,000 to $499,999 8.3 10.1 11.5 2,197,432$500,000 to $999,999 5.3 7.9 6.0 1,148,298$1,000,000 to $9,999,999 6.3 19.9 13.7 2,632,233$10,000,000 or more 0.9 13.1 20.3 3,889,213All organizations 100.0 100.0 100.0 19,177,292
Note: Percentages may not add to 100 due to rounding.Source: Statistics Canada, National Survey of Nonprofit and Voluntary Organizations.
Table 3.4Reported change in number of volunteers for nonprofit and voluntary organizations,1 by number ofvolunteers, Canada, 2000 to 2003
Reported change in number of volunteers over the last three years
RemainedNumber of volunteers Increased about the same Decreased
%
1 to 9 9 70 2010 to 24 20 60 2025 to 99 31 51 17100 to 199 39 45 15200 or more 37 48 15All organizations 28 54 18
Note: Rows may not add to 100% due to rounding.1. These figures apply only to the 64% of organizations that were incorporated, that had been in operation for at least three years, and that had volunteers (excluding
those involved in governance).Source: Statistics Canada, National Survey of Nonprofit and Voluntary Organizations.
Sports and recreation organizations, which account for 28% of all volunteers, are most likely to report a decline involunteers between 2000 and 2003 (Table 3.5). In contrast, 45% of International, 34% of Social services and 33% of Artsand culture organizations report higher numbers of volunteers.
8. These figures apply only to the 64% of organizations that were incorporated, that had been in operation for at least three years, and that hadvolunteers (excluding those involved in governance).
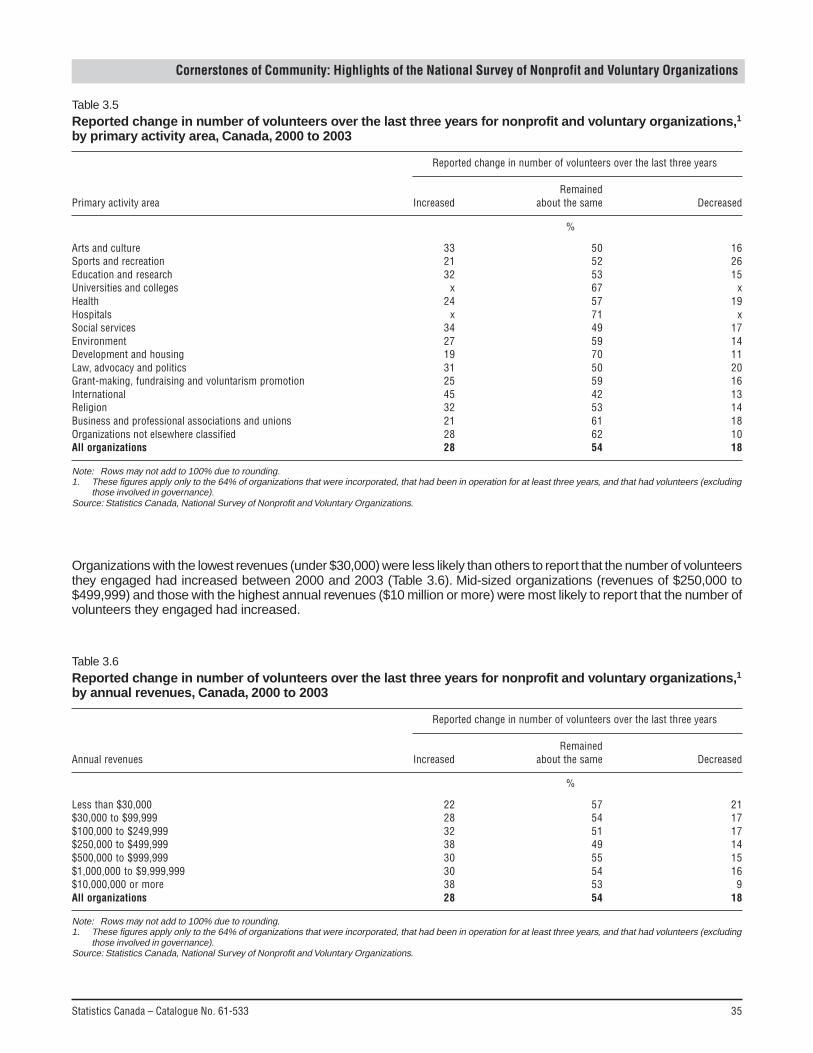
Statistics Canada – Catalogue No. 61-533 35
Cornerstones of Community: Highlights of the National Survey of Nonprofit and Voluntary Organizations
Organizations with the lowest revenues (under $30,000) were less likely than others to report that the number of volunteersthey engaged had increased between 2000 and 2003 (Table 3.6). Mid-sized organizations (revenues of $250,000 to$499,999) and those with the highest annual revenues ($10 million or more) were most likely to report that the number ofvolunteers they engaged had increased.
Table 3.5Reported change in number of volunteers over the last three years for nonprofit and voluntary organizations,1by primary activity area, Canada, 2000 to 2003
Reported change in number of volunteers over the last three years
RemainedPrimary activity area Increased about the same Decreased
%
Arts and culture 33 50 16Sports and recreation 21 52 26Education and research 32 53 15Universities and colleges x 67 xHealth 24 57 19Hospitals x 71 xSocial services 34 49 17Environment 27 59 14Development and housing 19 70 11Law, advocacy and politics 31 50 20Grant-making, fundraising and voluntarism promotion 25 59 16International 45 42 13Religion 32 53 14Business and professional associations and unions 21 61 18Organizations not elsewhere classified 28 62 10All organizations 28 54 18
Note: Rows may not add to 100% due to rounding.1. These figures apply only to the 64% of organizations that were incorporated, that had been in operation for at least three years, and that had volunteers (excluding
those involved in governance).Source: Statistics Canada, National Survey of Nonprofit and Voluntary Organizations.
Table 3.6Reported change in number of volunteers over the last three years for nonprofit and voluntary organizations,1by annual revenues, Canada, 2000 to 2003
Reported change in number of volunteers over the last three years
RemainedAnnual revenues Increased about the same Decreased
%
Less than $30,000 22 57 21$30,000 to $99,999 28 54 17$100,000 to $249,999 32 51 17$250,000 to $499,999 38 49 14$500,000 to $999,999 30 55 15$1,000,000 to $9,999,999 30 54 16$10,000,000 or more 38 53 9All organizations 28 54 18
Note: Rows may not add to 100% due to rounding.1. These figures apply only to the 64% of organizations that were incorporated, that had been in operation for at least three years, and that had volunteers (excluding
those involved in governance).Source: Statistics Canada, National Survey of Nonprofit and Voluntary Organizations.
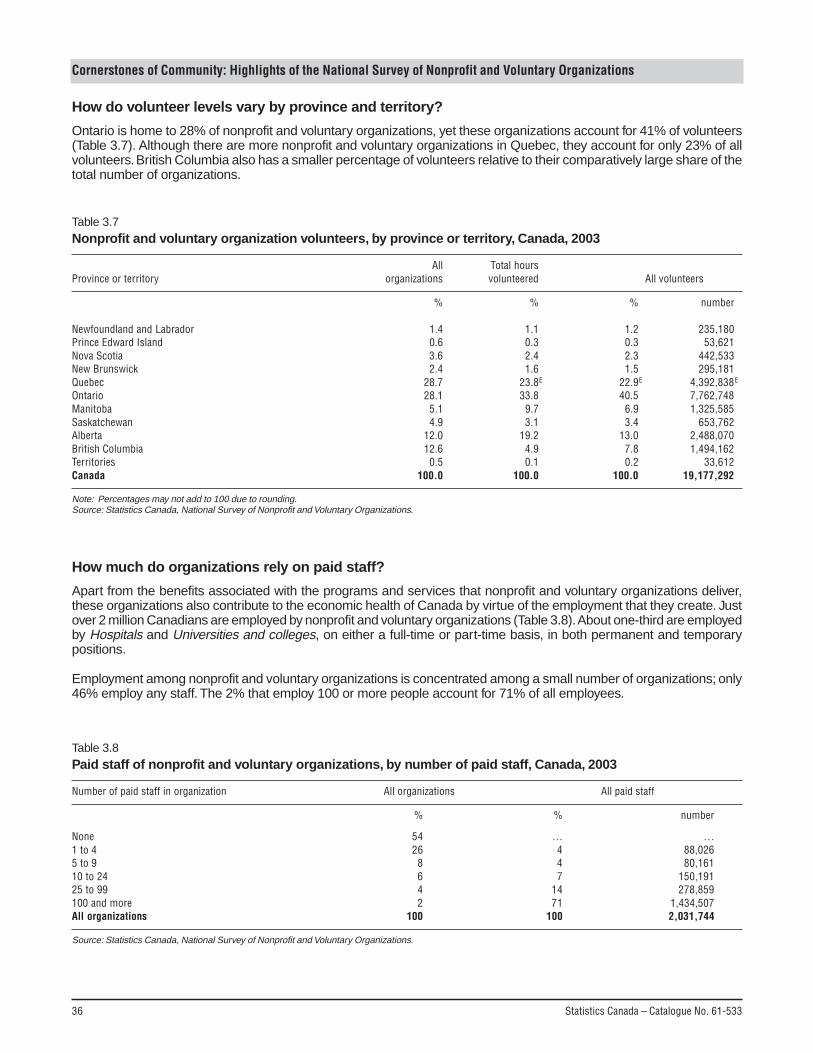
36 Statistics Canada – Catalogue No. 61-533
Cornerstones of Community: Highlights of the National Survey of Nonprofit and Voluntary Organizations
How do volunteer levels vary by province and territory?
Ontario is home to 28% of nonprofit and voluntary organizations, yet these organizations account for 41% of volunteers(Table 3.7). Although there are more nonprofit and voluntary organizations in Quebec, they account for only 23% of allvolunteers. British Columbia also has a smaller percentage of volunteers relative to their comparatively large share of thetotal number of organizations.
Table 3.7Nonprofit and voluntary organization volunteers, by province or territory, Canada, 2003
All Total hoursProvince or territory organizations volunteered All volunteers
% % % number
Newfoundland and Labrador 1.4 1.1 1.2 235,180Prince Edward Island 0.6 0.3 0.3 53,621Nova Scotia 3.6 2.4 2.3 442,533New Brunswick 2.4 1.6 1.5 295,181Quebec 28.7 23.8E 22.9E 4,392,838E
Ontario 28.1 33.8 40.5 7,762,748Manitoba 5.1 9.7 6.9 1,325,585Saskatchewan 4.9 3.1 3.4 653,762Alberta 12.0 19.2 13.0 2,488,070British Columbia 12.6 4.9 7.8 1,494,162Territories 0.5 0.1 0.2 33,612Canada 100.0 100.0 100.0 19,177,292
Note: Percentages may not add to 100 due to rounding.Source: Statistics Canada, National Survey of Nonprofit and Voluntary Organizations.
How much do organizations rely on paid staff?
Apart from the benefits associated with the programs and services that nonprofit and voluntary organizations deliver,these organizations also contribute to the economic health of Canada by virtue of the employment that they create. Justover 2 million Canadians are employed by nonprofit and voluntary organizations (Table 3.8). About one-third are employedby Hospitals and Universities and colleges, on either a full-time or part-time basis, in both permanent and temporarypositions.
Employment among nonprofit and voluntary organizations is concentrated among a small number of organizations; only46% employ any staff. The 2% that employ 100 or more people account for 71% of all employees.
Table 3.8Paid staff of nonprofit and voluntary organizations, by number of paid staff, Canada, 2003
Number of paid staff in organization All organizations All paid staff
% % number
None 54 … …1 to 4 26 4 88,0265 to 9 8 4 80,16110 to 24 6 7 150,19125 to 99 4 14 278,859100 and more 2 71 1,434,507All organizations 100 100 2,031,744
Source: Statistics Canada, National Survey of Nonprofit and Voluntary Organizations.
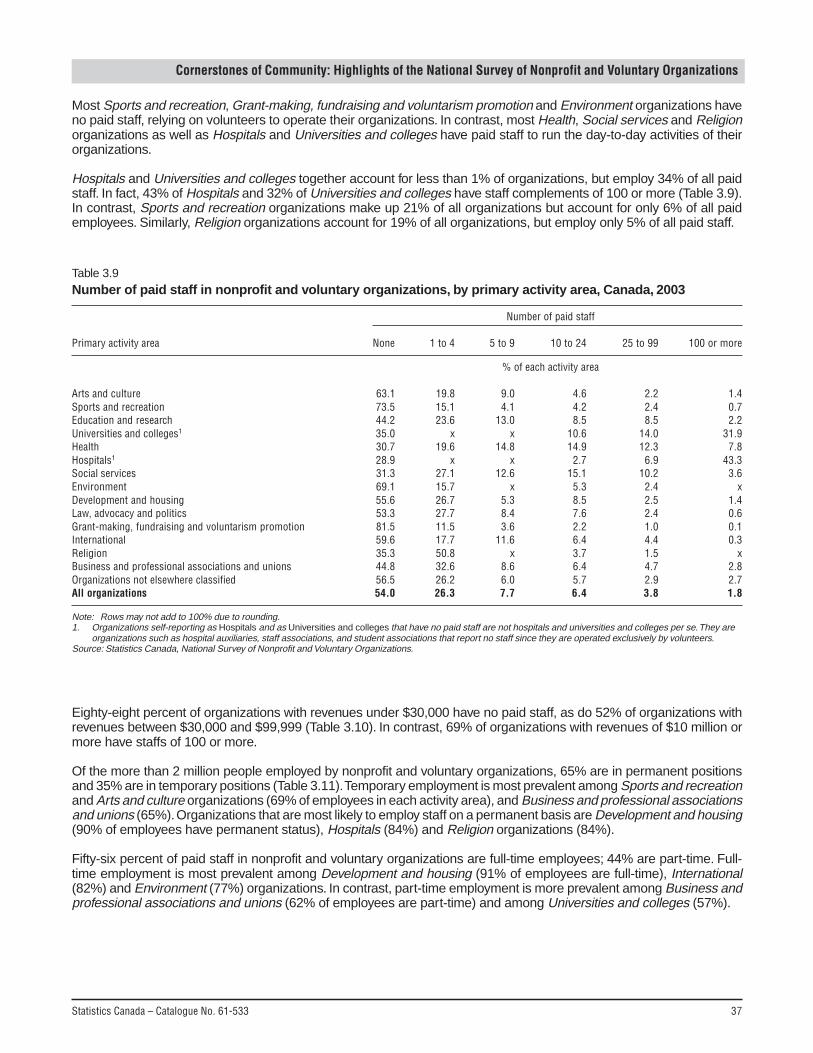
Statistics Canada – Catalogue No. 61-533 37
Cornerstones of Community: Highlights of the National Survey of Nonprofit and Voluntary Organizations
Most Sports and recreation, Grant-making, fundraising and voluntarism promotion and Environment organizations haveno paid staff, relying on volunteers to operate their organizations. In contrast, most Health, Social services and Religionorganizations as well as Hospitals and Universities and colleges have paid staff to run the day-to-day activities of theirorganizations.
Hospitals and Universities and colleges together account for less than 1% of organizations, but employ 34% of all paidstaff. In fact, 43% of Hospitals and 32% of Universities and colleges have staff complements of 100 or more (Table 3.9).In contrast, Sports and recreation organizations make up 21% of all organizations but account for only 6% of all paidemployees. Similarly, Religion organizations account for 19% of all organizations, but employ only 5% of all paid staff.
Table 3.9Number of paid staff in nonprofit and voluntary organizations, by primary activity area, Canada, 2003
Number of paid staff
Primary activity area None 1 to 4 5 to 9 10 to 24 25 to 99 100 or more
% of each activity area
Arts and culture 63.1 19.8 9.0 4.6 2.2 1.4Sports and recreation 73.5 15.1 4.1 4.2 2.4 0.7Education and research 44.2 23.6 13.0 8.5 8.5 2.2Universities and colleges1 35.0 x x 10.6 14.0 31.9Health 30.7 19.6 14.8 14.9 12.3 7.8Hospitals1 28.9 x x 2.7 6.9 43.3Social services 31.3 27.1 12.6 15.1 10.2 3.6Environment 69.1 15.7 x 5.3 2.4 xDevelopment and housing 55.6 26.7 5.3 8.5 2.5 1.4Law, advocacy and politics 53.3 27.7 8.4 7.6 2.4 0.6Grant-making, fundraising and voluntarism promotion 81.5 11.5 3.6 2.2 1.0 0.1International 59.6 17.7 11.6 6.4 4.4 0.3Religion 35.3 50.8 x 3.7 1.5 xBusiness and professional associations and unions 44.8 32.6 8.6 6.4 4.7 2.8Organizations not elsewhere classified 56.5 26.2 6.0 5.7 2.9 2.7All organizations 54.0 26.3 7.7 6.4 3.8 1.8
Note: Rows may not add to 100% due to rounding.1. Organizations self-reporting as Hospitals and as Universities and colleges that have no paid staff are not hospitals and universities and colleges per se. They are
organizations such as hospital auxiliaries, staff associations, and student associations that report no staff since they are operated exclusively by volunteers.Source: Statistics Canada, National Survey of Nonprofit and Voluntary Organizations.
Eighty-eight percent of organizations with revenues under $30,000 have no paid staff, as do 52% of organizations withrevenues between $30,000 and $99,999 (Table 3.10). In contrast, 69% of organizations with revenues of $10 million ormore have staffs of 100 or more.
Of the more than 2 million people employed by nonprofit and voluntary organizations, 65% are in permanent positionsand 35% are in temporary positions (Table 3.11). Temporary employment is most prevalent among Sports and recreationand Arts and culture organizations (69% of employees in each activity area), and Business and professional associationsand unions (65%). Organizations that are most likely to employ staff on a permanent basis are Development and housing(90% of employees have permanent status), Hospitals (84%) and Religion organizations (84%).
Fifty-six percent of paid staff in nonprofit and voluntary organizations are full-time employees; 44% are part-time. Full-time employment is most prevalent among Development and housing (91% of employees are full-time), International(82%) and Environment (77%) organizations. In contrast, part-time employment is more prevalent among Business andprofessional associations and unions (62% of employees are part-time) and among Universities and colleges (57%).

38 Statistics Canada – Catalogue No. 61-533
Cornerstones of Community: Highlights of the National Survey of Nonprofit and Voluntary Organizations
Given the high concentration of revenues among a small number of nonprofit and voluntary organizations, it is notsurprising that employment is similarly concentrated. The organizations with revenues of $10 million or more account for46% of employees (Table 3.12). Organizations with revenues of $1 million to $10 million account for another 28% ofemployees.
Table 3.10Number of paid staff in nonprofit and voluntary organizations, by annual revenues area, Canada, 2003
Number of paid staff
Annual revenues None 1 to 4 5 to 9 10 to 24 25 to 99 100 or more
% of each revenue category
Less than $30,000 88.0 10.8 0.6 0.4 x x$30,000 to $99,999 51.9 42.0 4.1 1.5 x x$100,000 to $249,999 26.7 50.9 15.5 6.2 x x$250,000 to $499,999 13.0 33.5 27.2 21.0 x x$500,000 to $999,999 9.8 19.2 20.8 33.0 16.5 0.6$1,000,000 to $9,999,999 5.6 12.0 10.4 21.3 34.3 16.4$10,000,000 or more 5.7 1.9 2.0 7.1 14.6 68.7All organizations 54.0 26.3 7.7 6.4 3.8 1.8
Note: Rows may not add to 100% due to rounding.Source: Statistics Canada, National Survey of Nonprofit and Voluntary Organizations.
Table 3.11Nonprofit and voluntary organization paid staff, by primary activity area, Canada 2003
Paid staff
AllPrimary activity area organizations All paid staff Permanent Temporary Full-time Part-time
% % number % of all paid staff
Arts and culture 8.5 3.6 72,798 31.4 68.6 56.4 43.6Sports and recreation 20.9 6.4 130,913 30.8 69.2 49.8 50.2Education and research 5.1 5.0 100,591 56.1 43.9 57.3 42.7Universities and colleges 0.3 10.5 212,596 41.5 58.5 43.5 56.5Health 3.3 9.5 192,798 76.2 23.8 57.7 42.3Hospitals 0.5 23.8 483,159 83.9 16.1 51.4 48.6Social services 11.8 14.6 297,250 65.0 35.0 57.1 42.9Environment 2.7 0.7 14,848 50.9 49.1 76.7 23.3Development and housing 7.6 9.0E 182,337E 89.6E 10.4 91.2E 8.8Law, advocacy and politics 2.3 0.8 15,915 54.3 45.7 59.4 40.6Grant-making, fundraising and voluntarism promotion 9.9 1.4 28,642 66.4 33.6 60.3 39.7International 0.6 0.3 5,081 77.2 22.8 81.7 18.3Religion 19.0 5.4E 109,307E 83.8E 16.2 64.5E 35.5E
Business and professional associations and unions 5.3 7.4E 150,226E 34.9 65.1E 38.1 61.9E
Organizations not elsewhere classified 2.1 1.7 35,282 59.5 40.5 73.2 26.8All organizations 100.0 100.0 2,031,744 65.0 35.0 56.5 43.5
Note: Figures may not add to totals and percentages may not add to 100 due to rounding.Source: Statistics Canada, National Survey of Nonprofit and Voluntary Organizations.
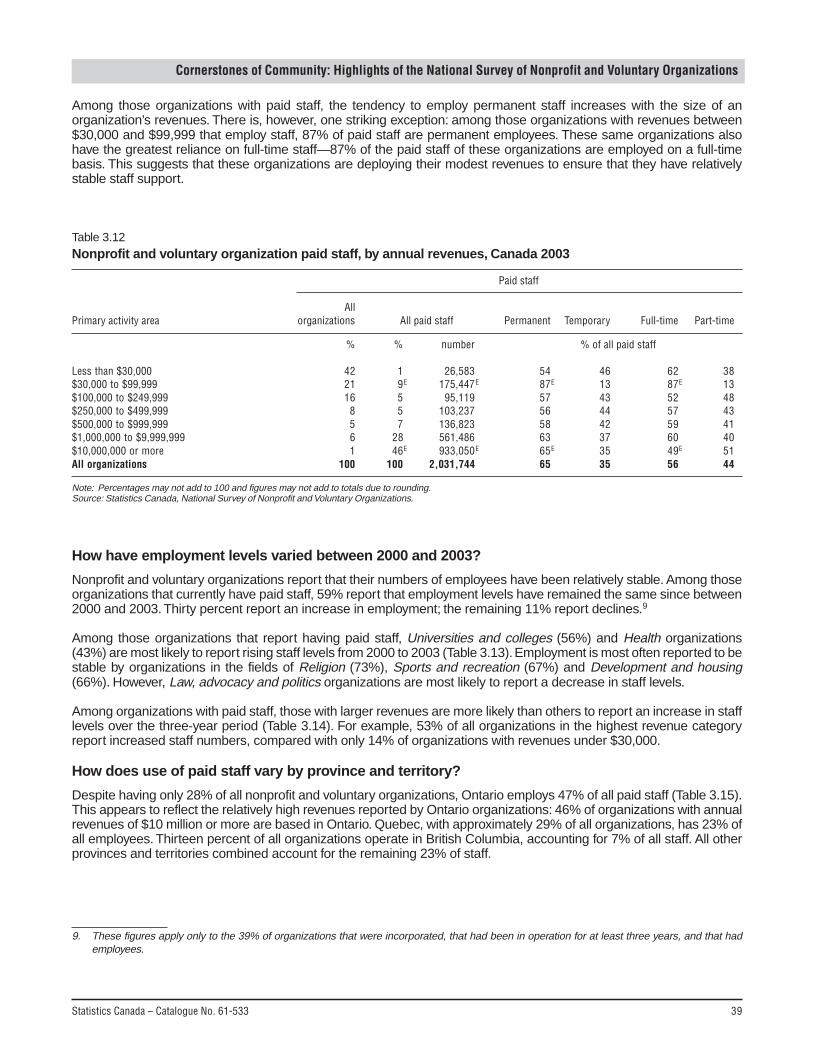
Statistics Canada – Catalogue No. 61-533 39
Cornerstones of Community: Highlights of the National Survey of Nonprofit and Voluntary Organizations
Among those organizations with paid staff, the tendency to employ permanent staff increases with the size of anorganization’s revenues. There is, however, one striking exception: among those organizations with revenues between$30,000 and $99,999 that employ staff, 87% of paid staff are permanent employees. These same organizations alsohave the greatest reliance on full-time staff—87% of the paid staff of these organizations are employed on a full-timebasis. This suggests that these organizations are deploying their modest revenues to ensure that they have relativelystable staff support.
Table 3.12Nonprofit and voluntary organization paid staff, by annual revenues, Canada 2003
Paid staff
AllPrimary activity area organizations All paid staff Permanent Temporary Full-time Part-time
% % number % of all paid staff
Less than $30,000 42 1 26,583 54 46 62 38$30,000 to $99,999 21 9E 175,447E 87E 13 87E 13$100,000 to $249,999 16 5 95,119 57 43 52 48$250,000 to $499,999 8 5 103,237 56 44 57 43$500,000 to $999,999 5 7 136,823 58 42 59 41$1,000,000 to $9,999,999 6 28 561,486 63 37 60 40$10,000,000 or more 1 46E 933,050E 65E 35 49E 51All organizations 100 100 2,031,744 65 35 56 44
Note: Percentages may not add to 100 and figures may not add to totals due to rounding.Source: Statistics Canada, National Survey of Nonprofit and Voluntary Organizations.
9. These figures apply only to the 39% of organizations that were incorporated, that had been in operation for at least three years, and that hademployees.
How have employment levels varied between 2000 and 2003?
Nonprofit and voluntary organizations report that their numbers of employees have been relatively stable. Among thoseorganizations that currently have paid staff, 59% report that employment levels have remained the same since between2000 and 2003. Thirty percent report an increase in employment; the remaining 11% report declines.9
Among those organizations that report having paid staff, Universities and colleges (56%) and Health organizations(43%) are most likely to report rising staff levels from 2000 to 2003 (Table 3.13). Employment is most often reported to bestable by organizations in the fields of Religion (73%), Sports and recreation (67%) and Development and housing(66%). However, Law, advocacy and politics organizations are most likely to report a decrease in staff levels.
Among organizations with paid staff, those with larger revenues are more likely than others to report an increase in stafflevels over the three-year period (Table 3.14). For example, 53% of all organizations in the highest revenue categoryreport increased staff numbers, compared with only 14% of organizations with revenues under $30,000.
How does use of paid staff vary by province and territory?
Despite having only 28% of all nonprofit and voluntary organizations, Ontario employs 47% of all paid staff (Table 3.15).This appears to reflect the relatively high revenues reported by Ontario organizations: 46% of organizations with annualrevenues of $10 million or more are based in Ontario. Quebec, with approximately 29% of all organizations, has 23% ofall employees. Thirteen percent of all organizations operate in British Columbia, accounting for 7% of all staff. All otherprovinces and territories combined account for the remaining 23% of staff.
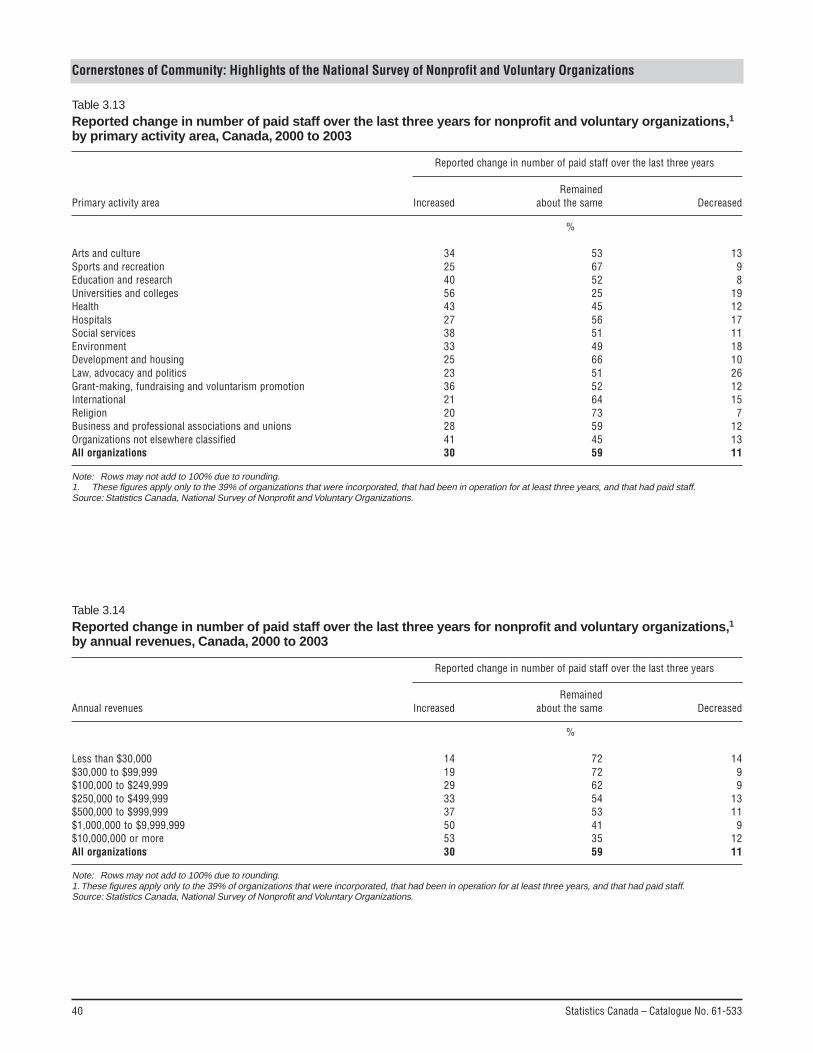
40 Statistics Canada – Catalogue No. 61-533
Cornerstones of Community: Highlights of the National Survey of Nonprofit and Voluntary Organizations
Table 3.13Reported change in number of paid staff over the last three years for nonprofit and voluntary organizations,1by primary activity area, Canada, 2000 to 2003
Reported change in number of paid staff over the last three years
RemainedPrimary activity area Increased about the same Decreased
%
Arts and culture 34 53 13Sports and recreation 25 67 9Education and research 40 52 8Universities and colleges 56 25 19Health 43 45 12Hospitals 27 56 17Social services 38 51 11Environment 33 49 18Development and housing 25 66 10Law, advocacy and politics 23 51 26Grant-making, fundraising and voluntarism promotion 36 52 12International 21 64 15Religion 20 73 7Business and professional associations and unions 28 59 12Organizations not elsewhere classified 41 45 13All organizations 30 59 11
Note: Rows may not add to 100% due to rounding.1. These figures apply only to the 39% of organizations that were incorporated, that had been in operation for at least three years, and that had paid staff.Source: Statistics Canada, National Survey of Nonprofit and Voluntary Organizations.
Table 3.14Reported change in number of paid staff over the last three years for nonprofit and voluntary organizations,1by annual revenues, Canada, 2000 to 2003
Reported change in number of paid staff over the last three years
RemainedAnnual revenues Increased about the same Decreased
%
Less than $30,000 14 72 14$30,000 to $99,999 19 72 9$100,000 to $249,999 29 62 9$250,000 to $499,999 33 54 13$500,000 to $999,999 37 53 11$1,000,000 to $9,999,999 50 41 9$10,000,000 or more 53 35 12All organizations 30 59 11
Note: Rows may not add to 100% due to rounding.1. These figures apply only to the 39% of organizations that were incorporated, that had been in operation for at least three years, and that had paid staff.Source: Statistics Canada, National Survey of Nonprofit and Voluntary Organizations.
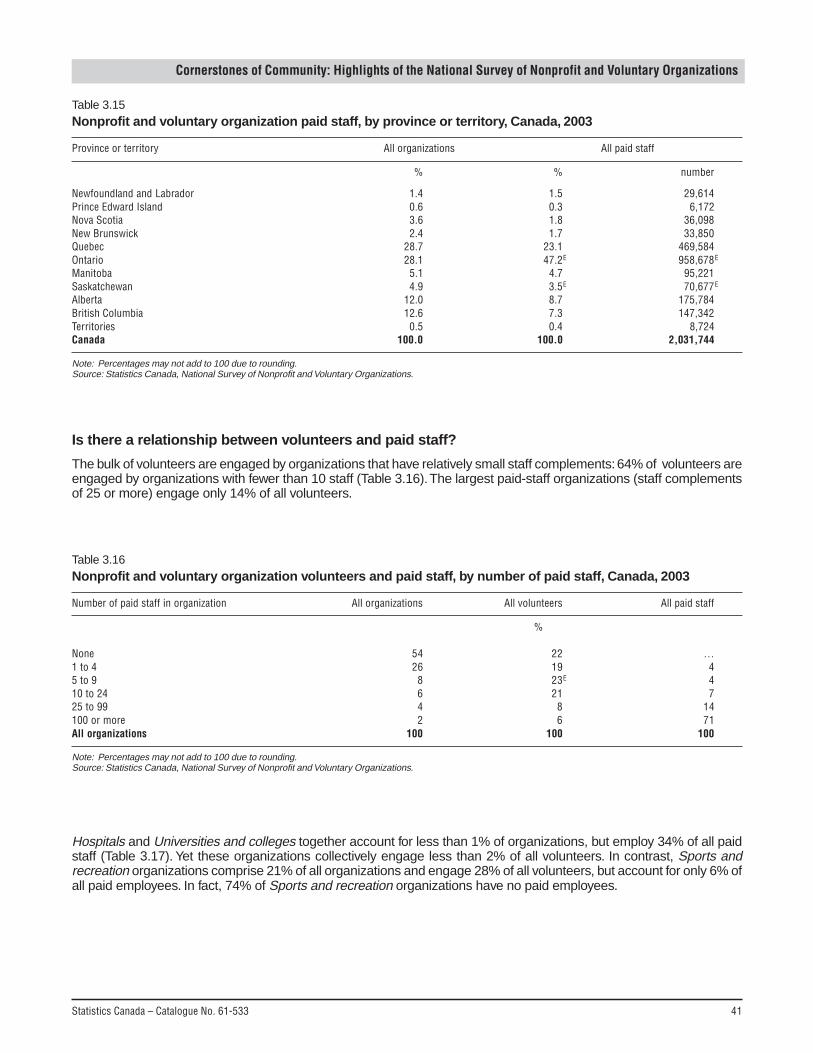
Statistics Canada – Catalogue No. 61-533 41
Cornerstones of Community: Highlights of the National Survey of Nonprofit and Voluntary Organizations
Is there a relationship between volunteers and paid staff?
The bulk of volunteers are engaged by organizations that have relatively small staff complements: 64% of volunteers areengaged by organizations with fewer than 10 staff (Table 3.16). The largest paid-staff organizations (staff complementsof 25 or more) engage only 14% of all volunteers.
Table 3.15Nonprofit and voluntary organization paid staff, by province or territory, Canada, 2003
Province or territory All organizations All paid staff
% % number
Newfoundland and Labrador 1.4 1.5 29,614Prince Edward Island 0.6 0.3 6,172Nova Scotia 3.6 1.8 36,098New Brunswick 2.4 1.7 33,850Quebec 28.7 23.1 469,584Ontario 28.1 47.2E 958,678E
Manitoba 5.1 4.7 95,221Saskatchewan 4.9 3.5E 70,677E
Alberta 12.0 8.7 175,784British Columbia 12.6 7.3 147,342Territories 0.5 0.4 8,724Canada 100.0 100.0 2,031,744
Note: Percentages may not add to 100 due to rounding.Source: Statistics Canada, National Survey of Nonprofit and Voluntary Organizations.
Table 3.16Nonprofit and voluntary organization volunteers and paid staff, by number of paid staff, Canada, 2003
Number of paid staff in organization All organizations All volunteers All paid staff
%
None 54 22 …1 to 4 26 19 45 to 9 8 23E 410 to 24 6 21 725 to 99 4 8 14100 or more 2 6 71All organizations 100 100 100
Note: Percentages may not add to 100 due to rounding.Source: Statistics Canada, National Survey of Nonprofit and Voluntary Organizations.
Hospitals and Universities and colleges together account for less than 1% of organizations, but employ 34% of all paidstaff (Table 3.17). Yet these organizations collectively engage less than 2% of all volunteers. In contrast, Sports andrecreation organizations comprise 21% of all organizations and engage 28% of all volunteers, but account for only 6% ofall paid employees. In fact, 74% of Sports and recreation organizations have no paid employees.
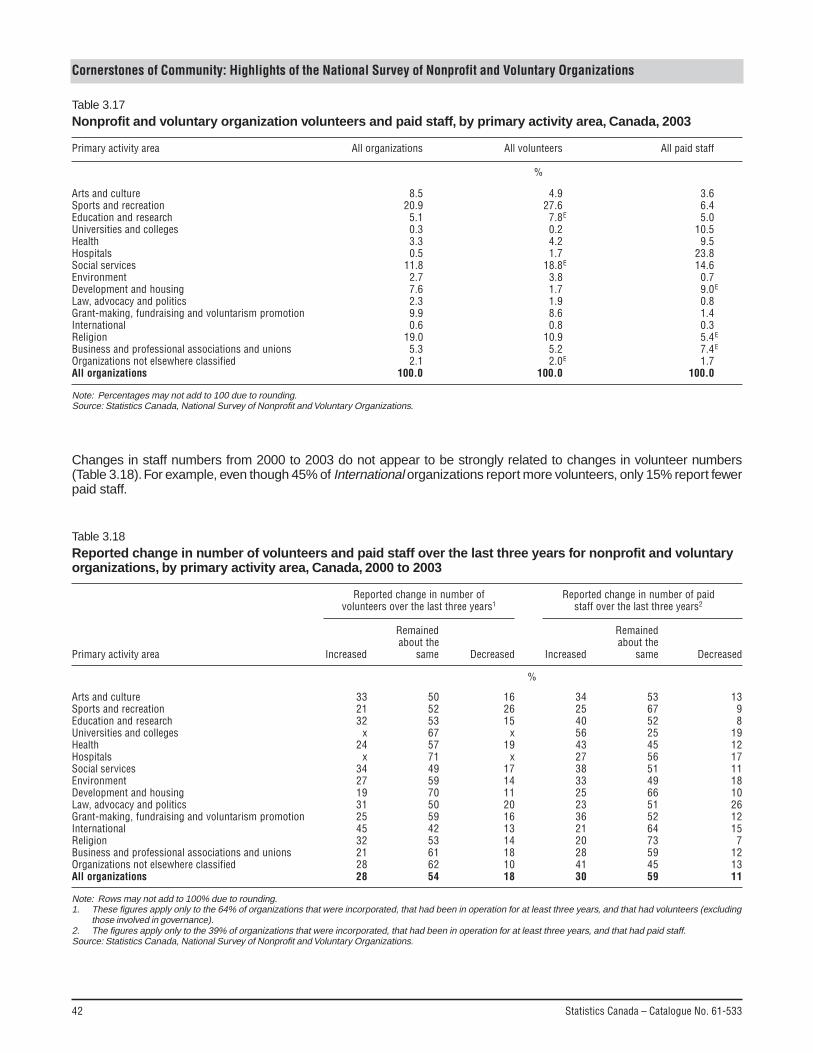
42 Statistics Canada – Catalogue No. 61-533
Cornerstones of Community: Highlights of the National Survey of Nonprofit and Voluntary Organizations
Changes in staff numbers from 2000 to 2003 do not appear to be strongly related to changes in volunteer numbers(Table 3.18). For example, even though 45% of International organizations report more volunteers, only 15% report fewerpaid staff.
Table 3.17Nonprofit and voluntary organization volunteers and paid staff, by primary activity area, Canada, 2003
Primary activity area All organizations All volunteers All paid staff
%
Arts and culture 8.5 4.9 3.6Sports and recreation 20.9 27.6 6.4Education and research 5.1 7.8E 5.0Universities and colleges 0.3 0.2 10.5Health 3.3 4.2 9.5Hospitals 0.5 1.7 23.8Social services 11.8 18.8E 14.6Environment 2.7 3.8 0.7Development and housing 7.6 1.7 9.0E
Law, advocacy and politics 2.3 1.9 0.8Grant-making, fundraising and voluntarism promotion 9.9 8.6 1.4International 0.6 0.8 0.3Religion 19.0 10.9 5.4E
Business and professional associations and unions 5.3 5.2 7.4E
Organizations not elsewhere classified 2.1 2.0E 1.7All organizations 100.0 100.0 100.0
Note: Percentages may not add to 100 due to rounding.Source: Statistics Canada, National Survey of Nonprofit and Voluntary Organizations.
Table 3.18Reported change in number of volunteers and paid staff over the last three years for nonprofit and voluntaryorganizations, by primary activity area, Canada, 2000 to 2003
Reported change in number of Reported change in number of paidvolunteers over the last three years1 staff over the last three years2
Remained Remainedabout the about the
Primary activity area Increased same Decreased Increased same Decreased
%
Arts and culture 33 50 16 34 53 13Sports and recreation 21 52 26 25 67 9Education and research 32 53 15 40 52 8Universities and colleges x 67 x 56 25 19Health 24 57 19 43 45 12Hospitals x 71 x 27 56 17Social services 34 49 17 38 51 11Environment 27 59 14 33 49 18Development and housing 19 70 11 25 66 10Law, advocacy and politics 31 50 20 23 51 26Grant-making, fundraising and voluntarism promotion 25 59 16 36 52 12International 45 42 13 21 64 15Religion 32 53 14 20 73 7Business and professional associations and unions 21 61 18 28 59 12Organizations not elsewhere classified 28 62 10 41 45 13All organizations 28 54 18 30 59 11
Note: Rows may not add to 100% due to rounding.1. These figures apply only to the 64% of organizations that were incorporated, that had been in operation for at least three years, and that had volunteers (excluding
those involved in governance).2. The figures apply only to the 39% of organizations that were incorporated, that had been in operation for at least three years, and that had paid staff.Source: Statistics Canada, National Survey of Nonprofit and Voluntary Organizations.
Statistics Canada – Catalogue No. 61-533 43
Cornerstones of Community: Highlights of the National Survey of Nonprofit and Voluntary Organizations
Summary
Collectively, nonprofit and voluntary organizations report having more than 19 million volunteers who donated a total ofmore than 2 billion hours—the equivalent of more than 1 million full-time jobs. Nearly all organizations rely on volunteersto some degree; more than half rely on volunteers exclusively. Nevertheless, only a small percentage of organizationsengage the bulk of volunteers. Sports and recreation organizations engage more than one-quarter of all volunteers.Organizations in Ontario engage far more volunteers than do their counterparts in other provinces. Most organizationsreport little change in their volunteer complements from 2000 to 2003.
Just under half of organizations employ paid staff, but these organizations provide over 2 million jobs. Employment isconcentrated among a small number of organizations: Hospitals, Social services, and Universities and colleges providehalf of all employment. The bulk of employment is permanent, and a significant proportion of employees work part time.Organizations in Ontario employ nearly half of all paid staff. For the most part, the number of employees working fornonprofit and voluntary organizations was relatively stable from 2000 to 2003.
Most volunteers are engaged by organizations with relatively small staff sizes. There is little relationship between changesin staff sizes and changes in the size of an organization’s volunteer complement.

44 Statistics Canada – Catalogue No. 61-533
Cornerstones of Community: Highlights of the National Survey of Nonprofit and Voluntary Organizations
Organizational capacity
Introduction
The capacity of nonprofit and voluntary organizations to achieve their missions has a direct bearing on the contributionsthey are able to make to the lives of Canadians. Although these organizations as a whole have a sizable economicpresence and command large complements of volunteers and paid staff, many appear to be experiencing problems withrespect to their ability to fulfill their missions. The areas that appear to pose the greatest problems are those that involverecruiting and retaining volunteers, planning for the future, and obtaining funding.
Survey respondents were asked to indicate the extent to which their organizations were experiencing problems in eachof the following areas:1
• human resources capacity—the ability to recruit and deploy volunteers and paid staff within the organization• financial capacity—the ability to develop and deploy the revenues and assets of the organization• planning and development capacity—the ability to develop and draw on organizational strategic plans, program
plans, policies and procedures• relationship and network capacity—the ability to collaborate and draw on relationships with clients, members, funders,
partners, government and other stakeholders• infrastructure and process capacity—the ability to deploy or rely on infrastructure such as internal administrative
systems, information technology, software or databases• external factors that affect an organization’s overall capacity, such as the level of demand for services or products.
Questions were developed to assess the extent to which organizations were having difficulties fulfilling their missions ormeeting their objectives because of these problems. For each issue, respondents were asked to indicate whether it was‘not a problem,’ ‘a small problem,’ ‘a moderate problem’ or ‘a serious problem.’2
What problems do organizations report?
The majority of organizations (56% to 58%) report difficulty recruiting the types of volunteers the organization needs,difficulty obtaining board members, and difficulty planning for the future as problems (Table 4.1). Close to half (48% to49%) report difficulty retaining volunteers, difficulty obtaining funding from other organizations such as government,foundations or corporations, and difficulty obtaining funding from individual donors as problems. It is worth noting that,depending on the issue assessed, from 9% to 20% of respondents indicate that the above problems are serious.
Approximately 40% of respondents report that the following were problems for their organizations: competition with otherorganizations for funding or revenues (43%), increasing demands for services or products (43%), difficulty earningrevenues (42%), difficulty adapting to change (41%), lack of internal capacity (39%), difficulty participating in developmentof public policy (39%) and difficulty providing training for volunteers (38%).
Relatively speaking, difficulty retaining paid staff; difficulty obtaining the type of paid staff the organization needs, difficultyproviding staff training and development, and difficulty collaborating with other organizations were reported as problemsby fewer organizations—less than 30%.
1. For a discussion of the conceptual model of organizational capacity that guided this research and the results of qualitative research that informedthe development of the survey items used by the NSNVO, see M.H Hall et al., 2003, The Capacity to Serve: A Qualitative Study of the ChallengesFacing Canada’s Nonprofit and Voluntary Organizations Toronto: Canadian Centre for Philanthropy.
2. Organizations reporting no problem with a given issue may include those for which the issue is not applicable. Unless otherwise stated, thepresence of a problem refers to the number reporting all levels of difficulty combined (i.e., the sum of responses of ‘a small problem,’ ‘amoderate problem’ and ‘a serious problem’). The responses to this series of questions reflect a respondent’s perceptions.
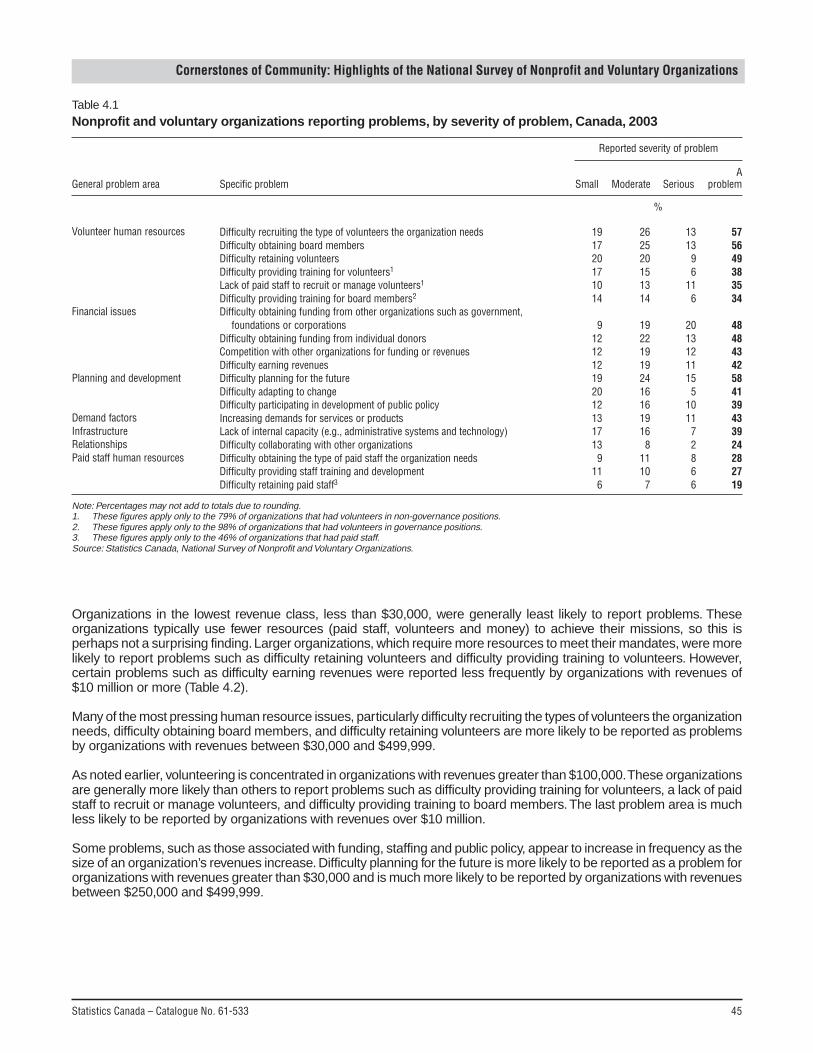
Statistics Canada – Catalogue No. 61-533 45
Cornerstones of Community: Highlights of the National Survey of Nonprofit and Voluntary Organizations
Table 4.1Nonprofit and voluntary organizations reporting problems, by severity of problem, Canada, 2003
Reported severity of problem
AGeneral problem area Specific problem Small Moderate Serious problem
%
Volunteer human resources
Financial issues
Planning and development
Demand factorsInfrastructureRelationshipsPaid staff human resources
Difficulty recruiting the type of volunteers the organization needsDifficulty obtaining board membersDifficulty retaining volunteersDifficulty providing training for volunteers1
Lack of paid staff to recruit or manage volunteers1
Difficulty providing training for board members2
Difficulty obtaining funding from other organizations such as government,foundations or corporations
Difficulty obtaining funding from individual donorsCompetition with other organizations for funding or revenuesDifficulty earning revenuesDifficulty planning for the futureDifficulty adapting to changeDifficulty participating in development of public policyIncreasing demands for services or productsLack of internal capacity (e.g., administrative systems and technology)Difficulty collaborating with other organizationsDifficulty obtaining the type of paid staff the organization needsDifficulty providing staff training and developmentDifficulty retaining paid staff3
19 26 13 5717 25 13 5620 20 9 4917 15 6 3810 13 11 3514 14 6 34
9 19 20 4812 22 13 4812 19 12 4312 19 11 4219 24 15 5820 16 5 4112 16 10 3913 19 11 4317 16 7 3913 8 2 249 11 8 28
11 10 6 276 7 6 19
Note: Percentages may not add to totals due to rounding.1. These figures apply only to the 79% of organizations that had volunteers in non-governance positions.2. These figures apply only to the 98% of organizations that had volunteers in governance positions.3. These figures apply only to the 46% of organizations that had paid staff.Source: Statistics Canada, National Survey of Nonprofit and Voluntary Organizations.
Organizations in the lowest revenue class, less than $30,000, were generally least likely to report problems. Theseorganizations typically use fewer resources (paid staff, volunteers and money) to achieve their missions, so this isperhaps not a surprising finding. Larger organizations, which require more resources to meet their mandates, were morelikely to report problems such as difficulty retaining volunteers and difficulty providing training to volunteers. However,certain problems such as difficulty earning revenues were reported less frequently by organizations with revenues of$10 million or more (Table 4.2).
Many of the most pressing human resource issues, particularly difficulty recruiting the types of volunteers the organizationneeds, difficulty obtaining board members, and difficulty retaining volunteers are more likely to be reported as problemsby organizations with revenues between $30,000 and $499,999.
As noted earlier, volunteering is concentrated in organizations with revenues greater than $100,000. These organizationsare generally more likely than others to report problems such as difficulty providing training for volunteers, a lack of paidstaff to recruit or manage volunteers, and difficulty providing training to board members. The last problem area is muchless likely to be reported by organizations with revenues over $10 million.
Some problems, such as those associated with funding, staffing and public policy, appear to increase in frequency as thesize of an organization’s revenues increase. Difficulty planning for the future is more likely to be reported as a problem fororganizations with revenues greater than $30,000 and is much more likely to be reported by organizations with revenuesbetween $250,000 and $499,999.
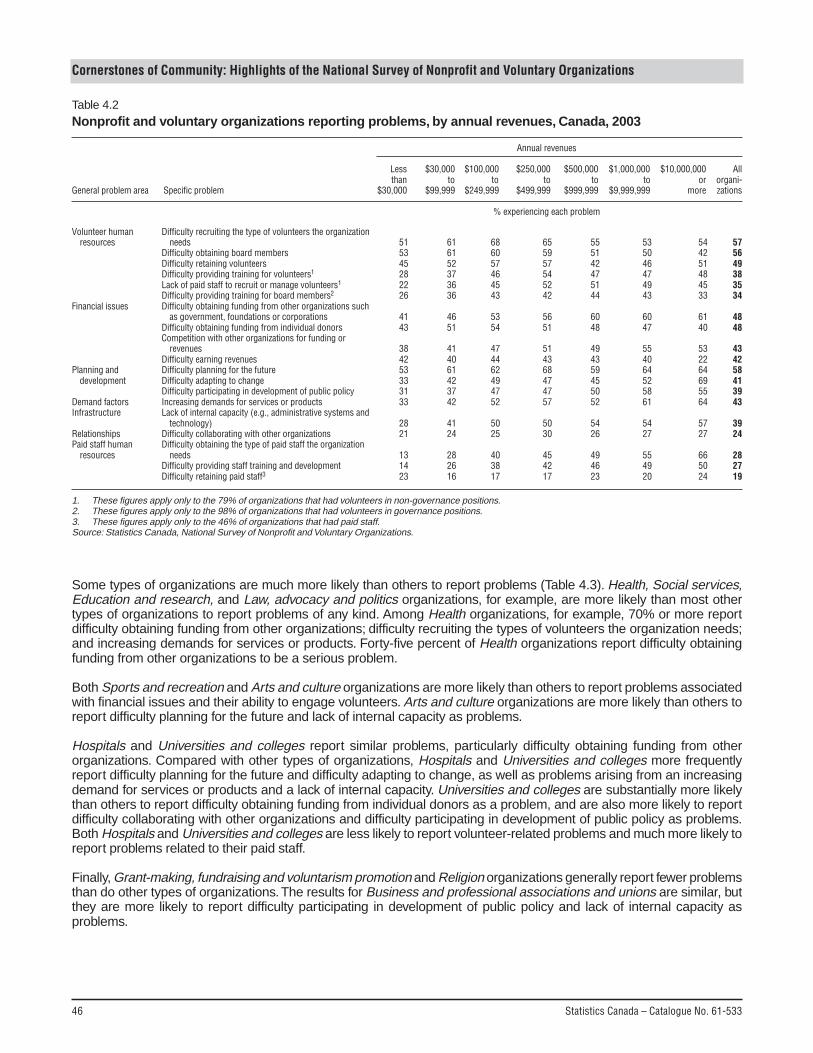
46 Statistics Canada – Catalogue No. 61-533
Cornerstones of Community: Highlights of the National Survey of Nonprofit and Voluntary Organizations
Table 4.2Nonprofit and voluntary organizations reporting problems, by annual revenues, Canada, 2003
Annual revenues
Less $30,000 $100,000 $250,000 $500,000 $1,000,000 $10,000,000 Allthan to to to to to or organi-
General problem area Specific problem $30,000 $99,999 $249,999 $499,999 $999,999 $9,999,999 more zations
% experiencing each problem
1. These figures apply only to the 79% of organizations that had volunteers in non-governance positions.2. These figures apply only to the 98% of organizations that had volunteers in governance positions.3. These figures apply only to the 46% of organizations that had paid staff.Source: Statistics Canada, National Survey of Nonprofit and Voluntary Organizations.
Volunteer humanresources
Financial issues
Planning anddevelopment
Demand factorsInfrastructure
RelationshipsPaid staff human
resources
Difficulty recruiting the type of volunteers the organizationneeds
Difficulty obtaining board membersDifficulty retaining volunteersDifficulty providing training for volunteers1
Lack of paid staff to recruit or manage volunteers1
Difficulty providing training for board members2
Difficulty obtaining funding from other organizations suchas government, foundations or corporations
Difficulty obtaining funding from individual donorsCompetition with other organizations for funding or
revenuesDifficulty earning revenuesDifficulty planning for the futureDifficulty adapting to changeDifficulty participating in development of public policyIncreasing demands for services or productsLack of internal capacity (e.g., administrative systems and
technology)Difficulty collaborating with other organizationsDifficulty obtaining the type of paid staff the organization
needsDifficulty providing staff training and developmentDifficulty retaining paid staff3
51 61 68 65 55 53 54 5753 61 60 59 51 50 42 5645 52 57 57 42 46 51 4928 37 46 54 47 47 48 3822 36 45 52 51 49 45 3526 36 43 42 44 43 33 34
41 46 53 56 60 60 61 4843 51 54 51 48 47 40 48
38 41 47 51 49 55 53 4342 40 44 43 43 40 22 4253 61 62 68 59 64 64 5833 42 49 47 45 52 69 4131 37 47 47 50 58 55 3933 42 52 57 52 61 64 43
28 41 50 50 54 54 57 3921 24 25 30 26 27 27 24
13 28 40 45 49 55 66 2814 26 38 42 46 49 50 2723 16 17 17 23 20 24 19
Some types of organizations are much more likely than others to report problems (Table 4.3). Health, Social services,Education and research, and Law, advocacy and politics organizations, for example, are more likely than most othertypes of organizations to report problems of any kind. Among Health organizations, for example, 70% or more reportdifficulty obtaining funding from other organizations; difficulty recruiting the types of volunteers the organization needs;and increasing demands for services or products. Forty-five percent of Health organizations report difficulty obtainingfunding from other organizations to be a serious problem.
Both Sports and recreation and Arts and culture organizations are more likely than others to report problems associatedwith financial issues and their ability to engage volunteers. Arts and culture organizations are more likely than others toreport difficulty planning for the future and lack of internal capacity as problems.
Hospitals and Universities and colleges report similar problems, particularly difficulty obtaining funding from otherorganizations. Compared with other types of organizations, Hospitals and Universities and colleges more frequentlyreport difficulty planning for the future and difficulty adapting to change, as well as problems arising from an increasingdemand for services or products and a lack of internal capacity. Universities and colleges are substantially more likelythan others to report difficulty obtaining funding from individual donors as a problem, and are also more likely to reportdifficulty collaborating with other organizations and difficulty participating in development of public policy as problems.Both Hospitals and Universities and colleges are less likely to report volunteer-related problems and much more likely toreport problems related to their paid staff.
Finally, Grant-making, fundraising and voluntarism promotion and Religion organizations generally report fewer problemsthan do other types of organizations. The results for Business and professional associations and unions are similar, butthey are more likely to report difficulty participating in development of public policy and lack of internal capacity asproblems.
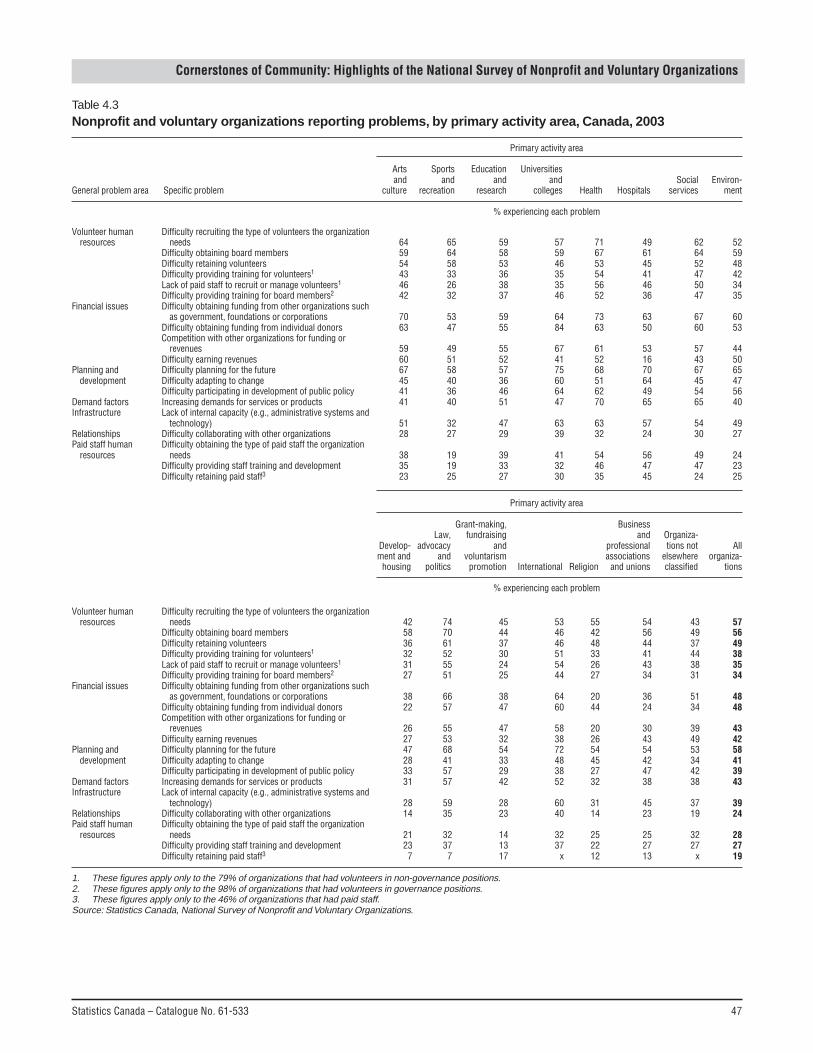
Statistics Canada – Catalogue No. 61-533 47
Cornerstones of Community: Highlights of the National Survey of Nonprofit and Voluntary Organizations
Table 4.3Nonprofit and voluntary organizations reporting problems, by primary activity area, Canada, 2003
Primary activity area
Arts Sports Education Universitiesand and and and Social Environ-
General problem area Specific problem culture recreation research colleges Health Hospitals services ment
% experiencing each problem
Volunteer humanresources
Financial issues
Planning anddevelopment
Demand factorsInfrastructure
RelationshipsPaid staff human
resources
Difficulty recruiting the type of volunteers the organizationneeds
Difficulty obtaining board membersDifficulty retaining volunteersDifficulty providing training for volunteers1
Lack of paid staff to recruit or manage volunteers1
Difficulty providing training for board members2
Difficulty obtaining funding from other organizations suchas government, foundations or corporations
Difficulty obtaining funding from individual donorsCompetition with other organizations for funding or
revenuesDifficulty earning revenuesDifficulty planning for the futureDifficulty adapting to changeDifficulty participating in development of public policyIncreasing demands for services or productsLack of internal capacity (e.g., administrative systems and
technology)Difficulty collaborating with other organizationsDifficulty obtaining the type of paid staff the organization
needsDifficulty providing staff training and developmentDifficulty retaining paid staff3
64 65 59 57 71 49 62 5259 64 58 59 67 61 64 5954 58 53 46 53 45 52 4843 33 36 35 54 41 47 4246 26 38 35 56 46 50 3442 32 37 46 52 36 47 35
70 53 59 64 73 63 67 6063 47 55 84 63 50 60 53
59 49 55 67 61 53 57 4460 51 52 41 52 16 43 5067 58 57 75 68 70 67 6545 40 36 60 51 64 45 4741 36 46 64 62 49 54 5641 40 51 47 70 65 65 40
51 32 47 63 63 57 54 4928 27 29 39 32 24 30 27
38 19 39 41 54 56 49 2435 19 33 32 46 47 47 2323 25 27 30 35 45 24 25
1. These figures apply only to the 79% of organizations that had volunteers in non-governance positions.2. These figures apply only to the 98% of organizations that had volunteers in governance positions.3. These figures apply only to the 46% of organizations that had paid staff.Source: Statistics Canada, National Survey of Nonprofit and Voluntary Organizations.
Primary activity area
Grant-making, BusinessLaw, fundraising and Organiza-
Develop- advocacy and professional tions not Allment and and voluntarism associations elsewhere organiza-
housing politics promotion International Religion and unions classified tions
% experiencing each problem
Volunteer humanresources
Financial issues
Planning anddevelopment
Demand factorsInfrastructure
RelationshipsPaid staff human
resources
Difficulty recruiting the type of volunteers the organizationneeds
Difficulty obtaining board membersDifficulty retaining volunteersDifficulty providing training for volunteers1
Lack of paid staff to recruit or manage volunteers1
Difficulty providing training for board members2
Difficulty obtaining funding from other organizations suchas government, foundations or corporations
Difficulty obtaining funding from individual donorsCompetition with other organizations for funding or
revenuesDifficulty earning revenuesDifficulty planning for the futureDifficulty adapting to changeDifficulty participating in development of public policyIncreasing demands for services or productsLack of internal capacity (e.g., administrative systems and
technology)Difficulty collaborating with other organizationsDifficulty obtaining the type of paid staff the organization
needsDifficulty providing staff training and developmentDifficulty retaining paid staff3
42 74 45 53 55 54 43 5758 70 44 46 42 56 49 5636 61 37 46 48 44 37 4932 52 30 51 33 41 44 3831 55 24 54 26 43 38 3527 51 25 44 27 34 31 34
38 66 38 64 20 36 51 4822 57 47 60 44 24 34 48
26 55 47 58 20 30 39 4327 53 32 38 26 43 49 4247 68 54 72 54 54 53 5828 41 33 48 45 42 34 4133 57 29 38 27 47 42 3931 57 42 52 32 38 38 43
28 59 28 60 31 45 37 3914 35 23 40 14 23 19 24
21 32 14 32 25 25 32 2823 37 13 37 22 27 27 277 7 17 x 12 13 x 19

48 Statistics Canada – Catalogue No. 61-533
Cornerstones of Community: Highlights of the National Survey of Nonprofit and Voluntary Organizations
Charities are very similar to other organizations in the extent to which they report problems. The notable difference is thatcharities are more likely to report difficulty obtaining funding from individual donors as a problem (Table 4.4).
Table 4.4Nonprofit and voluntary organizations reporting problems, by charitable status, Canada, 2003
Not aRegistered registered All
General problem area Specific problem charity charity organizations
% experiencing each problem
Volunteer human resources
Financial issues
Planning and development
Demand factorsInfrastructureRelationshipsPaid staff human resources
Difficulty recruiting the type of volunteers the organization needsDifficulty obtaining board membersDifficulty retaining volunteersDifficulty providing training for volunteers1
Lack of paid staff to recruit or manage volunteers1
Difficulty providing training for board members2
Difficulty obtaining funding from other organizations such as government,foundations or corporations
Difficulty obtaining funding from individual donorsCompetition with other organizations for funding or revenuesDifficulty earning revenuesDifficulty planning for the futureDifficulty adapting to changeDifficulty participating in development of public policyIncreasing demands for services or productsLack of internal capacity (e.g., administrative systems and technology)Difficulty collaborating with other organizationsDifficulty obtaining the type of paid staff the organization needsDifficulty providing staff training and developmentDifficulty retaining paid staff3
58 56 5753 59 5650 49 4939 35 3837 31 3536 32 34
46 49 4854 39 4845 41 4340 44 4260 57 5843 39 4139 40 3946 39 4342 36 3924 24 2431 25 2829 24 2719 18 19
1. These figures apply only to the 79% of organizations that had volunteers in non-governance positions.2. These figures apply only to the 98% of organizations that had volunteers in governance positions.3. These figures apply only to the 46% of organizations that had paid staff.Source: Statistics Canada, National Survey of Nonprofit and Voluntary Organizations.
Are there particular problems with external funding?
As noted earlier, difficulty obtaining funding from other organizations appears to be a major problem for many organizations,and 20% report it to be a serious problem (Table 4.5). It is worth noting that 48% of incorporated organizations that hadbeen active for at least three years reported receiving external funding from governments, foundations or corporationsover that period.
Organizations that were externally funded were asked to report on specific issues related to this type of funding.Sixty-five percent report reductions in government funding to be a problem; 36% consider it a serious problem. Sixty-onepercent report problems with the unwillingness of funders to fund core operations; 27% considered it a serious problem.Similarly, 61% experience difficulties because of an overreliance on project funding; 25% call it a serious problem.Forty-seven percent report that a need to modify programs in order to receive funding creates problems, and 43% reportproblems with the reporting requirements of funders.
These findings are not necessarily at odds with earlier findings that only 22% of organizations reported a decline inrevenues over the previous three years. For example, organizations reporting problems due to reductions in governmentfunding may have sought other funding sources to compensate for a cut in government funds. Many of the problemsreported may also pertain to the way in which organizations are funded rather than to the amounts received.
The organizations reporting problems with external funding are generally more reliant than others on this type of funding,89% of which comes from government. In fact, government funding accounts for 56% of the total revenues of allorganizations receiving external funding.
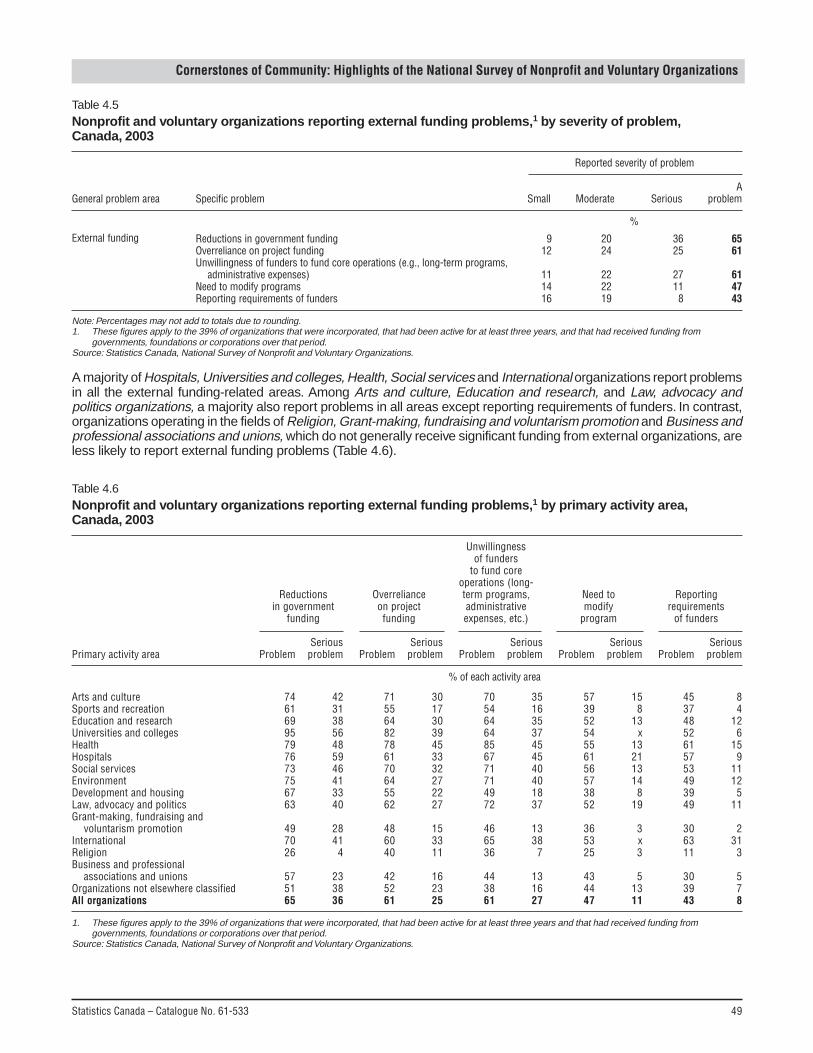
Statistics Canada – Catalogue No. 61-533 49
Cornerstones of Community: Highlights of the National Survey of Nonprofit and Voluntary Organizations
A majority of Hospitals, Universities and colleges, Health, Social services and International organizations report problemsin all the external funding-related areas. Among Arts and culture, Education and research, and Law, advocacy andpolitics organizations, a majority also report problems in all areas except reporting requirements of funders. In contrast,organizations operating in the fields of Religion, Grant-making, fundraising and voluntarism promotion and Business andprofessional associations and unions, which do not generally receive significant funding from external organizations, areless likely to report external funding problems (Table 4.6).
Table 4.5Nonprofit and voluntary organizations reporting external funding problems,1 by severity of problem,Canada, 2003
Reported severity of problem
AGeneral problem area Specific problem Small Moderate Serious problem
%
External funding Reductions in government fundingOverreliance on project fundingUnwillingness of funders to fund core operations (e.g., long-term programs,
administrative expenses)Need to modify programsReporting requirements of funders
9 20 36 6512 24 25 61
11 22 27 6114 22 11 4716 19 8 43
Note: Percentages may not add to totals due to rounding.1. These figures apply to the 39% of organizations that were incorporated, that had been active for at least three years, and that had received funding from
governments, foundations or corporations over that period.Source: Statistics Canada, National Survey of Nonprofit and Voluntary Organizations.
Table 4.6Nonprofit and voluntary organizations reporting external funding problems,1 by primary activity area,Canada, 2003
Unwillingnessof funders
to fund coreoperations (long-
Reductions Overreliance term programs, Need to Reportingin government on project administrative modify requirements
funding funding expenses, etc.) program of funders
Serious Serious Serious Serious SeriousPrimary activity area Problem problem Problem problem Problem problem Problem problem Problem problem
% of each activity area
Arts and culture 74 42 71 30 70 35 57 15 45 8Sports and recreation 61 31 55 17 54 16 39 8 37 4Education and research 69 38 64 30 64 35 52 13 48 12Universities and colleges 95 56 82 39 64 37 54 x 52 6Health 79 48 78 45 85 45 55 13 61 15Hospitals 76 59 61 33 67 45 61 21 57 9Social services 73 46 70 32 71 40 56 13 53 11Environment 75 41 64 27 71 40 57 14 49 12Development and housing 67 33 55 22 49 18 38 8 39 5Law, advocacy and politics 63 40 62 27 72 37 52 19 49 11Grant-making, fundraising and
voluntarism promotion 49 28 48 15 46 13 36 3 30 2International 70 41 60 33 65 38 53 x 63 31Religion 26 4 40 11 36 7 25 3 11 3Business and professional
associations and unions 57 23 42 16 44 13 43 5 30 5Organizations not elsewhere classified 51 38 52 23 38 16 44 13 39 7All organizations 65 36 61 25 61 27 47 11 43 8
1. These figures apply to the 39% of organizations that were incorporated, that had been active for at least three years and that had received funding fromgovernments, foundations or corporations over that period.
Source: Statistics Canada, National Survey of Nonprofit and Voluntary Organizations.
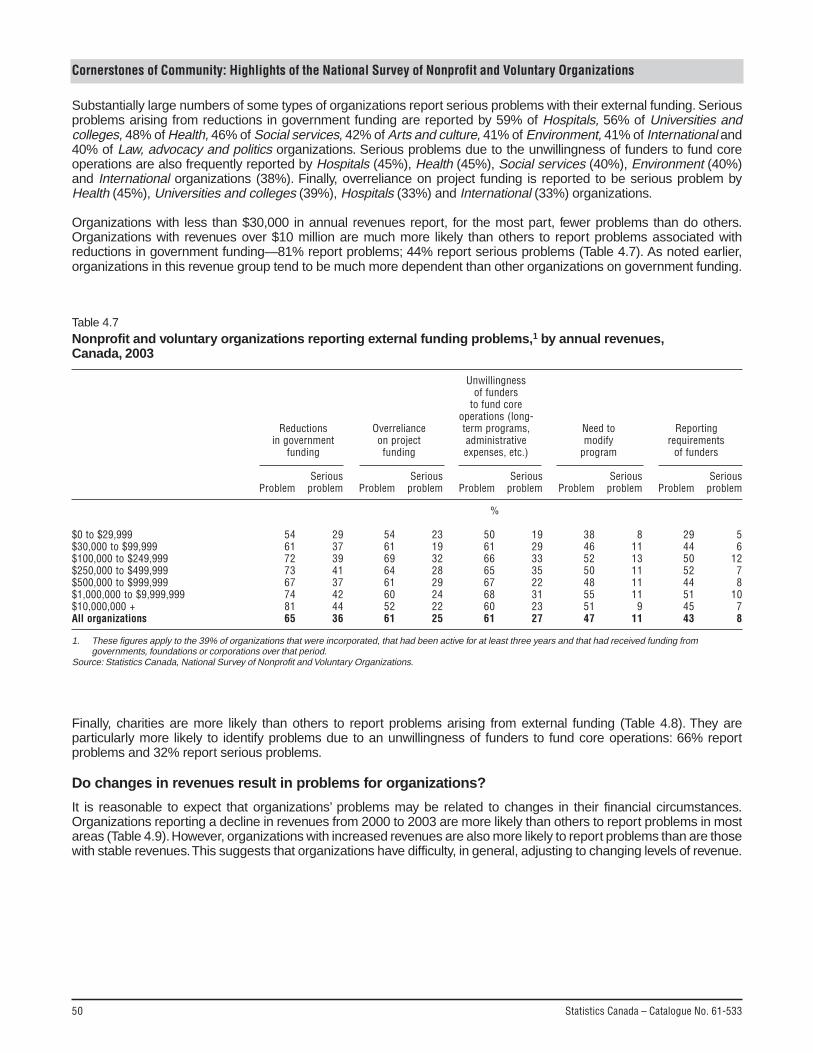
50 Statistics Canada – Catalogue No. 61-533
Cornerstones of Community: Highlights of the National Survey of Nonprofit and Voluntary Organizations
Table 4.7Nonprofit and voluntary organizations reporting external funding problems,1 by annual revenues,Canada, 2003
Unwillingnessof funders
to fund coreoperations (long-
Reductions Overreliance term programs, Need to Reportingin government on project administrative modify requirements
funding funding expenses, etc.) program of funders
Serious Serious Serious Serious SeriousProblem problem Problem problem Problem problem Problem problem Problem problem
%
$0 to $29,999 54 29 54 23 50 19 38 8 29 5$30,000 to $99,999 61 37 61 19 61 29 46 11 44 6$100,000 to $249,999 72 39 69 32 66 33 52 13 50 12$250,000 to $499,999 73 41 64 28 65 35 50 11 52 7$500,000 to $999,999 67 37 61 29 67 22 48 11 44 8$1,000,000 to $9,999,999 74 42 60 24 68 31 55 11 51 10$10,000,000 + 81 44 52 22 60 23 51 9 45 7All organizations 65 36 61 25 61 27 47 11 43 8
1. These figures apply to the 39% of organizations that were incorporated, that had been active for at least three years and that had received funding fromgovernments, foundations or corporations over that period.
Source: Statistics Canada, National Survey of Nonprofit and Voluntary Organizations.
Substantially large numbers of some types of organizations report serious problems with their external funding. Seriousproblems arising from reductions in government funding are reported by 59% of Hospitals, 56% of Universities andcolleges, 48% of Health, 46% of Social services, 42% of Arts and culture, 41% of Environment, 41% of International and40% of Law, advocacy and politics organizations. Serious problems due to the unwillingness of funders to fund coreoperations are also frequently reported by Hospitals (45%), Health (45%), Social services (40%), Environment (40%)and International organizations (38%). Finally, overreliance on project funding is reported to be serious problem byHealth (45%), Universities and colleges (39%), Hospitals (33%) and International (33%) organizations.
Organizations with less than $30,000 in annual revenues report, for the most part, fewer problems than do others.Organizations with revenues over $10 million are much more likely than others to report problems associated withreductions in government funding—81% report problems; 44% report serious problems (Table 4.7). As noted earlier,organizations in this revenue group tend to be much more dependent than other organizations on government funding.
Finally, charities are more likely than others to report problems arising from external funding (Table 4.8). They areparticularly more likely to identify problems due to an unwillingness of funders to fund core operations: 66% reportproblems and 32% report serious problems.
Do changes in revenues result in problems for organizations?
It is reasonable to expect that organizations’ problems may be related to changes in their financial circumstances.Organizations reporting a decline in revenues from 2000 to 2003 are more likely than others to report problems in mostareas (Table 4.9). However, organizations with increased revenues are also more likely to report problems than are thosewith stable revenues. This suggests that organizations have difficulty, in general, adjusting to changing levels of revenue.
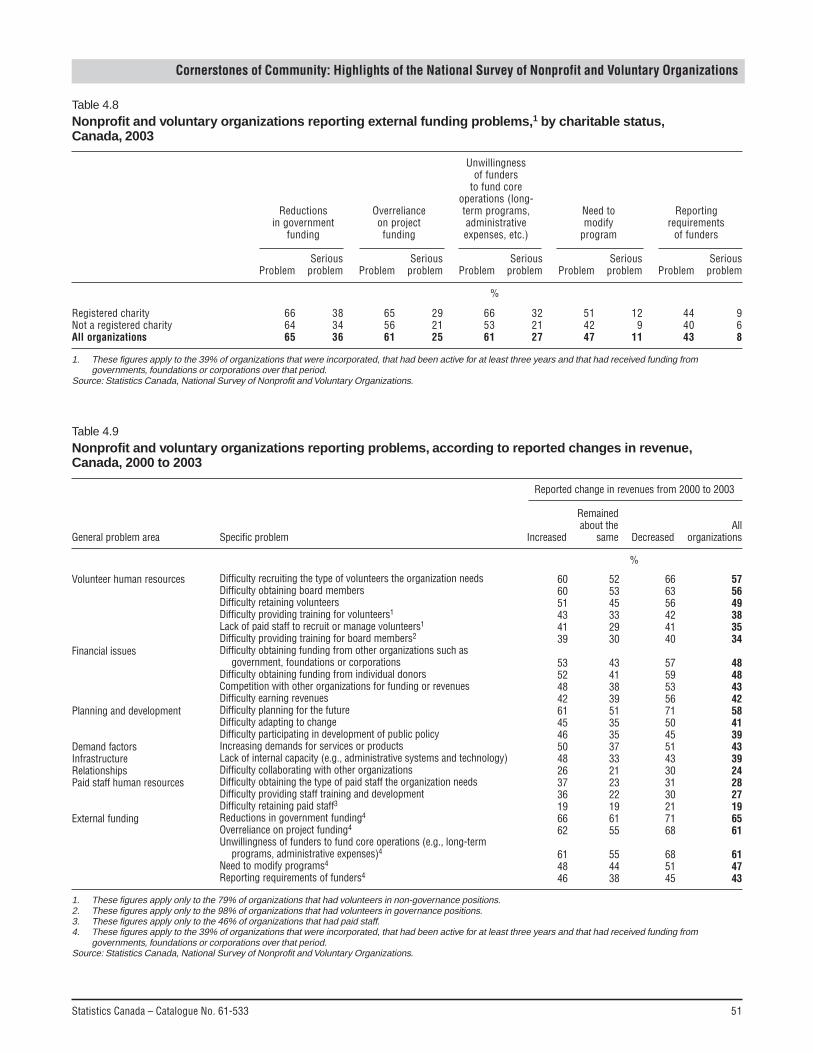
Statistics Canada – Catalogue No. 61-533 51
Cornerstones of Community: Highlights of the National Survey of Nonprofit and Voluntary Organizations
Table 4.8Nonprofit and voluntary organizations reporting external funding problems,1 by charitable status,Canada, 2003
Unwillingnessof funders
to fund coreoperations (long-
Reductions Overreliance term programs, Need to Reportingin government on project administrative modify requirements
funding funding expenses, etc.) program of funders
Serious Serious Serious Serious SeriousProblem problem Problem problem Problem problem Problem problem Problem problem
%
Registered charity 66 38 65 29 66 32 51 12 44 9Not a registered charity 64 34 56 21 53 21 42 9 40 6All organizations 65 36 61 25 61 27 47 11 43 8
1. These figures apply to the 39% of organizations that were incorporated, that had been active for at least three years and that had received funding fromgovernments, foundations or corporations over that period.
Source: Statistics Canada, National Survey of Nonprofit and Voluntary Organizations.
Table 4.9Nonprofit and voluntary organizations reporting problems, according to reported changes in revenue,Canada, 2000 to 2003
Reported change in revenues from 2000 to 2003
Remainedabout the All
General problem area Specific problem Increased same Decreased organizations
%
Volunteer human resources
Financial issues
Planning and development
Demand factorsInfrastructureRelationshipsPaid staff human resources
External funding
Difficulty recruiting the type of volunteers the organization needsDifficulty obtaining board membersDifficulty retaining volunteersDifficulty providing training for volunteers1
Lack of paid staff to recruit or manage volunteers1
Difficulty providing training for board members2
Difficulty obtaining funding from other organizations such asgovernment, foundations or corporations
Difficulty obtaining funding from individual donorsCompetition with other organizations for funding or revenuesDifficulty earning revenuesDifficulty planning for the futureDifficulty adapting to changeDifficulty participating in development of public policyIncreasing demands for services or productsLack of internal capacity (e.g., administrative systems and technology)Difficulty collaborating with other organizationsDifficulty obtaining the type of paid staff the organization needsDifficulty providing staff training and developmentDifficulty retaining paid staff3Reductions in government funding4
Overreliance on project funding4
Unwillingness of funders to fund core operations (e.g., long-termprograms, administrative expenses)4
Need to modify programs4
Reporting requirements of funders4
60 52 66 5760 53 63 5651 45 56 4943 33 42 3841 29 41 3539 30 40 34
53 43 57 4852 41 59 4848 38 53 4342 39 56 4261 51 71 5845 35 50 4146 35 45 3950 37 51 4348 33 43 3926 21 30 2437 23 31 2836 22 30 2719 19 21 1966 61 71 6562 55 68 61
61 55 68 6148 44 51 4746 38 45 43
1. These figures apply only to the 79% of organizations that had volunteers in non-governance positions.2. These figures apply only to the 98% of organizations that had volunteers in governance positions.3. These figures apply only to the 46% of organizations that had paid staff.4. These figures apply to the 39% of organizations that were incorporated, that had been active for at least three years and that had received funding from
governments, foundations or corporations over that period.Source: Statistics Canada, National Survey of Nonprofit and Voluntary Organizations.
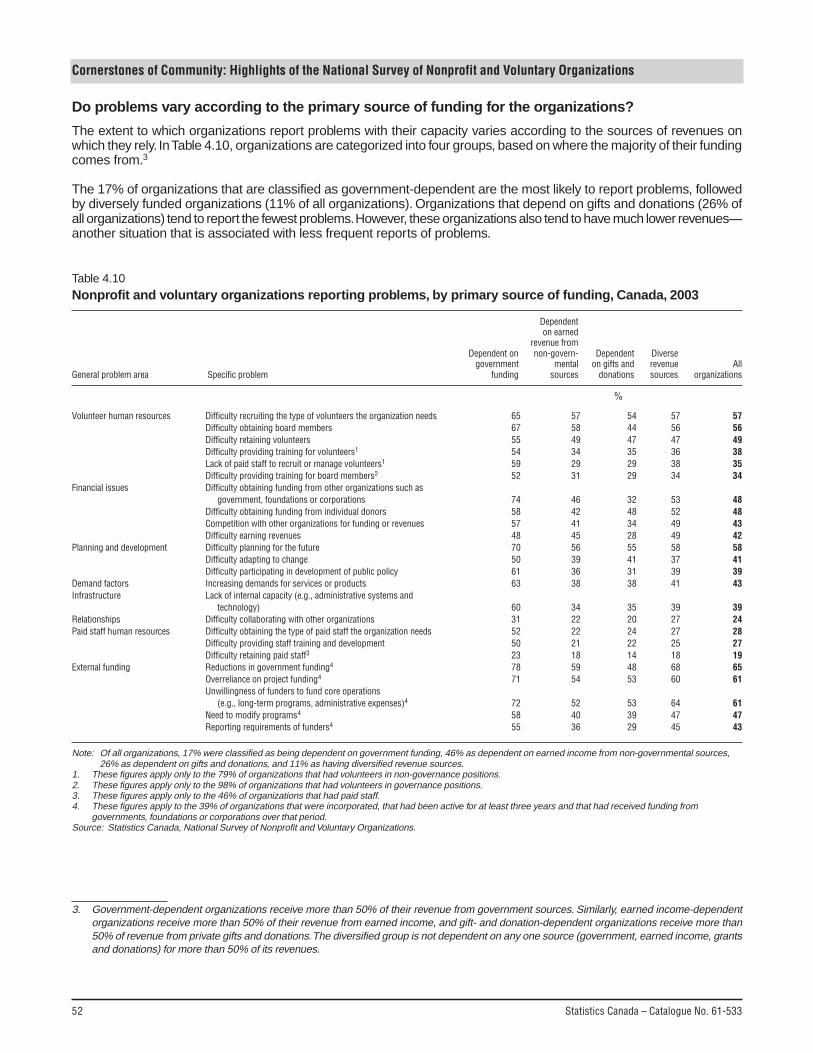
52 Statistics Canada – Catalogue No. 61-533
Cornerstones of Community: Highlights of the National Survey of Nonprofit and Voluntary Organizations
Do problems vary according to the primary source of funding for the organizations?
The extent to which organizations report problems with their capacity varies according to the sources of revenues onwhich they rely. In Table 4.10, organizations are categorized into four groups, based on where the majority of their fundingcomes from.3
The 17% of organizations that are classified as government-dependent are the most likely to report problems, followedby diversely funded organizations (11% of all organizations). Organizations that depend on gifts and donations (26% ofall organizations) tend to report the fewest problems. However, these organizations also tend to have much lower revenues—another situation that is associated with less frequent reports of problems.
3. Government-dependent organizations receive more than 50% of their revenue from government sources. Similarly, earned income-dependentorganizations receive more than 50% of their revenue from earned income, and gift- and donation-dependent organizations receive more than50% of revenue from private gifts and donations. The diversified group is not dependent on any one source (government, earned income, grantsand donations) for more than 50% of its revenues.
Table 4.10Nonprofit and voluntary organizations reporting problems, by primary source of funding, Canada, 2003
Dependenton earned
revenue fromDependent on non-govern- Dependent Diverse
government mental on gifts and revenue AllGeneral problem area Specific problem funding sources donations sources organizations
%
Volunteer human resources
Financial issues
Planning and development
Demand factorsInfrastructure
RelationshipsPaid staff human resources
External funding
Difficulty recruiting the type of volunteers the organization needsDifficulty obtaining board membersDifficulty retaining volunteersDifficulty providing training for volunteers1
Lack of paid staff to recruit or manage volunteers1
Difficulty providing training for board members2
Difficulty obtaining funding from other organizations such asgovernment, foundations or corporations
Difficulty obtaining funding from individual donorsCompetition with other organizations for funding or revenuesDifficulty earning revenuesDifficulty planning for the futureDifficulty adapting to changeDifficulty participating in development of public policyIncreasing demands for services or productsLack of internal capacity (e.g., administrative systems and
technology)Difficulty collaborating with other organizationsDifficulty obtaining the type of paid staff the organization needsDifficulty providing staff training and developmentDifficulty retaining paid staff3
Reductions in government funding4
Overreliance on project funding4
Unwillingness of funders to fund core operations(e.g., long-term programs, administrative expenses)4
Need to modify programs4
Reporting requirements of funders4
65 57 54 57 5767 58 44 56 5655 49 47 47 4954 34 35 36 3859 29 29 38 3552 31 29 34 34
74 46 32 53 4858 42 48 52 4857 41 34 49 4348 45 28 49 4270 56 55 58 5850 39 41 37 4161 36 31 39 3963 38 38 41 43
60 34 35 39 3931 22 20 27 2452 22 24 27 2850 21 22 25 2723 18 14 18 1978 59 48 68 6571 54 53 60 61
72 52 53 64 6158 40 39 47 4755 36 29 45 43
Note: Of all organizations, 17% were classified as being dependent on government funding, 46% as dependent on earned income from non-governmental sources,26% as dependent on gifts and donations, and 11% as having diversified revenue sources.
1. These figures apply only to the 79% of organizations that had volunteers in non-governance positions.2. These figures apply only to the 98% of organizations that had volunteers in governance positions.3. These figures apply only to the 46% of organizations that had paid staff.4. These figures apply to the 39% of organizations that were incorporated, that had been active for at least three years and that had received funding from
governments, foundations or corporations over that period.Source: Statistics Canada, National Survey of Nonprofit and Voluntary Organizations.
Statistics Canada – Catalogue No. 61-533 53
Cornerstones of Community: Highlights of the National Survey of Nonprofit and Voluntary Organizations
Do problems vary according to the geographic location of organizations?
Organizations in the territories are more likely than organizations elsewhere in Canada to report problems—except fordifficulty obtaining board members. In many cases, these organizations are far more likely to report problems, such asdifficulty providing training to board members (52% in the territories versus 34% in Canada); difficulty providing stafftraining and development (45% versus 27%); and difficulty obtaining the type of paid staff the organization needs (44%versus 28%). Organizations in Newfoundland and Labrador are also more likely to report problems, with the exception ofdifficulty obtaining funding from individuals, reporting requirements of funders, and difficulty obtaining board members.Organizations in Manitoba are significantly more likely to report difficulty recruiting the type of volunteers the organizationneeds, difficulty retaining volunteers and lack of paid staff to recruit or manage volunteers (Table 4.11).
The remaining provinces showed less variation in problems. Organizations in Prince Edward Island are far more likely toreport a lack of paid staff to recruit or manage volunteers and the need to modify programs as being problems. In NewBrunswick and British Columbia, organizations are far less likely to report problems with reporting requirements offunders. Quebec-based organizations are substantially more likely than others to report difficulty obtaining board members.
Summary of main findings
Nonprofit and voluntary organizations face many challenges that may keep them from fulfilling their missions and achievingtheir organizational objectives. A majority of them report difficulty recruiting the types of volunteers the organizationneeds, difficulty obtaining board members, and difficulty planning for the future. Close to half also report difficulty retainingvolunteers, difficulty obtaining funding from other organizations such as government, foundations or corporations, anddifficulty obtaining funding from individual donors to be problems.
Organizations with the lowest revenues are generally less likely to report problems. Health, Social services, Hospitals,and Law, advocacy and politics organizations are more likely than most other types of organizations to report problems.As well, registered charities are more likely to report difficulty obtaining funding from individual donors as a problem.
Obtaining external funding from other organizations including government, foundations and corporations appears to bea major problem for many organizations. Those that receive such funding are particularly likely to identify problemsarising from reductions in government funding, unwillingness of funders to fund core operations and overreliance onproject funding.
Problems with external funding are reported by a substantial percentage of most types of organizations. Hospitals,Universities and colleges, Health, Social services, and International organizations are more likely to report these problemsto be serious. The lowest-revenue organizations report fewer external funding problems than other organizations.
Organizations that report any change in revenues from 2000 to 2003 are more likely than others to report problems inmost areas. In addition, the extent to which organizations report problems varies according to the sources of revenues onwhich they rely. Government-dependent organizations are the most likely to report problems; organizations dependenton grants and donations report the fewest problems.
Finally, organizations in the territories, Manitoba, and Newfoundland and Labrador are generally more likely than thosebased elsewhere to report capacity problems.
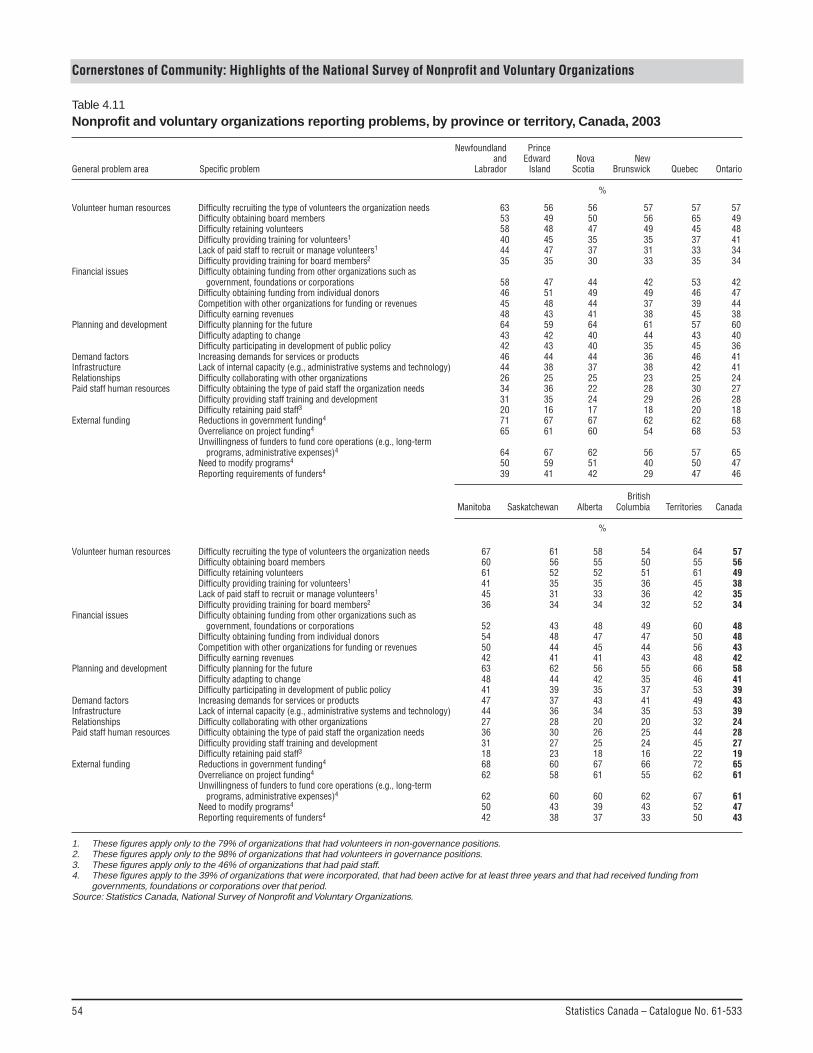
54 Statistics Canada – Catalogue No. 61-533
Cornerstones of Community: Highlights of the National Survey of Nonprofit and Voluntary Organizations
Table 4.11Nonprofit and voluntary organizations reporting problems, by province or territory, Canada, 2003
Newfoundland Princeand Edward Nova New
General problem area Specific problem Labrador Island Scotia Brunswick Quebec Ontario
%
Volunteer human resources
Financial issues
Planning and development
Demand factorsInfrastructureRelationshipsPaid staff human resources
External funding
Difficulty recruiting the type of volunteers the organization needsDifficulty obtaining board membersDifficulty retaining volunteersDifficulty providing training for volunteers1
Lack of paid staff to recruit or manage volunteers1
Difficulty providing training for board members2
Difficulty obtaining funding from other organizations such asgovernment, foundations or corporations
Difficulty obtaining funding from individual donorsCompetition with other organizations for funding or revenuesDifficulty earning revenuesDifficulty planning for the futureDifficulty adapting to changeDifficulty participating in development of public policyIncreasing demands for services or productsLack of internal capacity (e.g., administrative systems and technology)Difficulty collaborating with other organizationsDifficulty obtaining the type of paid staff the organization needsDifficulty providing staff training and developmentDifficulty retaining paid staff3Reductions in government funding4
Overreliance on project funding4
Unwillingness of funders to fund core operations (e.g., long-termprograms, administrative expenses)4
Need to modify programs4
Reporting requirements of funders4
BritishManitoba Saskatchewan Alberta Columbia Territories Canada
%
67 61 58 54 64 5760 56 55 50 55 5661 52 52 51 61 4941 35 35 36 45 3845 31 33 36 42 3536 34 34 32 52 34
52 43 48 49 60 4854 48 47 47 50 4850 44 45 44 56 4342 41 41 43 48 4263 62 56 55 66 5848 44 42 35 46 4141 39 35 37 53 3947 37 43 41 49 4344 36 34 35 53 3927 28 20 20 32 2436 30 26 25 44 2831 27 25 24 45 2718 23 18 16 22 1968 60 67 66 72 6562 58 61 55 62 61
62 60 60 62 67 6150 43 39 43 52 4742 38 37 33 50 43
63 56 56 57 57 5753 49 50 56 65 4958 48 47 49 45 4840 45 35 35 37 4144 47 37 31 33 3435 35 30 33 35 34
58 47 44 42 53 4246 51 49 49 46 4745 48 44 37 39 4448 43 41 38 45 3864 59 64 61 57 6043 42 40 44 43 4042 43 40 35 45 3646 44 44 36 46 4144 38 37 38 42 4126 25 25 23 25 2434 36 22 28 30 2731 35 24 29 26 2820 16 17 18 20 1871 67 67 62 62 6865 61 60 54 68 53
64 67 62 56 57 6550 59 51 40 50 4739 41 42 29 47 46
Volunteer human resources
Financial issues
Planning and development
Demand factorsInfrastructureRelationshipsPaid staff human resources
External funding
Difficulty recruiting the type of volunteers the organization needsDifficulty obtaining board membersDifficulty retaining volunteersDifficulty providing training for volunteers1
Lack of paid staff to recruit or manage volunteers1
Difficulty providing training for board members2
Difficulty obtaining funding from other organizations such asgovernment, foundations or corporations
Difficulty obtaining funding from individual donorsCompetition with other organizations for funding or revenuesDifficulty earning revenuesDifficulty planning for the futureDifficulty adapting to changeDifficulty participating in development of public policyIncreasing demands for services or productsLack of internal capacity (e.g., administrative systems and technology)Difficulty collaborating with other organizationsDifficulty obtaining the type of paid staff the organization needsDifficulty providing staff training and developmentDifficulty retaining paid staff3Reductions in government funding4
Overreliance on project funding4
Unwillingness of funders to fund core operations (e.g., long-termprograms, administrative expenses)4
Need to modify programs4
Reporting requirements of funders4
1. These figures apply only to the 79% of organizations that had volunteers in non-governance positions.2. These figures apply only to the 98% of organizations that had volunteers in governance positions.3. These figures apply only to the 46% of organizations that had paid staff.4. These figures apply to the 39% of organizations that were incorporated, that had been active for at least three years and that had received funding from
governments, foundations or corporations over that period.Source: Statistics Canada, National Survey of Nonprofit and Voluntary Organizations.
Statistics Canada – Catalogue No. 61-533 55
Cornerstones of Community: Highlights of the National Survey of Nonprofit and Voluntary Organizations
Conclusions
Nonprofit and voluntary organizations are an integral part of Canadian life, serving as vehicles for engaging millions ofCanadians in efforts to address needs in their communities. They operate in a broad range of areas, often working locallyto provide public benefits. While many operate on a shoestring and are driven solely by voluntary effort, some are able tocommand substantial human and financial resources in pursuit of their missions. Altogether, their activities combine togive them a significant economic presence. However, many appear to be experiencing substantial difficulties fulfillingtheir missions and organizational objectives. In short, their size, scope, and ability to harness the energies of individualCanadians are impressive, but the benefits they intend to deliver are not being fully realized.
With a combined membership of 139 million individuals, nonprofit and voluntary organizations are remarkable instrumentsfor community engagement. Annually, they draw on 2 billion hours of time that Canadians voluntarily contribute—theequivalent of over a million full-time jobs—and attract more than $8 billion in individual donations.
Nonprofit and voluntary organizations are a reflection of the many interests of Canadians and, as a consequence, havea broad scope of activities. However, in every province and territory there are more organizations working in Religion,Sports and recreation and Social services than in any other area of activity. Despite the breadth of their activities, thereare some commonalities. Virtually all rely on volunteers to govern their activities, and many are collectively ‘owned’ bytheir members, who do not receive a share in revenues that may be generated by their organization.
More than half are registered as charities, allowing them to be exempt from a variety of taxes and enabling their donorsto claim tax credits for the financial and in-kind donations they make. The prevalence of registered charities varies fromprovince to province and is highest in New Brunswick, Nova Scotia and Manitoba.
Most organizations serve their own neighbourhood, city, town or rural municipality. A majority provide services or productsdirectly to people, targeting both the general public and various segments of the population, such as children, youth,seniors or people with disabilities. In addition, most provide public benefits rather than serving their own special interestsor those of their members. This may help to explain why nonprofit and voluntary organizations receive the support theydo from individual Canadians, governments and businesses.
With revenues totalling $112 billion in 2003, nonprofit and voluntary organizations are an important part of the Canadianeconomy. Even setting aside Hospitals and Universities and colleges, their revenues total $75 billion. Given thepredominantly local focus of most organizations, they likely play an important but unrecognized role in local and provincialeconomies.
There appears to be a clear divide between those organizations that are relatively well resourced and those that are not.A small number of organizations with large annual revenues account for the vast majority of total revenues, paid staff,and volunteer positions. Many of these large organizations are Hospitals and Universities and colleges, but they alsoinclude a number of Social services, Education and research, Health and International organizations. These largerorganizations tend to receive substantial amounts of government funding, particularly from provincial government sources;this suggests that there are substantial synergies between their interests and the interests of government. Many of theselarger organizations act regionally, provincially or nationally rather than locally.
On the other side of the divide is a much larger group of small-revenue organizations that tend to have few, if any,employees and instead rely mainly on volunteers to deliver their services. Many of these work in areas such as Sportsand recreation and Religion, although they are common in nearly all fields. These smaller organizations generally dependmore on earned income from non-government sources and donations than on government funding. Most operate withintheir own neighbourhood, city, town or rural municipality.
Organizations in different regions of the country show varied characteristics. Organizations in Ontario, relative to theirnumbers, have disproportionately high percentages of total revenues, volunteers and paid staff. Ontario also has moreorganizations with a national focus than do other provinces or territories. In contrast, organizations in Quebec and BritishColumbia have disproportionately lower percentages of volunteers and paid staff. Quebec is home to more organizationsthan any other province, and has a higher concentration of organizations relative to the size of its population.
56 Statistics Canada – Catalogue No. 61-533
Cornerstones of Community: Highlights of the National Survey of Nonprofit and Voluntary Organizations
However, the character of nonprofit and voluntary organizations may be changing. Large-revenue organizations aremore likely than others to report higher revenues, more volunteers and more employees in 2003 than in 2000.
For most organizations, the human and financial resources they rely on appear to have been stable or to have increasedfrom 2000 to 2003. However, this does not mean that these resources are now adequate or that they were adequate in2000. The frequency with which organizations report problems fulfilling their mission suggests that the resources are notadequate.
Many organizations report a host of problems that keep them from fulfilling their missions and achieving their mandates,and a substantial percentage report that these problems are serious. Close to half of organizations report that difficultiesobtaining funding keep them from fulfilling their mission; many report problems due to increasing demand for theirservices or products.
Among the most frequently identified problems are those associated with recruiting and retaining volunteers. Resultsfrom the 2000 National Survey of Giving, Volunteering and Participating show that volunteering has been changing inCanada: there were fewer volunteers in 2000 than in 1997, and there were indications that volunteers may be becomingstretched to the limit.1 The general trends in volunteering imply greater difficulties in the future for nonprofit and voluntaryorganizations.
Revenues are another issue. Organizations report problems obtaining revenues from two of their main sources: individualCanadians; and governments, foundations and corporations. Many organizations that receive funding from governmentsreport serious problems associated with this funding. In particular, organizations are having problems because of fundingcuts, their reliance on project funding, and their lack of funding for core operations—problems that undoubtedly limit theautonomy and stability they need to effectively address Canadians’ needs.
The NSNVO adds substantially to our understanding of the nature and state of nonprofit and voluntary organizations inCanada, and provides critical baseline information that will enable us to track their changing state and nature over thecoming years. It also provides information that can be used for the following purposes:
• increasing awareness of the importance and contributions of nonprofit and voluntary organizations in Canada• drawing more attention to areas where organizations may need help to improve their capacity to fulfill their missions
and meet their objectives• providing a stronger basis for developing evidence-based policies that can help to strengthen nonprofit and voluntary
organizations• enabling nonprofit and voluntary organizations to better understand how their organizations compare with others in
their use of resources and their capacity-related strengths and weaknesses.
The NSNVO provides an important portrait of the numbers and characteristics of nonprofit and voluntary organizations,and shows the importance of better understanding the role these organizations play in Canadian life. There are, however,important questions that remain unanswered. Further research is needed on these key questions:
• How do nonprofit and voluntary organizations contribute to the quality of life in Canadian communities? What needsdo they address? What is the collective impact of having a vibrant collection of organizations within communities?Are there regional differences?
• How do nonprofit and voluntary organizations contribute to local and provincial economies? What direct and indirectrole do they play in economic development?
• What role do organizations play in encouraging citizen engagement, developing social capital and promoting thedevelopment of social capital? What role do they play in a healthy democracy?
• What role do nonprofit and voluntary organizations play in the delivery of human and social services, and what wouldbe the consequences of a decline in their capacity to deliver such services?
1. M.H. Hall, L. McKeown and K. Roberts, 2001, Caring Canadians, Involved Canadians: Highlights from the 2000 National Survey of Giving,Volunteering and Participating, Catalogue no. 71-542-XPE, Ottawa, Statistics Canada.
Statistics Canada – Catalogue No. 61-533 57
Cornerstones of Community: Highlights of the National Survey of Nonprofit and Voluntary Organizations
• How well are nonprofit organizations managed? How can they be helped to be innovative, effective, and accountableto the populations they serve?
• What are the various arrangements through which nonprofit and voluntary organizations work with the public andthe private sector, and which arrangements have been found to be most effective?
• What are the most appropriate regulatory frameworks for nonprofit and voluntary organizations?
• What are the most effective ways to develop and sustain nonprofit and voluntary organizations?
Finally, a complete understanding of the role and impact of nonprofit and voluntary organizations in Canadian life wouldnot be complete without a better understanding of the role that the thousands of unincorporated grass-roots organizationsand citizens’ groups play, both in communities and in the growth and development of the more formal incorporatednonprofit and voluntary sector.
Nonprofit and voluntary organizations are, in many ways, an extension of the millions of Canadians who direct andsupport their activities. As instruments of collective action, they enable us to come together to address the needs that webelieve are important. In their totality, nonprofit and voluntary organizations are an expression of our Canadian values.Their capacity to serve Canadians helps shape the quality of our lives and our communities, and their potential isintertwined with our own.
58 Statistics Canada – Catalogue No. 61-533
Cornerstones of Community: Highlights of the National Survey of Nonprofit and Voluntary Organizations
Appendix A
Glossary
Certain key concepts are used frequently in the data analyses and interpretations contained in this report. In this section,we describe some of the more complex of these concepts. This is followed by a description of the major independent orexplanatory variables and the major dependent variables examined in this report.
Average hours volunteered annually
The mean number of hours of volunteer work contributed to a charitable and/or nonprofit organization per volunteerduring one year.
Charitable gaming
Events such as bingo, raffles, pull-tickets and casinos held by organizations for fundraising purposes.
Core funding
Monies necessary to maintain essential organizational capacities such as long-term programs, staffing positions (salaryand benefits), and administrative expenses.
Corporate sponsorship
Financial or material contributions given to nonprofit and voluntary organizations by corporate entities in the privatesector.
Earned income from non-governmental sources
Revenue from sources such as charitable gaming, membership fees or dues, fees for goods and services and earningsfrom endowments or investments, including interest income. Excludes government revenue sources.
Fundraising revenues
Revenues received from fundraising organizations, such as the United Way or Federated Health, or from private, familyor community foundations.
Gifts and donations
Revenues from individual donors or organizations. They are bestowed or conferred by an individual or group.
Goods and services
Merchandise bought for resale and items bought for manufacturing goods.
Government funding
Payments for goods and services, and grants and contributions from all levels of government.
Grants and contributions
Monies received in support of the charity or one of its programs from various governments. This does not includepayments under contracts or purchase of service agreements for goods or services the charity provided.
Individual donations
Money given directly by an individual (including planned giving) to one or more nonprofit and voluntary organizations.See also Gifts and donations.
Statistics Canada – Catalogue No. 61-533 59
Cornerstones of Community: Highlights of the National Survey of Nonprofit and Voluntary Organizations
In-kind support
Donations of goods or materials and/or donations of business or professional services to one or more nonprofit orvoluntary organizations.
Investment income
Interest accrued on bank accounts, mortgages, bonds, loans and endowments.
Paid employment, full- and part-time employment
Paid employment refers to staffed employee positions for those receiving a T4 slip for income tax purposes. Full-time paidemployees are those who usually work 30 or more hours a week; part-time employees usually work fewer than 30 hoursa week.
Permanent versus temporary employment
Permanent employment is defined as having no set termination date; temporary employment has a set termination date,but that date can be extended.
Payments
Amounts payable for goods and services rendered. Excludes grants.
Registered charity
An organization that has obtained registered charitable status from the Government of Canada. Four kinds of activitiesare considered to be potentially charitable: the relief of poverty, the advancement of religion, the advancement of education,and other purposes of a charitable nature beneficial to the community as a whole. The last category is broad and caninclude, for example, providing health and social services, protecting the environment, and preventing cruelty to animals.If an organization’s activities fall within these categories, and it does not offer material benefits to its members, CanadaRevenue Agency may consider it eligible to be a registered charity.1
Revenues—financial/monetary
The returns, yield or profit of any lands, property or other source of income.
Target population
Includes all registered charities and incorporated nonprofit and voluntary organizations in Canada. Organizations withanother legal status have also been captured to varying degrees by the survey, but in a less systematic way.
Volunteers, volunteer activity and paid employment equivalence
People who perform a service without pay, through a group or organization. For the purposes of the National Survey ofNonprofit and Voluntary Organizations, volunteers include volunteer board members unless otherwise specified. Paidemployment equivalents are based on a 40-hour work week over 48 weeks of the year.
International classification of nonprofit organizations
Respondents were asked to provide information on the primary activity of their organization. To classify these organizations,the International Classification of Nonprofit Organizations (ICNPO)2 was used. Although they are classified according totheir primary area of activity, some organizations operate in multiple areas. An advantage of the ICNPO system is that itis widely used by other countries, allowing for international comparisons. It has also been devised specifically to reflectthe range and nature of activities typically undertaken in the nonprofit and voluntary sector. The ICNPO system, developedby the Johns Hopkins Comparative Nonprofit Sector Project and modified for use in Canada, is divided into 15 majoractivity groupings, each with subcategories.
1. Canada Customs and Revenue Agency, 2001, Registering a Charity for Income Tax Purposes, http://www.cra-arc.gc.ca/E/pub/tg/t4063/t4063-01e.pdf.
2. The classification is based on L.M. Salamon and H.K. Anheier, 1997, Defining the Nonprofit Sector: A Cross-national Analysis, Manchester,N.Y., Manchester University Press.

60 Statistics Canada – Catalogue No. 61-533
Cornerstones of Community: Highlights of the National Survey of Nonprofit and Voluntary Organizations
Group 1: Arts and culture
Media and communications. Production and dissemination of information and communications. Includes radio and TVstations; publishing of books, journals, newspapers and newsletters; film production; and libraries.
Visual arts, architecture, ceramic art. Production, dissemination and display of visual art and architecture. Includessculpture, photographic societies, painting, drawing, design centres and architectural associations.
Performing arts. Performing arts centres, companies and associations. Includes theatre, dance, ballet and operacompanies; orchestras; and choral and music ensembles.
Historical, literary and humanistic societies. Promotion and appreciation of the humanities, preservation of historicaland cultural artefacts, and commemoration of historical events. Includes historical societies, poetry and literary societies,language associations, reading promotion societies, war memorials; and commemorative funds and associations.
Museums. General and specialized museums covering art, history, sciences, technology and culture.
Zoos and aquariums. Includes zoos and aquariums.
Group 2: Sports and recreation
Sports. Amateur sport, training, physical fitness and sport competition services and events. Includes fitness and wellnesscentres.
Recreation and social clubs. Recreational facilities and services to individuals and communities. Includes playgroundassociations, country clubs, men’s and women’s clubs, touring clubs and leisure clubs.
Service clubs. Membership organizations providing services to members and local communities, such as Lions, ZontaInternational, Rotary and Kiwanis.
Group 3: Education and research
Vocational/technical schools. Technical and vocational training specifically geared toward gaining employment. Includestrade schools, paralegal training and secretarial schools.
Adult/continuing education. Education and training in addition to the formal education system. Includes schools ofcontinuing studies, correspondence schools, night schools, and sponsored literacy and reading programs.
Medical research. Research in the medical field. Includes research on specific diseases, disorders or medical disciplines.
Science and technology. Research in the physical and life sciences as well as engineering and technology.
Social sciences, policy studies. Research and analysis in the social sciences and policy areas.
Group 4: Universities and colleges
Higher education. Higher learning, providing academic degrees. Includes universities, business management schools,law schools and medical schools.
Group 5: Health
Mental health treatment. Outpatient treatment for mentally ill patients. Includes community mental health centres andhalfway homes.
Crisis intervention. Outpatient services and counsel in acute mental health situations. Includes suicide prevention andsupport to victims of assault and abuse.
Statistics Canada – Catalogue No. 61-533 61
Cornerstones of Community: Highlights of the National Survey of Nonprofit and Voluntary Organizations
Public health and wellness education. Public health promotion and health education. Includes sanitation screening forpotential health hazards, first aid training and services, and family planning services.
Health treatment, primarily outpatient. Mainly outpatient health services, e.g., health clinics and vaccination centres.
Rehabilitative medical services. Outpatient therapeutic care. Includes nature cure centres, yoga clinics and physicaltherapy centres.
Emergency medical services. Services to persons in need of immediate care. Includes ambulatory services andparamedical emergency care, shock/trauma programs, lifeline programs and ambulance services.
Group 6: Hospitals
Hospitals. Primarily inpatient medical care and treatment.
Rehabilitation. Inpatient health care and rehabilitative therapy to individuals who suffer from physical impairments dueto injury, genetic defect or disease and who require extensive physiotherapy or similar forms of care.
Nursing homes. Inpatient convalescent care, residential care and primary health care services. Includes homes for thefrail elderly and nursing homes for the severely handicapped.
Psychiatric Hospitals. Inpatient care and treatment for the mentally ill.
Group 7: Social services
Child welfare, child services, and day-care. Services to children, adoption services, child development centres andfoster care. Includes infant-care centres and nurseries.
Youth services and youth welfare. Delinquency prevention services, teen pregnancy prevention, dropout prevention,youth centres and clubs, and job programs for youth. Includes YMCA, YWCA, Boy Scouts, Girl Scouts, and Big Brothers/Sisters.
Family services. Includes family life education, parent education, single-parent agencies and services, and family violenceshelters and services.
Services for the handicapped. Includes homes, other than nursing homes, transport facilities, recreation, and otherspecialized services.
Services for the elderly. Geriatric care, including in-home services, homemaker services, transport facilities, recreation,meal programs and other services geared towards senior citizens, but excluding residential nursing homes.
Self-help and other personal social services. Programs and services for self-help and personal development. Includessupport groups, personal counselling and credit counselling/money management services.
Disaster/emergency prevention and control. Preventing, predicting, controlling and alleviating the effects of disasters,educating or otherwise preparing people to cope with the effects of disasters, or providing relief to disaster victims.Includes volunteer fire departments and lifeboat services.
Temporary shelters. Providing temporary shelter for the homeless. Includes traveller’s aid and temporary housing.
Refugee assistance. Providing food, clothing, shelter and services to refugees and immigrants.
Income support and maintenance. Providing cash assistance and other forms of direct services to persons unable tomaintain a livelihood.
Material assistance. Providing food, clothing, transport and other forms of assistance. Includes food banks and clothingdistribution centres.
62 Statistics Canada – Catalogue No. 61-533
Cornerstones of Community: Highlights of the National Survey of Nonprofit and Voluntary Organizations
Group 8: Environment
Pollution abatement and control. Promoting clean air, clean water, reduction and prevention of noise pollution, radiationcontrol, treatment of hazardous wastes and toxic substances, solid waste management and recycling programs.
Natural resources conservation and protection. Conservation and preservation of natural resources, including land,water, energy and plant resources for the general use and enjoyment of the public.
Environmental beautification and open spaces. Botanical gardens, arboreta, horticultural programs and landscapeservices. Organizations promoting anti-litter campaigns; programs to preserve parks, green spaces and open spaces inurban or rural areas; and city and highway beautification programs.
Animal protection and welfare. Animal protection and welfare services. Includes animal shelters and humane societies.
Wildlife preservation and protection. Wildlife preservation and protection. Includes sanctuaries and refuges.
Veterinary services. Animal hospitals and services providing care to farm and household animals and pets.
Group 9: Development and housing
Community and neighbourhood organizations. Improving the quality of life within communities or neighbourhoods.Comprises squatters’ associations, local development organizations, and poor people’s co-operatives.
Economic development. Programs and services to improve economic infrastructure and capacity. Includes building ofinfrastructure, such as roads; and financial services, such as credit and savings associations, entrepreneurial programs,technical and managerial consulting, and rural development assistance.
Social development. Improving the institutional infrastructure and capacity to alleviate social problems and to improvegeneral public well-being.
Housing associations. Development, construction, management, leasing, financing and rehabilitation of housing.
Housing assistance. Housing search, legal services and related assistance.
Job training programs. Providing and supporting apprenticeship programs, internships, on-the-job training and othertraining programs.
Vocational counselling and guidance. Vocational training and guidance, career counselling, testing and related services.
Vocational rehabilitation and sheltered workshops. Promoting self-sufficiency and income generation through jobtraining and employment.
Group 10: Law, advocacy and politics
Advocacy organizations. Protecting the rights and promoting the interests of specific groups, e.g., the physicallyhandicapped, the elderly, children and women.
Civil rights associations. Protecting or preserving individual civil liberties and human rights.
Ethnic associations. Promoting the interests of, or providing services to, those of a specific ethnic heritage.
Civic associations. Programs and services to encourage and spread civic-mindedness.
Legal services. Legal services, advice and assistance in dispute resolution and court-related matters,crime prevention and public policy, as well as crime prevention to promote safety and precautionary measures amongcitizens.
Statistics Canada – Catalogue No. 61-533 63
Cornerstones of Community: Highlights of the National Survey of Nonprofit and Voluntary Organizations
Rehabilitation of offenders. Programs and services to reintegrate offenders. Includes halfway houses, probation andparole programs, and prison alternatives.
Victim support. Services, counsel and advice to victims of crime.
Consumer protection associations. Protection of consumer rights and improving product control and quality.
Political parties and organizations. Activities and services to support the placing of particular candidates into politicaloffice. Includes dissemination of information, public relations and political fundraising.
Group 11: Grant-making, fundraising and voluntarism promotion
Grant-making foundations. Private foundations, including corporate foundations, community foundations and independentpublic-law foundations.
Voluntarism promotion and support. Recruiting, training, and placing volunteers and promoting volunteering.
Fundraising organizations. Federated, collective fundraising organizations, including lotteries.
Group 12: International
Exchange/friendship/cultural programs. Programs and services to encourage mutual respect and friendship abroad.
Development assistance associations. Programs and projects to promote social and economic development abroad.
International disaster and relief organizations. Collecting, channelling, and providing aid to other countries duringtimes of disaster or emergency.
International human rights and peace organizations. Promoting and monitoring human rights and peace abroad.
Group 13: Religion
Congregations. Churches, synagogues, temples, mosques, shrines, monasteries, seminaries and similar organizationspromoting religious beliefs and administering religious services and rituals.
Associations of congregations. Associations and auxiliaries of religious congregations and organizations supportingand promoting religious beliefs, services and rituals.
Group 14: Business and professional associations and unions
Business associations. Promoting, regulating, and safeguarding the interests of special branches of business, e.g.,manufacturers, farmers and bankers.
Professional associations. Promoting, regulating and protecting professional interests, e.g., bar associations and medicalassociations.
Labour unions. Promoting, protecting, and regulating the rights and interests of employees.
Group 15: Not elsewhere classified
64 Statistics Canada – Catalogue No. 61-533
Cornerstones of Community: Highlights of the National Survey of Nonprofit and Voluntary Organizations
Appendix B
Methodology
Introduction
The objective of the NSNVO was to produce statistical information on the size, scope, capacity needs and challenges ofnonprofit and voluntary organizations in Canada. The result is a rich source of data for analytical research reports and forrecommending focussed follow-up research on voluntary sector capacity. The major phases of the two-year-longdevelopment and implementation of the survey were:
• sample frame development and sampling strategy• quantitative survey design• data collection and processing• data quality assurance and weighting.
Each of these phases is outlined below, with a description of the quality of the data obtained by the survey.
Sample frame development and sampling strategy
The frame for this survey was developed using a combination of Statistics Canada’s Business Register (BR), files oncharities and nonprofit organizations from the Canada Revenue Agency (CRA), and lists of incorporated nonprofitorganizations maintained by individual provinces and territories and by Industry Canada. The BR contains a NorthAmerican Industry Classification System (NAICS) code and gross business income for each record. CRA files alsoinclude an activity code and income figure for most records. The files from the provinces and territories contained noinformation on either the activities or the size of the organizations listed therein.
Statistics Canada merged the files to produce a survey frame of charitable and incorporated nonprofit organizations inCanada. The purposes of the matching process were to remove duplicate organizations that appeared on more than onefile and to add stratification variables wherever possible. The activity codes that appeared on the BR and the CRA fileswere used to determine the primary activity of the organization, based on the International Classification of NonprofitOrganizations (ICNPO).1 Many CRA records matched with BR records, enabling the gross business income figure onthe BR to be used as an indicator of size for CRA records that were missing an income value. The remaining CRArecords were matched to the supplementary portion of the BR, which includes all organizations with gross businessincome of less than $30,000. Since no specific gross business income figure is stored for these records, they weredefaulted to the lowest revenue grouping for the purposes of stratification. At the end of this process, there were twogroups of organizations: those with and those without stratification information. Most records in the second group camefrom the provincial and territorial files. While all efforts were made to ensure as clean a matching process as possible, thisis an imperfect science.
The survey was conducted in two phases. For Phase 1, a sample of 20,000 organizations with no classification or sizeinformation was selected for each province individually and for the territories combined. Provinces with fewer organizationswere oversampled so that sufficient sample sizes could be obtained for each province. These organizations were contactedin order to gather some basic stratification information, such as their primary activity according to the ICNPO majorgroupings and their size by gross revenue.
For Phase 2, a second sample of approximately 20,000 organizations was selected, a portion of which had been previouslysurveyed as part of Phase 1. The sample was designed such that results of the survey would be representative of eachprovince and the combined territories, each revenue size category, and each of the ICNPO major activity groupings. Itwas determined that the initial sample included many public sector entities (e.g., school boards, public libraries andpublic schools) that did not meet the ICNPO criteria for inclusion in the survey, and these entities were therefore removedfrom the sample.
1. L.M. Salamon and H.K. Anheier, 1997, Defining the Nonprofit Sector: A Cross-national Analysis, Manchester, N.Y., Manchester University Press.
Statistics Canada – Catalogue No. 61-533 65
Cornerstones of Community: Highlights of the National Survey of Nonprofit and Voluntary Organizations
Quantitative survey design
Two questionnaires were developed for use in the NSNVO: one for the purpose of profiling the subset of organizationswithout adequate stratification information (Phase 1), and the other for deployment with the final sample of nonprofitorganizations selected (Phase 2).
The questionnaire administered to respondents selected for Phase 1 of the survey consisted of a limited number ofquestions that confirmed that the organization still existed and was still nonprofit, and that gathered some indicators asto the activities and size of the organization, along with up-to-date contact information.
The questionnaire administered to respondents selected for Phase 2 of the survey collected detailed financial, humanresources, policy and structural information about nonprofit and voluntary organizations. Questionnaire content anddesign were developed by the consortium of organizations who conducted this research, under the leadership of theCanadian Centre for Philanthropy. Content related to the capacity needs and strengths of organizations was based on anationwide series of focus group consultations and interviews with key stakeholders in the sector. Portions of thequestionnaire were adapted from a survey developed as part of the Johns Hopkins Comparative Non-Profit SectorProject directed by Lester M. Salamon and Helmut K. Anheier (see United Nations, 2003, Handbook on non-profitinstitutions in the system of national accounts [ST/ESA/STAT/SER.F/91]. New York: United Nations).
The survey instrument for Phase 2 was pretested extensively by Statistics Canada and the Canadian Centre forPhilanthropy, as well as by members of the research consortium. Testing was conducted through personal interviews,focus groups, and telephone interviews.
Data collection and processing
Phase 1 entailed a computer-assisted telephone interview (CATI) survey of 20,000 organizations. This phase engagedapproximately 40 interviewers for two months. Statistics Canada confirmed that some 9,000 of these organizations werestill in operation and were, in fact, nonprofit. However, a significant number of organizations could not be located at allduring collection, meaning that their existence could not be confirmed. After collection had ended, a sample of theseorganizations was thoroughly researched in order to better determine how they should be weighted.
For Phase 2 of the survey, an introductory letter and notes on specific questions pertaining to the human resources andrevenue questions were mailed to all respondents. Phase 2 was also conducted as a CATI survey. Organizations contactedfor participation in the NSNVO were asked to identify the person in the organization who would be most likely to have theinformation required to complete the questionnaire. Those agreeing to participate were surveyed using CATI. The interviewtook approximately 30 minutes to complete. This phase of the survey engaged some 60 interviewers for three months.The response rate was about 77%—a strong one for business surveys, in the experience of Statistics Canada.
Data quality assurance and weighting
Various validity and consistency edits were built into the CATI system to allow corrections to be made during the collectionphase. Edits were also applied again after collection to further ensure data quality. Univariate frequencies were producedto identify any unusual values or outliers. Yet, like all surveys, the NSNVO is subject to errors, despite all the precautionstaken at each stage of the survey to control them. There are two main types of errors: sampling and non-sampling errors.
Sampling errors
Sampling errors can occur when inferences drawn from the survey about the population are based on informationcollected from a sample rather than from the entire population. In addition to the sample design and the estimationmethod, the sample size and the variability of each characteristic also determine sampling error. Characteristics that arerare or are distributed very unevenly in the population will have greater sampling error than characteristics that areobserved more frequently or are more homogeneous in the population.
It is standard practice to indicate the magnitude of the sampling error for estimates from a sample survey. The standarderror of the estimate is the degree of variation of the estimate, considering that a particular sample was chosen ratherthan another of many possible samples of the same size under the same sample design. The standard error is usuallyexpressed relative to the estimate to which it pertains. This measure, expressed as a percentage, is known as thecoefficient of variation (CV). It is obtained by dividing the standard error of the estimate by the estimate itself. For
66 Statistics Canada – Catalogue No. 61-533
Cornerstones of Community: Highlights of the National Survey of Nonprofit and Voluntary Organizations
example, if a sample statistic of .78 has a standard error of 0.03, then the coefficient of variation of the estimate iscalculated as
(0.03/0.78) * 100% = 3.8%
For this report, survey estimates are put into one of three categories:
• sample estimates with a CV of 33.3% or less, which are presented unqualified• sample estimates with a CV greater than 33.3%, which are flagged with the symbol E, meaning ‘use with caution’• sample estimates constructed from fewer than seven observations, which are flagged with the symbol x, signifying
that a data point has been suppressed to protect respondents’ confidentiality.
A range with a known probability of containing the true value can be defined using the CV and the estimate. For example,with a 95% probability, the range around the sample estimate is found by adding and subtracting 1.96 multiplied by thesample estimate and by its CV.2
In this case, the true value is in the range between 72.2% (78% – 5.8%) and 83.8% (78% + 5.8%), 19 times out of 20.A lower CV is preferable: it indicates a statistically more precise estimate.
Non-sampling errors
Errors that are not related to sampling may occur at almost every step of a survey. For example, interviewers maymisunderstand instructions, respondents may make errors in answering questions, responses may be entered incorrectlyon the questionnaire, and errors may occur in the processing and tabulation of the data.
Over a large number of observations, errors occurring randomly will have little effect on survey estimates. Errors occurringsystematically, however, will contribute to biased estimates. Considerable effort has been made to reduce non-samplingerrors by implementing quality assurance measures at each step of data collection and processing. These measuresinclude the use of skilled interviewers with extensive training on survey procedures and the questionnaire; evaluation ofpossible flaws in the survey design or instructions; implementation of procedures to minimize data response or codingerrors; and performance of quality checks to verify data editing and coding. A major source of non-sampling error is theeffect of non-response on the survey results. The extent of non-response varies from partial non-response (failure toanswer just one or some questions) to total non-response. Total non-response occurs when the interviewer is unable tocontact the respondent, no member of the organization is able to provide the information, or the respondent refuses toparticipate in the survey.
The weighting process is designed to account for total non-response. Each organization in the sample was assigned aweight to reflect the number of organizations it represented in the population. After collection, organizations were classifiedas respondents, non-respondents or otherwise—most notably out of scope.3 The process had to account for the fact thatthe non-respondent organizations might have been in or out of the scope of the survey, depending on the answer givento the first question. By way of adjustment, the weights of respondents and of organizations classified otherwise wereincreased. Weights were specific to each stratum, i.e., the combination of province, ICNPO and revenue category priorto Phase 2 collection.
For example, if there are 400 units of medium size in a particular province and classification category of the ICNPO, andif 50 are chosen for the sample, the weight of each sample unit is (400/50) = 8.
Imputation procedures
The purpose of imputation is to assign values to missing answers of records with partial non-response. If however, aparticular answer were deemed to be invalid and needed replacement, a replacement value could be obtained usingimputation. Imputation achieves two objectives: users of the microdata file need not filter records, depending on thevariables to be tabulated; and the weight of a record is unchanged, regardless of the variable(s) under study.
2. The calculation is 1.96 x 78% x 3.8% = 5.8%.3. Organizations were considered to be outside the scope of this survey if they were not found to be a nonprofit organization (i.e., they were for-
profit organizations or government bodies).

Statistics Canada – Catalogue No. 61-533 67
Cornerstones of Community: Highlights of the National Survey of Nonprofit and Voluntary Organizations
Two approaches to imputation were used. Wherever possible, values of missing answers were deduced or derived fromanswers that had been provided. The advantage of this approach is that changes are consistently made according to aset of prescribed rules. However, for the NSNVO, most missing values were imputed using the approach of donorimputation, whereby missing answers of a partial non-respondent—the receiver—are replaced with the answers of arandomly chosen respondent who has supplied answers—the donor. The choice of donor for a receiver was randomfrom among a set of potential donors, all of which shared some degree of commonality with the partial non-respondent.Typically, the receiver and the set of donors might have a similar magnitude of total revenue and were of the sameICNPO.
Estimation procedures
Estimates were generated using SAS software and produced in tables of results in Microsoft Excel. In order to verify thequality of the estimates, measures of quality were generated using the Statistics Canada Generalized Estimation System(GES). GES is a SAS-based application for producing estimates and quality indicators by domain (e.g., by ICNPO or bythe six ranges for amount of revenue) for random stratified sample design. Using GES, CVs were generated for quantitativepoint estimates. Similarly, standard errors were provided for estimates of proportions and ratios. Letter grades based onthe measures of quality were assigned to each estimate. A further check on the quality of the estimates ensured that atleast seven answers contributed to every estimate.
For further information on the data quality of the NSNVO, please contactClient ServicesSmall Business and Special Surveys Division10th Floor, Section C-7Jean Talon BuildingTunney’s PastureOttawa, ONK1A [email protected]
Satellite Account of Nonprofit Institutions and Volunteering
It is a frequent practice at Statistics Canada to conduct comparative analysis of complementary information originatingfrom alternate data sources. Such analysis is one of the many measures undertaken as additional assurance that highstandards of data quality are upheld.
The Satellite Account of Nonprofit Institutions and Volunteering is a complementary Statistics Canada project. It wasdesigned to measure the contribution of the nonprofit sector to the Canadian economy, putting it on an equal footing withother sectors in official economic statistics. Estimates in the satellite account are built from a wide range of data sources,including administrative files (tax records), Statistics Canada surveys and public accounts information. They are compiledaccording to international standards within the Canadian System of National Accounts.
Prior to the release of the survey estimates, extensive reconciliation analysis was undertaken to ensure that financialinformation collected on the NSNVO was consistent with estimates compiled in the Satellite Account of Nonprofit Institutionsand Volunteering. From the point of view of the NSNVO, this analysis was important in assessing the validity of entitiesincluded in the survey sample, and helped ensure that the universe covered by the NSNVO was in conformity withinternational concepts.
From the point of view of the satellite account, the reconciliation analysis enabled coverage to be supplemented forcertain types of organizations not well represented in the data sources used to compile the estimates. Since organizationsnot covered were generally small, the impact in terms of financial weight was not substantial. Coverage adjustmentswere concentrated in ICNPO groups for sports and recreation, business and professional associations, and social services.
Satellite account and NSNVO estimates could not be reconciled entirely, and differences remain between the two datasets.These differences are due to a range of factors, including different reference periods, conceptual and methodologicaldifferences, and varying classification procedures. Universe and coverage differences also remain in selected areas. Thereconciliation analysis shows, however, that the broad messages on the size and scope of the nonprofit sector in economicterms reported by the two programs are largely consistent.
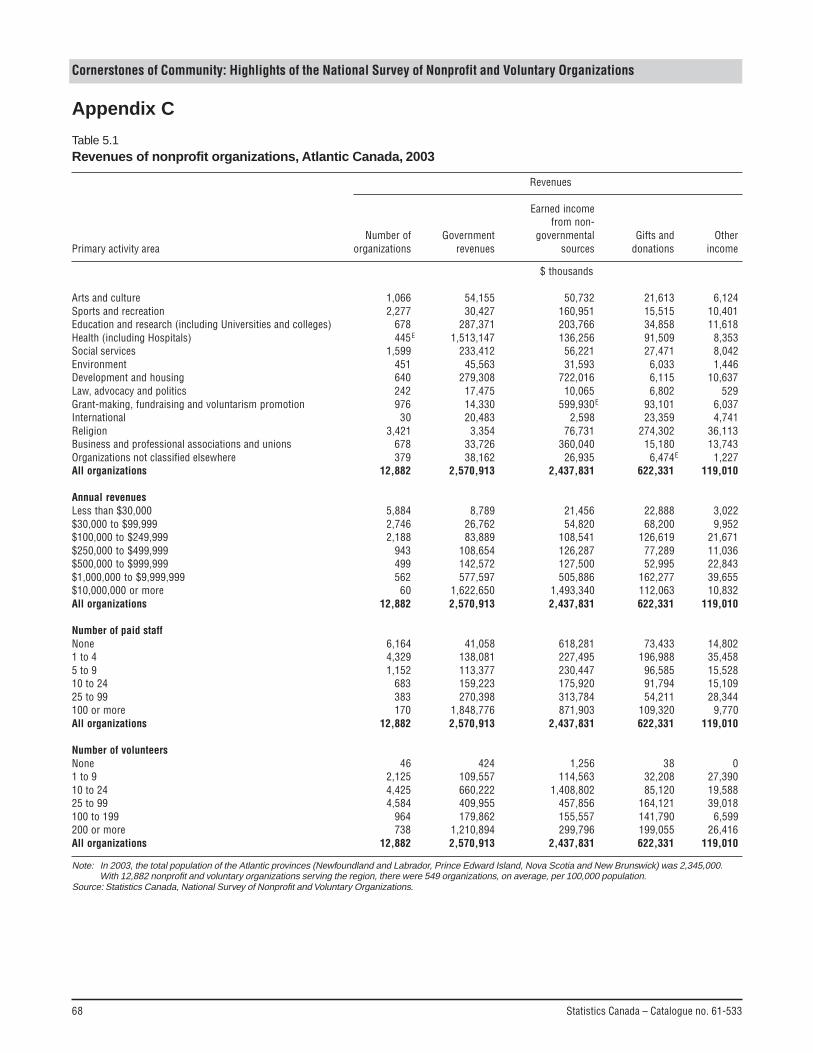
68 Statistics Canada – Catalogue no. 61-533
Cornerstones of Community: Highlights of the National Survey of Nonprofit and Voluntary Organizations
Appendix C
Table 5.1Revenues of nonprofit organizations, Atlantic Canada, 2003
Revenues
Earned incomefrom non-
Number of Government governmental Gifts and OtherPrimary activity area organizations revenues sources donations income
$ thousands
Arts and culture 1,066 54,155 50,732 21,613 6,124Sports and recreation 2,277 30,427 160,951 15,515 10,401Education and research (including Universities and colleges) 678 287,371 203,766 34,858 11,618Health (including Hospitals) 445E 1,513,147 136,256 91,509 8,353Social services 1,599 233,412 56,221 27,471 8,042Environment 451 45,563 31,593 6,033 1,446Development and housing 640 279,308 722,016 6,115 10,637Law, advocacy and politics 242 17,475 10,065 6,802 529Grant-making, fundraising and voluntarism promotion 976 14,330 599,930E 93,101 6,037International 30 20,483 2,598 23,359 4,741Religion 3,421 3,354 76,731 274,302 36,113Business and professional associations and unions 678 33,726 360,040 15,180 13,743Organizations not classified elsewhere 379 38,162 26,935 6,474E 1,227All organizations 12,882 2,570,913 2,437,831 622,331 119,010
Annual revenuesLess than $30,000 5,884 8,789 21,456 22,888 3,022$30,000 to $99,999 2,746 26,762 54,820 68,200 9,952$100,000 to $249,999 2,188 83,889 108,541 126,619 21,671$250,000 to $499,999 943 108,654 126,287 77,289 11,036$500,000 to $999,999 499 142,572 127,500 52,995 22,843$1,000,000 to $9,999,999 562 577,597 505,886 162,277 39,655$10,000,000 or more 60 1,622,650 1,493,340 112,063 10,832All organizations 12,882 2,570,913 2,437,831 622,331 119,010
Number of paid staffNone 6,164 41,058 618,281 73,433 14,8021 to 4 4,329 138,081 227,495 196,988 35,4585 to 9 1,152 113,377 230,447 96,585 15,52810 to 24 683 159,223 175,920 91,794 15,10925 to 99 383 270,398 313,784 54,211 28,344100 or more 170 1,848,776 871,903 109,320 9,770All organizations 12,882 2,570,913 2,437,831 622,331 119,010
Number of volunteersNone 46 424 1,256 38 01 to 9 2,125 109,557 114,563 32,208 27,39010 to 24 4,425 660,222 1,408,802 85,120 19,58825 to 99 4,584 409,955 457,856 164,121 39,018100 to 199 964 179,862 155,557 141,790 6,599200 or more 738 1,210,894 299,796 199,055 26,416All organizations 12,882 2,570,913 2,437,831 622,331 119,010
Note: In 2003, the total population of the Atlantic provinces (Newfoundland and Labrador, Prince Edward Island, Nova Scotia and New Brunswick) was 2,345,000.With 12,882 nonprofit and voluntary organizations serving the region, there were 549 organizations, on average, per 100,000 population.
Source: Statistics Canada, National Survey of Nonprofit and Voluntary Organizations.
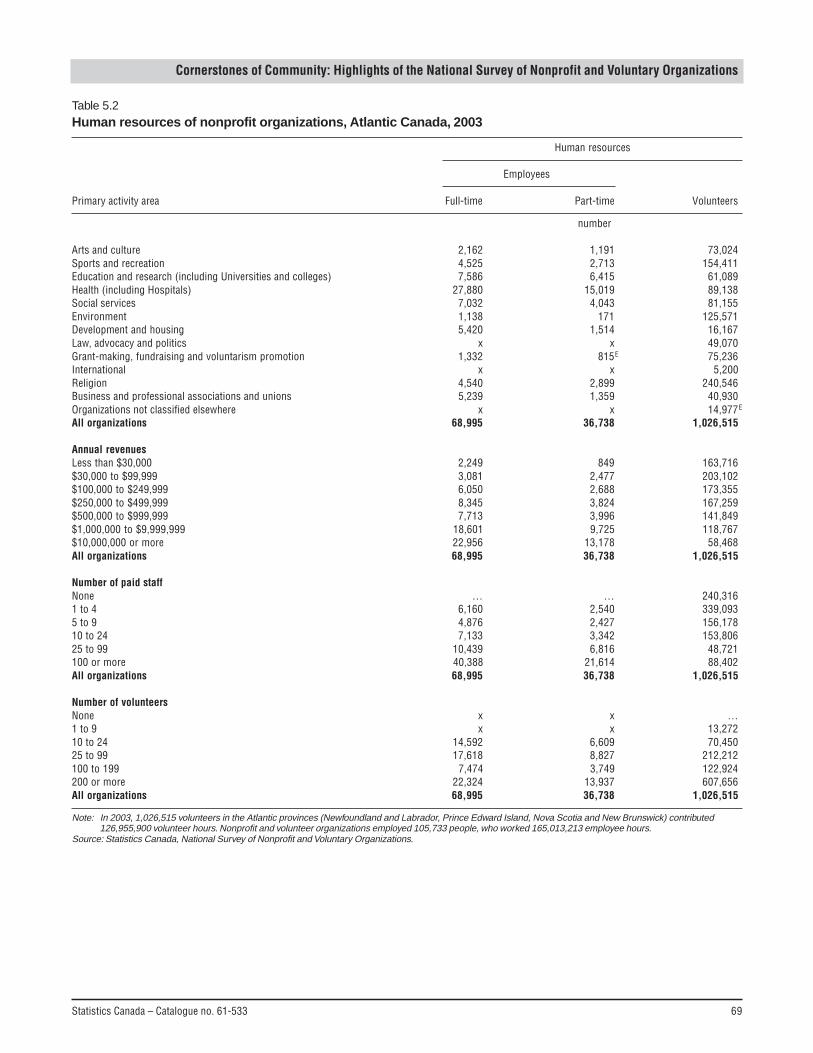
Statistics Canada – Catalogue no. 61-533 69
Cornerstones of Community: Highlights of the National Survey of Nonprofit and Voluntary Organizations
Table 5.2Human resources of nonprofit organizations, Atlantic Canada, 2003
Human resources
Employees
Primary activity area Full-time Part-time Volunteers
number
Arts and culture 2,162 1,191 73,024Sports and recreation 4,525 2,713 154,411Education and research (including Universities and colleges) 7,586 6,415 61,089Health (including Hospitals) 27,880 15,019 89,138Social services 7,032 4,043 81,155Environment 1,138 171 125,571Development and housing 5,420 1,514 16,167Law, advocacy and politics x x 49,070Grant-making, fundraising and voluntarism promotion 1,332 815E 75,236International x x 5,200Religion 4,540 2,899 240,546Business and professional associations and unions 5,239 1,359 40,930Organizations not classified elsewhere x x 14,977E
All organizations 68,995 36,738 1,026,515
Annual revenuesLess than $30,000 2,249 849 163,716$30,000 to $99,999 3,081 2,477 203,102$100,000 to $249,999 6,050 2,688 173,355$250,000 to $499,999 8,345 3,824 167,259$500,000 to $999,999 7,713 3,996 141,849$1,000,000 to $9,999,999 18,601 9,725 118,767$10,000,000 or more 22,956 13,178 58,468All organizations 68,995 36,738 1,026,515
Number of paid staffNone … … 240,3161 to 4 6,160 2,540 339,0935 to 9 4,876 2,427 156,17810 to 24 7,133 3,342 153,80625 to 99 10,439 6,816 48,721100 or more 40,388 21,614 88,402All organizations 68,995 36,738 1,026,515
Number of volunteersNone x x …1 to 9 x x 13,27210 to 24 14,592 6,609 70,45025 to 99 17,618 8,827 212,212100 to 199 7,474 3,749 122,924200 or more 22,324 13,937 607,656All organizations 68,995 36,738 1,026,515
Note: In 2003, 1,026,515 volunteers in the Atlantic provinces (Newfoundland and Labrador, Prince Edward Island, Nova Scotia and New Brunswick) contributed126,955,900 volunteer hours. Nonprofit and volunteer organizations employed 105,733 people, who worked 165,013,213 employee hours.
Source: Statistics Canada, National Survey of Nonprofit and Voluntary Organizations.
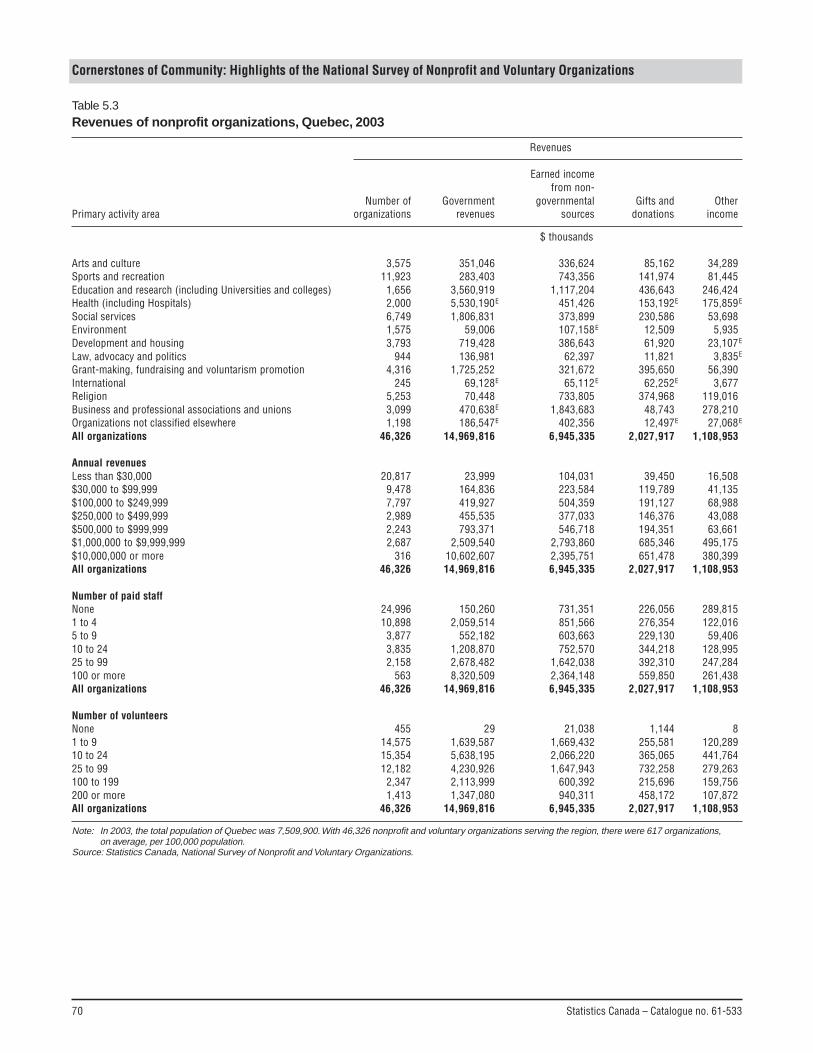
70 Statistics Canada – Catalogue no. 61-533
Cornerstones of Community: Highlights of the National Survey of Nonprofit and Voluntary Organizations
Table 5.3Revenues of nonprofit organizations, Quebec, 2003
Revenues
Earned incomefrom non-
Number of Government governmental Gifts and OtherPrimary activity area organizations revenues sources donations income
$ thousands
Arts and culture 3,575 351,046 336,624 85,162 34,289Sports and recreation 11,923 283,403 743,356 141,974 81,445Education and research (including Universities and colleges) 1,656 3,560,919 1,117,204 436,643 246,424Health (including Hospitals) 2,000 5,530,190E 451,426 153,192E 175,859E
Social services 6,749 1,806,831 373,899 230,586 53,698Environment 1,575 59,006 107,158E 12,509 5,935Development and housing 3,793 719,428 386,643 61,920 23,107E
Law, advocacy and politics 944 136,981 62,397 11,821 3,835E
Grant-making, fundraising and voluntarism promotion 4,316 1,725,252 321,672 395,650 56,390International 245 69,128E 65,112E 62,252E 3,677Religion 5,253 70,448 733,805 374,968 119,016Business and professional associations and unions 3,099 470,638E 1,843,683 48,743 278,210Organizations not classified elsewhere 1,198 186,547E 402,356 12,497E 27,068E
All organizations 46,326 14,969,816 6,945,335 2,027,917 1,108,953
Annual revenuesLess than $30,000 20,817 23,999 104,031 39,450 16,508$30,000 to $99,999 9,478 164,836 223,584 119,789 41,135$100,000 to $249,999 7,797 419,927 504,359 191,127 68,988$250,000 to $499,999 2,989 455,535 377,033 146,376 43,088$500,000 to $999,999 2,243 793,371 546,718 194,351 63,661$1,000,000 to $9,999,999 2,687 2,509,540 2,793,860 685,346 495,175$10,000,000 or more 316 10,602,607 2,395,751 651,478 380,399All organizations 46,326 14,969,816 6,945,335 2,027,917 1,108,953
Number of paid staffNone 24,996 150,260 731,351 226,056 289,8151 to 4 10,898 2,059,514 851,566 276,354 122,0165 to 9 3,877 552,182 603,663 229,130 59,40610 to 24 3,835 1,208,870 752,570 344,218 128,99525 to 99 2,158 2,678,482 1,642,038 392,310 247,284100 or more 563 8,320,509 2,364,148 559,850 261,438All organizations 46,326 14,969,816 6,945,335 2,027,917 1,108,953
Number of volunteersNone 455 29 21,038 1,144 81 to 9 14,575 1,639,587 1,669,432 255,581 120,28910 to 24 15,354 5,638,195 2,066,220 365,065 441,76425 to 99 12,182 4,230,926 1,647,943 732,258 279,263100 to 199 2,347 2,113,999 600,392 215,696 159,756200 or more 1,413 1,347,080 940,311 458,172 107,872All organizations 46,326 14,969,816 6,945,335 2,027,917 1,108,953
Note: In 2003, the total population of Quebec was 7,509,900. With 46,326 nonprofit and voluntary organizations serving the region, there were 617 organizations,on average, per 100,000 population.
Source: Statistics Canada, National Survey of Nonprofit and Voluntary Organizations.
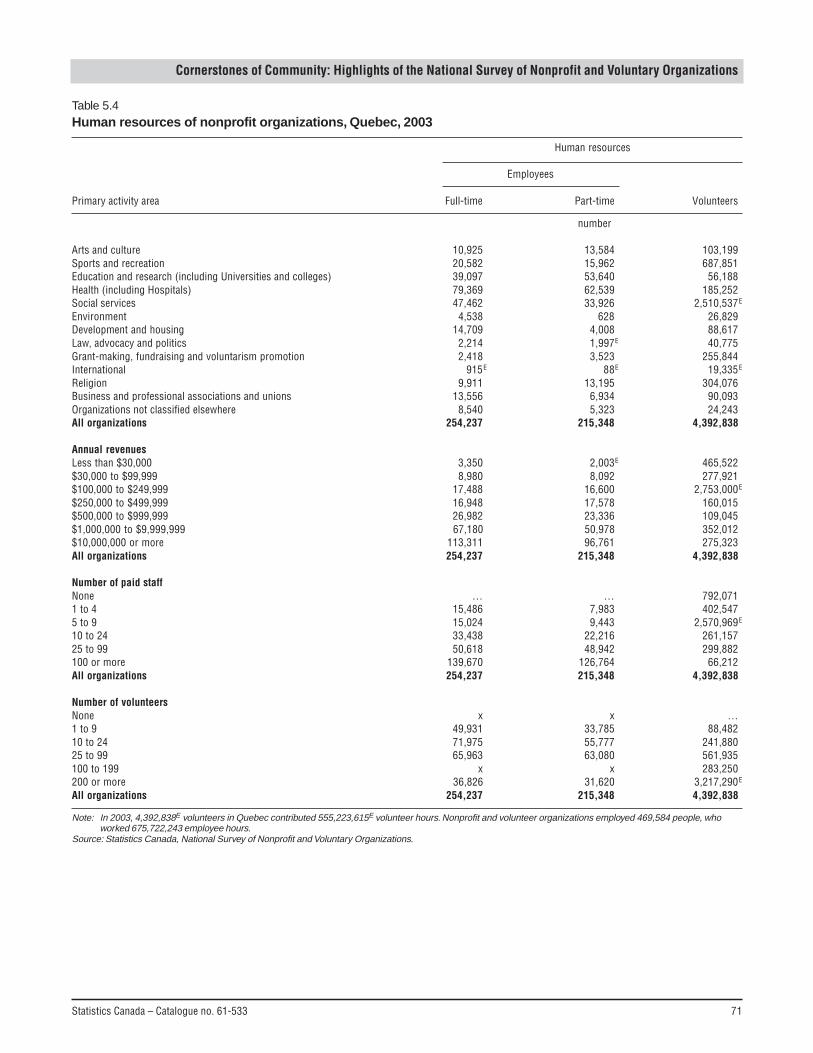
Statistics Canada – Catalogue no. 61-533 71
Cornerstones of Community: Highlights of the National Survey of Nonprofit and Voluntary Organizations
Table 5.4Human resources of nonprofit organizations, Quebec, 2003
Human resources
Employees
Primary activity area Full-time Part-time Volunteers
number
Arts and culture 10,925 13,584 103,199Sports and recreation 20,582 15,962 687,851Education and research (including Universities and colleges) 39,097 53,640 56,188Health (including Hospitals) 79,369 62,539 185,252Social services 47,462 33,926 2,510,537E
Environment 4,538 628 26,829Development and housing 14,709 4,008 88,617Law, advocacy and politics 2,214 1,997E 40,775Grant-making, fundraising and voluntarism promotion 2,418 3,523 255,844International 915E 88E 19,335E
Religion 9,911 13,195 304,076Business and professional associations and unions 13,556 6,934 90,093Organizations not classified elsewhere 8,540 5,323 24,243All organizations 254,237 215,348 4,392,838
Annual revenuesLess than $30,000 3,350 2,003E 465,522$30,000 to $99,999 8,980 8,092 277,921$100,000 to $249,999 17,488 16,600 2,753,000E
$250,000 to $499,999 16,948 17,578 160,015$500,000 to $999,999 26,982 23,336 109,045$1,000,000 to $9,999,999 67,180 50,978 352,012$10,000,000 or more 113,311 96,761 275,323All organizations 254,237 215,348 4,392,838
Number of paid staffNone … … 792,0711 to 4 15,486 7,983 402,5475 to 9 15,024 9,443 2,570,969E
10 to 24 33,438 22,216 261,15725 to 99 50,618 48,942 299,882100 or more 139,670 126,764 66,212All organizations 254,237 215,348 4,392,838
Number of volunteersNone x x …1 to 9 49,931 33,785 88,48210 to 24 71,975 55,777 241,88025 to 99 65,963 63,080 561,935100 to 199 x x 283,250200 or more 36,826 31,620 3,217,290E
All organizations 254,237 215,348 4,392,838
Note: In 2003, 4,392,838E volunteers in Quebec contributed 555,223,615E volunteer hours. Nonprofit and volunteer organizations employed 469,584 people, whoworked 675,722,243 employee hours.
Source: Statistics Canada, National Survey of Nonprofit and Voluntary Organizations.
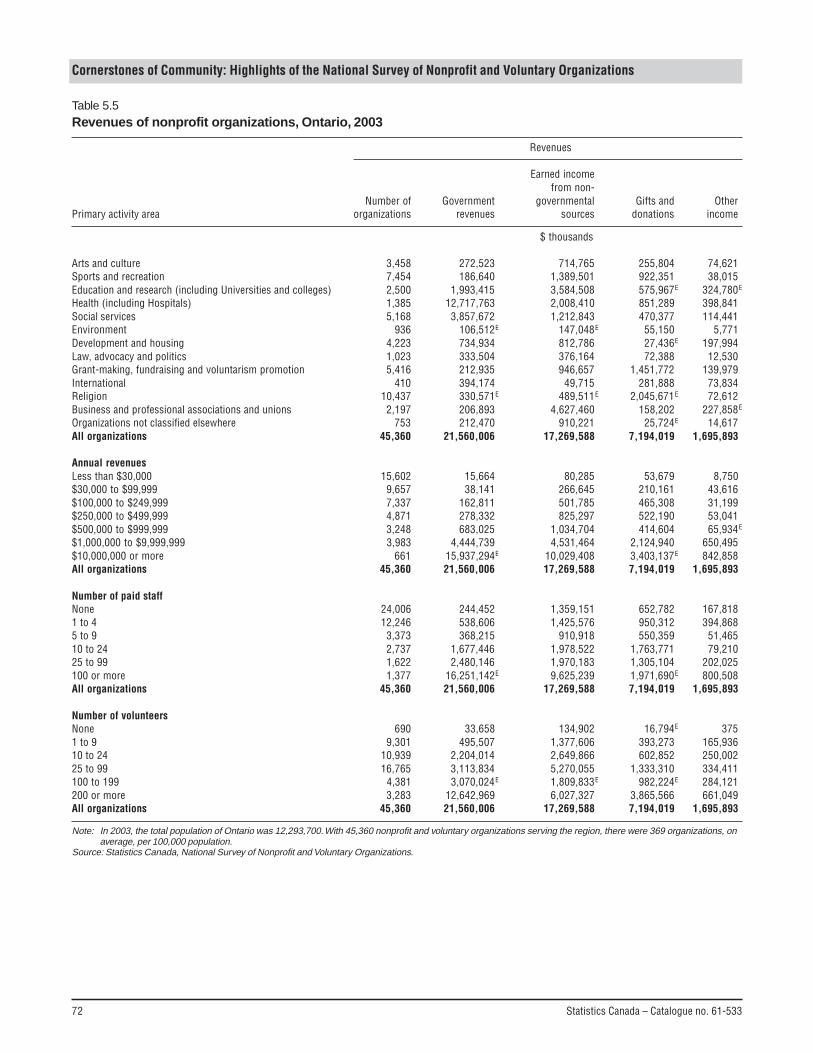
72 Statistics Canada – Catalogue no. 61-533
Cornerstones of Community: Highlights of the National Survey of Nonprofit and Voluntary Organizations
Table 5.5Revenues of nonprofit organizations, Ontario, 2003
Revenues
Earned incomefrom non-
Number of Government governmental Gifts and OtherPrimary activity area organizations revenues sources donations income
$ thousands
Arts and culture 3,458 272,523 714,765 255,804 74,621Sports and recreation 7,454 186,640 1,389,501 922,351 38,015Education and research (including Universities and colleges) 2,500 1,993,415 3,584,508 575,967E 324,780E
Health (including Hospitals) 1,385 12,717,763 2,008,410 851,289 398,841Social services 5,168 3,857,672 1,212,843 470,377 114,441Environment 936 106,512E 147,048E 55,150 5,771Development and housing 4,223 734,934 812,786 27,436E 197,994Law, advocacy and politics 1,023 333,504 376,164 72,388 12,530Grant-making, fundraising and voluntarism promotion 5,416 212,935 946,657 1,451,772 139,979International 410 394,174 49,715 281,888 73,834Religion 10,437 330,571E 489,511E 2,045,671E 72,612Business and professional associations and unions 2,197 206,893 4,627,460 158,202 227,858E
Organizations not classified elsewhere 753 212,470 910,221 25,724E 14,617All organizations 45,360 21,560,006 17,269,588 7,194,019 1,695,893
Annual revenuesLess than $30,000 15,602 15,664 80,285 53,679 8,750$30,000 to $99,999 9,657 38,141 266,645 210,161 43,616$100,000 to $249,999 7,337 162,811 501,785 465,308 31,199$250,000 to $499,999 4,871 278,332 825,297 522,190 53,041$500,000 to $999,999 3,248 683,025 1,034,704 414,604 65,934E
$1,000,000 to $9,999,999 3,983 4,444,739 4,531,464 2,124,940 650,495$10,000,000 or more 661 15,937,294E 10,029,408 3,403,137E 842,858All organizations 45,360 21,560,006 17,269,588 7,194,019 1,695,893
Number of paid staffNone 24,006 244,452 1,359,151 652,782 167,8181 to 4 12,246 538,606 1,425,576 950,312 394,8685 to 9 3,373 368,215 910,918 550,359 51,46510 to 24 2,737 1,677,446 1,978,522 1,763,771 79,21025 to 99 1,622 2,480,146 1,970,183 1,305,104 202,025100 or more 1,377 16,251,142E 9,625,239 1,971,690E 800,508All organizations 45,360 21,560,006 17,269,588 7,194,019 1,695,893
Number of volunteersNone 690 33,658 134,902 16,794E 3751 to 9 9,301 495,507 1,377,606 393,273 165,93610 to 24 10,939 2,204,014 2,649,866 602,852 250,00225 to 99 16,765 3,113,834 5,270,055 1,333,310 334,411100 to 199 4,381 3,070,024E 1,809,833E 982,224E 284,121200 or more 3,283 12,642,969 6,027,327 3,865,566 661,049All organizations 45,360 21,560,006 17,269,588 7,194,019 1,695,893
Note: In 2003, the total population of Ontario was 12,293,700. With 45,360 nonprofit and voluntary organizations serving the region, there were 369 organizations, onaverage, per 100,000 population.
Source: Statistics Canada, National Survey of Nonprofit and Voluntary Organizations.
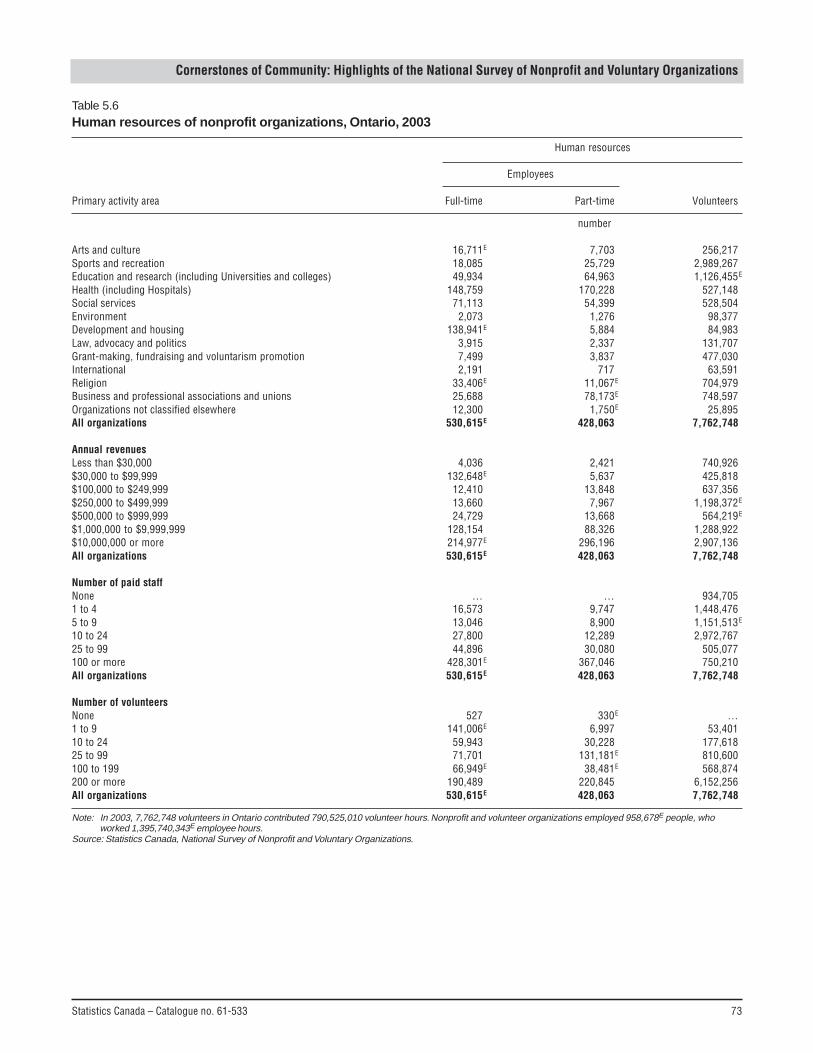
Statistics Canada – Catalogue no. 61-533 73
Cornerstones of Community: Highlights of the National Survey of Nonprofit and Voluntary Organizations
Table 5.6Human resources of nonprofit organizations, Ontario, 2003
Human resources
Employees
Primary activity area Full-time Part-time Volunteers
number
Arts and culture 16,711E 7,703 256,217Sports and recreation 18,085 25,729 2,989,267Education and research (including Universities and colleges) 49,934 64,963 1,126,455E
Health (including Hospitals) 148,759 170,228 527,148Social services 71,113 54,399 528,504Environment 2,073 1,276 98,377Development and housing 138,941E 5,884 84,983Law, advocacy and politics 3,915 2,337 131,707Grant-making, fundraising and voluntarism promotion 7,499 3,837 477,030International 2,191 717 63,591Religion 33,406E 11,067E 704,979Business and professional associations and unions 25,688 78,173E 748,597Organizations not classified elsewhere 12,300 1,750E 25,895All organizations 530,615E 428,063 7,762,748
Annual revenuesLess than $30,000 4,036 2,421 740,926$30,000 to $99,999 132,648E 5,637 425,818$100,000 to $249,999 12,410 13,848 637,356$250,000 to $499,999 13,660 7,967 1,198,372E
$500,000 to $999,999 24,729 13,668 564,219E
$1,000,000 to $9,999,999 128,154 88,326 1,288,922$10,000,000 or more 214,977E 296,196 2,907,136All organizations 530,615E 428,063 7,762,748
Number of paid staffNone … … 934,7051 to 4 16,573 9,747 1,448,4765 to 9 13,046 8,900 1,151,513E
10 to 24 27,800 12,289 2,972,76725 to 99 44,896 30,080 505,077100 or more 428,301E 367,046 750,210All organizations 530,615E 428,063 7,762,748
Number of volunteersNone 527 330E …1 to 9 141,006E 6,997 53,40110 to 24 59,943 30,228 177,61825 to 99 71,701 131,181E 810,600100 to 199 66,949E 38,481E 568,874200 or more 190,489 220,845 6,152,256All organizations 530,615E 428,063 7,762,748
Note: In 2003, 7,762,748 volunteers in Ontario contributed 790,525,010 volunteer hours. Nonprofit and volunteer organizations employed 958,678E people, whoworked 1,395,740,343E employee hours.
Source: Statistics Canada, National Survey of Nonprofit and Voluntary Organizations.
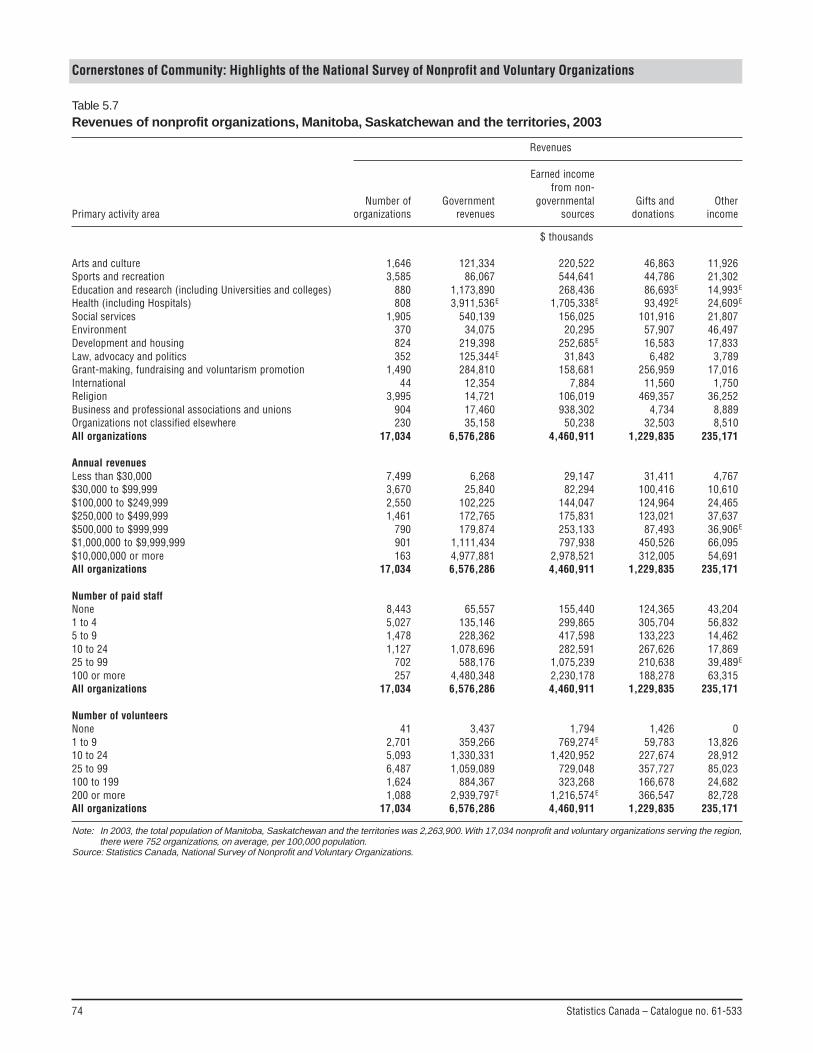
74 Statistics Canada – Catalogue no. 61-533
Cornerstones of Community: Highlights of the National Survey of Nonprofit and Voluntary Organizations
Table 5.7Revenues of nonprofit organizations, Manitoba, Saskatchewan and the territories, 2003
Revenues
Earned incomefrom non-
Number of Government governmental Gifts and OtherPrimary activity area organizations revenues sources donations income
$ thousands
Arts and culture 1,646 121,334 220,522 46,863 11,926Sports and recreation 3,585 86,067 544,641 44,786 21,302Education and research (including Universities and colleges) 880 1,173,890 268,436 86,693E 14,993E
Health (including Hospitals) 808 3,911,536E 1,705,338E 93,492E 24,609E
Social services 1,905 540,139 156,025 101,916 21,807Environment 370 34,075 20,295 57,907 46,497Development and housing 824 219,398 252,685E 16,583 17,833Law, advocacy and politics 352 125,344E 31,843 6,482 3,789Grant-making, fundraising and voluntarism promotion 1,490 284,810 158,681 256,959 17,016International 44 12,354 7,884 11,560 1,750Religion 3,995 14,721 106,019 469,357 36,252Business and professional associations and unions 904 17,460 938,302 4,734 8,889Organizations not classified elsewhere 230 35,158 50,238 32,503 8,510All organizations 17,034 6,576,286 4,460,911 1,229,835 235,171
Annual revenuesLess than $30,000 7,499 6,268 29,147 31,411 4,767$30,000 to $99,999 3,670 25,840 82,294 100,416 10,610$100,000 to $249,999 2,550 102,225 144,047 124,964 24,465$250,000 to $499,999 1,461 172,765 175,831 123,021 37,637$500,000 to $999,999 790 179,874 253,133 87,493 36,906E
$1,000,000 to $9,999,999 901 1,111,434 797,938 450,526 66,095$10,000,000 or more 163 4,977,881 2,978,521 312,005 54,691All organizations 17,034 6,576,286 4,460,911 1,229,835 235,171
Number of paid staffNone 8,443 65,557 155,440 124,365 43,2041 to 4 5,027 135,146 299,865 305,704 56,8325 to 9 1,478 228,362 417,598 133,223 14,46210 to 24 1,127 1,078,696 282,591 267,626 17,86925 to 99 702 588,176 1,075,239 210,638 39,489E
100 or more 257 4,480,348 2,230,178 188,278 63,315All organizations 17,034 6,576,286 4,460,911 1,229,835 235,171
Number of volunteersNone 41 3,437 1,794 1,426 01 to 9 2,701 359,266 769,274E 59,783 13,82610 to 24 5,093 1,330,331 1,420,952 227,674 28,91225 to 99 6,487 1,059,089 729,048 357,727 85,023100 to 199 1,624 884,367 323,268 166,678 24,682200 or more 1,088 2,939,797E 1,216,574E 366,547 82,728All organizations 17,034 6,576,286 4,460,911 1,229,835 235,171
Note: In 2003, the total population of Manitoba, Saskatchewan and the territories was 2,263,900. With 17,034 nonprofit and voluntary organizations serving the region,there were 752 organizations, on average, per 100,000 population.
Source: Statistics Canada, National Survey of Nonprofit and Voluntary Organizations.
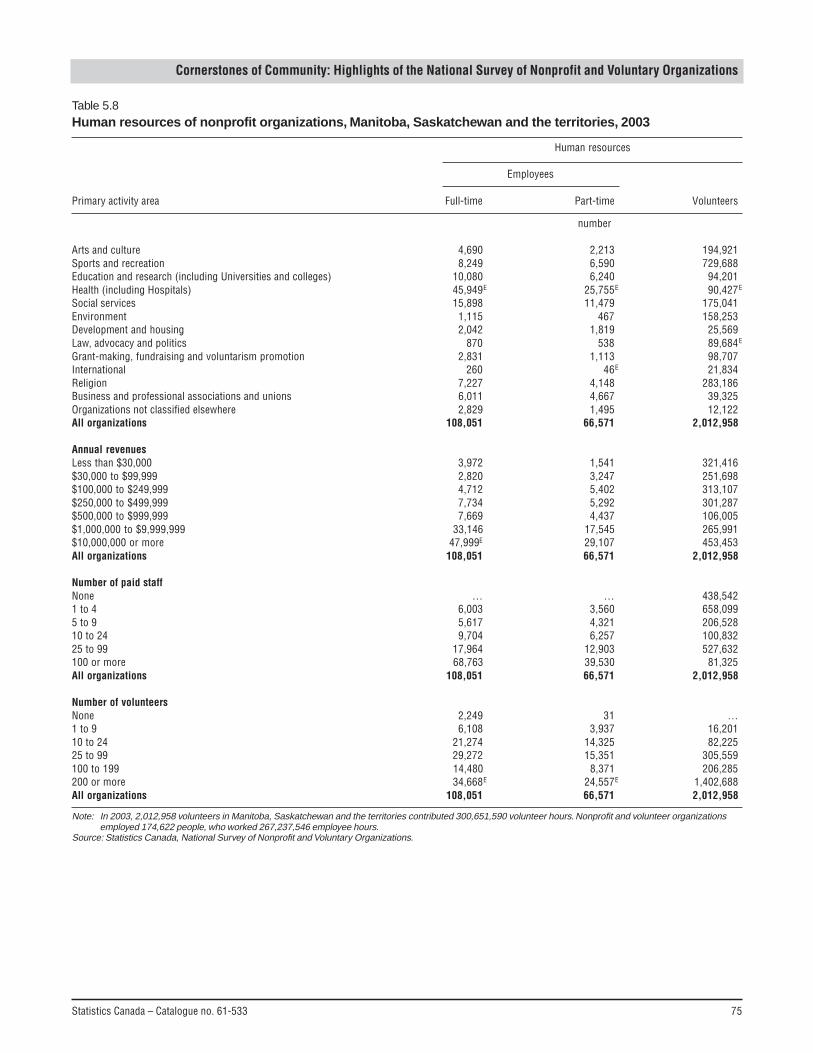
Statistics Canada – Catalogue no. 61-533 75
Cornerstones of Community: Highlights of the National Survey of Nonprofit and Voluntary Organizations
Table 5.8Human resources of nonprofit organizations, Manitoba, Saskatchewan and the territories, 2003
Human resources
Employees
Primary activity area Full-time Part-time Volunteers
number
Arts and culture 4,690 2,213 194,921Sports and recreation 8,249 6,590 729,688Education and research (including Universities and colleges) 10,080 6,240 94,201Health (including Hospitals) 45,949E 25,755E 90,427E
Social services 15,898 11,479 175,041Environment 1,115 467 158,253Development and housing 2,042 1,819 25,569Law, advocacy and politics 870 538 89,684E
Grant-making, fundraising and voluntarism promotion 2,831 1,113 98,707International 260 46E 21,834Religion 7,227 4,148 283,186Business and professional associations and unions 6,011 4,667 39,325Organizations not classified elsewhere 2,829 1,495 12,122All organizations 108,051 66,571 2,012,958
Annual revenuesLess than $30,000 3,972 1,541 321,416$30,000 to $99,999 2,820 3,247 251,698$100,000 to $249,999 4,712 5,402 313,107$250,000 to $499,999 7,734 5,292 301,287$500,000 to $999,999 7,669 4,437 106,005$1,000,000 to $9,999,999 33,146 17,545 265,991$10,000,000 or more 47,999E 29,107 453,453All organizations 108,051 66,571 2,012,958
Number of paid staffNone … … 438,5421 to 4 6,003 3,560 658,0995 to 9 5,617 4,321 206,52810 to 24 9,704 6,257 100,83225 to 99 17,964 12,903 527,632100 or more 68,763 39,530 81,325All organizations 108,051 66,571 2,012,958
Number of volunteersNone 2,249 31 …1 to 9 6,108 3,937 16,20110 to 24 21,274 14,325 82,22525 to 99 29,272 15,351 305,559100 to 199 14,480 8,371 206,285200 or more 34,668E 24,557E 1,402,688All organizations 108,051 66,571 2,012,958
Note: In 2003, 2,012,958 volunteers in Manitoba, Saskatchewan and the territories contributed 300,651,590 volunteer hours. Nonprofit and volunteer organizationsemployed 174,622 people, who worked 267,237,546 employee hours.
Source: Statistics Canada, National Survey of Nonprofit and Voluntary Organizations.
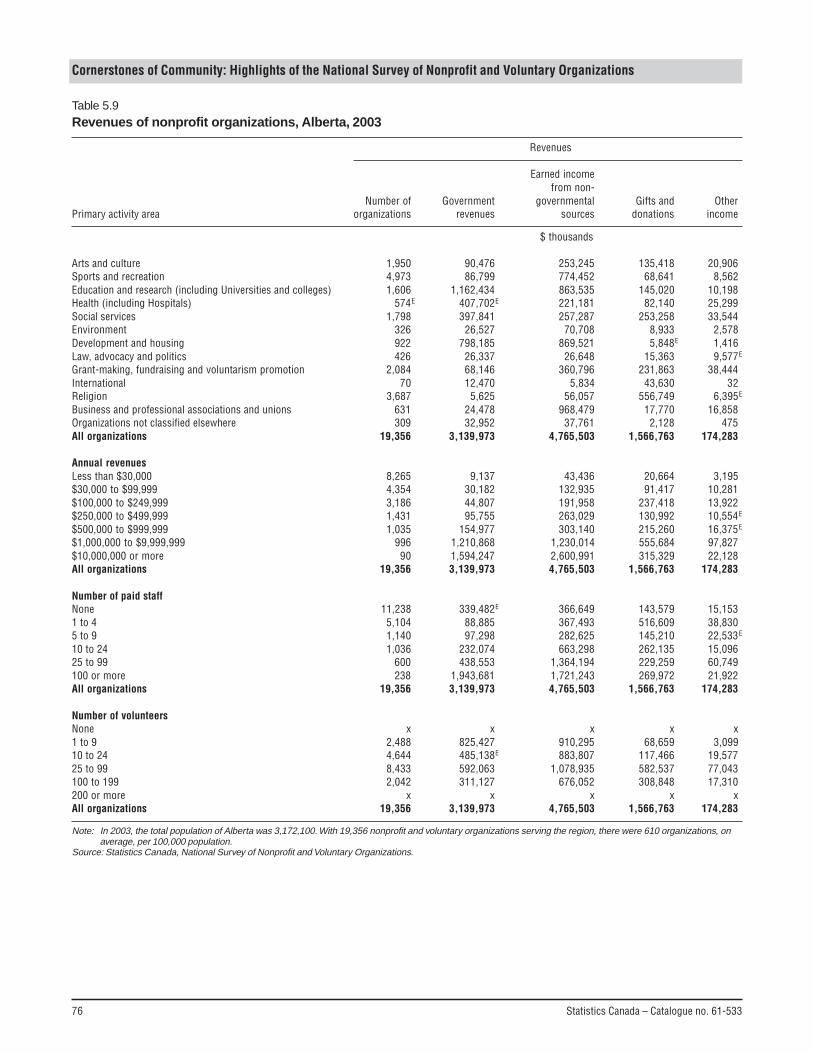
76 Statistics Canada – Catalogue no. 61-533
Cornerstones of Community: Highlights of the National Survey of Nonprofit and Voluntary Organizations
Table 5.9Revenues of nonprofit organizations, Alberta, 2003
Revenues
Earned incomefrom non-
Number of Government governmental Gifts and OtherPrimary activity area organizations revenues sources donations income
$ thousands
Arts and culture 1,950 90,476 253,245 135,418 20,906Sports and recreation 4,973 86,799 774,452 68,641 8,562Education and research (including Universities and colleges) 1,606 1,162,434 863,535 145,020 10,198Health (including Hospitals) 574E 407,702E 221,181 82,140 25,299Social services 1,798 397,841 257,287 253,258 33,544Environment 326 26,527 70,708 8,933 2,578Development and housing 922 798,185 869,521 5,848E 1,416Law, advocacy and politics 426 26,337 26,648 15,363 9,577E
Grant-making, fundraising and voluntarism promotion 2,084 68,146 360,796 231,863 38,444International 70 12,470 5,834 43,630 32Religion 3,687 5,625 56,057 556,749 6,395E
Business and professional associations and unions 631 24,478 968,479 17,770 16,858Organizations not classified elsewhere 309 32,952 37,761 2,128 475All organizations 19,356 3,139,973 4,765,503 1,566,763 174,283
Annual revenuesLess than $30,000 8,265 9,137 43,436 20,664 3,195$30,000 to $99,999 4,354 30,182 132,935 91,417 10,281$100,000 to $249,999 3,186 44,807 191,958 237,418 13,922$250,000 to $499,999 1,431 95,755 263,029 130,992 10,554E
$500,000 to $999,999 1,035 154,977 303,140 215,260 16,375E
$1,000,000 to $9,999,999 996 1,210,868 1,230,014 555,684 97,827$10,000,000 or more 90 1,594,247 2,600,991 315,329 22,128All organizations 19,356 3,139,973 4,765,503 1,566,763 174,283
Number of paid staffNone 11,238 339,482E 366,649 143,579 15,1531 to 4 5,104 88,885 367,493 516,609 38,8305 to 9 1,140 97,298 282,625 145,210 22,533E
10 to 24 1,036 232,074 663,298 262,135 15,09625 to 99 600 438,553 1,364,194 229,259 60,749100 or more 238 1,943,681 1,721,243 269,972 21,922All organizations 19,356 3,139,973 4,765,503 1,566,763 174,283
Number of volunteersNone x x x x x1 to 9 2,488 825,427 910,295 68,659 3,09910 to 24 4,644 485,138E 883,807 117,466 19,57725 to 99 8,433 592,063 1,078,935 582,537 77,043100 to 199 2,042 311,127 676,052 308,848 17,310200 or more x x x x xAll organizations 19,356 3,139,973 4,765,503 1,566,763 174,283
Note: In 2003, the total population of Alberta was 3,172,100. With 19,356 nonprofit and voluntary organizations serving the region, there were 610 organizations, onaverage, per 100,000 population.
Source: Statistics Canada, National Survey of Nonprofit and Voluntary Organizations.
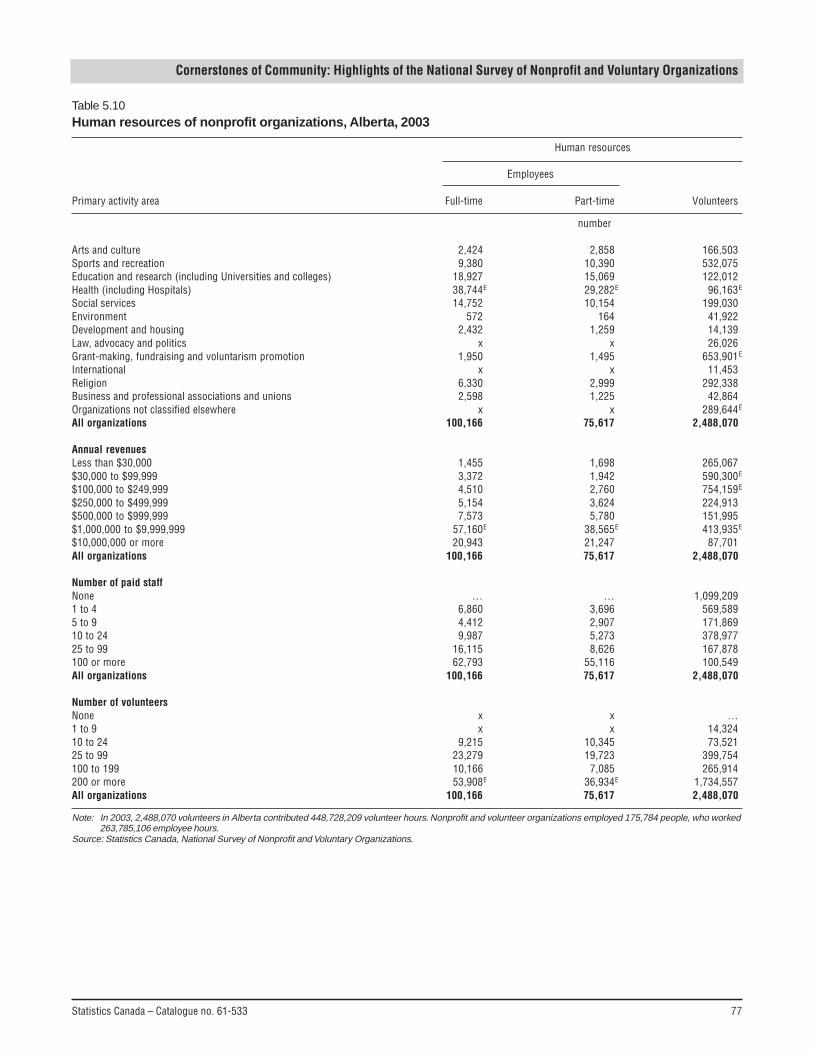
Statistics Canada – Catalogue no. 61-533 77
Cornerstones of Community: Highlights of the National Survey of Nonprofit and Voluntary Organizations
Table 5.10Human resources of nonprofit organizations, Alberta, 2003
Human resources
Employees
Primary activity area Full-time Part-time Volunteers
number
Arts and culture 2,424 2,858 166,503Sports and recreation 9,380 10,390 532,075Education and research (including Universities and colleges) 18,927 15,069 122,012Health (including Hospitals) 38,744E 29,282E 96,163E
Social services 14,752 10,154 199,030Environment 572 164 41,922Development and housing 2,432 1,259 14,139Law, advocacy and politics x x 26,026Grant-making, fundraising and voluntarism promotion 1,950 1,495 653,901E
International x x 11,453Religion 6,330 2,999 292,338Business and professional associations and unions 2,598 1,225 42,864Organizations not classified elsewhere x x 289,644E
All organizations 100,166 75,617 2,488,070
Annual revenuesLess than $30,000 1,455 1,698 265,067$30,000 to $99,999 3,372 1,942 590,300E
$100,000 to $249,999 4,510 2,760 754,159E
$250,000 to $499,999 5,154 3,624 224,913$500,000 to $999,999 7,573 5,780 151,995$1,000,000 to $9,999,999 57,160E 38,565E 413,935E
$10,000,000 or more 20,943 21,247 87,701All organizations 100,166 75,617 2,488,070
Number of paid staffNone … … 1,099,2091 to 4 6,860 3,696 569,5895 to 9 4,412 2,907 171,86910 to 24 9,987 5,273 378,97725 to 99 16,115 8,626 167,878100 or more 62,793 55,116 100,549All organizations 100,166 75,617 2,488,070
Number of volunteersNone x x …1 to 9 x x 14,32410 to 24 9,215 10,345 73,52125 to 99 23,279 19,723 399,754100 to 199 10,166 7,085 265,914200 or more 53,908E 36,934E 1,734,557All organizations 100,166 75,617 2,488,070
Note: In 2003, 2,488,070 volunteers in Alberta contributed 448,728,209 volunteer hours. Nonprofit and volunteer organizations employed 175,784 people, who worked263,785,106 employee hours.
Source: Statistics Canada, National Survey of Nonprofit and Voluntary Organizations.
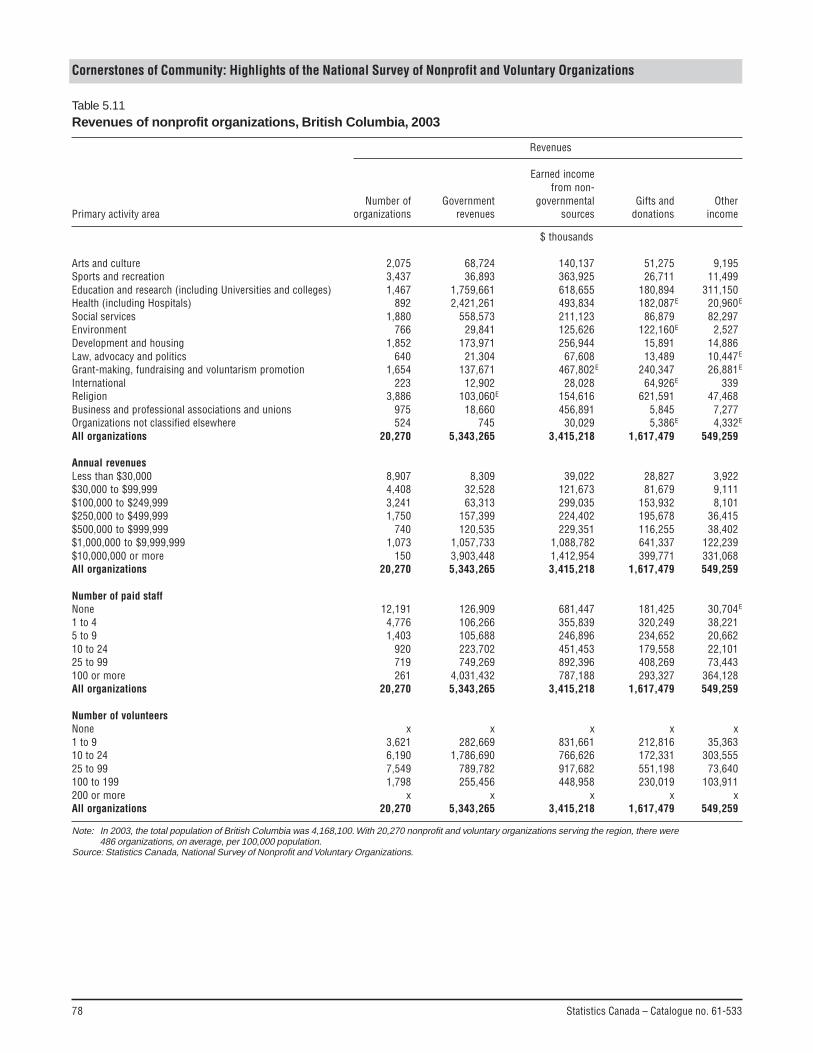
78 Statistics Canada – Catalogue no. 61-533
Cornerstones of Community: Highlights of the National Survey of Nonprofit and Voluntary Organizations
Table 5.11Revenues of nonprofit organizations, British Columbia, 2003
Revenues
Earned incomefrom non-
Number of Government governmental Gifts and OtherPrimary activity area organizations revenues sources donations income
$ thousands
Arts and culture 2,075 68,724 140,137 51,275 9,195Sports and recreation 3,437 36,893 363,925 26,711 11,499Education and research (including Universities and colleges) 1,467 1,759,661 618,655 180,894 311,150Health (including Hospitals) 892 2,421,261 493,834 182,087E 20,960E
Social services 1,880 558,573 211,123 86,879 82,297Environment 766 29,841 125,626 122,160E 2,527Development and housing 1,852 173,971 256,944 15,891 14,886Law, advocacy and politics 640 21,304 67,608 13,489 10,447E
Grant-making, fundraising and voluntarism promotion 1,654 137,671 467,802E 240,347 26,881E
International 223 12,902 28,028 64,926E 339Religion 3,886 103,060E 154,616 621,591 47,468Business and professional associations and unions 975 18,660 456,891 5,845 7,277Organizations not classified elsewhere 524 745 30,029 5,386E 4,332E
All organizations 20,270 5,343,265 3,415,218 1,617,479 549,259
Annual revenuesLess than $30,000 8,907 8,309 39,022 28,827 3,922$30,000 to $99,999 4,408 32,528 121,673 81,679 9,111$100,000 to $249,999 3,241 63,313 299,035 153,932 8,101$250,000 to $499,999 1,750 157,399 224,402 195,678 36,415$500,000 to $999,999 740 120,535 229,351 116,255 38,402$1,000,000 to $9,999,999 1,073 1,057,733 1,088,782 641,337 122,239$10,000,000 or more 150 3,903,448 1,412,954 399,771 331,068All organizations 20,270 5,343,265 3,415,218 1,617,479 549,259
Number of paid staffNone 12,191 126,909 681,447 181,425 30,704E
1 to 4 4,776 106,266 355,839 320,249 38,2215 to 9 1,403 105,688 246,896 234,652 20,66210 to 24 920 223,702 451,453 179,558 22,10125 to 99 719 749,269 892,396 408,269 73,443100 or more 261 4,031,432 787,188 293,327 364,128All organizations 20,270 5,343,265 3,415,218 1,617,479 549,259
Number of volunteersNone x x x x x1 to 9 3,621 282,669 831,661 212,816 35,36310 to 24 6,190 1,786,690 766,626 172,331 303,55525 to 99 7,549 789,782 917,682 551,198 73,640100 to 199 1,798 255,456 448,958 230,019 103,911200 or more x x x x xAll organizations 20,270 5,343,265 3,415,218 1,617,479 549,259
Note: In 2003, the total population of British Columbia was 4,168,100. With 20,270 nonprofit and voluntary organizations serving the region, there were486 organizations, on average, per 100,000 population.
Source: Statistics Canada, National Survey of Nonprofit and Voluntary Organizations.
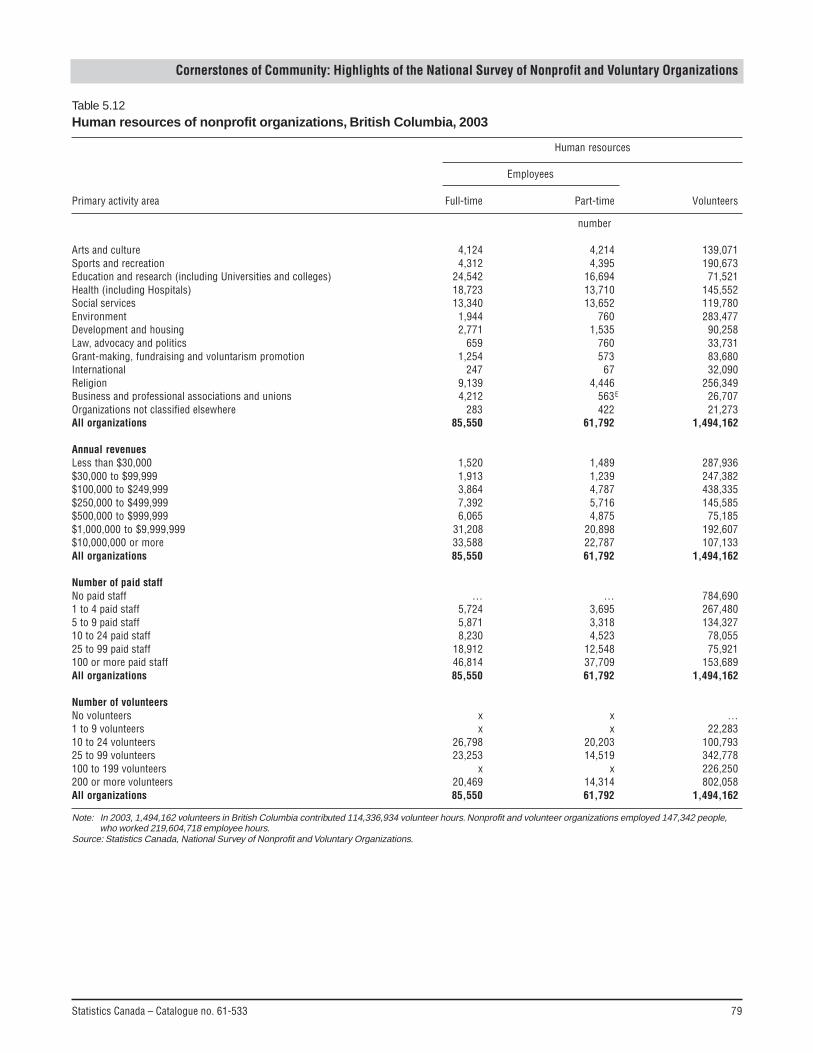
Statistics Canada – Catalogue no. 61-533 79
Cornerstones of Community: Highlights of the National Survey of Nonprofit and Voluntary Organizations
Table 5.12Human resources of nonprofit organizations, British Columbia, 2003
Human resources
Employees
Primary activity area Full-time Part-time Volunteers
number
Arts and culture 4,124 4,214 139,071Sports and recreation 4,312 4,395 190,673Education and research (including Universities and colleges) 24,542 16,694 71,521Health (including Hospitals) 18,723 13,710 145,552Social services 13,340 13,652 119,780Environment 1,944 760 283,477Development and housing 2,771 1,535 90,258Law, advocacy and politics 659 760 33,731Grant-making, fundraising and voluntarism promotion 1,254 573 83,680International 247 67 32,090Religion 9,139 4,446 256,349Business and professional associations and unions 4,212 563E 26,707Organizations not classified elsewhere 283 422 21,273All organizations 85,550 61,792 1,494,162
Annual revenuesLess than $30,000 1,520 1,489 287,936$30,000 to $99,999 1,913 1,239 247,382$100,000 to $249,999 3,864 4,787 438,335$250,000 to $499,999 7,392 5,716 145,585$500,000 to $999,999 6,065 4,875 75,185$1,000,000 to $9,999,999 31,208 20,898 192,607$10,000,000 or more 33,588 22,787 107,133All organizations 85,550 61,792 1,494,162
Number of paid staffNo paid staff … … 784,6901 to 4 paid staff 5,724 3,695 267,4805 to 9 paid staff 5,871 3,318 134,32710 to 24 paid staff 8,230 4,523 78,05525 to 99 paid staff 18,912 12,548 75,921100 or more paid staff 46,814 37,709 153,689All organizations 85,550 61,792 1,494,162
Number of volunteersNo volunteers x x …1 to 9 volunteers x x 22,28310 to 24 volunteers 26,798 20,203 100,79325 to 99 volunteers 23,253 14,519 342,778100 to 199 volunteers x x 226,250200 or more volunteers 20,469 14,314 802,058All organizations 85,550 61,792 1,494,162
Note: In 2003, 1,494,162 volunteers in British Columbia contributed 114,336,934 volunteer hours. Nonprofit and volunteer organizations employed 147,342 people,who worked 219,604,718 employee hours.
Source: Statistics Canada, National Survey of Nonprofit and Voluntary Organizations.