how to read a financial statement
TRANSCRIPT

How To Read A Financial Statement
ECONOMIC EDUCATION BULLETIN
Published by
AmeRicAn inSTiTuTe for economic ReSeARcH
Great Barrington, massachusetts

Economic Education Bulletin (iSSn 0424–2769) (uSPS 167–360) is published once a month at Great Barrington, massachusetts, by American institute for economic Research, a scientific and educational organization with no stockholders, chartered under chapter 180 of the General Laws of massachusetts. Periodical postage paid at Great Barrington, massachusetts and additional offices. Printed in the united States of America. PoSTmAS-TeR: Send address changes to Economic Education Bulletin, American institute for eco-nomic Research, Great Barrington, massachusetts 01230.
ECONOMIC EDUCATION BULLETIN
Vol. XLVIII No. 8 August 2008Copyright © 2008 American Institute for Economic Research
iSBn-13: 978-0-913610-63-3
About AIER
American institute for economic Research (AieR) conducts independent, scientific, economic research to educate individuals, thereby advancing their personal interests and those of the nation.
The institute, founded in 1933, represents no fund, concentration of wealth, or other special interests. Advertising is not accepted in its pub-lications. Financial support for the institute is provided primarily by the small annual fees from several thousand sustaining members, by receipts from sales of its publications, by tax-deductible contributions, and by the earnings of its wholly owned investment advisory organization, American investment Services, inc. experience suggests that information and advice on economic subjects are most useful when they come from a source that is independent of special interests, either commercial or political.
The provisions of the charter and bylaws ensure that neither the institute itself nor members of its staff may derive profit from organizations or busi-nesses that happen to benefit from the results of institute research. institute financial accounts are available for public inspection during normal working hours of the institute.
Web: www.aier.org Email: [email protected]

i
FOREWORD
AmeRicAn institute for economic Research first published How
to Read a Financial Statement in 1993. Since then major stories
of accounting problems, irregularities, and alleged fraud have
periodically erupted in the national news. most notably, the enron scandal
led to the collapse of that energy company (one of the largest bankruptcies
in u.S. history) and the dissolution of its accounting firm, Arthur Andersen
(then one of the “Big Five” accounting firms). These and other accounting
scandals led congress in 2002 to enact the Sarbanes-oxley Act in an effort
to strengthen corporate accounting controls.
These developments underscore the importance of understanding finan-
cial statements. While fraud is relatively rare and, by definition, difficult to
detect, financial statements can reveal the problems that more commonly
affect businesses and organizations—poor performance, shrinking sales,
rising costs, questionable management decisions, etc. conversely, they can
provide assurance that resources are being used well and profitably.
Kenneth m. Lefkowitz, who prepared the original edition, covered the
essential information you need to understand financial statements. This
edition was prepared by R.D. norton and includes a complete update of
the sample statements and related analysis, as well as two new chapters that
cover the enron-era accounting scandals, Sarbanes-oxley, and accounting
issues raised by the subprime mortgage mess.
The primary purpose of this book, however, is not to study accounting
scandals, but to help the reader understand how to read financial statements.
We hope it will prove useful to anyone who desires to learn more about
how to use such statements to evaluate the activities and financial standing
of businesses, nonprofits, and other organizations.
—Kerry A. Lynch
Director of Research and education

ii

iii
Contents
FOREWORD .............................................................................. i
I. WHY READ A FINANCIAL STATEMENT? ......................... 1
The Auditors’ Report ........................................................................ 2
II. THE BALANCE SHEET ........................................................... 9
Assets and Valuation ...................................................................... 10
Types of Assets ............................................................................... 12
Liabilities ........................................................................................ 16
equity ............................................................................................. 18
III. ANALYSIS OF THE BALANCE SHEET ............................... 23
Ratio Analysis ................................................................................ 28
capital Structure ............................................................................. 30
IV. THE INCOME STATEMENT .................................................. 35
Accrual Accounting ........................................................................ 36
earnings per Share ......................................................................... 41
Statements of equity and net Assets ............................................. 43
V. ANALYSIS OF THE INCOME STATEMENT ....................... 47
Profit margins ................................................................................. 47
Horizontal Analysis ........................................................................ 49
Ratio Analysis ................................................................................ 49
The operating cycle and Short-Term Solvency ............................ 55
Turnover, efficiency, and Flexibility .............................................. 58
Long-Term Solvency ...................................................................... 59
Leverage and Return on investment ............................................... 62
Shareholder Returns ....................................................................... 65
VI. THE CASH FLOW STATEMENT ........................................... 69
cash Flows from operations .......................................................... 71
cash Flows from investing and Financing ..................................... 73
VII. ANALYSIS OF THE CASH FLOW STATEMENT ................ 77
earnings Quality and operating cash Flows ................................. 77
Solvency and Financing cash Flows .............................................. 82
cash Flow Adequacy ...................................................................... 84
earnings Quality, cash Flow, and enron ....................................... 86

iv
VIII. ACCOUNTING FRAUD: ENRON’S LINGERING SHADOW . 89
“managed earnings”: Why companies Routinely
massage the Books ...................................................................... 90
Tricks of the Trade ......................................................................... 90
The Accounting Fraud crisis of 2001 and 2002 ............................ 92
enron, the Sec, and mark-to-market Valuation ............................ 95
Where Were the Auditors? ............................................................. 97
Reasonable—not Absolute—Assurance ...................................... 98
What Did the Sarbanes-oxley Act Do? .......................................... 99
Backdated Stock options: oK as Long as They Are expensed ... 100
IX. ACCOUNTING IN THE SUBPRIME MELTDOWN ............ 103
Too much of a Good Thing: From Securitization to
Liquidity Puts ............................................................................ 103
easy money, January 2002-July 2004 .......................................... 105
Throwing caution to the Wind: countrywide, 2004-2007........... 106
What About the Auditors? ............................................................ 107
Write-Downs: Global Reach ........................................................ 109
The Bond-Rating Agencies: Building a House of cards ............. 110
Where Were the Bank Regulators? ............................................... 112
Do Regulators contribute to Financial crises? ............................ 113
new Rules for Banks? .................................................................. 114
GLOSSARY ................................................................................ 117

1
I.
WHY READ A FINANCIAL STATEMENT?
You got to know when to hold ‘em,
Know when to fold ‘em…
—The Gambler (D. Schlitz)
A financial statement quantifies an enterprise’s activities and resources
in units of currency. The four standard statements are the balance
sheet, the income statement, the statement of cash flows, and the
statement of owners’ equity. enterprises prepare financial statements at
regular intervals, typically quarterly, to furnish managers, owners, credi-
tors, and other interested parties with timely feedback about the results of
their activities. in short, financial statements help to distinguish the winners
from the losers.
With some analysis, a set of financial statements allows the reader to
determine an enterprise’s solvency and, if it is a business (rather than a
nonprofit organization), its profitability. These determinations are crucial
for the smooth functioning of the market economy, because they allow
investors, lenders, entrepreneurs, and employees to direct their talents and
financial resources toward the most rewarding opportunities, and away
from the losers. The ongoing redirection of resources rewards successful
managers, prompts poor performers to mend their ways, and minimizes the
damage caused by the incompetents. Whenever this feedback is impeded,
profitable opportunities go unexploited for lack of financing, and small er-
rors of judgment compound into expensive debacles. Financial statements
therefore are important decision-making tools.
Financial statements are products of the accounting process, which be-
gins with simple bookkeeping, the maintenance of records of cash receipts
and outlays. Bookkeeping records, such as the “trial balance,” are seldom
sufficient to provide useful information. Accounting involves the classifi-
cation of an enterprise’s transactions by management to produce financial
statements. As such, its effectiveness depends on the rules that guide the
accounting process, which vary from country to country. Where the rules
are lax, enterprises can retain the confidence of investors and creditors while
obscuring profitability and solvency problems. Lax rules also allow busi-

2
nesses to satisfy the tax authorities while obscuring unusual profitability. By
forcing enterprises to acknowledge problems promptly, strict rules ensure
that accounting produces accountability.
This book covers financial statements prepared under Generally Accepted
Accounting Principles (GAAP), the set of rules that govern accounting
practices in the united States. much like the common law, GAAP is an
evolving set of rules that is heavily influenced by practical considerations.
Since 1917, several professional and regulatory bodies have contributed to
the codification of GAAP, although much of it is not codified outside of ac-
counting textbooks. Since 1973, the Financial Accounting Standards Board
(FASB) has been the principal arbiter of GAAP, although the Securities and
exchange commission (Sec), the American institute of certified Public
Accountants (AicPA), and other organizations make major contributions
to its continuing evolution.
Like any product of evolution, GAAP has few aspects that are settled,
and many warts and blemishes. its principles afford accountants consider-
able discretion, and accounting practice is a battleground for the competing
interests of managers, investors, regulators, auditors, and others. Generally
contested accounting principles might be a more accurate label, given the
current state of affairs.
The Auditors’ Report
Readers of financial statements still have no assurance that a set of state-
ments complies with those rules unless independent public accountants
have audited it. in an American audit, the independent accountants examine
an enterprise’s records and procedures to determine whether the financial
statements conform to GAAP. The auditors themselves must proceed in
accordance with generally accepted auditing standards, which require,
among other procedures, basic tests of the integrity of an enterprise’s books.
Auditors advise management of any fraud, embezzlement, or the possibili-
ties thereof that are discovered; but contrary to popular belief, this is not
their main purpose. That, once again, is to certify that the management’s
accounting is in accordance with GAAP.
By law, financial statements in the annual reports of publicly held cor-
porations must be audited, but the statements of other enterprises are less
likely to be audited, and statements in corporate quarterly reports generally
are not audited. in the absence of an audit, there is no reasonable assurance

3
that a set of financial statements is reliable. every set of audited financial
statements includes the auditors’ report, which notes whether or not the
statements are fair presentations that conform to GAAP.
Following the checklist below, readers of financial statements always
should turn to the auditors’ report first, before proceeding to the financial
statements themselves.
A Checklist
Always remember that financial statements say what managements
want to tell you. There is considerable leeway, even within GAAP. Before
you begin any of the analyses described in the various chapters of this
booklet, we suggest that you first complete the following steps:
1. Read the auditors’ report to determine whether or not it is “clean.” If
the auditors mention items that limit the usefulness of the statements
or that violate GAAP, review those items thoroughly.
2. Read the notes to the financial statements, paying particular attention
to the organizing principles of the report (this note usually appears
first), so that you understand what is and is not included.
3. Scan the asset side of the balance sheet to see if there are any intan-
gibles listed, such as goodwill. The economic value of such assets may
be questionable. Also on the asset side, check to see if marketable
items, such as inventories and securities, are carried at their current
market value. If, instead, they are shown at cost, make appropriate
adjustments if their market values are disclosed elsewhere.
4. Scan the liabilities for unusual items. Pay particular attention to the
structure of long-term debt, including the current portion, and to
commitments and contingencies, if any. Fund balances or equity may
have to be adjusted to reflect any questionable asset values found in
step 3. Also, for nonprofits, note the extent to which fund balances
are restricted, and why.
5. Review the cash flow statement. The additions to, and especially the
deductions from, operating cash flows from non-cash items can provide
valuable clues to unusual accounting practices requiring further scrutiny.
Investing and financing activities may reflect important events that are
not immediately evident on the balance sheet and income statement.

4
Because “clean” opinions, indicating that the auditors have found that the
management’s statements conform to GAAP, are valuable in relationships
with investors and creditors, most management will accept adjustments
suggested by auditors. By the same token, because auditors usually are
hired and fired by management, auditors usually will accept management’s
figures, unless they fall outside the latitude permitted by GAAP. Accordingly,
readers of financial statements should pay close attention to any qualifica-
tions and explanations included in the auditors’ opinion. These can serve
as a guide to significant problems that management may be attempting to
minimize, or even to portray favorably.
The FASB has set forth highly specific guidelines governing the con-
tents of auditors’ reports. As a result, all reports that affirm the reliability
of financial statements consist of the same boilerplate language. The stan-
dard report, as shown at right, contains an introductory paragraph, a scope
paragraph, and an opinion paragraph. if the auditors’ report contains just
these three paragraphs, and if the opinion paragraph is unqualified, then the
reader can proceed to the financial statements themselves with a “reasonable
assurance” that the statements are reliable. Readers of financial statements
should understand, however, the difference between reasonable assurance
and absolute assurance. only the former is provided by a clean audit.
An unqualified opinion affirms that the financial statements are fair pre-
sentations in all material respects and that they conform to GAAP. There
are many cases of auditors being defrauded, but it takes a substantial effort
to obtain an unqualified opinion on books that have been “cooked.” Still,
as the enron and other accounting scandals of the early 2000s show, it can
happen. (See chapter Viii for examples, some of which include complicity
by the auditors themselves.)
if the opinion paragraph contains language that differs from the example
at right, the opinion is qualified. Qualified opinions usually indicate serious
doubts about the reliability of the financial statements. Problems with the
audited enterprise’s practices and limitations in the scope of the audit both
can give rise to qualifications. Particularly serious forms of qualification
include disclaimers, in which the auditors lack sufficient evidence to express
an opinion on the financial statements, and adverse opinions, which indicate
material departures from GAAP.
An explanatory paragraph detailing the reasons for qualification usu-
ally follows a qualified opinion, but explanatory paragraphs do not always

5
Report of Independent Public Accountants
To the Shareholders of International Paper Company:
We have audited the accompanying consolidated
balance sheets of International Paper Company and
subsidiaries (the “Company”) as of December 31, 2006
and 2005, and the related consolidated statements of
operations, changes in shareholders’ equity, and cash
flows for each of the three years in the period ended
December 31, 2006. These financial statements are
the responsibility of the Company’s management. Our
responsibility is to express an opinion on the financial
statements based on our audits.
We conducted our audits in accordance with stan-
dards of the Public Company Accounting Oversight
Board (United States). Those standards require that we
plan and perform the audit to obtain reasonable assur-
ance about whether the financial statements are free of
material misstatement. An audit includes examining,
on a test basis, evidence supporting the amounts and
disclosures in the financial statements. An audit also
includes assessing the accounting principles used and
significant estimates made by management, as well as
evaluating the overall financial statement presentation.
We believe that our audits provide a reasonable basis
for our opinion.
In our opinion, such consolidated financial state-
ments present fairly, in all material respects, the fi-
nancial position of International Paper Company and
subsidiaries as of December 31, 2006 and 2005, and
the results of their operations and their cash flows for
each of the three years in the period ended December
31, 2006, in conformity with accounting principles
generally accepted in the United States of America.
opinionparagraph
scopeparagraph
introductoryparagraph

6
As discussed in Notes 4, 15 and 16 to the con-
solidated financial statements, the Company adopted
Statement of Financial Accounting Standards No. 158,
“Employers’ Accounting for Defined Benefit Pension
and Other Postretirement Plans – an amendment of
FASB Statements No. 87, 88, 106, and 132(R),” effec-
tive December 31, 2006. As discussed in Notes 1, 4
and 17 to the consolidated financial statements, the
Company adopted Statement of Financial Accounting
Standards No. 123 (R), “Share-Based Payment,” effec-
tive January 1, 2006.
We have also audited, in accordance with the stand-
ards of the Public Company Accounting Oversight
Board (United States), the effectiveness of the Com-
pany’s internal control over financial reporting as of
December 31, 2006, based on the criteria established
in Internal Control – Integrated Framework issued by
the Committee of Sponsoring Organizations of the
Treadway Commission and our report dated Febru-
ary 26, 2007 expressed an unqualified opinion on
management’s assessment of the effectiveness of the
Company’s internal control over financial reporting
and an unqualified opinion on the effectiveness of the
Company’s internal control over financial reporting.
[Deloitte/Touche LLP]
Memphis, Tennessee
February 26, 2007
nonstandardexplanatory
paragraph
Adapted from International Paper Annual Report for 2006 (Memphis, TN: International Paper Company, 2007), p. 47.
opinion oncompany
accountingcontrols

7
indicate qualifications. The example in this chapter is a case in point: the
opinion is “clean,” but it includes an explanatory paragraph. The most com-
mon reasons for adding an explanatory paragraph to an unqualified opinion
includes changes in accounting principles (in this case, regarding pension
funds) and changes in auditors. These changes are important, but they are
not likely to affect the reliability of financial statements. The reader should
be sure to ascertain the identity and reputation of the previous auditors (the
auditors’ report does not disclose these facts), and to determine the size of
the cumulative effects of changes in accounting principles, which appear
in the income statement.
Less common reasons for explanatory paragraphs include matters of
emphasis, material uncertainties, and going-concern problems. of these,
matters of emphasis are least likely to affect the reliability of financial state-
ments. Auditors often choose to emphasize an enterprise’s dealings at less
than arm’s length, with officers and their relatives, for example. material
uncertainties are matters that could have a significant future impact on the
financial statement, such as pending lawsuits, but which remain unresolved.
Going-concern problems arise when an enterprise is perilously close to
bankruptcy or insolvency, which can have a major impact on an enterprise’s
balance sheet.
material uncertainties and going-concern problems are red flags, and are
likely to affect the reliability of otherwise fairly presented financial state-
ments. The reader should examine closely the disclosures of these matters
in the notes to the financial statements.
The last paragraph is the auditors’ opinion on the probity of the com-
pany’s internal system of financial reporting. As recommended by the
Treadway commission some two decades ago, auditors now provide an
explicit opinion as to whether a company’s internal accounting procedures
appear to be transparent and above-board. in this example, the opinion is
unqualified, or clean.

8
INTERNATIONAL PAPER COMPANYConsolidated Balance Sheet
December 31, 2006
Assets
Current Assets: (in millions)
Cash and temporary investments, at cost $ 1,624
Accounts and notes receivable, less allowance of $85 2,704
Inventories 1,909
Other current assets, including assets and businesses for sale 2,400
Total Current Assets $ 8,637
Plants, Properties, and Equipment, net of depreciation 8,993
Forestlands 259
Investments 641
Goodwill 2,929
Deferred Charges and Other Assets 2,575
Total Assets $24,034
Liabilities and Common Shareholders’ Equity
Current Liabilities:
Notes payable and current maturities of long-term debt $ 692
Accounts payable 1,907
Accrued payroll and benefits 466
Other accrued liabilities 1,576
Total Current Liabilities $ 4,641
Long-Term Debt 6,531
Deferred Income Taxes 2,233
Minority Interest and Other Liabilities 2,666
Commitments and Contingent Liabilities _______
Total Liabilities $16,071
Common Shareholders’ Equity:
Common stock, $1 par value (493.3 shares issued) $ 493
Paid-in capital 6,735
Retained earnings, net of accumulated other comprehensive loss 2,173
Common stock held in treasury, at cost (39.8 shares) (1,438)
Total Common Shareholders’ Equity $ 7,963
Total Liabilities and Common Shareholders’ Equity $24,034
Adapted from International Paper Annual Report for 2006 (Memphis, TN: Inter-
national Paper, 2007), p. 50. The notes on pp. 54-88 of the Annual Report are an
integral part of the original statement.

9
II.
THE BALANCE SHEET
A balance sheet provides a snapshot of an enterprise’s financial
position on a given date. it lists the values of the enterprise’s
assets, liabilities, and equity on that date, usually the end of an ac-
counting period. in the united States, a balance sheet customarily lists assets
first, followed by liabilities and then equity (for businesses) or net assets (for
nonprofit organizations). As the example at left shows, a balance sheet is a
highly condensed enumeration of an enterprise’s accounts. The published
balance sheet of a large corporation compresses the balances of thousands of
individual accounts into roughly 30 numbers. (Synonyms for balance sheet
include statement of financial condition, statement of condition, statement
of financial position, and statement of assets and liabilities.)
By law, balance sheets that appear in the annual reports of publicly traded
corporations must be comparative balance sheets, which show the values
of each line item at the end of two comparable accounting periods. many
enterprises not subject to this law also provide comparative balance sheets.
The example at left is adapted from an annual report, but for the sake of
simplicity it reports values for only one date.
The example follows the customary practice among businesses of pre-
senting financial statements on a consolidated basis, which means that the
accountants have added together the positions of all of the enterprise’s
subsidiaries and divisions to produce a total for the whole enterprise for
each line item. The usual practice among nonprofit enterprises is to report
the positions of various funds, which segregate the assets, liabilities, and
net assets attributable to the major activities of the organization. many
nonprofits also report consolidated totals.
The balance sheet is so named because it balances an enterprise’s assets
against the two categories of claims on those assets, liabilities and equity
(net assets). All balance sheets balance because equity (net assets) is a re-
sidual — by definition it is the difference between assets and liabilities:
(1) equity = assets – liabilities
Legally, the owners of a business hold an equity interest, a claim to that

10
portion of assets left over after the business has settled all claims held by
outsiders. The claims held by outsiders are liabilities. A nonprofit organi-
zation, which has no owners, holds a claim on its own net assets, which it
computes in the same way that a business computes equity:
(2) net assets = assets – liabilities
A rearrangement of equation (1) gives the fundamental equation of ac-
counting:
(3) assets = liabilities + equity
This fundamental equation illustrates the balance in the balance sheet. The
two sides of the equation represent the two main sections of every balance
sheet. “Assets” in the equation corresponds to
Total Assets..................................................................................................$24,034
in the example. Similarly, “liabilities + equity” corresponds to
Total Liabilities and Common Shareholders’ Equity ....................................$24,034.
As promised, the amounts on both lines are equal.
Assets and Valuation
The economic resources that an enterprise controls are its assets. Such
resources can be physical (inventory and equipment, for example), technical
(patented designs and processes, software, trademarks), or financial (cash,
notes receivable, etc.). The main characteristic of assets is that an enterprise
can exchange them for cash or use them to generate cash inflows indirectly.
Although such cash flows are prospective, assets themselves are not.
The value of an asset as stated on the balance sheet is its “carrying value.”
in general, a balance sheet carries assets at their cost to the enterprise. The
primary advantage of using this “cost principle” of valuation is that cost
is easy to determine compared to, say, appraised value, market value (es-
pecially when there is no active market in an asset), and replacement cost.
There are, however, many exceptions to the cost principle. if an asset has

11
a readily ascertainable market value, for example, the lower-of-cost-or-
market rule requires an enterprise to carry the asset at market value (less
anticipated selling expenses) if that remains lower than the asset’s cost for
an extended period. Similarly, if an enterprise estimates that loss, damage,
theft, spoilage, default, or other mishaps have had a material effect on the
value of an asset, the enterprise must write down the carrying value of that
asset accordingly:
Accounts and notes receivable, less allowance of $85 2,704
The allowance in this example is an allowance for uncollectible accounts,
i.e., the amount of credit granted to customers that is estimated to be at risk
of default. international Paper holds outstanding receivables on $2,789 mil-
lion of sales, of which it estimates it will not collect $85 million, resulting
in a net realizable value of receivables of $2,704 million.
Assets that contribute to an enterprise’s operations over a useful life of
many accounting periods, such as buildings and equipment, require another
type of adjustment to historical cost. in order to match properly the revenue
generated in each accounting period with the expenses incurred to generate
that revenue, enterprises systematically allocate the costs of these types of
assets over an estimated useful life.
The generic term for this allocation of costs is “amortization.” The
amortization of the cost of buildings and equipment is depreciation, and
the amortization of the cost of acquiring natural resources is depletion. The
carrying value of an amortizable asset decreases during its estimated use-
ful life as an additional portion of its original cost is allocated to expenses
for each passing accounting period. The carrying value of such an asset on
any particular date is thus its original cost less the cumulative amortization
to date.
Despite the variety of adjustments to historical cost, the asset values that
a balance sheet reports often bear only a vague resemblance to replacement
costs or market values. one factor that figures significantly in the distortion
of balance sheet valuations is price inflation. As prices rise, the carrying
values of inventories, equity securities, land, equipment, and other types
of assets tend to become increasingly detached from current market condi-
tions. The carrying value of a parcel of land acquired 20 or 30 years ago can
differ dramatically from its resale value, for example. Although there are

12
strong practical justifications for an accounting system based on historical
costs, users of financial statements should be well aware of the ludicrous
valuations that such a system can produce.
even when cost is indisputably a sound basis for valuation, changing
prices still can produce difficulties in valuation. There are four acceptable
methods for valuing assets accumulated during a period of changing prices.
inventory valuation is the most common of these methods. enterprises that
hold inventories disclose the valuation method or methods that they use in
the notes to their financial statements.
in the case of retail inventories, the last-in, first-out (LiFo) method at-
tributes the unit prices of lots purchased most recently to sales for the latest
period, and uses the unit prices of earlier purchases to value the remaining
inventory. The first-in, first-out (FiFo) method takes just the opposite ap-
proach, valuing inventory at the unit prices of the most recently purchased
lots. The average-cost method values inventory at the weighted average
unit price of all lots purchased. Given the prevailing upward trend of prices,
LiFo produces lower valuations than the average-cost method, which in
turn produces lower valuations than FiFo. The fourth valuation method is
specific identification, in which the value of an inventory is the sum of the
costs of each individual item. This method is the norm for expensive, readily
identifiable items such as cars, jewelry, and machinery.
Types of Assets
A useful means of understanding the derivation and significance of bal-
ance sheet items, one seldom mentioned in the united States, is the Brit-
ish distinction between personal, real, and nominal accounts. All of the
entries on a balance sheet fall into one or another of these classifications.
The significance of these categories may not be intuitively obvious from
their names, however.
in this framework, personal accounts are simply what the accounting
entity owes to or is due from others. Such accounts include bank balances,
ious of all kinds, accounts payable and receivable, etc. What such items
have in common is that their value in terms of currency can be determined
with a degree of certainty, as when a depositor, borrower, customer or
supplier receives a letter from an auditor requesting “confirmation” of the
balance that the auditor has found on the books of the entity he or she is
auditing.

13
Real accounts, on the other hand, reflect an estimate of the value of
tangible assets such as inventories, land, buildings, and equipment. This
estimate is usually what the accounting entity paid to acquire the asset,
which may be markedly different from the economic value of the item
on the date of the balance sheet. Real accounts then are real in the sense
that they represent real things that the entity owns (you can touch or kick
them), but they can be quite “unreal” in terms of what an item might fetch
in the marketplace or what it is worth to the entity as a going concern. in
the instances of inventories and liquid securities, auditors often attempt to
determine current prices and indicate both the cost and the market values
on a balance sheet, but this seldom is done for non-depreciable assets such
as land or for investments in closely held affiliates, such as joint ventures.
Also, the accumulated depreciation on assets such as buildings or equip-
ment may or may not serve to adjust the reported costs of such items to
their current values.
nominal accounts reflect entries that are purely internal to the account-
ing entity, as when a period’s earnings are added to net worth or when the
accumulated depreciation is deducted from the cost of real assets. nominal
accounts often are deemed to be the most significant by financial analysts,
even though they are completely derivative and least connected to fact.
Another important classification of accounts is the distinction between
current and non-current items. current assets include (1) cash and (2) assets
that will be converted to cash within one year (or within the average duration
of one operating cycle, whichever is longer). A balance sheet lists current
assets in order of decreasing liquidity: cash always tops the list, and the asset
listed last is likely to take the most time and effort to convert to cash.
Current Assets: (in millions)
Cash and temporary investments, at cost $ 1,624
Accounts and notes receivable, less allowance of $85 2,704
Inventories 1,909
Other current assets, including assets and businesses for sale 2,400
Total Current Assets ................................................................................ $ 8,637
These are the assets that an enterprise liquidates regularly. An enterprise
does so by direct exchange of non-cash assets for cash, or by conversion of
non-cash assets to other current assets, which the enterprise then exchanges

14
for cash. examples of direct exchange transactions include the liquida-
tion of receivables, either by their sale to third parties or by the receipt of
cash from debtors, and cash sales of finished goods inventories. indirect
liquidations involve sequences of transactions, as when a manufacturer (a)
converts materials inventories and supplies into finished goods inventories,
which it then (b) exchanges for accounts receivable, which it eventually (c)
converts into cash.
in practice, not all current assets appear in the current assets section, and
not all assets that appear there are current. international Paper, for example,
does not list as a current asset the value of trees that it expects to harvest,
convert to paper, and sell within the next operating cycle. it lumps these
trees together with land and non-current trees in the “forestlands” account.
Similarly, oil companies do not list any portion of oil in the ground among
their current assets. in addition, no enterprise lists as a current asset the
portion of fixed assets expected to be used up during the next operating
cycle. non-current assets that appear in the current section include notes
receivable that mature in more than a year, supplies used to maintain fixed
assets, slow-moving and obsolete inventories, and insurance premiums paid
more than a year in advance.
non-current assets generate cash flows indirectly, but they do so over
the course of many operating cycles. They differ from current assets that
generate cash flows indirectly because an enterprise does not use up or
liquidate non-current assets completely in the course of normal operations.
This is not to say that enterprises do not liquidate long-term investments
or that equipment does not wear out or become obsolete. But enterprises
typically acquire investments and equipment with the intent of holding them
for many years. in recognition of these long holding periods, non-current
assets appear below current assets on the balance sheet,
Total Current Assets $ 8,637
Plants, Properties and Equipment, net of depreciation 8,993
Forestlands 259
Investments 641
Goodwill 2,929
Deferred Charges and Other Assets 2,575
Total Assets ............................................................................................. $24,034

15
even though some non-current assets, notably investments in marketable
securities, are as liquid as current assets.
There are two varieties of non-current assets. First, there are the physical
and technical assets that an enterprise actively uses to generate cash flows.
Second, there are financial assets, termed “investments,” that an enterprise
holds as a source of passive cash flows. The distinction between these two
varieties is not always clear, because enterprises can hold investments in
related enterprises in order to ensure smooth operations in their own lines
of business. manufacturers often hold stakes in their parts and raw materi-
als suppliers, for example. Such “synergy” is a common justification for
corporate acquisitions. (Also, financial businesses are another example in
which the distinction is unclear, because they may generate cash flows by
making loans to or investments in other businesses.)
Accounting for an enterprise’s investments in affiliated companies can
be complex, especially when the affiliated companies are not subsidiar-
ies. A “subsidiary” is a company in which the controlling enterprise owns
enough of the equity of that company to control the election of the board
of directors. Such a controlling interest generally consists of 50 percent or
more of the subsidiary’s voting stock. in most cases, enterprises consolidate
the assets and liabilities of subsidiaries in their published financial state-
ments. “consolidation” involves adding all the balances of a subsidiary’s
accounts to the comparable accounts of the parent and netting out the results
of transactions between parent and subsidiary. When an enterprise uses a
method other than consolidation, generally when accounting for a minority
interest in an affiliate, the enterprise counts its equity interest in the affiliate
under investments.
When an enterprise buys another business outright, it merges the asset and
liability accounts of the acquisition with its own, recording the acquisition’s
accounts at fair market value. This process is different from consolidation
because the acquisition does not maintain a separate set of accounting re-
cords after the merger —it is not a subsidiary. When the acquiring enterprise
pays more than the fair market value of the acquisition’s net identifiable
assets, it accounts for the excess payment as “goodwill.” net identifiable
assets are total assets less the sum of total liabilities and previously acquired
goodwill. Goodwill represents the acquiring enterprise’s recognition of the
acquisition’s potential for above-average earnings.

16
Liabilities
Liabilities are obligations that an enterprise has incurred in past transac-
tions. An enterprise settles liabilities by transferring assets, usually cash, to
its obligees or by using its assets to provide them with services. Liabilities
are thus claims on an enterprise’s assets. There are two important differences
between liabilities and equity. First, liabilities are claims held by outsiders,
whereas equity is the aggregate claim of a business’s owners. Second, the
amount of an enterprise’s liabilities is independent of the amount of its as-
sets, whereas the amount of equity depends on the amounts of assets and
liabilities both, as shown in equation (1) on page 9.
Priority for settlement is the guiding principle for ordering the items
in the bottom half of a balance sheet. Among liabilities, therefore, current
items appear first:
Current Liabilities:
Notes payable and current maturities of long-term debt $ 692
Accounts payable 1,907
Accrued payroll and benefits 466
Other accrued liabilities 1,576
Total Current Liabilities ............................................................................ $ 4,641
much like current assets, current liabilities are those that an enterprise
expects to settle within a year or within the average duration of one operating
cycle, whichever is longer. non-current liabilities, often called long-term
liabilities, are those an enterprise does not expect to settle within this time
frame. The placement of non-current liabilities reflects this lower prior-
ity:
Total Current Liabilities $ 4,641
Long-Term Debt 6,531
Deferred Income Taxes 2,233
Minority Interest and Other Liabilities 2,666
Commitments and Contingent Liabilities ______
Total Liabilities $ 16,071
most of a typical enterprise’s liabilities are obligations to pay cash. These
cash obligations fall into two categories. one is accrued expenses, which an

17
enterprise incurs by purchasing goods and services for which payment is
not due immediately. The second is outstanding debt, which an enterprise
incurs by borrowing cash.
most non-cash liabilities represent payments received in advance for
goods or services. By accepting advance payment for goods or services, a
business incurs an obligation to provide them. Stadiums, landlords, maga-
zines, and brain surgeons are examples of businesses that incur non-cash
liabilities for advance payments.
A different type of non-cash liability is “minority interest” in a sub-
sidiary. minority interest is the share of a subsidiary’s net assets that its
minority shareholders own. minority interest differs from other types of
liabilities because of its equity characteristics: the bankruptcy liquidation
of a subsidiary is the only situation that can force an enterprise to settle
its obligation to minority shareholders. The only other circumstances that
oblige an enterprise to settle with minority shareholders are those that the
enterprise itself initiates, either by buying out some or all of the minority
shareholders or by dissolving the subsidiary.
Deferred income taxes are similar to minority interest. Technically they
are obligations to pay cash, but in practice an enterprise is not likely ever
to have to settle the bulk of its deferred tax liabilities. Due to the pecu-
liarities of tax allocation, a subject too complex to explain here, deferred
income taxes grow or remain stable under most circumstances. Some bal-
ance sheets include an asset called “deferred income taxes,” but that item
represents prepaid income taxes. Although deferred income tax assets also
are a product of tax allocation, they should not be confused with deferred
income tax liabilities.
many enterprises include a line for “commitments and contingent li-
abilities” in the liabilities section of the balance sheet. unlike other line
items, this line does not report a dollar value, because commitments and
contingencies are not strictly liabilities. The reason for including the line
is to alert the reader to further disclosure of these items in the notes to the
financial statements. Commitments are agreements, usually formal contracts,
to transact business in the future. examples of commitments include pur-
chase orders, long-term purchase and supply contracts, lines of credit, and
employment contracts. Contingent liabilities are losses or obligations that
may result from past events or transactions, pending some future outcome
or decision. examples of contingent liabilities include loan guarantees and

18
pending litigation. These items are not liabilities because an enterprise
reporting them has yet to experience the transactions or events that would
create formal obligations.
Equity
As discussed at the beginning of this chapter, equity is the ownership
interest in the assets of a business, defined as the residual assets remaining
after all liabilities have been settled:
(1) equity = assets – liabilities
A nonprofit enterprise computes its net assets similarly, but net assets do
not constitute an ownership interest. in accounting terms, “book value” and
“capital” are synonyms for equity. Similarly, for nonprofits, “surplus” is a
synonym for net assets. “net worth” is used as a synonym for both equity
and net assets.
increases in the equity of a business come from two sources: income
and the contributions of owners. increases in the net assets of a nonprofit
enterprise also come from two sources: income and donations. Similarly,
there are two reasons for decreases in the equity of a business: losses and
distributions to owners. A nonprofit enterprise has no owners, so its net
assets decrease only when it incurs losses.
A business’s legal form of organization strongly influences the terms
of ownership of its equity. Hence the line items that appear in the equity
section of the business’s balance sheet largely reflect the legal form of
organization (proprietorship, partnership, or corporation). The balance
sheets of small partnerships include a line item for the accumulated equity
of each partner:
SMITH, DOE & JONES
Balance Sheet
December 31, 20__
Partners’ Capital:
J. Smith, capital $45,000
J. Doe, capital 23,000
T. Jones, capital 15,000
Total Partners’ Capital ............................................................................. $83,000
.

19
When there are so many partners that this form of presentation becomes
cumbersome, the balance sheet may report equity as a single line item. The
balance sheets of sole proprietorships also follow this form:
JOAN SMITH, M.D.
Balance Sheet
December 31, 20__
Total Liabilities $100,000
J. Smith, M.D., Capital 50,000
Total Liabilities and Proprietor’s Capital ...............................................$150,000
Partnerships and sole proprietorships that have accumulated substantial
losses may show deficits. in these two types of business, a deficit is simply
negative equity, which arises when total liabilities exceed total assets:
JOAN SMITH, M.D.
Balance Sheet
December 31, 20__
Total Liabilities. $125,000
J. Smith, M.D., Deficit (10,000)
Total Liabilities and Proprietor’s Capital $115,000
Returning to our international Paper company example, it is clear that
the stockholders’ equity section of a corporate balance sheet generally is
more complex than the foregoing examples:
Common Shareholders’ Equity:
Common stock, $1 par value (493.3 shares issued) $ 493
Paid-in capital 6,735
Retained earnings, net of accumulated other comprehensive loss 2,173
Common stock held in treasury, at cost (39.8 shares) (1,438)
Total Common Shareholders’ Equity $ 7,963
This example is representative of the standard form of a stockholders’
equity section, but the form of the section and the names of the line items
vary widely. A few corporations present stockholders’ equity as a line
item in their published balance sheets, just as a sole proprietor or a large

20
partnership would.
Par value, also called stated value, is a corporation’s legal minimum equity
position. A corporation’s directors cannot declare a dividend (dividends are
paid out of equity) that would reduce total equity below the total par value
of the corporation’s stock. This restriction rarely is a practical consideration,
and some states do not require a corporation to establish a par value for its
stock. each class of stock, if there is more than one, has its own per-share
par value. The total par value of a class of stock is simply the per-share par
value multiplied by the number of shares outstanding:
Common stock, $1 par value (493.3 shares issued) $ 493
nearly all stocks sell for much more than par value, so when a corporation
issues stock, it accounts for its receipts in excess of par value as paid-in
capital, also called additional paid-in capital and capital surplus.
international Paper has outstanding shares of only one type of common
stock. corporations that have more than one class of stock typically have one
or more classes of preferred stock, and some also offer several varieties of
common stock. Preferred stock is “preferred” as to dividends: a corporation
cannot pay a dividend on common stock if it is in arrears on its preferred
dividends. Preferred stock also takes priority over common stock in liqui-
dation proceedings. corporations use a wide variety of other features to
make preferred stocks attractive to investors. The most common is a fixed
dividend rate, which makes a preferred stock resemble a bond.
Some preferred stocks have a redemption value. Depending on the terms
of redemption, the combination of a fixed dividend rate and a redemption
provision may make a redeemable preferred issue indistinguishable from
a bond. if the consequences to the corporation of a failure to redeem are
sufficiently severe, the preferred issue will appear in the liabilities section
of the balance sheet—along with bonds per se.
To the extent that a corporation does not pay out all of its earnings as
dividends, it accumulates retained earnings, a component of equity. The use
of retained earnings is a common way for profitable corporations to expand
their operations. corporations that have suffered serious losses may show
a deficit, which denotes negative retained earnings, not negative equity.
Partnerships and sole proprietorships differ from corporations because they
do not distinguish between retained earnings and paid-in capital, so a deficit

21
for those types of business is simply negative equity.
The par value of one or more classes of stock, additional paid-in capital,
and retained earnings appear in the equity sections of nearly all corporate
balance sheets. many balance sheets also show some adjustments to the
total of these core equity items. The three most common adjustments are
treasury stock, a deduction related to employee stock ownership plans
(eSoPs), and a foreign currency translation adjustment.
Treasury stock is stock that a corporation has issued and subsequently
repurchased. The usual reasons for doing so are to administer dividend
reinvestment programs and to meet the conversion requests of holders of
convertible preferred stock and convertible bonds. Also, some corporations
announce stock buy-back programs to bolster investor confidence during
stock market declines. other reasons for share buy-backs include anticipat-
ing employee stock options, discouraging takeover attempts, getting ready
to go private, and preparing to acquire other companies.
corporations distinguish between treasury stock and stock that has been
authorized but not yet issued because usually it is much easier to resell
treasury stock than it is to issue new shares. Treasury stock appears on the
balance sheet as a deduction from equity. Absent other adjustments, total
shareholders’ equity is the amount allocable to outstanding shares (which
is the sum of the par value of stock, additional paid-in capital, and retained
earnings) less any holdings of treasury stock. When a corporation’s eSoP
purchases stock to distribute to employees, the corporation accounts for
the undistributed stock much like treasury stock, but it makes a separate
adjustment to equity. corporations account for treasury stock and eSoP
stock separately because the use of eSoP stock is restricted, whereas a
corporation can use treasury stock for any purpose.
When an enterprise’s financial statements include foreign subsidiaries
on a consolidated basis, the parent enterprise must report a cumulative for-
eign currency translation adjustment in the equity section of the balance
sheet. This adjustment is necessary because the accounting rules pertaining
to foreign subsidiaries require the parent to translate the equity accounts
of the subsidiary at a different exchange rate than that used for the asset
and liability accounts. The translation adjustment cumulates the resulting
discrepancies over time.
As to nonprofit enterprises, donations are a major source of increases in
their net assets. it is common for donors to place restrictions on the use of

22
donations. The line items in the net assets section of a nonprofit enterprise’s
balance sheet reflect the major categories of restrictions:
WESLEYAN UNIVERSITY
Balance Sheet
June 30, 2006
Fund Balances: (in thousands)
Unrestricted
Investment in plant $124,241
Other unrestricted 393,327
Total unrestricted $517,568
Temporarily restricted 92,510
Permanently restricted 127,604
Total net assets $737,682
Adapted from Annual Financial Report for the Year Ended June 30, 2006. (Middletown, CT:
Wesleyan University, 2006), p. 7.
in accounting terms, fund balances are roughly equivalent to net as-
sets, although the phrase “fund balances” refers to the subtotals for the
enterprise’s various funds (not shown) as well as to the consolidated total.
“net assets” refers strictly to the consolidated total. Presentation of the net
assets section can vary widely from that of the example above, because the
particular line items included depend on the activities, especially the fund-
raising activities, of the enterprise in question.

23
III.
ANALYSIS OF THE BALANCE SHEET
A single line item extracted from a financial statement imparts little in-
formation. even a whole financial statement typically contains just
30 numbers, although comparisons among the numbers produce
additional quantitative information. A current financial statement becomes
more valuable when the reader can compare it to statements from previous
accounting periods. The availability of multi-year financial statements for
other, comparable enterprises increases the value of each individual state-
ment even further. in general, the usefulness of a financial statement or any
other quantitative information hinges on what one analyst has called “…the
question at the heart of quantitative thinking: ‘compared to what?’”*
Analysis of a set of financial statements involves three types of compari-
sons. one concerns the relative sizes of items within a set of statements,
termed “vertical analysis.” The second is the changes over time in each
item and in the relative sizes of items, termed “horizontal analysis.” The
third is how the key financial measures of an enterprise compare to those
of similar enterprises or to industry averages. each of these three perspec-
tives also makes use of what are called “key ratios,” which compare one
amount to another.
The sample analysis of the international Paper balance sheet on the next
two pages illustrates the use of horizontal, vertical, and ratio analysis.†
Readers who are at ease with computers will find spreadsheet software to
be well-suited for preparing this type of analysis. The four-year horizontal
analysis in the table uses data the company is required to submit to the Sec in
annual “10K” reports, as drawn from the on-line Wall Street Journal, which
provides subscribers with such data on an annual and quarterly (“10Q”)
basis for hundreds of public companies. (The reports are also available
free at www.finance.yahoo.com.) When using several reports to prepare a
horizontal analysis, the analyst should be alert for restatements of previous
years’ results to reflect changes in accounting practices.
* Tufte, edward R., The Visual Display of Quantitative Information (cheshire, cT: Graph-ics Press, 1983), p. 74.† Having a photocopy of these two pages at hand will make the rest of this chapter easier to follow.

24
INTERNATIONAL PAPER COMPANY
Sample Analysis of Balance Sheet (in millions, except as noted, on December 31)
2003 2004 2005 2006 Assets $ 2,363 $ 2,180 $ 1,641 $ 1,624 Cash and Temporary Investments, at cost 2,765 2,743 2,416 2,704 Accounts and Notes Receivable, net 2,767 2,371 1,932 1,909 Inventories 3,201 5,292 5,770 2,400 Other Current Assets $11,096 $12,586 $11,759 $ 8,637 Total Current Assets ...................................................................................................... 13,260 12,216 9,073 8,993 Plants, Properties, and Equipment, net of depreciation 3,979 2,157 2,127 259 Forestlands 678 655 616 641 Investments 4,793 4,994 3,621 2,929 Goodwill 1,719 1,609 1,575 2,575 Deferred Charges and Other Assets $35,525 $34,217 $28,771 $24,034 Total Assets ...................................................................................................................... Liabilities and Common Shareholders’ Equity $ 2,087 $ 222 $ 1,178 $ 692 Notes Payable and Current Maturities of Long-Term Debt 2,188 2,026 1,771 1,907 Accounts Payable 445 425 351 466 Accrued Payroll and Benefits 2,550 4,661 1,655 1,576 Other Accrued Liabilities $ 7,270 $ 7,334 $ 4,955 $ 4,641 Total Current Liabilities ................................................................................................. 13,450 13,632 11,019 6,531 Long-Term Debt 1,387 1,118 684 2,233 Deferred Income Taxes 5,181 3,879 3,762 2,666 Minority Interest and Other Liabilities ________ ________ ________ ________ Commitments and Contingent Liabilities $27,288 $25,963 $20,420 $16,071 Total Liabilities .............................................................................................................. $ 485 $ 487 $ 491 $ 493 Common Stock, $1 par value 6,500 6,562 6,627 6,735 Paid-in Capital 1,392 1,205 1,237 2,173 Retained Earnings (140) (4) (1,438) Common Stock Held in Treasury, at cost $ 8,237 $ 8,254 $ 8,351 $ 7,963 Total Common Shareholders’ Equity $35,525 $34,217 $28,771 $24,034 Total Liabilities and Common Shareholders’ Equity ......................................................... Addenda $ 3,826 $ 5,252 $ 6,804 $ 3,996 Working Capital (current assets less current liabilities) 5,128 4,923 4,057 4,328 Quick Assets (cash, temporary investments, and receivables) 20,018 18,629 15,465 11,430 Long-Term Liabilities (total liabilities less current liabilities) 20,757 20,474 16,482 15,464 Market Value of Equity 485,162 487,495 490,501 493,340 Common Shares Issued (thousands). ............................................................................ 481,494 487,479 490,389 453,496 Common Shares Outstanding (thousands) $16.98 $16.93 $17.03 $16.14 Book Value per Common Share Issued 43.11 42.00 33.61 34.10 Market Value per Common Share Outstanding ............................................................ 1.53 1.72 2.37 1.86 Current Ratio 0.71 0.67 0.82 0.93 Quick Assets Ratio 0.77 0.76 0.71 0.67 Debt Ratio 3.31 3.15 2.45 2.02 Debt-Equity Ratio 0.71 0.69 0.65 0.59 Capitalization Ratio 2.43 2.26 1.85 1.44 Ratio of Long-Term Liabilities to Equity Adapted in part from International Paper Annual Report for 2006 (Memphis, TN: International Paper, 2007), p. 50. The notes on pp. 54-88 of the Annual Report are an integral part of the original statement.

25
As percentages of 2003 levels As fractions of total assets* (index numbers Annual(common-size statements) or trend percentages) percent changes
2003 2004 2005 2006 2004 2005 2006 2004 2005 20060.07 0.06 0.06 0.07 92% 69% 69% -7.7% -24.7% -1.0%0.08 0.08 0.08 0.11 99 87 98 -0.8 -11.9 11.90.08 0.07 0.07 0.08 86 70 69 -14.3 -18.5 -1.20.09 0.15 0.20 0.10 165 180 75 65.3 9.0 -58.4
......................................................................................................0.31 0.37 0.41 0.36 113 106 78 13.4 -6.6 -26.50.37 0.36 0.32 0.37 92 68 68 -7.9 -25.7 -0.90.11 0.06 0.07 0.01 54 53 7 -45.8 -1.4 -87.80.02 0.02 0.02 0.03 97 91 95 -3.4 -6.0 4.10.13 0.15 0.13 0.12 104 76 61 4.2 -27.5 -19.10.05 0.05 0.05 0.11 94 92 150 -6.4 -2.1 63.5
......................................................................................................................1.00 1.00 1.00 1.00 96 81 68 -3.7 -15.9 -16.5
0.06 0.01 0.04 0.03 11 56 33 -89.4 430.6 -41.30.06 0.06 0.06 0.08 93 81 87 -7.4 -12.6 7.70.01 0.01 0.01 0.02 96 79 105 -4.5 -17.4 32.80.07 0.14 0.06 0.07 183 65 62 82.8 -64.5 -4.8
.................................................................................................0.20 0.21 0.17 0.19 101 68 64 0.9 -32.4 -6.30.38 0.40 0.38 0.27 101 82 49 1.4 -19.2 -40.70.04 0.03 0.02 0.09 81 49 161 -19.4 -38.8 226.50.04 0.03 0.02 0.09 75 73 51 -25.1 -3.0 -29.1
____ ____ ____ ____ ..............................................................................................................0.77 0.76 0.71 0.67 95 75 59 -4.9 -21.3 -21.3
0.01 0.01 0.02 0.02 100 101 102 0.4 0.8 0.40.18 0.19 0.23 0.28 101 102 104 1.0 1.0 1.60.04 0.04 0.04 0.09 87 89 156 -13.4 2.7 75.7
(0.00) 0.00 (0.00) (0.06) 3 1,027 -100.0 35,850.00.23 0.24 0.29 0.33 100 101 97 0.2 1.2 -4.6
.........................................................1.00 1.00 1.00 1.00 96 81 68 -3.7 -15.9 -16.5
0.11 0.15 0.24 0.17 137 178 104 37.3 29.6 -41.30.14 0.14 0.14 0.18 96 79 84 -4.0 -17.6 6.70.56 0.54 0.54 0.48 93 77 57 -6.9 -17.0 -26.10.58 0.60 0.57 0.64 99 79 75 -1.4 -19.5 -6.2
............................................................................ current ratio = current assets current liabilities quick assets ratio = quick assets current liabilities
............................................................ debt ratio = total liabilities total assets debt-equity ratio = total liabilities equity capitalization ratio = long-term liabilities long-term liabilities + equity
*Detail items may not add up to totals because of rounding error.

26
Vertical analysis requires the analyst to compute common-size state-
ments, which show the proportions of each line item within a statement. A
common-size balance sheet expresses each line item as a decimal fraction
of total assets. in the sample analysis, the first four columns on the right-
hand page illustrate this technique. The example reveals that current assets
represented 36 percent of the total in 2006. Within this category, receivables
account for 11 percent of the total, and inventories for 8 percent. However,
the preponderance of assets are not current but fixed. At 37 percent of the
total, for example, the single line item for plants, properties, and equipment
exceeds the total for all current assets combined.
A horizontal or year-to-year analysis of the common-size statements
reveals which items show changes in importance over time. Thus the fixed
asset forestlands fell from 11 percent of total assets in 2003 to a mere one
percent in 2006. With regard to liabilities, long-term debt loomed large at
the beginning of the period, then fell sharply from .38 in 2005 to .27 in
2006. Another shift evident here is in shareholders’ equity, which rose as a
share of assets from .23 to .33 between 2003 and 2006.
A shortcoming of common-size statements is that they can obscure sig-
nificant trends in line items, especially those items that are small fractions
of the benchmark quantity. An example here is the liability, notes payable
and current maturities of long-term debt. The common-size variation is
from .06 to .01 to .04 to .03. Because these decimals are small, it is easy to
overlook the high degree of variability from year to year.
For this reason a useful second tool of horizontal analysis is trend per-
centages, the middle set of columns on the right-hand page. Also called
index numbers, trend percentages express each line item as a percentage
of its amount in a base year (2003 in this example). There is no column
of trend percentages for 2003 because every entry would be 100. now the
variability in notes payable may be easier to recognize, as its 2004 value
plummets to only 11 percent of its 2003 value, then rebounds to 56 percent
in 2005, then falls back to 33 percent in 2006.
Similarly, it may now become easier to see that not only forestlands, but
also plants, properties, and equipment fell sharply in value over the four-
year interval. The latter category was only about two-thirds (68 percent)
of its 2003 value by 2006. Total assets fell at the same pace, to 68 percent
by 2006. Among liabilities, long-term debt fell even faster, to 49 percent
of its initial value by 2006. For this and other reasons, total liabilities in
27
2006 were only 59 percent of their 2003 values. (As to shareholders’ eq-
uity, we can see that it hardly changed over the period, down slightly in
2006 to 97 percent of its initial value, meaning that the rise noted above in
shareholders’ equity relative to assets was almost entirely a result of a fall
in the value of assets.)
Along with index numbers, another primary tool of horizontal analysis
is annual percentage changes, the rightmost set of columns in the sample
analysis. Here, for example, is the most direct indicator of the variability
of the current liability cited earlier: notes payable and current maturities of
long-term debt. Between 2003 and 2004, this liability fell by 89 percent.
Between 2004 and 2005, it jumped by 431 percent. Then the value for 2005
was cut by 41 percent over the next year.
on the other hand, percentage changes also have their drawbacks. un-
like common-size statements, which can understate changes in some items,
percent changes suffer from the drawback of exaggerating changes from a
small initial value. An extreme example in the table concerns treasury stock,
the amount of its own stock bought back and held by the company. As can
be seen in the absolute numbers on the leftmost columns, treasury stock
held by the company at the end of each year went from $140 million to zero
between 2003 and 2004, meaning that it was distributed to employees for
stock-option bonuses or the like or simply resold for the prevailing stock
price. The next year saw a small repurchase of $4 million, and the year after
that (2006) a large one, for $1.4 billion. Because of the tiny initial (2005)
amount, this latter increase registered as an astronomical (but meaningless)
percentage increase in the last column of the table.
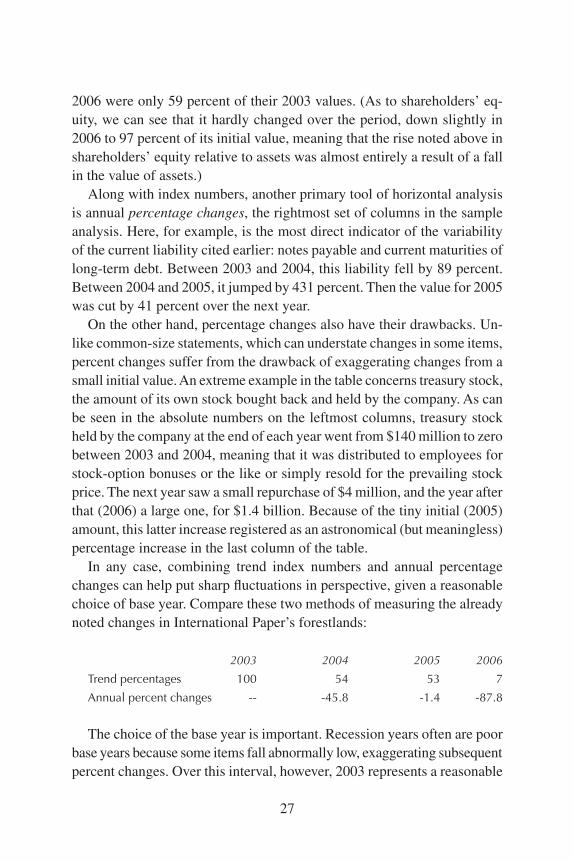
in any case, combining trend index numbers and annual percentage
changes can help put sharp fluctuations in perspective, given a reasonable
choice of base year. compare these two methods of measuring the already
noted changes in international Paper’s forestlands:
2003 2004 2005 2006
Trend percentages 100 54 53 7
Annual percent changes -- -45.8 -1.4 -87.8
The choice of the base year is important. Recession years often are poor
base years because some items fall abnormally low, exaggerating subsequent
percent changes. over this interval, however, 2003 represents a reasonable

28
base year, early in an economic expansion that began in 2001 or 2002 and
lasted through 2006 and beyond.
What stands out here is that in an expanding economy, international
Paper reduced its ownership of forest lands to a mere 7 percent of its 2003
holdings by the end of 2006. The footnotes to the Annual Report suggest
that this sharp reduction in timber holdings may reflect the company’s joint
agreements with companies (especially in Russia and Brazil) that own
forestlands but require assistance in processing and manufacturing timber.
Another possibility is that operating leases are being used as an alternative
to ownership. in theory, operating leases are short-term rentals and capital
leases are a way of financing ownership. in practice, however, non-cancel-
lable operating leases can be a form of off-balance-sheet financing, which
distorts the traditional measures of leverage and profitability.
Whatever the precise strategy, it is clear that international Paper tried in
general to increase its profitability by shrinking the scale of the company’s
operations in these years. Total assets went down from $35.5 billion to $24
billion, and total liabilities fell by a comparable $11 billion. The company
thus scaled down to only about two-thirds of its 2003 size by 2006. Though
not listed in the accounts, a parallel indicator is the company’s employment,
which fell from some 90,000 in 2003 to about 52,000 by the end of 2007.
Ratio Analysis
Ratio analysis is the name applied to comparisons that have achieved
some popularity as guides to an enterprise’s financial condition. Ratios com-
puted solely from balance sheet data are among the oldest such comparisons,
because the balance sheet has long been the most readily available financial
disclosure. Because these ratios reflect the information requirements and
disclosure practices of an earlier era, the ongoing evolution of business and
accounting practices is reducing the relevance of many traditional measures.
People still discuss balance sheet ratios, however, so we present some com-
monly encountered ratios below.
Like the dollar values in a financial statement, ratios invite the question,
“compared to what?” An enterprise’s financial ratios afford two types of
comparison: the comparison of each ratio to its previous values to determine
a trend, and comparison of ratios to those of comparable enterprises and
to industry averages. The sample analysis of international Paper’s balance
sheets includes 4 years of data for each ratio to reveal any recent trends.

29
The sample analysis does not include data for peer and industry com-
parisons. These may be found in publications updated annually by Dun &
Bradstreet or Standard & Poor’s. A recent book on the subject is Steven
m. Bragg, Business Ratios and Formulas (indianapolis, in: Wiley, 2006).
Among many on-line sources is mSn money’s site, www.moneycentral.
msn.com, which lists company and industry-wide comparisons, including
selected company ratios for each of the last 10 years.
The current ratio is perhaps the most widely reported balance-sheet ratio:
(1) current ratio = current assets/current liabilities
This is a measure of an enterprise’s short-term solvency. A higher current
ratio indicates a greater likelihood that an enterprise can meet its obligations
promptly. Given a reasonable assurance of solvency, a high or increasing
current ratio is not an improvement in an enterprise’s financial position, be-
cause it suggests an inefficient use of current assets. A 2:1 ratio once had an
almost religious significance as the benchmark for a sound current position,
but as is the case with any ratio, a useful interpretation requires comparisons
with past results and with the ratios of comparable enterprises.
A similar approach to gauging solvency with balance sheet data is to
compute working capital:
(2) working capital = current assets – current liabilities
unlike the current ratio, this measure is dollar denominated, so it is not
useful for comparisons among enterprises. The trend of working capital
and its size as a fraction of total assets complement the information that
the current ratio provides.
As discussed on page 14, the assets that a balance sheet advertises as cur-
rent are not usually all of an enterprise’s current assets, nor are they entirely
current. Similarly, current liabilities and liabilities alleged to be current are
not always identical. These misleading classifications impair the usefulness
of the current ratio and of working capital as indicators of solvency. one
method of coping with this problem is to take a conservative approach to
measuring the assets available to meet short-term obligations.
(3) quick assets = cash and temporary investments + receivables

30
(4) quick assets ratio = quick assets/current liabilities
The use of quick assets and the quick assets ratio, also called the “acid-
test” ratio, recognizes that inventories and other current assets take consider-
able time and effort to convert to cash, so that they usually are not available
to pay debts due immediately. This distinction is based on the quality of
assets, which is a combination of liquidity and the likelihood that recorded
values will be realized in a liquidation.
The recognition of differences in the quality of assets addresses only
a portion of the problem with current classifications, however. it ignores
long-term receivables and uncollectible accounts, the current portion of fixed
assets, readily saleable inventory, and the maturity distribution of current
liabilities. The basic difficulty in using the balance sheet to assess solvency
is that it does not provide all of the relevant information. Solvency is mainly
a question of cash flows. When doubts about the adequacy of cash balances
arise, it probably is too late for corrective action. For further discussion of
solvency analysis, see chapter V on receivables and inventory turnover and
chapter Vii on cash flows.
The best that can be said for the balance sheet solvency measures is that
if they are unfavorable, they alert the analyst to the need for careful scrutiny
of more relevant measures.
$3,826 $5,252 $6,804 $3,996 Working Capital
(current assets less current liabilities)
1.53 1.72 2.37 1.86 Current Ratio
0.71 0.67 0.82 0.93 Quick Assets Ratio
While international Paper’s ratios generally improved over the four-year
interval, neither met the commonly cited rules-of-thumb of 2 for the current
ratio and 1.5 for the quick assets ratio in 2006. Pending a comparison with
the comparable ratios for iP’s competitors, these numbers would seem to
raise a red flag over the company’s ability to meet its short-term obligations.
on the other hand, a strong line of credit with a bank could mean that such
ratios are manageable.
Capital Structure
The balance sheet is better suited to analyzing a business’s capital struc-

31
ture; it is designed to reveal that structure. A basic analysis of a business’s
capital structure involves a comparison of the relative proportions of the
elements of equity and of long-term debt within the balance sheet, with
reference to recent trends and industry averages. many analysts use this
approach as a starting point, computing the following ratios:
(5) debt ratio = total liabilities/total assets
(6) debt-equity ratio = total liabilities/equity
(7) capitalization ratio = long-term liabilities long-term liabilities + equity
one additional ratio, long-term liabilities to equity, is self-explanatory.
Some analysts prefer to compute these ratios from the stockholder’s point
of view, by substituting equity for total liabilities in equation (5) and for
long-term liabilities in the numerator of equation (7), and by inverting
equation (6) and the ratio of long-term liabilities to equity.
Whatever the calculations, analysts use these ratios to answer this ques-
tion: “How are the outstanding claims on the assets of the business appor-
tioned among creditors, especially long-term creditors, and owners?” in
international Paper’s case, leverage (as provided by long-term borrowing)
fell sharply from 2004 to 2006.
0.77 0.76 0.71 0.67 Debt Ratio
3.31 3.15 2.45 2.02 Debt-Equity Ratio
So did the capitalization ratio and the ratio of long-term debt to equity.
0.71 0.69 0.65 0.59 Capitalization Ratio
2.43 2.26 1.85 1.44 Ratio of Long-Term Liabilities to Equity
equations (5), (6), and (7) convey a false air of precision. For clarity, we
have used “debt” as a synonym for total liabilities. in practice, “debt” is
used to describe a variety of quantities. Long-term liabilities may or may
not include the current portion of long-term debt, depending on the analyst.
We have excluded the current portion. in addition, the equity figure used in
ratio analysis may differ markedly from reported total shareholders’ equity.
Possible additions to the reported total include obligations not likely to be
32
paid, such as minority interest and a portion of deferred income taxes, and
unrealized gains on assets, such as the excess of FiFo inventory valuations
over LiFo valuations and the excess of the market value of investments
over cost.
A common way for companies to reduce their reported leverage is the “50
percent solution,” a method of off-balance-sheet financing. Fifty percent is
the threshold ownership interest at which consolidation requirements take
effect. By holding just under 50 percent of a heavily indebted affiliate, a
company can report its holding as an investment while still exercising ef-
fective control, thereby avoiding the disclosure of a substantial amount of
leverage.
indeed, one of the salient features of the subprime mortgage crisis of late
2007 was the discovery that some of the world’s largest banks had created
“structured investment vehicles” (SiVs) for precisely this purpose. neither
analysts nor regulators had enough pertinent information to measure the
degree of risk the “creator” banks such as citigroup continued to bear for
the securities their correspondent SiVs owned. As chapter iX notes, the
result was that the banks’ balance sheets understated the amount of risk
the banks had taken on.
in any case, an alternative approach to the analysis of a publicly traded
corporation’s capital structure is to compare the market value of equity to
the value that the balance sheet reports. The advantage of this approach,
especially for the inexperienced analyst, is that it relies on the collective
judgment of thousands of self-interested marketplace participants. The
comparison can be on an aggregate basis or on a per-share basis. The rel-
evant equations are:
(8) book value per common share = equity/common shares issued
(9) market value of equity = stock price x common shares outstanding
in equation (8), equity is common shareholders’ equity (the par value
of common stock, plus paid-in capital, plus retained earnings net of the
liquidation value of preferred stock, plus the foreign currency translation
adjustment, if present). if there are substantial amounts of warrants, options,
stock purchase rights, or convertible senior securities outstanding, the analyst
should adjust for the potential dilution from these sources. There usually is
no adjustment for treasury stock or eSoP stock in this calculation, so the

33
per-share measure is book value per common share issued. if the corpora-
tion holds substantial amounts of treasury stock, it may be appropriate to
compute book value per common share outstanding, in order to compare
per-share market price and book value.
The comparison of book value to market value indicates the degree to
which asset values according to the various accounting rules differ from
their values as appraised in the marketplace. But the use of market valuations
has two important disadvantages. First, a corporation’s equity has no fixed
value; its price can change by the minute. Second, market values reflect the
availability and scarcity of funds as much as they do the values of corporate
net assets. During periods of speculation, investors’ sole valuation principle
tends to be the expectation of what future purchasers, perhaps flush with
cash, will be willing to pay for a corporation’s stock.

34
INTERNATIONAL PAPER COMPANYConsolidated Statement of Earnings (Multiple Step)
For the Year Ended December 31, 2006
(in millions, except per share amounts)
Net sales $21,995
Cost of Products Sold 16,248
Gross Profit on Sales $ 5,747
Operating Expenses:
Depreciation and amortization $1,158
Distribution expenses 1,075
Selling and administrative expenses 1,848
Taxes other than payroll and income taxes 215
Restructuring charge, sale of businesses, other 2,530
Sale of forestlands (4,788)
Total Operating Expenses, excluding income taxes 2,038
Earnings from Operations, before income taxes $ 3,709
Interest Expense, net 521
Earnings before Income Taxes, Minority Interest, and
Extraordinary Item for Discontinued Operations $ 3,188
Provision for Income Taxes 1,889
Minority Interest (17)
Earnings from Continuing Operations $ 1,282
Discontinued Operations (232)
Net Earnings $ 1,050
Weighted Average Common Shares Outstanding 476
Earnings per Common Share:
Earnings before discontinued operations $2.69
Effect on earnings per share of extraordinary item (0.49)
Earnings per Common Share $ 2.21
This multiple-step statement and the single-step statement on page 36 have been adapted from International Paper Annual Report for 2006 (Memphis, TN: Interna-tional Paper Company, 2007), p. 49. The notes on pp. 54-88 of the Annual Report are an integral part of the original statement.

35
IV.
THE INCOME STATEMENT
Annual income twenty pounds, annual expenditure nineteen six,
result happiness.
Annual income twenty pounds, annual expenditure twenty pounds
ought and six, result misery.
– Wilkins Micawber (Dickens)
An income statement reconciles an enterprise’s revenues, expenses,
gains, and losses for an accounting period, and states the total of
those items. The total goes by many names, including earnings, net
income, comprehensive income, change in fund balances, and change in net
assets. An income statement accounts for the changes in an enterprise’s net
assets that do not result from transactions with owners or donors between
successive balance sheet dates. Synonyms for income statement include
statement of operations, results of operations, statement of profit and loss,
and statement of earnings, but this list is not exhaustive. The mark of the
Wall Streeter is her use of the abbreviation “P&L” for “statement of profit
and loss.”
income statements come in two formats: single step and multiple step. A
single-step statement calculates earnings from operations by subtracting total
costs and expenses from total revenues. An example appears on page 34. A
multiple-step statement first determines gross profit on sales (step 1) and then
subtracts operating expenses (step 2) to arrive at operating earnings. only
merchandising enterprises (manufacturers, wholesalers, and retailers) use
the multiple-step format, which appears at left, because gross profit is not
a useful measure for service enterprises — all of their sales are gross profit.
corporate income statements include an additional feature, the computation
of earnings per share before and after adjustments for extraordinary items.
A sample calculation of earnings per share appears at left.
Accountants classify earnings by source, just as they distinguish between
earnings as a whole and funds provided by owners or donors. The cash
receipts that an enterprise’s principal activities generate are revenues. The
cash payments arising from those activities are expenses. The difference
between revenue and expenses is earnings from operations. Gains and losses

36
are the cash flows resulting from transactions and events that are incidental
to, or simply not among, an enterprise’s principal activities. Gains net of
losses constitute non-operating earnings. The sum of non-operating and
operating earnings is net earnings, often called net income.
That said, the items labeled revenue, expenses, gains, and losses in
financial statements do not always conform to this classification, which is
drawn from the FASB’s “conceptual framework.” income statements often
label negative operating earnings as “operating loss,” for example, even
though the negative earnings stem from an enterprise’s principal activities.
in addition, income statements label net interest receipts or payments and
certain other non-operating items as revenues and expenses.
Accrual Accounting
Revenues, expenses, gains, and losses all consist of cash flows (or
INTERNATIONAL PAPER COMPANYConsolidated Statement of Earnings (Single Step)
For the Year Ended December 31, 2006
(in millions)
Net sales $21,995
Costs and Expenses:
Cost of products sold $16,248
Depreciation and amortization 1,158
Distribution expenses 1,075
Selling and administrative expenses 1,848
Taxes other than payroll and income taxes 215
Restructuring charge, sale of businesses, other 2,530
Sale of forestlands (4,788)
Total Costs and Expenses $18,286
Earnings before Interest, Income Taxes, Minority Interest,
and Extraordinary Item for Discontinued Operations 3,709
Interest Expense, net 521
Earnings before Income Taxes, Minority Interest, and
Extraordinary Item for Discontinued Operations $ 3,188
Provision for Income Taxes 1,889
Minority Interest (17)
Earnings from Continuing Operations $ 1,282
Discontinued Operations (232)
Net Earnings $ 1,050

37
equivalent transactions, in which no cash changes hands, that affect asset
and liability accounts), but the cash flows do not always coincide with the
recognition of these four elements of earnings. enterprises may record ex-
penses for the current period that reflect cash payments made many years
ago. They may record losses to account for estimated impairments of asset
values during the current period. Such losses reflect prospective reductions
in future cash flows. Similarly, cash receipts may precede or follow revenue-
generating sales and services.
The reason for these differences in timing is that cash flows can be a
poor short-term indicator of an enterprise’s performance. A steep decline in
cash flows from operations from the fourth quarter to first quarter may not
be cause for concern if the business reporting the decline is a department
store or a toy store. contractors on a long-term construction project might
receive a large down payment, no cash receipts for more than a year, and
then a large final payment. not all enterprises have irregular operating cash
flows — such flows might be a crucial indicator of, say, a supermarket’s
month-to-month performance — but even these enterprises incur gains and
losses that affect performance but are incidental to regular operations.
Short-term results provide an enterprise’s managers with information
that is crucial for successful operations. The imperfections of cash flow as
a measure of short-term results led long ago to the development of accrual
accounting, which consists of the generally accepted accounting principles
used to assign portions of cash flows to the revenues, expenses, gains, and
losses of more than one accounting period. earnings, the end product of
accrual accounting, have proven to be a useful short-term performance
measure for managers and other interested parties.
The two key principles of accrual accounting are the realization principle
and the matching principle. under the realization principle, enterprises
record revenues when they deliver goods or provide services. under the
matching principle, enterprises attempt to allocate expenses among all pe-
riods in which those expenses contribute to revenues. matching is hardly a
science — it involves a considerable reliance on estimates, predictions, and
arbitrary judgments. Taken together, the two principles require enterprises
to compute operating earnings for a period as the revenue from goods and
services provided during the period, net of the expenses directly attributable
to producing that revenue, and net of a systematic allocation of expenses
not directly associated with the volume of revenue for any one period.
38
There are two techniques for applying these principles: accrual and de-
ferral. Accrual is the process of recognizing future cash flows as revenues
or expenses in the current period. Accrued expenses become liabilities until
paid, and accrued revenues become assets until received. Accounts receiv-
able and payable are examples of accrued assets and liabilities.
Deferral is the opposite of accrual; it is the process of assigning current
cash flows to the revenues and expenses of future periods. Deferred expenses
become assets until charged against earnings, and deferred revenues become
liabilities until earned. in the case of cash outlays for acquiring equipment
and other long-lived assets, an enterprise charges portions of each outlay to
expenses over the estimated useful lives of the assets, thereby deferring the
recognition of the initial outlays as expenses. in the case of cash receipts for
goods and services to be provided for several periods, such as subscriptions,
an enterprise records the receipts as liabilities and credits a portion of each
receipt to revenue as it provides those goods and services.
The income statement reveals the principles and techniques of accrual
accounting at work:
Net Sales $21,995
Cost of Products Sold 16,248
Gross Profit on Sales ........................................................................... $ 5,747
The gross profit calculation involves the use of the realization principle
to determine net sales, and the matching principle to determine the cost of
products sold. Like any other merchandising business, international Paper
defers the recognition of cash outlays for production and purchasing costs
by recording those outlays as assets, namely inventories. As the company
makes sales, it earns the revenues that result from its inventory outlays, so
it must charge matching expenses against those revenues. The company
does so by transferring the portion of inventories attributable to sales to an
expense account, cost of products sold.
The difference between net sales and cost of products sold is gross profit,
rather than net profit (earnings), because the company must match many
other expenses against sales revenues:

39
Gross Profit on Sales ........................................................................... $ 5,747
Operating Expenses:
Depreciation and amortization $1,158
Distribution expenses 1,075
Selling and administrative expenses 1,848
Taxes other than payroll and income taxes 215
Restructuring charge 2,530
Sale of forestlands (4,788)
Total Operating Expenses, excluding income taxes 2,038
Earnings from Operations, before income taxes ..................................... $ 3,709
most of the amounts of distribution expenses and selling and administra-
tive expenses are accruals. until paid, these amounts appear on the balance
sheet as liabilities, including accounts payable and accrued payroll and
benefits. in contrast, depreciation and amortization are important examples
of deferral. using these techniques, the company charges a portion of cash
outlays for fixed assets against revenue for the period.
Because of the difficulties of determining how much any particular long-
lived asset contributes to the revenue of each period, an enterprise usually
determines depreciation and amortization according to arbitrary formulas
based on the volume of production or the passage of time in relation to the
asset’s expected useful life. The notes to international Paper’s financial
statements disclose the particular types of formulas that the company uses.
Depreciation and amortization do not include depletion of forestlands,
because that expense can be matched against revenue as part of the cost of
products sold.
The income statements of most enterprises list interest revenue and ex-
pense, or net interest, separately from the operating items. The reason for
this classification is that interest expense accrues from financing activities
and interest revenue accrues from investing activities. With few exceptions,
only financial companies count financing and investing as operating activi-
ties. For most other enterprises, those activities are incidental to operations.
From the creditor’s point of view, the advantage of this separate listing is
that the margin by which an enterprise’s current operations fund interest
payments is readily apparent.
A corporation’s provision for income taxes is a combination of accruals
and deferrals. The accruals reflect the usual practice of paying taxes in the

40
current period on taxable income earned in the previous period. The deferrals
reflect the myriad differences between GAAP earnings and taxable income.
Profitable corporations normally report a positive deferral component of the
provision for income taxes and a growing net deferred tax liability. Because
of the peculiarities of tax allocation, deferred tax liabilities and deferred tax
assets both appear on corporate balance sheets (the assets often are lumped
together with other current assets). corporate income statements show just
the net provision for income taxes. However, the notes to the financial state-
ments usually disclose various components of the provision.
Technically, the portion of a corporation’s provision for income taxes
that is attributable to operating items is an operating expense and it should
appear in the list of operating expenses, so that the income statement presents
earnings from operations net of tax. in practice, corporate income state-
ments present income taxes among the non-operating items and they do not
disclose the amount of taxes attributable to operating items. The provision
for income taxes includes the tax consequences of items that appear below
the provision on the income statement. The income statement lists these line
items net of tax, but it includes disclosures of their tax consequences.
Though only one appears here, three categories of line items can follow
the provision for income taxes on the income statement. The one featured
here is earnings from discontinued operations. Discontinued operations
include entire business lines or subsidiaries that an enterprise has sold or
liquidated. (By contrast, plant closings and other reorganizations are “un-
usual items,” not discontinued operations. unusual items are components
of operating earnings, which often are called earnings from continuing
operations.) international Paper took a productivity improvement charge
for discontinued operations in 2006.
Discontinued Operations (232)
When an enterprise decides to discontinue operations, it separates the
earnings of those operations on all income statements prepared after the
decision. comparative income statements also separate earnings of the
discontinued operations in previous periods. The income statement for the
period in which operations end, which may lag considerably the decision
to discontinue, shows gains or losses on the disposal of the operations plus
any earnings for the final period.
41
A second possible category refers to extraordinary items, meaning items
that are material, unusual, and not expected to recur in the foreseeable future.
examples might be losses from natural disasters, wars, and riots, and the
effects of government expropriations and condemnations, major changes
in law, and major changes in financial conditions.
A third is the cumulative effect of changes in accounting principles.
When an enterprise changes the accounting principles that it uses, it
calculates the difference the change would have made in the earnings of
past accounting periods and charges the cumulative sum of those changes
against current-period earnings. The most common reason for changing
accounting principles is to comply with a new Statement of Financial Ac-
counting Standards (SFAS). other reasons include voluntary changes, such
as choosing a new inventory valuation method or depreciation method, and
changes in GAAP set forth by organizations other than the FASB, such as
the Sec or the AicPA.
net earnings are what remains after a business has deducted earnings
from these three categories—discontinued operations, extraordinary items,
and the effects of accounting changes—from after-tax earnings. This is the
so-called “bottom line.” it is the amount available to those with an equity
interest in the business. A business attracts equity investment with the pros-
pect of positive and growing earnings. Businesses that incur persistent net
losses eventually go bankrupt. Thus the amount and trend of net earnings
are critical evidence of management’s ability to maintain a business, to fund
growth internally, and to provide adequate returns to investors.
Earnings per Share
it is a commonplace to call net earnings the bottom line, but corporate
income statements include some important lines below net earnings. These
lines present earnings per common share, often called earnings per share.
Net Earnings $1,050
Weighted Average Common Shares Outstanding 476
Earnings per Common Share:
Earnings before allowance for discontinued operations $2.69
Effect of allowance for discontinued operations (0.49)
Earnings per Common Share $2.21

42
When there are preferred shares outstanding, the earnings per share
presentation includes an additional step, the computation of earnings ap-
plicable to common shares, which is the difference between net earnings
and preferred dividend requirements.
From the investor’s point of view, earnings per share is a more useful
figure than net earnings because it measures the investor’s pro rata share of
earnings, which varies with the number of shares outstanding. Professional
analysts compute the present value of estimated future per-share earnings
to determine whether a corporation’s shares warrant a buy, hold, or sell
rating at current market prices. The rationale for this calculation is that if
the present value of a corporation’s earnings per share exceeds the current
market price, the market price is a bargain and the shares warrant a buy
rating. This process is, of course, only as good as the earnings estimates
that go into it.
earnings per share is a more complicated measure than book value per
share because the number of shares outstanding varies during most ac-
counting periods, whereas the number of issued shares at the end of any
accounting period is fixed. corporations that have relatively simple capital
structures divide earnings for an accounting period by the weighted average
number of shares outstanding during the period to compute earnings per
share. The use of the weighted average adjusts for variations in the number
of outstanding shares. An example of a simple capital structure is a corpora-
tion that has issued nonconvertible bonds, nonconvertible preferred shares,
and one class of common shares.
Relatively complex capital structures can include convertible preferred
issues, convertible bonds, warrants, options, and a variety of more exotic
securities. When the holders of these types of securities convert them to
common shares for a consideration that is below the market price, the conver-
sions dilute the interests of current holders of common shares. Participation
certificates and multiple classes of common stock also complicate capital
structures because of the sharing of earnings and dividend participation that
these arrangements require.
Widespread failure to recognize these forms of dilution of earnings par-
ticipation fueled the merger craze of the late 1960s, as growing conglomer-
ates issued convertible securities to make acquisitions. These transactions
amounted to deferred issuances of common shares to buy the current earn-
ings of acquisitions. Failure to account for dilution from future conversions

43
allowed the acquiring corporations to report growing earnings per share.
This type of distortion led to the requirement that corporations for which
earnings per common share, as described above, is subject to a reduction
of more than three percent due to dilution must present primary and fully
diluted earnings per share instead. These two measures account for the ef-
fects of dilution using slightly different assumptions about dilutive transac-
tions. Knowledge of the complex calculations involved is best left to the
accountants; it suffices to understand that fully diluted earnings per share is
the more conservative measure, and that shareholders of corporations that
do not disclose the effects of dilution in audited financial statements risk
no more than a three percent dilution of their interests.
Statements of Equity and Net Assets
The income statement does not provide a complete accounting of the
changes in an enterprise’s financial position. it does not account for the
disposition of net earnings or for the enterprise’s transactions with own-
ers or donors. The statement that accounts for these items depends on the
enterprise’s form of organization: for corporations, it is the statement of
shareholders’ equity; for partnerships, the statement of partners’ equity;
for sole proprietorships, the statement of owner’s equity; for nonprofit
enterprises, the statement of changes in net assets, commonly called the
statement of changes in fund balances.
Some corporations present just a statement of retained earnings, which is
less comprehensive than the statement of shareholders’ equity. Whatever its
name, the statement is with few exceptions just a bookkeeping document,
of little significance to the analyst.
A statement of owner’s, partners’, or shareholders’ equity accounts for
the changes in a business’s equity position during an accounting period.
Sources of increases in equity include net earnings if positive, additional
investments by shareholders or principals, and, rarely, donations. Additional
investments by a corporation’s shareholders can include indirect forms of
investment, such as sales of treasury stock, conversions of senior securi-
ties, and distributions of eSoP stock. Similarly, the sources of increase in
the net assets of a nonprofit enterprise include donations and positive net
earnings. net losses and payments to investors reduce a business’s equity,
and net losses reduce a nonprofit enterprise’s net assets. indirect payments
to a corporation’s investors, such as purchases of treasury stock and eSoP

44
stock, can reduce equity. Foreign currency translation adjustments can
produce both reductions and increases in a corporation’s equity.
one important difference between a statement of owner’s or partners’
equity and a statement of shareholders’ equity is that payments to principals
are called drawings rather than dividends. Another important difference is
that net earnings accumulate in the principals’ capital accounts rather than
in retained earnings. Statements of partners’ equity can be highly complex,
depending on the provisions of the partnership agreement.
Although daunting in appearance, as the example at right shows, a
corporation’s statement of shareholders’ equity usually is straightforward.
The pertinent items for the analyst and for the investor are the per-share
dividend (often reported on the income statement) and the dividend payout
ratio. As listed in the first footnote to the table, this latter is the ratio of total
common-stock dividend payments to net earnings applicable to common
shares. A ratio between 0 and 1 indicates an increase in retained earnings and
suggests the degree to which the corporation can finance expanded opera-
tions without issuing stock or borrowing. A ratio less than 0 indicates that
the corporation is using retained earnings to cover losses and pay dividends.
A ratio greater than 1 indicates the use of retained earnings to supplement
net earnings as a source of dividends.
A nonprofit enterprise’s statement of changes in net assets usually fol-
lows the matrix format of the statement of shareholders’ equity. Just as the
shareholders’ equity statement discloses the changes of each element of
equity stemming from each type of transaction, so the change in net assets
statement shows the effect of each transaction on the net assets of each
fund. The net assets of each fund commonly are called fund balances. An
important difference between nonprofit accounting and business account-
ing is that some nonprofit enterprises present a statement of current-fund
operations rather than a consolidated income statement. These enterprises
incorporate the consolidated income statement into the statement of changes
in net assets.

45
INTERNATIONAL PAPER
Consolidated Statement of Common Shareholders’ Equity
Accumulated Common Stock Issued Other Treasury Stock Total Common(in millions, Paid-In Retained Comprehensive Shareholders’except share amounts in thousands and ratios) Shares Amount Capital* Earnings Income (Loss)** Shares Amount Equity
Balance, January 1, 2004 485,162 $485 $6,500 $3,082 ($1,690) 3,668 $140 $8,237Issuance of stock for various plans 2,333 2 62 (3,652) (140) 204Cash dividends—common stock ($1 per share) (485) (485)Net loss (35) (35)Adjustments for pensions, foreign currency translation, and hedging operations 333 333Total comprehensive income 298
_________ _____ ________ ________ ________ ___ ________ Balance, December 31, 2004 487,495 $487 $6,562 $2,562 ($1,357) 16 $8,254
Issuance of stock for various plans 3,006 4 65 96 4 65Cash dividends—common stock ($1 per share) (490) (490) Net earnings 1,100 1,100 Adjustments (578) (578)Total comprehensive income 522
_________ _____ _______ _______ _______ ____ ___ _______Balance, December 31, 2005 490,501 $491 $6,627 $3,172 ($1,935) 112 $4 $8,351
Issuance of stock for various plans 2,839 2 108 46 1 109 Repurchase of stock 39,686 1,433 (1,433)Cash dividends—common stock ($1 per share) (485) (485) Net earnings 1,050 1,050 Adjustments 721 721Total comprehensive income 1,771
Effect of adoption of SFAS No. 158 (less tax of $309) _________ _____ _______ _______ (350) _______ _______ (350)
Balance, December 31, 2006 493,340 $493 $6,735 $3,737 ($1,564) 39,844 $1,438 $7,963 *The dividend payout ratio (cash dividends divided by total comprehensive income) was 1.63 for 2004, 0.94 for 2005, and 0.27 for 2006.**The cumulative foreign currency translation adjustment in millions was $(60), $(280), and $(29) at December 31, 2006, 2005, and 2004, respec-tively, and is included as a component of accumulated other comprehensive income (loss).Adapted from International Paper Annual Report for 2006 (Memphis, TN: International Paper, 2007), p. 49.

46
47
V.
ANALYSIS OF THE INCOME STATEMENT
AS with the balance sheet, vertical, horizontal, and ratio analyses
are the essential procedures for analyzing the income statement.
chapter iii discusses the basics of those procedures. They are es-
sential for analyzing any financial disclosure because they help the analyst
answer the question, “compared to what?”
Vertical analysis of the income statement has many limitations as a guide
to a business’s performance. The common-size income statement reveals
some important measures of profitability, but not all of them, and it can
only hint at a business’s solvency. Vertical analysis is useful as a first step,
however, because it reveals which aspects of a business’s performance
deserve careful attention as the analysis proceeds.
net sales are the benchmark quantity for a vertical analysis of the income
statement, so the common-size income statement lists each item as a decimal
fraction of net sales. The sample analysis of international Paper’s income
statement, which appears after page 49,* reveals three key fractions. First,
the cost of products sold consumes as much as three-fourths of sales rev-
enue. Second, except in 2006 (an atypical year), other operating expenses
consume three-fourths or more of the remainder. Third, net earnings have
amounted to at most five percent of net sales in recent years, These propor-
tions vary widely from firm to firm, but international Paper’s are typical
for a manufacturing business because its cost of products sold consumes
the overwhelming majority of revenues, while only a tiny fraction remains
for shareholders.
Profit Margins
The fraction of net sales remaining after deducting the cost of products
sold is a business’s gross profit margin, a key measure of profitability. There
are no net earnings without gross profits, barring extraordinary non-operating
gains. A business’s gross profit margin indicates its average rate of profit per
dollar of sales, which provides a basis for forecasting how much a change in
* Having photocopies of these four pages at hand will make the discussion of the sample analysis easier to follow.

48
sales volume would affect earnings. using international Paper’s gross profit
margins during these years, one can forecast that each additional dollar of
sales revenue will yield at least 25 cents to cover operating expenses and
provide a return to investors.
The size of the gross profit margin also is important as an indicator of
the amount of volume a business must generate in order to earn a net profit.
if operating expenses are relatively stable over a range of sales volumes,
it takes more volume to generate a given amount of net profit with a low-
margin product than with a comparably priced high-margin product. Cost
pressures are thus more intense for managers of low-margin businesses.
The multiple-step income statement at the beginning of chapter iV and
the sample analysis of international Paper’s income statement in this chapter
both present gross profit as the difference between net sales and the cost
of products sold. The gross profit margin is just one of several measures of
profitability on the common-size income statement.
The operating margin, which is earnings from operations as a percentage
of sales, is another such measure. earnings from operations add fixed costs to
the variable costs considered in the gross profit calculation, thus measuring
the overall profitability of operations for a given period. Because earnings
from operations include fixed costs, the operating margin is not as useful
a measure of unit profitability as the gross margin. The operating margin
is more likely to change as the volume of sales changes. As a measure of
the overall efficiency of operations, however, the operating margin is more
useful than the gross profit margin.
From the shareholder’s or principal’s point of view, pretax earnings (earn-
ings before income taxes, extraordinary items, and the cumulative effect
of accounting changes) and the pretax profit margin are the most relevant
measures of profitability.
First, pretax earnings reflect the deduction of net interest expense from
operating earnings. net interest can consume a sizeable fraction of the op-
erating margin if a business employs leverage. if so, the operating margin
does not include all of the information relevant to an assessment of manage-
ment’s performance. A common reason for using leverage is to purchase
productive assets in order to increase earnings. A complete assessment
of management’s effectiveness at using leverage must include the cost of
leverage, which is net interest expense.
Second, pretax earnings is more relevant than net earnings, which often

49
include extraordinary items beyond management’s control.
Third, corporate managements enjoy a degree of flexibility in determin-
ing the provision for income taxes. Because of this flexibility, manage-
ment’s ability to conduct transactions in ways that minimize the corporate
tax burden strongly influences reported after-tax earnings. This ability is
important, but shareholders and analysts should consider it separately from
management’s ability to produce a return on the resources entrusted to it.
Fourth, the provision for income taxes typically includes a substantial
deferred component that reflects the change in a corporation’s deferred tax
liabilities, not its current tax obligations. Due to the conservative bias of tax
allocation practices, deferred tax liabilities can include substantial amounts
that are unlikely ever to be paid to tax authorities. This conservatism has
produced ever-increasing deferred tax liabilities on many corporate balance
sheets, so that deferred taxes have become a form of “stealth equity.” To the
extent that the provision for income taxes includes such permanent defer-
rals, pretax earnings is more relevant than after-tax earnings as a measure
of management’s ability to preserve and increase a corporation’s equity.
Horizontal Analysis
international Paper’s earnings fell into negative territory in 2004, then
recovered in the following two years. net after-tax earnings rallied to 5 per-
cent of sales in 2005 and 2006.
net sales and gross profit on sales remained flat (or decreased) over the
four-year period, so the restoration of positive profit margins had other
sources. one key is the year-to-year changes in total operating expenses,
which plummeted from 21 percent of sales the first three years to 9 percent
in 2006. This abrupt shift is attributable to an unorthodox bit of account-
ing, which lists the one-time sale of forestlands ($4.8 billion) in 2006 as a
reduction of operating expenses. if not for this one-time event, operating
expenses would have been sharply higher in 2006, and earnings lower,
than in 2005.
Ratio Analysis
Ratio analysis is a lot like cooking. Like a chef, each analyst has a
slightly different formula for computing a given ratio. Like ingredients,
the available disclosures determine what gets computed. The ratios that
we present in the sample analysis are “standard fare,” but the list is by no
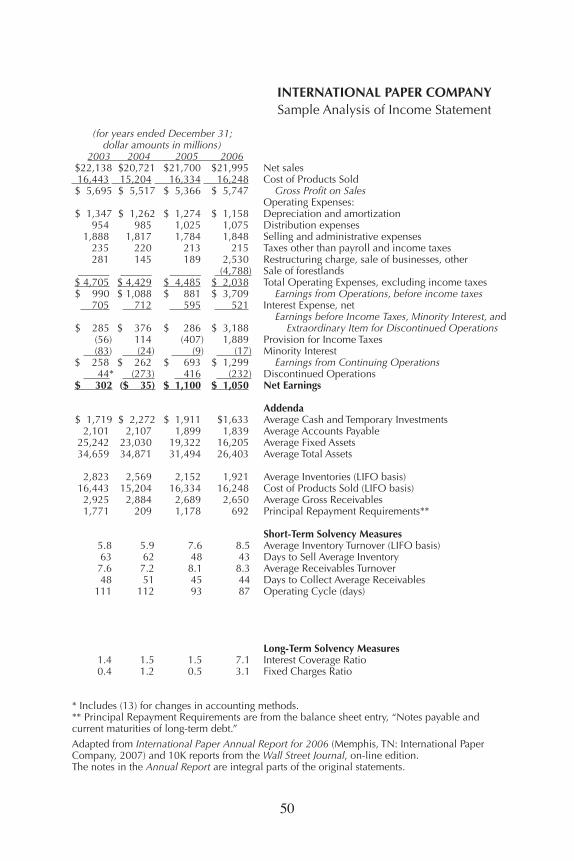
50
INTERNATIONAL PAPER COMPANY
Sample Analysis of Income Statement (for years ended December 31; dollar amounts in millions) 2003 2004 2005 2006 $22,138 $20,721 $21,700 $21,995 Net sales 16,443 15,204 16,334 16,248 Cost of Products Sold $ 5,695 $ 5,517 $ 5,366 $ 5,747 Gross Profit on Sales Operating Expenses: $ 1,347 $ 1,262 $ 1,274 $ 1,158 Depreciation and amortization 954 985 1,025 1,075 Distribution expenses 1,888 1,817 1,784 1,848 Selling and administrative expenses 235 220 213 215 Taxes other than payroll and income taxes 281 145 189 2,530 Restructuring charge, sale of businesses, other ______ ______ ______ (4,788) Sale of forestlands $ 4,705 $ 4,429 $ 4,485 $ 2,038 Total Operating Expenses, excluding income taxes $ 990 $ 1,088 $ 881 $ 3,709 Earnings from Operations, before income taxes 705 712 595 521 Interest Expense, net Earnings before Income Taxes, Minority Interest, and $ 285 $ 376 $ 286 $ 3,188 Extraordinary Item for Discontinued Operations (56) 114 (407) 1,889 Provision for Income Taxes (83) (24) (9) (17) Minority Interest $ 258 $ 262 $ 693 $ 1,299 Earnings from Continuing Operations 44* (273) 416 (232) Discontinued Operations $ 302 ($ 35) $ 1,100 $ 1,050 Net Earnings Addenda $ 1,719 $ 2,272 $ 1,911 $1,633 Average Cash and Temporary Investments 2,101 2,107 1,899 1,839 Average Accounts Payable 25,242 23,030 19,322 16,205 Average Fixed Assets 34,659 34,871 31,494 26,403 Average Total Assets 2,823 2,569 2,152 1,921 Average Inventories (LIFO basis) 16,443 15,204 16,334 16,248 Cost of Products Sold (LIFO basis) 2,925 2,884 2,689 2,650 Average Gross Receivables 1,771 209 1,178 692 Principal Repayment Requirements** Short-Term Solvency Measures 5.8 5.9 7.6 8.5 Average Inventory Turnover (LIFO basis) 63 62 48 43 Days to Sell Average Inventory 7.6 7.2 8.1 8.3 Average Receivables Turnover 48 51 45 44 Days to Collect Average Receivables 111 112 93 87 Operating Cycle (days) Long-Term Solvency Measures 1.4 1.5 1.5 7.1 Interest Coverage Ratio 0.4 1.2 0.5 3.1 Fixed Charges Ratio * Includes (13) for changes in accounting methods.** Principal Repayment Requirements are from the balance sheet entry, “Notes payable and current maturities of long-term debt.”
Adapted from International Paper Annual Report for 2006 (Memphis, TN: International Paper Company, 2007) and 10K reports from the Wall Street Journal, on-line edition. The notes in the Annual Report are integral parts of the original statements.

51
As percentages of 2003 levels As fractions of net sales* (index numbers Annual
(common-size statements) or trend percentages) percent changes2003 2004 2005 2006 2004 2005 2006 2004 2005 2006 1.00 1.00 1.00 1.00 94% 98% 99% -6.4% 4.7% 1.4% 0.74 0.73 0.75 0.74 92 99 99 -7.5 7.4 -0.50.26 0.27 0.25 0.26 97 94 101 -3.1 -2.7 7.1
0.06 0.06 0.06 0.05 94 95 86 -6.3 1.0 -9.1 0.04 0.05 0.05 0.05 103 107 113 3.2 4.1 4.9 0.09 0.09 0.08 0.08 96 94 98 -3.8 -1.8 3.6 0.01 0.01 0.01 0.01 94 91 91 -6.4 -3.2 0.9 0.01 0.01 0.01 0.12 52 67 900 -48.4 30.3 1,238.6____ ____ ____ (0.22) 0.21 0.21 0.21 0.09 94 95 43 -5.9 1.3 -54.60.04 0.05 0.04 0.17 110 89 375 9.9 -19.0 321.0 0.03 0.03 0.03 0.02 101 84 74 1.0 -16.4 -12.4
0.01 0.02 0.01 0.14 132 100 1,119 31.9 -23.9 1,014.7 (0.00) 0.01 (0.02) 0.09 (204) 727 (3,373) -303.6 -457.0 -564.1 (0.00) (0.00) (0.00) (0.00) 29 11 20 -71.1 -62.5 88.9 0.01 0.01 0.03 0.06 102 269 503 1.6 164.5 87.4 0.00 (0.01) 0.02 (0.01) (620) 945 (527) -720.4 -252.4 -155.80.01 (0.00) 0.05 0.05 (12) 364 348 -111.6 -3,242.9 -4.5
Turnover ratios 12.9 9.1 11.4 13.5 = net sales/average cash and temporary investments10.5 9.8 11.4 12.0 = net sales/average accounts payable
0.9 0.9 1.1 1.4 = net sales/average fixed assets0.6 0.6 0.7 0.8 = net sales/average total assets
average inventory turnover = cost of products sold/average inventory days to sell average inventory = 365/average inventory turnover average receivables turnover = net sales/average gross receivables days to collect average receivables = 365/average receivables turnover operating cycle (days) = days to sell avg. inventory + days to collect avg. receivables
interest coverage ratio = pretax operating earnings/net interest expense fixed charges ratio = pretax operating earnings net interest expense + principal repayment requirements
* Detail items may not add up to totals because of rounding error.

52
INTERNATIONAL PAPER COMPANY
Sample Analysis of Income Statement (continued) (for years ended December 31) 2003 2004 2005 2006 Selected Per-Share Measures $46.12 $42.64 $44.74 $46.21 Net sales 34.26 31.28 33.68 34.13 Cost of Products Sold $11.86 $11.35 $11.06 $12.07 Gross Profit on Sales $ 2.81 $ 2.60 $ 2.63 $ 2.43 Depreciation and amortization 1.99 2.03 2.11 2.26 Distribution expenses 3.93 3.74 3.68 3.88 Selling and administrative expenses 0.49 0.45 0.44 0.45 Taxes other than payroll and income taxes 0.59 0.30 0.39 5.32 Restructuring charge, sale of businesses, other ____ ____ ____ (10.06) Sale of forestlands $ 9.80 $ 9.11 $ 9.25 $ 4.28 Total Operating Expenses, excluding income taxes $ 2.06 $ 2.24 $ 1.82 $ 7.79 Earnings from Operations, before income taxes 1.47 1.47 1.23 1.09 Interest Expense, net Earnings before Income Taxes, Minority Interest, and $ 0.59 $ 0.77 0.59 $ 6.70 Extraordinary Item for Discontinued Operations (0.12) 0.23 (0.84) 3.97 Provision for Income Taxes (0.17) (0.05) (0.02) (0.04) Minority Interest $ 0.54 $ 0.49 $ 1.41 $ 2.69 Earnings from Continuing Operations 0.09* (0.56) 0.86 (0.49) Discontinued Operations $ 0.63 ($0.07) $ 2.27 $ 2.21 Earnings per Common Share Addenda $43.11 $42.00 $33.61 $34.10 Market Price per Common Share (year-end) 1.00 1.00 1.00 1.00 Dividends per Common Share 480 486 485 476 Weighted Average Common Shares Outstanding (millions) 79.8 85.7 23.8 12.7 Price-Earnings Ratio (recurring) 68.4 -583.2 14.8 15.5 Price-Earnings Ratio (net) (in millions) $7,806 $8,246 $8,303 $8,157 Average Common Shareholders' Equity 14,290 14,696 13,026 9,710 Average Borrowed Funds 34,659 34,871 31,494 26,403 Average Total Assets Return on Investment Measures 4.93% 4.85% 4.57% 5.37% Average Effective Interest Rate 2.86 3.12 2.80 14.05 Return on Assets 3.87 -0.42 13.25 12.87 Return on Equity 1.4 -0.1 4.7 0.9 Financial Leverage Index 2.32% 2.38% 2.98% 2.93% Dividend Yield 26.14 -0.26 -17.60 4.43 Total Return on Common Shares * Includes (.03) for accounting charges.

53
As percentages of 2003 levels (index numbers or trend percentages) Annual percent changes
2004 2005 2006 2004 2005 2006 92 97 100 -7.6 4.9 3.3 91 98 100 -8.7 7.7 1.4 96 93 102 -4.3 -2.5 9.1 93 94 87 -7.5 1.2 -7.4 102 106 114 2.0 4.3 6.9 95 94 99 -4.9 -1.6 5.5 92 90 92 -7.5 -3.0 2.8 51 67 908 -49.0 30.6 1,263.9 93 94 44 -7.0 1.5 -53.7 109 88 378 8.5 -18.9 329.0 100 84 75 -0.3 -16.3 -10.8 130 99 1,128 30.3 -23.8 1,035.8 (201) 719 (3,402) -301.1 -457.8 -572.9 29 11 21 -71.4 -62.4 92.5 91 261 498 -9.3 187.8 90.8 (622) 956 (544) -722.2 -252.7 -156.8 (11) 360 350 -111.4 -3,249.3 -2.7
97 78 79 -2.6 -20.0 1.5 100 100 100 0.0 0.0 0.0 101 101 99 1.3 -0.2 -1.9 107 30 16 7.4 -72.2 -46.8 (852) 22 23 -952.3 -102.5 4.3
average effective interest rate = net interest expense/average borrowed funds return on assets = pretax operating earnings/average total assets return on equity = earnings applicable to common shares average common equity financial leverage index = return on equity/return on assets dividend yield = dividend per share/market price per share total return on common shares = dividend per share + change in market price beginning market price

54
means comprehensive, nor should the formulas used be taken as gospel.
Those who take the time to churn out some of the innumerable variations
on these formulas will find that no one measure is reliable or useful all of
the time — a thorough analysis is important. That said, number-crunching
quickly becomes an exercise in diminishing returns.
Although seldom acknowledged as such, per-share measures are ratios.
The denominator of any per-share ratio is the weighted average number of
common shares outstanding. earnings per common share is thus the most
frequently encountered income-statement ratio.
earnings per share provides a useful yardstick for evaluating a corpora-
tion’s share price:
(1) price-earnings ratio = market price per common share net earnings per common share
As explained in chapter iV, many analysts compare share prices by
computing the present values of corporations’ projected earnings per share.
The calculations involved are complex, but given certain assumptions about
future earnings trends, comparisons of P-e ratios will give the same answers
for much less work. Although the necessary assumptions rarely apply, the
ease of computing P-e ratios has led to their widespread use.
it is impossible to evaluate in advance the accuracy of the many earnings
projections that are available — predicting earnings is not yet a science. A
common substitute for the forward-looking P-e ratio is the ratio based on
the latest reported earnings. This substitute is the number that appears in
the stock tables in the newspaper, and in the sample analysis in this chapter.
When earnings are expected to grow, which is often, this retrospective P-e
ratio does not reflect the rosy earnings expectations that form the basis for
the current market price. For this reason, the calculation of the retrospective
P-e ratio can be a useful exercise in conservatism.
if the latest earnings report is to be used as a conservative estimate of
future earnings, it is important to exclude any extraordinary items:
(2) price-earnings ratio = market price per share earnings per share from continuing operations
This we can term the recurring price-earnings ratio, a measure that ex-

55
cludes extraordinary or non-recurring items:
79.8 85.7 23.8 12.7 Price-Earnings Ratio (recurring)
68.5 -583.2 14.8 15.5 Price-Earnings Ratio (net)
Ratios in the neighborhood of 70 usually are reserved for biotechnology
companies, purveyors of digital interactive services, and other speculative
issues. They arise for international Paper only as an artifact of little or no
earnings (and hence a small denominator) in 2003 and 2004. only with
the reappearance of positive earnings after 2004 do these ratios make more
sense. For perspective, a rule of thumb is that price-earnings ratios of 16
(implying as they do a 1/16th or roughly 6 percent rate of return) are “normal”
for a mature business. This is the neighborhood the company returned to
in 2005 and 2006. even there, however, the ratios should be viewed with
skepticism because the one-time $4.8 billion sale of forest land had the
effect of artificially raising earnings per share in 2006.
The usefulness of per-share measures other than earnings per share de-
pends on the variability of the number of shares outstanding. The sample
analysis includes a per-share restatement of most items on international Pa-
per’s income statement. The horizontal analysis that accompanies it reveals
little difference between the per-share change and the unadjusted change
in each item from 2003 to 2005. in 2006, on the other hand, the company
repurchased a substantial number of shares, which reduced the average for
the year from 485 to 476 million shares outstanding:
480 486 485 476 Weighted Average Common
Shares Outstanding (millions)
The cost of products sold decreased in dollar terms from 2005 to 2006,
but increased on a per-share basis. Similarly, net sales were slightly higher
in dollar terms, but had a greater increase on a per-share basis, because of
the decrease in shares outstanding.
The Operating Cycle and Short-Term Solvency
chapter iii presented the current ratio as a measure of short-term sol-
vency. The current ratio is poorly suited for its assigned task because it does
not account for time. A business’s current assets might outweigh its current

56
liabilities by the vaunted 2:1 margin, but the ratio is of little consequence
if the liabilities are all due tomorrow and the assets are all raw materials
inventories. That is an extreme example, of course, but solvency does depend
on the composition of current assets and the timing of current liabilities.
Accountants analyze asset composition in terms of quality, which is the
likelihood of an asset’s conversion to cash without any loss, and liquidity,
which is the amount of time and effort the conversion will take. Two key
measures of asset composition are inventory and receivables turnover, which
measure the liquidity of those assets.
A turnover ratio expresses sales volume for a period as a multiple of the
balance in an asset account. The asset balance usually is an average for the
period, which can be calculated many ways. The most common method,
especially with annual data, is to take the average of the beginning and end-
ing balances for a period. Another common method of calculating an annual
average, if quarterly data are available, is to take the average of the four
end-of-quarter balances. The more change there is in an asset account, the
more important it is to include several interim balances in the average.
inventories are valued at cost, so an accurate inventory turnover ratio
must value sales at cost too. The cost of products sold, rather than net sales,
therefore is the appropriate denominator of the inventory turnover ratio:
(3) average inventory turnover = cost of products sold/average inventory
inventory turnover rose steadily from 2003 to 2006, from 5.8 to 8.5.
Although these developments clearly were favorable, increasing turnover
is not always a good thing. Frequent stockouts and large order backlogs
may interrupt production and drive away customers. Still, this rise most
likely reflects the widespread adoption of just-in-time methods of inventory
management, and as such can be read as a sign of increased efficiency.
Turnover ratios typically use annual sales in the numerator, measuring the
number of times a business must replenish its average stock of inventories
in a year. An alternative way to evaluate the pace of sales is to measure the
time it takes to sell the average stock:
(4) days to sell average inventory = 365/average inventory turnover
many analysts consider this measure easier to interpret than the inven-

57
tory turnover ratio.
inventory turnover and days to sell inventories do not measure the liquidity
of inventories directly, unless the business in question makes most of its sales
for cash. The prevailing practice outside of the retail sector is to sell on credit,
which gives rise to accounts and notes receivable. Receivables turnover and
days to collect receivables are thus important measures of liquidity:
(5) average receivables turnover = net sales/average gross receivables
(6) days to collect average receivables = 365/average receivables turnover
it is appropriate to use net sales in the turnover ratio, rather than the cost of
sales, because businesses value receivables at the sales price of merchandise,
not at cost. Similarly, the analyst should use gross receivables to compute
turnover, not net receivables, because the allowance for uncollectible ac-
counts reflects a reduction in quality rather than an increase in liquidity.
international Paper’s experience with receivables collection improved
slightly during this period. Low or declining receivables turnover is unfa-
vorable, indicating slow sales or a weak collections effort. High receivables
turnover has its own drawbacks; a business with high receivables turnover
may be turning away sales by insisting on stringent credit terms. As with
inventory turnover and other turnover ratios, a business must strike a bal-
ance between excessive caution and overtrading.
Businesses can boost turnover by discounting receivables. Discounting
is the sale of receivables to third parties before maturity, usually for less
than face value. This is an age-old business practice, but the recent trend
toward the securitization of every conceivable form of credit has made
it increasingly popular. if a business sells receivables “with recourse,” it
continues to bear the risk of uncollectible accounts. Selling with recourse
is a form of off-balance-sheet financing, and it overstates the receivables
turnover ratio if the allowance for uncollectible accounts is inadequate. it
is important to check for disclosure of this practice in the notes to a busi-
ness’s financial statements.
Days to sell inventory and days to collect receivables are informative
measures by themselves, but it also is useful to consider them together:
(7) operating cycle = days to sell average inventory
+ days to collect average receivables

58
The gradual improvements in the various turnover measures that went
into the operating cycle combined to reduce it considerably, from 111 days
in 2003 to 87 in 2006. in other words, inventories are sold more rapidly and
payments for them are received more quickly in 2005 and 2006.
The length of a business’s operating cycle determines its short-term
financing needs and is a gauge of its solvency. in traditional financing ar-
rangements, a business takes out short-term loans to buy inventories and
then repays the loans from collections of receivables. When these arrange-
ments prevail, the liabilities due during the next operating cycle should not
exceed the average amounts of cash, receivables, and inventories, plus a
margin of safety.
Turnover, Efficiency, and Flexibility
Turnover ratios are not limited to inventories and receivables; they can
be computed for any asset, for groups of assets, and for some liabilities too.
Above, we introduced inventory and receivables turnover as starting points
for solvency analysis, but that application is unique to those two ratios. All
turnover ratios measure how intensively businesses use their resources,
including receivables and inventories.
every turnover ratio involves a trade-off. With inventories, businesses
must balance costly excess stocks, the symptom of low turnover, against
shortages, production bottlenecks, and other perils of high turnover. With
receivables, low turnover suggests inefficient collection efforts or poor credit
screening; high turnover suggests sales lost due to tight credit. in general,
the trade-off is between efficiency and flexibility.
efficiency involves minimizing the cost of existing operations by maxi-
mizing the use of resources. An efficient business maintains or increases its
earnings by keeping its profit margins high. in contrast, flexibility involves
minimizing the cost of expanding operations by keeping resources in reserve.
often it is possible to expand operations by expanding the resource base,
but usually it is cheaper to press into service the idle resources on hand. A
flexible business boosts its earnings by increasing its volume of operations
and its market share.
The analyst has hundreds of turnover ratios to choose from, given the
variety of assets and liabilities and the many possible groupings in either
category. The sample analysis of international Paper’s income statement
presents four of the most useful ratios (not counting inventory and receiv-
59
ables turnover), three for assets and one for liabilities. net sales is the
numerator of all four ratios. These four ratios all followed the same pattern
as the company’s inventory and receivables turnover, increasing from 2003
to 2006. However, asset and liability ratios take opposite interpretations:
high turnover indicates an efficient, inflexible use of assets and a flexible,
inefficient use of liabilities.
cash turnover is important because cash is the lifeblood of business. A
business with excessive cash turnover bears a significant risk of insolvency.
The analyst should determine the adequacy of such a business’s short-term
credit facilities. excessive cash balances, on the other hand, are a sign of
inefficiency; there is no return on idle cash balances. There is a return on
temporary investments, however, so a low turnover of cash and temporary
investments is more efficient than an equally low turnover of cash alone.
Accounts payable turnover is important because trade credit is free, unlike
other forms of credit, as long as it is paid promptly. Because the balance of
accounts payable is closely related to the volume of sales, changes in this
ratio are particularly important. When sales are rising, increasing turnover
indicates that a business could be taking greater advantage of this source
of free financing. When sales are falling, increasing turnover suggests a
curtailment of trade credit, which could be disastrous. Decreasing accounts
payable turnover indicates deterioration in a business’s current position and
an increasing risk of insolvency.
Fixed assets turnover and total assets turnover are broad measures of asset
utilization. Both ratios emphasize the utilization of capital assets rather than
current assets. Total asset turnover tends to be more useful for analyzing
service businesses, which rely heavily on intellectual property and other
intangibles, than for manufacturing businesses, for which fixed asset turn-
over is vital. These ratios can fluctuate widely because capital investment
and corporate acquisitions produce large changes in assets.
Long-Term Solvency
Solvency is a business’s ability to meet its cash obligations on time and
in full. Short-term solvency therefore depends on the adequacy of cash
flows. over the long term, solvency includes an additional hurdle: a busi-
ness must earn enough to maintain its financial and physical capital. When
capital maintenance is inadequate, a business is reducing the scale of its
operations, which tends to involve a gut-wrenching series of write-offs and

60
reorganizations — and often bankruptcy — rather than an orderly liquida-
tion process. These difficulties attending a failure to maintain capital can
increase substantially the risk of short-term insolvency.
From the long-term creditor’s point of view, it is a risky proposition to
lend to a business that has a capital maintenance problem. Depreciation,
write-offs, and other non-cash expenses allow a financially sound business
to build up cash reserves to meet its principal repayment requirements.
When revenues are insufficient to cover non-cash expenses, however, the
risk that the business will default on its principal rises, because there is no
opportunity to set aside the necessary cash. A business in this position can
avoid default by refinancing its debt, but given the poor operating results,
creditors will require higher interest payments to assume the increasing risk.
This situation can develop into a vicious circle, in which increased interest
payments put a burden on cash flows that erodes solvency even further,
raising both the cost of future refinancing and the likelihood of default.
The interest coverage ratio is one of the most useful measures of long-
term solvency:
(8) interest coverage ratio = pretax operating earnings net interest expense
An interest coverage ratio greater than 1 indicates that a business’s operat-
ing earnings exceed its interest expense, in which case a business has met all
of its cash obligations (except for income taxes), and thereby has achieved
short-term solvency. Having met its operating expenses, which include
non-cash allowances for capital maintenance, the business also has attained
long-term solvency. it is appropriate to exclude income taxes from this cal-
culation because interest and most operating expenses are tax-deductible,
so taxes apply only when income remains after these deductions.
A quick way of determining a business’s long-term solvency is to check
whether pretax earnings are positive. if so, then the interest coverage ratio
will be greater than 1. The drawback of this method is that there is no simple
way to compare the pretax earnings of different businesses. The analyst can
use pretax earnings to determine that two businesses are solvent, but only
the interest coverage ratio will reveal which one enjoys a greater margin
of solvency.
A conservative measure of long-term solvency is the fixed charges ratio.

61
The phrase “fixed charges ratio” has generated more than the usual degree
of inconsistent usage. Some analysts equate it with the interest coverage
ratio. The Sec has published an extraordinarily complex formula for the
ratio that it requires in official disclosures. The following formula is much
simpler:
(9) fixed
charges = pretax operating earnings
ratio net interest expense + principal repayment requirements
This ratio is appropriate when the pattern or amount of a business’s depre-
ciation and other non-cash charges differs markedly from that of its sinking-
fund requirements and other principal repayments. This is most likely to be
the case among businesses that borrow for purposes other than acquiring
depreciable assets. The conservative bias applies to businesses that do use
depreciation to accumulate cash reserves. Double counting occurs in these
cases because principal repayment requirements appear in the denominator
while depreciation, their proxy, is deducted from the numerator.
The judgments of the professional credit-rating services are important
adjuncts to the analyst’s own work, especially for the inexperienced analyst.
The major rating services are moody’s, Standard & Poor’s, Fitch, and egan-
Jones. most public libraries carry publications from one or more of these
services. each service has its own proprietary rating system, but they all
are variations on the letter grades used in schools. You may obtain ratings
free on-line by registering with moody’s at www.moodys.com.
Judging by its pretax earnings, international Paper remained solvent from
2003 through 2006. But this financial success did not come easy, resulting
as it did from a one-time sale of forestlands in 2006. The implication is
that the company struggled, through a series of drastic measures, to remain
competitive, albeit at a much smaller scale of operations. To S&P, at least,
such measures were deemed virtuous attempts to strengthen international
Paper’s credit-worthiness.
Whereas moody’s downgraded the rating from Baa2 to Baa3 in December
of 2005, a subsequent report by S&P commended the company’s attempts
to reduce long-term debt. The report noted that international Paper had
splurged on debt-financed acquisitions in the years leading up to 2001.
“Thus, it limited its acquisitions and share repurchases, held its dividend

62
level flat, and made moderate-size divestitures in order to restore its credit
profile. iP’s commitment to maintaining an investment-grade rating and its
use of more than one-half of its $11 billion of asset-sale proceeds for debt
reduction are important considerations in our ratings.” (Ratings Direct: In-
ternational Paper Co., Standard & Poor’s, December 5, 2007, p. 5, emphasis
added.) Accordingly, S&P’s rating of BBB was upgraded from a “negative
watch” (or outlook) in 2005 to a “stable watch” in 2006. (conversely, when
in 2008 international Paper announced a plan to buy parts of its competitor,
Weyerhaeuser, S&P announced a negative credit watch.)
Leverage and Return on Investment
Long-term solvency is the bondholder’s paramount concern because it
ensures an uninterrupted series of interest and principal payments. The bond-
holder’s investment decision hinges almost exclusively on an assessment
of risk, because the returns on bonds are essentially fixed. up to a point,
bondholders can demand higher interest payments for assuming unusual
risks, but this strategy becomes self-defeating when debt service becomes
so burdensome as to weaken a borrower’s financial position.
The shareholder’s investment decision is an assessment of risk and return.
Shareholders’ returns are uncertain, unlike bondholders’, so shareholders
must determine whether a corporation can use borrowed funds effectively,
rather than merely competently. Shareholders stand to gain much more than
bondholders if a corporation uses leverage effectively. Long-term solvency
is, of course, a major concern of shareholders, but it weighs relatively less
in their investment decisions.
A key element of a business’s effective use of leverage is the cost of
borrowing, which the analyst should weigh against the benefits of borrow-
ing, if possible. The income statement affords a rough measure of the cost
of borrowing:
(10) average effective interest rate = net interest expense average borrowed funds
Borrowed funds in this equation consist of short-term notes payable
and long-term debt, including current maturities. An exact measure of the
effective interest rate would use the weighted average of borrowed funds
outstanding, but that seldom is disclosed.

63
An interest rate acts as a hurdle rate of return for capital investment proj-
ects and corporate acquisitions to be financed by borrowing: investments
expected to return less than the prospective interest rate do not “clear the
hurdle” and should not be undertaken — the costs are likely to outweigh
the benefits. Because businesses base investment decisions on prospective
rates, the average effective interest rate is useful primarily for assessing
projects already undertaken. When interest rates are relatively stable,
however, the average effective rate can provide a reasonable forecast of
prospective rates.
The cost of leverage is readily identifiable — it is interest expense, the
return to bondholders — but the benefits of leverage are more difficult to
measure. in most cases, it is impossible for equity owners to distinguish
the extra returns attributable to leverage from the returns that a business
could have provided without using leverage, given the same equity base.
even when businesses disclose to equity owners detailed accountings of
the returns on each capital project and acquisition, which seldom happens,
there is not necessarily an exact correspondence between borrowings and
investments. For these reasons, the analyst must infer the benefits of lever-
age from measures of return on investment.
Return on investment quantifies a management’s efficiency in employ-
ing the resources entrusted to it. Return-on-investment measures are ratios
of returns to resources. There are a number of ways to count a business’s
returns and resources, so the scope of return-on-investment ratios can vary
considerably. one of the broadest and most important ratios is return on
assets:
(11) return on assets = pretax operating earnings/average total assets
it includes every resource on the balance sheet, however financed, and the
broadest measure of net returns. To be any broader, a return-on-investment
ratio would have to include off-balance-sheet-financing items, such as op-
erating leases and the debt of unconsolidated subsidiaries. A similar ratio
using gross returns (i.e., sales) in the numerator would be a turnover ratio.
Turnover measures the intensity of the use of resources, whereas return on
investment measures efficiency.
From the shareholder’s point of view, return on equity is a key return-
on-investment ratio:

64
(12) return on equity = earnings applicable to common shares average common shareholders’ equity
This ratio is a more selective measure than return on assets. Whereas
return on assets measures management’s ability to earn a return using the
assets at hand, return on equity measures management’s ability to provide
a return to shareholders using the available equity base.
Although disclosures and analyses commonly cite return on equity, it
suffers from some serious drawbacks. First, the book value of common
shareholders’ equity often bears little relation to its market value, so that
shares cannot be purchased at anything approaching book value. For corpora-
tions in this situation, return on equity is not a literal measure of returns to
shareholders. Second, the book value of equity does not include tacit forms
of equity, such as minority interest (for which market value also can differ
markedly from book value) and deferred income tax liabilities.
Despite these drawbacks, return on equity is a useful ratio. one important
use for the ratio is in evaluations of the effectiveness of leverage:
(13) financial leverage index = return on equity return on assets
Leverage enables a business to purchase a stock of assets larger than
its equity base. if those extra assets are more productive than the cost of
borrowing, then return on equity exceeds return on assets and the financial
leverage index exceeds 1. This is the desired result. if the financial leverage
index equals 1, then leverage is a wash. if the index falls below 1, leverage
is doing more harm than good.
As the subprime crisis of 2007-2008 reminds us, leverage can be a double-
edged sword. Leverage boosts return on equity during the fat years. on the
other hand, leverage produces a disproportionate drop in return on equity
when profits fall, whether for firm-specific reasons or during a recession.
in any case, not much general meaning should be ascribed to the gyrations
of international Paper’s financial leverage index in the years surveyed. Per-
haps the main explanation for the sharp drop in the index from 2005 to 2006
is that the company chose to take part of the proceeds from its one-time sale
of forestlands to pay off over $2 billion of debt. This decision, as reported

65
in the footnotes to the annual report, shows up in the table as a reduction in
average borrowed funds from $14.7 billion in 2004 to $9.7 billion two
years later.
Shareholder Returns
Return on equity indicates management’s efficiency in providing a return
to shareholders, but it is a poor measure of shareholder returns. Return on
equity is enormously useful because it summarizes the flood of data that the
GAAP framework makes possible. The problem with return on equity is the
problem with GAAP: it accounts for only a portion of the transactions that
affect corporate share prices. changes in share prices constitute the bulk
of shareholder returns, so it is GAAP’s failure to account for these changes
that makes return on equity such a poor measure of shareholder returns.
Accounting data measure the past transactions of a corporation, but the
price of its shares depends on investors’ expectations about the corporation’s
future transactions. changes in earnings expectations play a particularly
large role in determining share prices. in addition, there are many transac-
tions that a corporation does not make that can affect its share price, such
as those that change interest rates and other economic conditions, and those
that change the prices of other corporations’ shares.
Together with share-price changes, dividends are a major component of
shareholder returns. Dividends are significant because they are much more
reliable than share-price increases; they usually are paid on an announced
schedule, and usually in cash. By contrast, capital gains come and go with
the vagaries of the stock market, and they can be converted to cash only
once. The reliability of dividends makes dividend yield a useful measure
of shareholder returns:
(14) dividend yield = dividend per share market price per share
By adjusting corporations’ dividends for their share prices, this ratio
affords direct comparisons of the payouts of different corporations. in in-
ternational Paper’s case, a steady year-to-year dividend payment of $1 per
share is divided by the stock price to give the modest dividend yield.
A corporation’s dividend yield is readily comparable to the percent change
in its share price because both are expressed in percentage terms. The sum

66
of these two measures gives (with some rearrangement):
(15) total return = dividend per share + change in market price on common shares beginning market price
This formula applies only when there are no extras, which include spin-
offs, warrants, rights, stock dividends, and other non-cash distributions to
shareholders. if applicable, the cash value of extras should be added to the
numerator of equation (15). Total return is the bottom line from the share-
holder’s point of view. it is a comprehensive measure of the factors affecting
a shareholder’s investment experience, from management performance to
investor sentiment.

67

68
INTERNATIONAL PAPER COMPANYConsolidated Statement of Cash Flows (Indirect Method)
For the Year Ended December 31, 2006
Operating Activities (in millions)
Net Earnings 1,050 Cumulative Effect of Accounting Changes Non-cash Items:
Productivity improvement charge 453
Depreciation and amortization 1,158
Deferred income taxes 1,619
Gain on sales of forestlands (4,788)
Business sales 1,496
Other, net 376 Changes in Current Assets and Liabilities:
Accounts and notes receivable
Inventories (43)
Accounts payable and accrued liabilities (202)
Other 104 Cash Provided by Operations $ 1,223
Investment Activities Invested in Capital Projects ($1,009)Mergers and Acquisitions:
Plants, Properties, and equipment 529
Other assets and liabilities, net (48)Net proceeds from sales of forestlands 1,635 Other Investment (73)Cash Used for Investment Activities $ 1,034
Financing Activities Issuance of Common Stock, net of repurchases ($1,401)Monetization of Timber Notes 4,850 Issuance of Debt 223 Reduction of Debt (5,391)Dividends Paid (485)Other Financing (100)Cash Provided by Financing Activities ($2,304)
Effect of Exchange Rate Changes on Cash $30
Change in Cash and Temporary Investments ($17)Cash and Temporary Investments: Beginning of Year 1,641 End of Year $ 1,624
Adapted from International Paper Annual Report for 2006 (Memphis, TN: Interna-tional Paper Company, 2007), p. 51. The notes on pp. 54-88 of the Annual Report are an integral part of the original statement.

69
VI.
THE CASH FLOW STATEMENT
Ah, take the cash, and let the credit go,
Nor heed the rumble of a distant drum!
– The Rubaiyat of Omar Khayyam
A cash flow statement reconciles an enterprise’s beginning and ending
cash balances for a given accounting period by listing the various
sources and uses of cash. The total of those items is the net change
in cash (the difference between the beginning and ending balances). The cash
flow statement is a close cousin of the familiar bank statement. By the same
token, cash flow is what you keep track of in your checkbook, an exercise
in cash-basis accounting. Synonyms for the statement of cash flows include
statement of changes in financial position, funds statement, and statement
of sources and applications of funds, or “source & app” for short.
The cash flow statement resembles and complements the income state-
ment. The income statement applies accrual accounting data to measure
profitability. it does so by accounting for the change in retained earnings
(except for the portion due to transactions with owners). But the income
statement can only hint at solvency, because accrual accounting does not
distinguish between cash and non-cash revenues and expenses.
The cash flow statement measures solvency by applying cash-basis
accounting data to account for the change in cash. on the other hand, the
cash flow statement is inappropriate for measuring profitability because
depreciation (the provision for capital maintenance, a necessary element
of any measure of profitability) is a non-cash item.
As the example at left shows, an important function of the cash flow
statement is to classify cash flows into three broad categories: operating,
investing, and financing activities. This classification reveals a business’s
ability to finance expansion internally and its reliance on outside financ-
ing. ideally, a business should generate large cash inflows from operations,
augment them with the leverage of cash inflows from financing, and, after
providing for sufficient cash reserves, expand its operations via cash outflows
for investing. Given the imperfect circumstances that prevail in practice,
the appropriate course of action rarely is so clear.

70
TECH DATA CORPORATIONConsolidated Statement of Cash Flows (Direct Method)
For the Year Ended January 31, 2007
Cash Flows from Operating Activities:
Cash received from customers $21,185,902
Cash paid to suppliers (21,091,764)
Cash paid for interest (26,901)
Cash paid for income taxes (81,216)
Net Cash from Operating Activities ($ 13,988)
Cash Flows from Investing Activities:
Proceeds from sale of business $ 16,500
Capital expenditures (31,667)
Software development (12,062)
Fixed asset disposal 3,563
Net Cash from Investing Activities ($ 23,666)
Cash Flows from Financing Activities:
Issuance of common stock $ 25,183
Credit line, net (164,824)
Proceeds from issuance of convertible debentures 342,554
Cash paid for purchase of treasury shares (80,093)
Excess benefit from stock-based compensation 544
Long-term debt repayments (1,611)
Net Cash from Financing Activities $ 121,753
Foreign exchange effects $ 24,242
Net Increase in Cash $ 108,341
Cash at Beginning of Year 156,655
Cash at End of Year $ 265,006
Item: Depreciation 53,280
Source: Annual cash flow from 10K statement, Wall Street Journal on-line edition.
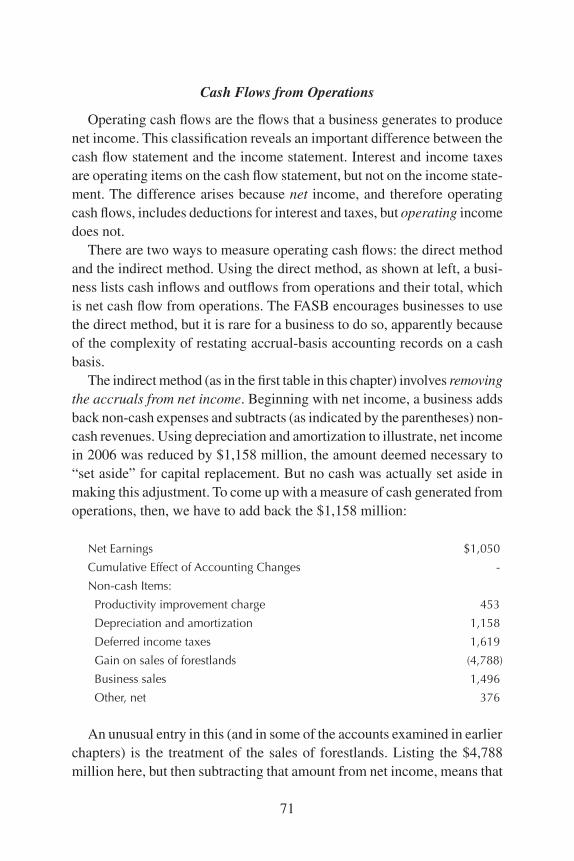
71
Cash Flows from Operations
operating cash flows are the flows that a business generates to produce
net income. This classification reveals an important difference between the
cash flow statement and the income statement. interest and income taxes
are operating items on the cash flow statement, but not on the income state-
ment. The difference arises because net income, and therefore operating
cash flows, includes deductions for interest and taxes, but operating income
does not.
There are two ways to measure operating cash flows: the direct method
and the indirect method. using the direct method, as shown at left, a busi-
ness lists cash inflows and outflows from operations and their total, which
is net cash flow from operations. The FASB encourages businesses to use
the direct method, but it is rare for a business to do so, apparently because
of the complexity of restating accrual-basis accounting records on a cash
basis.
The indirect method (as in the first table in this chapter) involves removing
the accruals from net income. Beginning with net income, a business adds
back non-cash expenses and subtracts (as indicated by the parentheses) non-
cash revenues. using depreciation and amortization to illustrate, net income
in 2006 was reduced by $1,158 million, the amount deemed necessary to
“set aside” for capital replacement. But no cash was actually set aside in
making this adjustment. To come up with a measure of cash generated from
operations, then, we have to add back the $1,158 million:
Net Earnings $1,050
Cumulative Effect of Accounting Changes -
Non-cash Items:
Productivity improvement charge 453
Depreciation and amortization 1,158
Deferred income taxes 1,619
Gain on sales of forestlands (4,788)
Business sales 1,496
Other, net 376
An unusual entry in this (and in some of the accounts examined in earlier
chapters) is the treatment of the sales of forestlands. Listing the $4,788
million here, but then subtracting that amount from net income, means that

72
the sale was not for cash. in other words, it added to net income, but not to
cash available. more on this shortly.
in any case, we are not quite finished tabulating cash flow from opera-
tions. now we turn from adjustments in items in the income statement to
those pertaining to the balance sheet: to assets and liabilities. The indirect
method adds the increases in certain current liabilities and subtracts the
increases in certain non-cash current assets to arrive at net cash flow from
operations:
Changes in Current Assets and Liabilities:
Accounts and notes receivable -
Inventories (43)
Accounts payable and accrued liabilities (202)
Other 104
Cash Provided by Operations $1,223
The changes in current assets and liabilities appearing here reflect the
net change in non-cash working capital. Remember that working capital
is defined as current assets minus current liabilities. it includes not only
cash but also the items listed above. To find the net cash made available
by operations, in other words, we need to deduct the non-cash increase in
working capital.
it is also worth mentioning what gets left out of the adjustments just
outlined. This calculation excludes the changes in dividends payable, notes
payable, and the current portion of long-term debt; and on the assets side,
changes in loans receivable. The calculation of operating cash flows also
excludes changes in non-current assets and liabilities, because only invest-
ing and financing activities involve cash transactions that produce changes
in those accounts.
From the reader’s point of view, the direct method is better than the indi-
rect method. First, the FASB requires businesses that use the direct method
to present as a supplementary disclosure the indirect method’s reconcilia-
tion of net income and operating cash flows. Second, the indirect method
reveals little about a business’s operations that does not also appear on the
income statement or the balance sheet. Third, like the income statement, the
direct-method cash flow statement reveals the composition of a business’s
revenues and expenses, but on a cash basis rather than an accrual basis, thus

73
providing additional useful information.
Cash Flows from Investing and Financing
The use of the indirect method is an option only for presenting cash flows
from operations. Businesses must use the direct method to present cash flows
from investing and cash flows from financing; there are no accrual-basis
measures of these activities to restate on a cash basis.
investing activities are transactions that affect non-current asset accounts,
specifically fixed assets and investments in subsidiaries and in other affili-
ates. cash flows from investing arise from capital investment projects, sales
of fixed assets, mergers and acquisitions, divestitures, purchases and sales of
securities, loans, and a variety of similar transactions. of particular interest
here is the entry for net proceeds from sales of forestlands, a source of $1.6
billion. in cash terms, this is the net effect of the deal, over and above the
offsetting financial swaps that show up in the statement for cash provided
by operations and cash provided by financing activities:
Invested in Capital Projects ($1,009)
Mergers and Acquisitions:
Plants, properties, and equipment 529
Other assets and liabilities, net (48)
Net proceeds from sales of forestlands 1,635
Other Investment (73)
Cash Used for Investment Activities $1,034
investment is a vital business activity because depreciation is inevitable.
Given the current rapid advances in technology, businesses must contend
with obsolescence as a source of depreciation in addition to traditional
wear and tear. A business that does not invest enough to compensate for
depreciation is shrinking its capital base and the scale of its operations. As
described on page 60, such shrinkage seldom is an orderly process.
in general, financing is a vital source of cash for businesses that require
a level of investment greater than cash flows from operations. This situation
is typical of young, developing businesses and of companies intent on rapid
expansion. Financing activities include most transactions that affect equity
and long-term liabilities, including the current portion of long-term debt.
(At the same time, however, retained earnings are affected by operating

74
activities that produce net income.) cash flows from financing arise from
long-term borrowings and repayments, issues of stock, purchases and sales
of treasury stock, payments of dividends, and other related transactions:
Issuance of Common Stock ($1,401)
Monetization of Timber Notes 4,850
Issuance of Debt 223
Reduction of Debt (5,391)
Dividends Paid (485)
Other Financing (100)
Cash Provided by Financing Activities ($2,304)
Several points can be noted concerning these entries. The first item is
negative, because rather than issuing new stock for cash, international Paper
repurchased stock in the amount of $1.4 billion. it thus used cash to buy
some of its own outstanding shares, which now will be termed “treasury
stock” on the balance sheet. As to dividends, the payments of $1 a share
on a year-end total of 485 million outstanding shares also gave rise to a
cash outlay.
most notable are the two opposite-signed entries of roughly $5 billion
each. The first, $4.850 billion for the monetization of timber notes, can be
viewed as an offset to the deduction of $4.788 billion in the initial section
on cash provided by operations. The other big number is for retirement of
long-term debt, which used up $5.391 billion in cash.
one interpretation (though the footnotes hardly permit a definitive read-
ing) of the effect of the sale of forestlands on cash flow in 2006 might run as
follows. The company sold nearly all of its remaining forestlands for roughly
$5 billion. This gain added to its income (and indeed gave it a positive net
income for the year). But the sale was not paid for in cash (which is why the
amount had to be subtracted from net income in the indirect version of cash
provided by operations). instead, the sale was to be paid off at some future
period. in the meantime, the company turned around and issued short-term
notes on the future amount due, described here as monetization of timber
notes, raising $4.850 billion in cash. Then it used the cash and another $500
million besides to pay off longer-term debt. How will it repay the monetized
notes? From the amount due in payment of the initial sale, in some future
period. By this reading, the one-time sale of forestlands in effect permitted

75
a reduction of long-term debt (and future interest payments).
What we can say with more confidence is that in 2006 international
Paper generated about $1 billion in cash from its operations and a compa-
rable sum from its investments. Then it used about the same amount, $2.3
billion, for financing activities. The net change in cash balances was thus
a $17 million reduction.
Finally, three minor points remain. First, the statement of cash flows clas-
sifies dividend payments as financing transactions, but it classifies interest
payments as operating transactions. This classification is counterintuitive
because interest arguably is a financing item. By the definition above, how-
ever, financing activities must affect long-term liabilities or equity. interest
payments do not affect either, so they are not financing activities. interest
also is one of the items in the computation of net income, which makes it
an operating cash flow.
Second, certain investing and financing transactions require no cash
flows. examples include purchases and sales of fixed assets in exchange
for mortgages; mergers, acquisitions, and investments involving debt-equity
swaps and exchanges of equity; and conversions of convertible securities to
common stock. The statement of cash flows must include a separate schedule
of these non-cash transactions, if they are material.
Third, the effect of exchange-rate changes on cash discloses the change
between balance-sheet dates in the dollar value of cash balances denomi-
nated in foreign currencies. exchange-rate changes are not strictly cash
flows, but they appear in the statement of cash flows because they are
necessary for reconciling the change in cash balances. Businesses subject
to exchange-rate changes list this item separately from operating, invest-
ing, and financing activities because exchange-rate changes do not reflect
a business’s own transactions.

76

77
VII.
ANALYSIS OF THE CASH FLOW STATEMENT
moST nonprofessionals throw away annual reports well before
reaching the statement of cash flows. in contrast to the wide-
spread familiarity of the income statement and the balance sheet,
the cash flow statement remains somewhat obscure, even among financial
professionals. one reason for this obscurity is that GAAP did not require
businesses to prepare cash flow statements until 1971. The relative lack of
exposure, however, is no indication of this statement’s usefulness. Those
who take the time to understand and analyze a business’s cash flows will
gain a valuable perspective on its solvency, the quality of its earnings, its
reliance on outside financing, and the adequacy of its cash flows for main-
taining and expanding operations.
A useful analysis of these topics requires some rearrangement of the
cash flow statement, as the sample analysis on the following pages shows.*
Published cash flow statements follow a 3-part format, which breaks out
cash flows from operating, investing, and financing activities. instead, we
will focus here on a 2-part breakdown of the sources and uses of cash, in-
cluding subtotals for operating and investing activities. This 2-part format
allows for a proper common-size analysis, so we have recast international
Paper’s cash flow statement in two parts in the sample analysis. To retain all
the useful information from the 3-part format, the sample analysis presents
net financing cash flows as an addendum.
Earnings Quality and Operating Cash Flows
Accrual accounting affords managers substantial discretion. if they are
so inclined, managers can use this discretion to obfuscate performance and
manipulate earnings estimates by using “shoehorn accounting,” the practice
of structuring questionable transactions to fit the letter of GAAP, but not its
spirit. The majority of businesses do not bend the rules, of course, but when
interests conflict, as owners’ and managers’ interests often do, reasonable
people will disagree about legitimate exercises of discretion. An analysis
* Having photocopies of these four pages at hand will make the discussion of the sample analysis easier to follow.
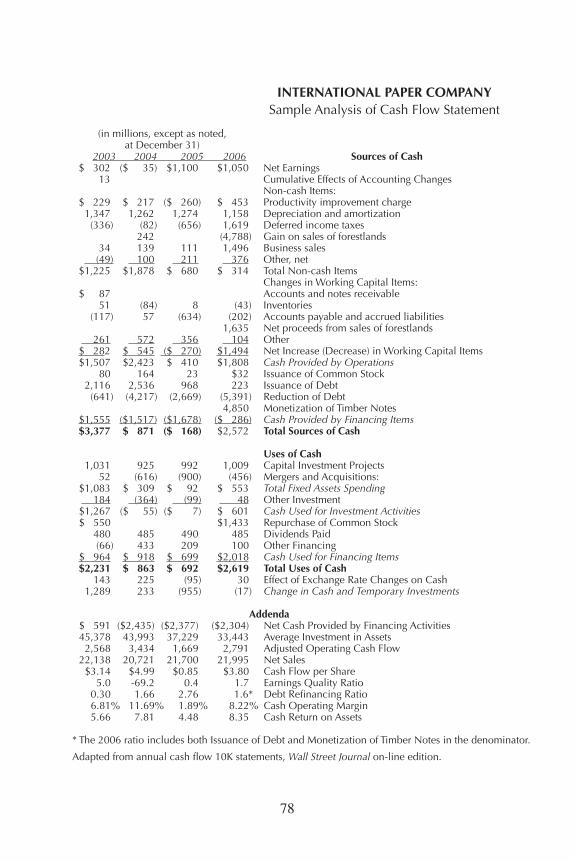
78
INTERNATIONAL PAPER COMPANY
Sample Analysis of Cash Flow Statement (in millions, except as noted, at December 31) 2003 2004 2005 2006 Sources of Cash $ 302 ($ 35) $1,100 $1,050 Net Earnings 13 Cumulative Effects of Accounting Changes Non-cash Items: $ 229 $ 217 ($ 260) $ 453 Productivity improvement charge 1,347 1,262 1,274 1,158 Depreciation and amortization (336) (82) (656) 1,619 Deferred income taxes 242 (4,788) Gain on sales of forestlands 34 139 111 1,496 Business sales (49) 100 211 376 Other, net $1,225 $1,878 $ 680 $ 314 Total Non-cash Items Changes in Working Capital Items: $ 87 Accounts and notes receivable 51 (84) 8 (43) Inventories (117) 57 (634) (202) Accounts payable and accrued liabilities 1,635 Net proceeds from sales of forestlands 261 572 356 104 Other $ 282 $ 545 ($ 270) $1,494 Net Increase (Decrease) in Working Capital Items $1,507 $2,423 $ 410 $1,808 Cash Provided by Operations 80 164 23 $32 Issuance of Common Stock 2,116 2,536 968 223 Issuance of Debt (641) (4,217) (2,669) (5,391) Reduction of Debt 4,850 Monetization of Timber Notes $1,555 ($1,517) ($1,678) ($ 286) Cash Provided by Financing Items $3,377 $ 871 ($ 168) $2,572 Total Sources of Cash Uses of Cash 1,031 925 992 1,009 Capital Investment Projects 52 (616) (900) (456) Mergers and Acquisitions: $1,083 $ 309 $ 92 $ 553 Total Fixed Assets Spending 184 (364) (99) 48 Other Investment $1,267 ($ 55) ($ 7) $ 601 Cash Used for Investment Activities $ 550 $1,433 Repurchase of Common Stock 480 485 490 485 Dividends Paid (66) 433 209 100 Other Financing $ 964 $ 918 $ 699 $2,018 Cash Used for Financing Items $2,231 $ 863 $ 692 $2,619 Total Uses of Cash 143 225 (95) 30 Effect of Exchange Rate Changes on Cash 1,289 233 (955) (17) Change in Cash and Temporary Investments Addenda $ 591 ($2,435) ($2,377) ($2,304) Net Cash Provided by Financing Activities 45,378 43,993 37,229 33,443 Average Investment in Assets 2,568 3,434 1,669 2,791 Adjusted Operating Cash Flow 22,138 20,721 21,700 21,995 Net Sales $3.14 $4.99 $0.85 $3.80 Cash Flow per Share 5.0 -69.2 0.4 1.7 Earnings Quality Ratio 0.30 1.66 2.76 1.6* Debt Refinancing Ratio 6.81% 11.69% 1.89% 8.22% Cash Operating Margin 5.66 7.81 4.48 8.35 Cash Return on Assets
* The 2006 ratio includes both Issuance of Debt and Monetization of Timber Notes in the denominator.
Adapted from annual cash flow 10K statements, Wall Street Journal on-line edition.

79
As percentages of 2003 levels As fractions of total sources** (index numbers Annual
(common-size statements) or trend percentages) percent changes2003 2004 2005 2006 2004 2005 2006 2004 2005 2006 0.09 (0.04) (6.55) 0.41 -12% 364% 348% -111.6% -3,242.9% -4.5%
0.07 0.25 1.55 0.18 95 (114) 198 -5.2 -219.8 -274.2 0.40 1.45 (7.58) 0.45 94 95 86 -6.3 1.0 -9.1 (0.10) (0.09) 3.90 0.63 24 195 (482) -75.6 700.0 -346.8
0.28 (1.86) -100.0 0.01 0.16 (0.66) 0.58 409 326 4,400 308.8 -20.1 1,247.7 (0.01) 0.11 (1.26) 0.15 (204) (431) (767) -304.1 111.0 78.2 0.36 2.16 (4.05) 0.12 153 56 26 53.3 -63.8 -53.8
0.03 0.02 (0.10) (0.05) (0.02) (165) 16 (84) -264.7 -109.5 -637.5 (0.03) 0.07 3.77 (0.08) (49) 542 173 -148.7 -1,212.3 -68.1
0.64 0.08 0.66 (2.12) 0.04 219 136 40 119.2 -37.8 -70.8 0.08 0.63 1.61 0.58 193 (96) 530 93.3 -149.5 -653.3 0.45 2.78 (2.44) 0.70 161 27 120 60.8 -83.1 341.0 0.02 0.19 (0.14) 0.01 205 29 40 105.0 -86.0 39.1 0.63 2.91 (5.76) 0.09 120 46 11 19.8 -61.8 -77.0 (0.19) (4.84) 15.89 (2.10) 658 416 841 557.9 -36.7 102.0
1.89 0.46 (1.74) 9.99 (0.11) (98) (108) (18) -197.6 10.6 -83.0 1.00 1.00 1.00 1.00 26 (5) 76 -74.2 -119.3 -1,631.0
0.31 1.06 (5.90) 0.39 90 96 98 -10.3 7.2 1.7 0.02 (0.71) 5.36 (0.18) (1,185) (1,731) (877) -1,284.6 46.1 -49.3 0.32 0.35 (0.55) 0.22 29 8 51 -71.5 -70.2 501.1 0.05 (0.42) 0.59 0.02 (198) (54) 26 -297.8 -72.8 -148.5 0.38 (0.06) 0.04 0.23 (4) (1) 47 -104.3 -87.3 -8,685.7 0.16 0.56 261 0.14 0.56 (2.92) 0.19 101 102 101 1.0 1.0 -1.0 (0.02) 0.50 (1.24) 0.04 (656) (317) (152) -756.1 -51.7 -52.2 0.29 1.05 (4.16) 0.78 95 73 209 -4.8 -23.9 188.7 0.66 0.99 (4.12) 1.02 39 31 117 -61.3 -19.8 278.5 0.04 0.26 0.57 0.01 157 (66) 21 57.3 -142.2 -131.6 0.38 0.27 5.68 (0.01) 18 (74) (1) -81.9 -509.9 -98.2
0.18 (2.80) 14.15 (0.90) (412) (402) (390) -512.0 -2.4 -3.1 investment in assets = total assets + accumulated depreciation - current liabilities adjusted cash flow = cash provided by operations + income tax payments + interest payments
cash flow per share = cash provided by operations/weighted average shares outstanding earnings quality ratio = cash provided by operations/net earnings debt refinancing ratio = reduction of debt/issuance of debt cash operating margin = cash provided by operations/net sales cash return on assets = adjusted operating cash flow/average investment in assets
** Detail items may not add up to total, because of rounding.

80
of the sources of cash, particularly operating cash flows, provides outsiders
with an independent perspective on a business’s affairs, one that manage-
ment can only manipulate fraudulently. This independent perspective acts
as a check against management’s exercises in spin control, and against more
serious abuses of discretion.
For most businesses, the three most important sources of cash are net
earnings, depreciation, and financing items. net earnings and depreciation
also account for the bulk of most businesses’ operating cash flows. The
common-size statements in the sample analysis for 2003-2006 reveal that
international Paper fit this pattern as regards the first two. in contrast, a
consistent year-by-year reduction of debt left the third, financing items, as
a use of cash, not a source, from 2004 on.
As the checklist on page 3 notes, unusual accounting practices that require
further scrutiny (those that may be distorting earnings) are likely to show up
in the section on non-cash items in the sources of cash. non-cash amounts
are easier for managers to manipulate than are cash amounts because the
amounts of non-cash items often depend on management’s own estimates
rather than on verifiable transactions. in contrast, cash items all involve
transactions, which generate paper trails. it generally takes fraudulent acts
to manipulate line items generated by transactions.
managers who wish to put a positive spin on earnings have two ways
to do so. They can exaggerate non-cash additions to earnings (deductions
from operating cash flows). or they can understate non-cash deductions
(additions to operating cash flows). non-cash additions to earnings are
of greater concern to the analyst than understated non-cash deductions,
because a deduction, however much it is understated, is still a deduction. it
does not have the potential to boost reported earnings above operating cash
flows, whereas non-cash additions do. in a nutshell: the quality of earnings
is highly suspect when net earnings exceed operating cash flows.
in one case of exaggerated earnings, a company recorded a write-off of
fixed assets as a current asset, thus deferring the write-off expense. The
company used its plans to sell the fixed assets to justify its unusual account-
ing. on the cash flow statement, this maneuver understated the amount of
write-offs and overstated the increase in operating working capital, but it had
no effect on net cash flows, which illustrates the value of the independent
perspective that the cash flow statement provides.
As noted in the last chapter, international Paper’s cash flow statements

81
pose a different problem of interpretation. The 2006 sale of $4.8 billion of
forestlands appears as a reduction in cash in the operations section of the
account, implying that the sale was for credit. But an almost equal amount
appears below, under financing items, for “monetization of Timber notes.”
By this reading, the effect of extending credit (by accepting notes, not cash,
for the sale) was canceled out when the Timber notes were sold for cash.
(Then the proceeds, it appears, were used to reduce debt.)
in any case, international Paper had some problems with earnings quality,
as measured by the earnings quality ratio:
(1) earnings quality ratio = cash provided by operations net earnings
When either net earnings or operating cash flows are negative, as in 2004,
the analyst should use the difference between the two to measure earnings
quality, because interpretation problems arise when negative numbers enter
into the ratio. A ratio of 1.0 indicates that a business produced a dollar of
operating cash flows for every dollar of earnings. For a given level of earn-
ings, a higher ratio is more favorable.
5.0 -69.2 0.4 1.7 Earnings Quality Ratio
A ratio below 1.0, as in 2005, indicates unfavorable circumstances that
the analyst should examine carefully. The reason to be concerned about low
earnings quality is that a business cannot use net income to pay dividends,
invest in plant and equipment, or repay loans; it must have cash.
When there is a substantial gap between earnings and cash flows, whether
due to low earnings quality or, conversely, to low earnings, it is useful to
compare the traditional accrual-basis measures of profitability with their
cash-basis counterparts:
(2) cash flow per share = cash provided by operations weighted average common shares outstanding
(3) cash operating margin = cash provided by operations net sales

82
(4) cash return on assets = adjusted operating cash flow average investment in assets
These ratios do not measure profitability, of course, because cash flows do
not account for depreciation. But the ratios do gauge the efficiency of a busi-
ness’s operations. non-cash items, which often account for much of the gap
between earnings and cash flows, tend to distort measures of efficiency.
cash flow per share complements earnings per share. Arguably, preferred
dividend requirements should be deducted from the numerator to obtain cash
flows applicable to common shares. But that measure has less analytical
significance than earnings applicable to common shares.
$3.14 $4.99 $0.85 $3.80 Cash Flow per Share
$ 0.63 -$0.07 $ 2.27 $2.21 Earnings per Common Share
The cash operating margin provides an alternative to the net profit margin.
6.81% 11.69% 1.89% 8.22% Cash Operating Margin
1.36 -0.17 5.07 4.77 Net Profit Margin
The analyst also can use adjusted operating cash flow (operating cash
flows before deducting cash payments for income taxes and interest) in
the numerator to obtain a cash-basis ratio comparable to the gross profit
margin. As a counterpart to operating profits, adjusted operating cash flow
also serves as the numerator of cash return on assets.*
5.66 7.81 4.48 8.35 Cash Return on Assets
2.86 3.12 2.80 14.05 Accrual Return on Assets
Solvency and Financing Cash Flows
Strictly speaking, an enterprise is either solvent or insolvent. either it
can meet its obligations promptly and in full or it cannot. When financial
markets were less developed and when bankruptcy laws were stricter, deter-
* The main difference between the average investment in assets, the denominator of cash return on assets, and average total assets, the denominator of the accrual-basis ratio, is that the first counts fixed assets gross of depreciation (as if no depreciation had occurred). A minor difference is that the investment in assets counts operating working capital rather than total current assets. Although complex, these adjustments ensure comparability.

83
mining insolvency was a simpler matter. Today, businesses can draw on cash
flows from financing activities practically indefinitely. Healthy companies
can roll over long-term debt indefinitely, or retire it by issuing stock. Such
companies can draw on standby lines of credit to weather unexpected or
seasonal cash squeezes.
in short, solvency is a matter of degree. Still, in recent years international
Paper tried to shore up its balance sheet by retiring debt, not borrowing more.
From gross and net perspectives, the result was the same. Financing items
were users of cash, not sources. (We reverse the signs in column 3 to adjust
for a negative denominator in each ratio, total sources of cash, in 2005.)
Issuance of Common Stock 0.02 0.19 0.14 0.01
Issuance of Debt 0.63 2.91 5.76 0.09
Reduction of Debt (0.19) (4.84) (15.89) (2.10)
Monetization of Timber Notes 1.89
Cash Provided by Financing Items 0.46 (1.74) (9.99) (0.11)
The picture is much the same for the net issuance of debt:
Issuance of Debt 0.63 2.91 5.76 0.09
Less: Reduction of Debt (0.19) (4.84) (15.89) (2.10)
Less: Monetization of Timber Notes 1.89
Net Issuance of Debt 0.44 (1.93) (10.13) (0.12)
The debt refinancing ratio also measures this relationship:
(5) debt refinancing ratio = reduction of debt issuance of debt
The cash flow statement makes no distinction between short-term and
long-term debt. This matters for the 2006 entries because we list the short-
term source of cash, “monetization of Timber notes,” along with the issu-
ance of new long-term debt. When the two entries are combined to find the
value of the denominator, the ratio becomes 1.06. Since this value exceeds
one, a net reduction of debt took place in 2006, just as in 2004 and 2005.
When, on the other hand, a business relies increasingly on financing
items to provide cash, it becomes a riskier investment. if it borrows more,

84
debt service will place mounting demands on operating cash flows. credi-
tors face the risk that the business will be unable to employ the proceeds of
borrowing profitably enough to meet those demands. if not, equity owners
risk a dilution of their interests, because the business will have to grant
creditors an equity interest or it will have to raise additional equity capital,
or even sell assets, to pay off creditors in cash.
Just as international Paper made strenuous efforts to reduce its long-term
debt over this period, it also engaged in a substantial stock repurchase in
2006. That one-time repurchase greatly outweighed the issuance of stock for
the entire four years. Both the debt reduction and the stock repurchase are
touted in the company’s annual report as steps to strengthen the company’s
capital structure and benefit company stockholders.
Cash Flow Adequacy
in sum, a business’s operations must generate cash receipts adequate to
fund certain key expenditures if the business is to avoid excessive reliance
on outside financing—and the trend toward insolvency that accompanies it.
First, to avoid outright insolvency, a business’s operating cash receipts must
satisfy all of its obligations to suppliers and employees, and its interest obli-
gation to creditors. operating cash receipts need only meet interest payments
because refinancing is a legitimate source of cash for principal repayment.
Second, operating cash receipts should provide for the maintenance of the
existing stock of fixed assets. Third, if sales are rising, operating receipts
should finance the necessary additions to the stock of working capital.
A business should consider paying a dividend only if its receipts from
operations suffice to meet these three key expenditures. if not, a dividend
would be either a redistribution from creditors to equity owners or a return
of capital, but not a return on capital. This dividend policy is not a univer-
sal dictum, however. one notable exception is that a subsidiary’s dividend
payments are likely to reflect its parent’s cash needs, notwithstanding any
disinvestment concerns. in addition, steady and rising dividend payments are
an important device for attracting investors. most companies resist cutting
dividends unless cash shortfalls threaten to persist for some time.
“Free cash flow” is the name that many analysts apply to the amount of
operating receipts remaining after a business has provided for the hierarchy
of expenditures outlined above. That said, no single definition of free cash
flow has gained widespread acceptance, although the name itself is widely

85
used. “Free” refers to management’s discretion in using free cash flow to
expand productive capacity, to invest in other companies, or to clean up the
balance sheet by retiring debt and equity. (This, to repeat, is what interna-
tional Paper did in 2006.)
one reason for the lack of agreement about what constitutes free cash
flow is that cash-basis accounting makes no distinction between capital
maintenance and the expansion of productive capacity. Absent this dis-
tinction, analysts muddle through using a variety of approximations to the
idealized measure described above.
one such approximation is the following formula:
(6) free cash flow = cash provided by operations
– fixed assets spending
– inventory additions
– dividends
Because the indirect method of computing operating cash flows is so
prevalent, it generally is impractical to use gross cash receipts from opera-
tions as a starting point for the analysis.
As a dollar amount, free cash flow is not conducive to comparisons
among companies, or to industry averages. The cash flow adequacy ratio,
which falls below 1.00 when free cash flow is negative, allows for such
comparisons:
(7) cash flow adequacy ratio =
cash provided by operations + inventory additions fixed assets spending + inventory additions + dividends
The measure of fixed assets spending used in these calculations includes
both capital maintenance and spending to expand the company’s produc-
tive capacity.
one way to gauge the amount of capital maintenance is to compare total
fixed assets spending to depreciation and amortization:
(8) cash reinvestment ratio =
depreciation and amortization + proceeds from fixed assets sales fixed assets spending

86
A related measure of cash flow adequacy is the asset replacement ra-
tio:
(9) asset replacement ratio = cash provided by operations – dividends average investment in assets
This asset replacement ratio alters the ranking of cash uses presented in
the calculation of free cash flow. The difference is the emphasis on what is
left over after the payment of dividends:
(10) cash provided by operations – dividends = free cash flow
+ fixed assets spending
in the ratio, dividends come before purchases of fixed assets. The pre-
sumption is that all of the cash from operations that remains after dividends
are paid will go toward the purchase of fixed assets.
Still, the ratio does not measure actual asset replacement. instead, it mea-
sures the adequacy of operating cash flows to fund fixed assets spending.
in any case, a useful rule of thumb here is that operating cash flows should
suffice to replace between 8 and 10 percent of the stock of assets annually.
Just as with the ratios we have listed in this chapter, of course, much will
depend on a company’s specific circumstances.
Earnings Quality, Cash Flow, and Enron
A recurring theme in this chapter is that cash flow is harder to manage
or finesse than earnings. The corollary? Whether for routine “earnings
management” or for more serious deceptions, in the end cash flow’s truth
will out.
in particular, a widely monitored ratio is the one that opened this chapter:
earnings quality, or cash-provided-by-operations divided by net earnings.
The word “operations” in this context means the ongoing, mainstream activ-
ity of the company—not one-time or gimmick transactions.
As noted earlier, when the earnings-quality ratio falls below one, earn-
ings are not being matched by commensurate cash flow. This imbalance is
a red flag. it signals the likelihood that management has inflated earnings
via artificial estimates and one-time or non-recurring deals. in other words,
managers may be trying to keep the company’s stock price afloat by creating
87
the illusion of sustained (and sustainable) high earnings.
in 2001, a growing suspicion by some analysts and journalists about earn-
ings quality led to the fall of the house of cards that was enron. As the next
chapter describes, enron relied on pumped-up “mark-to-market” estimates
of earnings, and it created offshore (and off-the-books) “special purpose
entities” that allowed the company to maintain the illusion. But where was
the cash flow to match? Was it generated by ongoing operations?
once observers posed these two cold questions, the game soon ended,
imposing losses on creditors and shareholders of about $100 billion. nor
was that the end of the story. Something similar happened again in 2007,
when the “structured investment vehicles” created by some of the world’s
largest banks turned out to be hiding places for off-balance-sheet holdings.
We can trace this sequence one step at a time, beginning with the account-
ing scandals of 2001 and a set of reforms that proved inadequate to the
problems yet to come.

88

89
VIII.
ACCOUNTING FRAUD: ENRON’S LINGERING SHADOW
AccounTinG fraud came to the center of the public stage in
2001 and 2002, as enron, Global crossing, Qwest, and Worldcom
were accused of cooking their books on a multi-billion dollar
scale. Accounting is an art, not a science. There is always a fair amount
of “creative accounting” going on as to how corporations choose to re-
port their operations to the investing public. But these four cases, along
with insider loan deals at Adelphia and Tyco and a host of lower-profile
scandals, caused enough of a stir to get congress to enact the Sarbanes-
oxley Act in July 2002.
Sarbanes-oxley imposed sterner penalties for accounting fraud and
made ceos and cFos responsible for wrongdoing at lower levels. But as
the subprime mortgage debacle of 2007 would reveal, it also left in place
dubious off-balance-sheet accounting practices enron had employed that
would bring a new round of excesses, abuses, and massive losses by some
of the world’s largest banks.
For perspective, a few preliminary points are in order. First, not all ac-
counting fraud takes place in big corporations. Some of the most lurid ac-
counting scandals are about trusted bookkeepers who loot small businesses,
undiscovered, over extended periods of time.
Second, not all accounting gimmickry constitutes fraud. Sometimes it’s
just questionable, not illegal. moreover, different companies use more “ag-
gressive” or more “conservative” practices. in that context, what matters
most to the outside observer is the consistency of the methods used over
time. For example, when a company known for conservative methods sud-
denly shifts to more aggressive ones (so as to make earnings look higher),
a red flag goes up.
Third, not all corporate corruption is an accounting scandal. Sometimes,
as in the Adelphia or Tyco cases, it takes the form of covert sweetheart loans
to board directors or executives, granted just as a company’s solvency is
about to be called into question.
Still, it remains true that large-scale illegal accounting schemes have
dotted the landscape of corporate America in recent years. This chapter
poses a few basic questions about the enron-era scandals:

90
• Whydocompaniescheat?• Howdotheydoit,traditionallyandtoday?• Whereweretheauditorswhenweneededthem?• Whatchanges,ifany,didSarbanes-Oxleybring?
“Managed Earnings”: Why Companies Routinely Massage the Books
Whatever the other reasons, one recurring theme is the link between a
company’s quarterly profit, as reported in the income statement, and the
company’s stock price.
managers care what happens to the price of the company’s stock for
several reasons. They may own stock outright themselves. A variant is
owning stock options, whose value will depend in part on the current price
of the stock. Also, top managers’ pay may depend on incentives linked to
the performance of the stock.
in turn, the price of a company’s stock can be influenced by accounting
practices. The context is a peculiar ritual in which a company’s managers
provide outside analysts with information that helps the analysts come up
with advance estimates of earnings and earnings per share. if the company’s
actual numbers fall short of such estimates, even if only by a few cents per
share, the company’s stock price can sometimes be driven down by several
dollars.
The fear of this outcome can lead managers in a company to engage in
“creative accounting” to meet the quarterly earnings estimates and main-
tain the stock price. The most obvious ways to do that are (1) anything that
will make revenues look bigger than they were and (2) anything that will
make expenses look smaller than they were. Since earnings (or profits) are
revenues minus expenses, either avenue will give the desired overstatement
of earnings.
Tricks of the Trade
As for the actual mechanics, a list of accounting tricks might include
these:
Accelerating revenues. in April 2007 international Rectifier, a technol-
ogy company, announced that one of its foreign subsidiaries had committed
accounting irregularities that included “premature revenue recognition of
product sales.” in may the company added that the same subsidiary had

91
entered phony revenues in connection with “shipment of products and the
recording of sales with no obligation by customers to receive and pay for the
orders” (quoted in Herb Greenberg, “Accounting Scandals: not a Problem?”
The Wall Street Journal, July 7-8, 2007).
Channel-stuffing. This is a related trick, in which shipments are made
at the end of the quarter and recorded as revenues, even though some of
the shipments will be returned in the next quarter. A variant is recording
as revenues shipments sent to distributors, when the distributors have the
right to send back any unsold products. either way, this quarter’s revenue
goes up, albeit artificially.
Accelerating expenses preceding an acquisition. if the expenses for a
takeover target are registered early, before the company is acquired, the result
will be that the post-takeover books will have that much lower an entry for
the acquiring firm. The result will be higher earnings than otherwise. This
was a favorite ploy of Tyco in the late 1990s.
Round-trip deals. AoL used this device to inflate its on-line advertising
revenue by over $1 billion back when it was trying to justify the high price
Time-Warner was paying to merge with it in 2000. What were the round
trips? AoL paid inflated prices to its suppliers (typically computer or server
vendors), who then turned around and used the premiums they had received
to buy advertising on AoL. (Think “kickbacks.”)
Other income or expense. The word “other” in an accounting context
typically refers to operations not in the company’s main line of activity,
and thus best entered in a separate category. But this device may provide
a company with an opportunity to match some of its operating expenses
with “other income” (derived perhaps from a sale of land or buildings).
Then the operating expenses in effect disappear. earnings from operations
rise apace.
Pension plans. Depending on the interest rate used to estimate future pension
obligations, and also on the performance of the fund’s assets in financial markets,
expenses can be understated or revenues overstated, giving the appearance of
higher earnings than a company actually achieved from its operations.

92
Off-balance-sheet items (and conduits). As both enron and the subprime
mortgage meltdown of 2007 illustrated, some companies control subsid-
iaries that serve as off-the-books parking places for debt that has actually
been incurred by the parent company. The rule: if the parent owns less than
50 percent of the subsidiary, it does not need to show the subsidiary’s ac-
counts in its own financial statements. This can be convenient, because one
company can have full control of another even without owning 50 percent
of its stock.
Synthetic leases. instead of buying a new plant and listing the loan to
pay for it on the balance sheet as a liability, a company can lease it for five
or ten years and record the annual payments as expenses. However, at the
end of the lease, the company is then obliged to buy the building anyway, at
a full price. What is gained in the years of the lease by way of minimizing
debt is lost when the bill eventually comes due.
“Big Bath” charges. These occur when a company does a write-down
on assets that have previously been listed in the balance sheet but are now
written down or off as no longer having value. This is not deceptive in itself.
But it may provide opportunities to throw in unrelated but embarrassing
transactions, just to get them covered up. Put another way, when a company
announces that it is “restructuring,” it may look for ways to dispose of any
number of left-over sins.
The cookie jar. This is a slush fund set up to smooth out the ups and
downs. it appears that at Beazer Homes uSA, in good times executives “set
aside funds, or record an accrual, for some future liability. This results in an
expense against the current period’s profit and an entry on the company’s bal-
ance sheet of an accrual, or reserve, for a liability. The idea is that down the
road, if bad times hit, the company can reverse or write down…the liability,
and flow that amount back through the income statement.” (michael corkery
and David Reilly, “Beazer’s Accounting Woes extend Roller coaster Ride,”
The Wall Street Journal, on-line edition, August 16, 2007.)
The Accounting Fraud Crisis of 2001 and 2002
creative accounting soared to new heights at the millennium, apace with
the bursting of the dot-com bubble and a shake-out in the telecommunica-
93
tions industry. The backdrop was a wave of overinvestment by competing
telecom companies, in an ill-advised race to see who could reach households
first with the most in telephone-plus-internet services. in that context, per-
haps the most dramatic new accounting abuses were introduced by enron,
Global crossing, Qwest, and Worldcom, of which only the middle two
now survive.
The fraudulent four had several things in common. First, as an energy
company and three telecommunications businesses, they were all networked
businesses, either for electricity on power grids or for bandwidth to carry
digital data and messages (or both). Second, all were new companies, al-
though before its total transformation in the 1990s enron had existed as a
traditional natural-gas utility; the other three went public in the mid-to-late
1990s. Third, they all used the same auditor. (See Lawrence A. cunningham,
“The Sarbanes-oxley Yawn,” university of connecticut Law Review, Vol.
36, 2003.)
in the heady days leading up to the millennium, the four young network-
based companies managed to convey the illusion of blazing trails where
no accountant had gone before. When they came up with new accounting
sophistry to inflate their earnings and stock prices, their auditor-in-common,
Arthur Andersen, went along with the experiment.
How did they do it, and why did it come crashing down? Several new
tricks came into play.
Abuse of pro forma accounts. one device was a “pro forma” or as-if set
of accounts to eliminate the effect of a supposedly one-time or non-recurring
event from a company’s accounts. it was relatively traditional, having al-
ready been used by plenty of old-economy companies. A company issues
two versions of the financial statements—one for what actually happened,
and the other (more pleasant) as if an unpleasant event had not occurred. An
example might be when an insurance company takes a one-time charge for
earthquake claims, even though next year might bring some other equivalent
natural disaster. A typical gambit here would be a footnote telling the reader
not to pay attention to the pro forma accounts, as they conflict with GAAP.
The premise, however, is that no one actually reads the footnotes.
Global crossing, the Bermuda-based telecommunications giant, was a case
in point. Founded in 1997, Global crossing went public to the tune of $40
billion in 1998 in one of that era’s typically inflated iPos, only to go bankrupt

94
within two years. Lacking a coherent strategy, operating models, or healthy
cash flows, the company created the illusion of growth through acquisitions
of other companies—which it paid for with its own inflated stock. Then it
covered up its operating weakness by means of pro forma accounts.
Capitalizing expenses (“cap-exing”). Then there was Worldcom, oper-
ating under the name mci, which it had acquired in its acquisition spree
in the 1990s. As with Global crossing, Worldcom used acquisitions as a
way to buy the appearance of growth. When on antitrust grounds the FTc
issued a decree forbidding Worldcom from taking over Sprint, the house
of cards began to shudder. in a jam, Worldcom came up with a brazen way
of showing a profit for the year 2000.
one of Worldcom’s operating expenses was “line costs,” the fees World-
com paid to local phone companies for use of their lines in Worldcom’s
long distance calls. in the pinch, Worldcom decided that about one-third
of its $22 billion in 2001 line costs should be treated instead as a capital
expenditure. The pretext was that that $7 billion in line costs could be viewed
as an asset that would give rise to income in future years. in other words,
a current operating expense of about $7 billion was taken off the income
statement and listed as an asset on the balance sheet.
The result of “cap-exing” this expense was to reduce current operating
expenses by $7 billion, leaving the company showing a slight profit for the
year. This is where things got interesting inside the company. For one thing,
in prior years all the line costs had been listed as expenses in the income
statement. So here was a red-flag scenario: a company changing its account-
ing methods from conservative to aggressive as the need arose.
Beyond that, investigators later learned that the original journal entries
had been recorded as operating expenses. But when the journals were ag-
gregated and posted into the larger accounts, executives high in the company
overrode the journal entries and shifted some amounts to capital expendi-
tures. When the auditor, Arthur Andersen, was asked about the entries and
the overrides, its professional ruling was, in effect, “no problem.”
Network capacity-swapping. Deals between Global crossing and Qwest,
another new provider of local telephone service, took advantage of new
methods of cooking the books via “capacity-swapping.” Telecommunica-
tions firms may have legitimate reasons to exchange pipeline capacity with

95
one another, to make up for gaps in their own networks. What happened by
2000 was that aggressive accounting techniques were introduced to make
such swaps seem to generate increased earnings—when in fact no money
actually changed hands.
A simplified example shows how the numbers could be doctored. if a
carrier built new lines at a cost of $100, it could record the cost as a current
operating expense (of $100), or it could capitalize the expense, spreading
it out over, say, five years, recognizing an expense of $20 this year, $20
next year, and so on. either approach might be valid, depending on cir-
cumstances.
now suppose that the same new capacity is swapped with a competing
carrier, and the exchange is assigned a value of $125 in each direction. no
money changes hands, just carrying capacity. Revenue can then be recorded
at the time of delivery as $125. The corresponding expense, according to
the basic accounting principle of matching an expense to the revenue as-
sociated with it, should be $100. So far, even though no cash flow will ever
accompany this swap, the income statement will show revenue of $125 and
corresponding expense of $100, for a profit of $25, or 25%.
The companies took this sleight of hand a step further. instead of match-
ing the $100 expense to the $125 of (bartered) revenue, they capitalized
the expense over five years, giving an expense this year of $20. now the
income statement would show revenue of $125 and expense of $25, for a
$100 addition to income.
if the swaps had been given an even higher (artificial) value as revenue,
the result would have been even bigger boosts to income. Also, companies
on each side of the swap could play the same game with the books, creat-
ing the illusion of rapid increases in earnings and earnings per share. one
problem, from their point of view, was how to keep the charade going in the
out years, when the amortized expense would continue, and new (artificial)
revenues would have to be found to offset it. Another, more immediate
issue was the absence of cash flow to match the inflated earnings figures.
enter enron.
Enron, the SEC, and Mark-to-Market Valuation
in 1992, while it was still a traditional utility in the pipeline business,
Houston-based enron obtained a favorable ruling from the Sec as to how
the company could value its assets. This Sec green light on what has

96
come to be known as “fair value accounting” opened the door to enron’s
financial sleight of hand through the 1990s. The ruling gave the company
substantial leeway in applying “mark-to-market” methods to value the
company’s assets.
The traditional accounting approach is to value assets at their historical
cost: the price paid to acquire them. This tends to be conservative, in that
it is likely to understate the asset’s current market value. of course, where
an asset depreciates over time, formulas are used to write it down from
its historical cost, year by year. But for an asset like land, whose value is
likely to rise over time, its book value does not rise apace but remains an
understatement: its historical cost.
enron managed to get the Sec to allow the company to use more opti-
mistic valuations of its assets than the historical-cost approach. its mark-
to-market valuations took natural gas contracts reaching over 20 years into
the future and added up their present discounted value. Whether the future
payments would ever actually be made was another question. The effect
was to create new assets on current balance sheets—and gains translating
into higher reported earnings.
in this way, estimated (and uncertain) future revenue streams got booked
in the current period as gains in the value of assets, raising bottom-line net
earnings right away. Where did such contracts come from, and who would
make good on them? in addition to the accounting tricks already noted
in this chapter, enron also created bogus trading partners to generate its
mark-to-market estimates.
it set up supposedly independent “Special Purpose entities” (SPes) that
were secretly controlled by enron executives. Like the more recent Struc-
tured investment Vehicles of the subprime meltdown, SPes offered off-bal-
ance-sheet parking places, notably to hide much of enron’s debt. They also
served as trading partners to engage in “round-trip” and capacity-swapping
transactions to create the illusion of rapid growth in enron’s revenue and
earnings. meanwhile, some enron executives were also secretly profiting
from the SPes’ operations. in sum, the transactions between enron and the
SPes were hardly “arm’s-length” or independent market transactions.
Toward the end of the 1990s, the share of assets on enron’s balance sheet
that had been conjured up by mark-to-market techniques rose abruptly. The
amount jumped from $5 billion in 1999 to $21 billion in 2000, raising the
share from 15 percent of reported assets to 31 percent. it was later deter-

97
mined that during this same period the company reported its debt as $10
billion, or less than half the actual total of $22 billion. in short, the use of
mark-to-market valuation and SPe tricks reached a peak in 2000—the last
year the company bothered to file audited financial statements.
in the end, enron’s meteoric growth turned out to be an illusion. As noted
at the end of the last chapter, when market analysts began to question the
quality of earnings and absence of positive cash flow, the stock price started
to fall, and the SPes were exposed as synthetic constructs. When the party
ended in late 2001, roughly $100 billion in fabricated assets would disappear
more or less overnight. When the bankruptcy court set out to salvage assets
to pay creditors, all that remained to be liquidated was the infrastructure of
a traditional pipeline utility company, a small fraction of the assets enron
had claimed on its balance sheet.
This issue of how to assign value to assets on a balance sheet turned out
to be pivotal not only for enron, but later for financial institutions in the
subprime crisis of 2007.
Where Were the Auditors?
When the fraud endemic to the four companies eventually came to light,
it was not because an auditor found them out and blew a whistle. instead,
the auditor was part of the cover-up.
Partly in response to investigative reporting by a Wall Street Journal
team, the Sec announced an investigation of enron. At that point, Arthur
Andersen intentionally destroyed large numbers of records and documents.
This amounted to obstruction of justice, a felony. That was the end of Arthur
Andersen.
Before long the Big Five public accounting firms had become today’s Big
Four. Today these four private partnerships audit companies that have over
90 percent of the world’s stock market value. They are Deloitte & Touche,
ernst & Young, KPmG, and Pricewaterhousecoopers (itself created in the
1998 merger of Price Waterhouse and coopers & Lybrand).
it should be added, however, that each of these four large public ac-
counting firms also had its own auditing scandal in the early years of the
decade. So while Arthur Andersen had truly gone to the dark side, the other
big public accounting firms (the auditors) were also implicated in a variety
of illegal practices.
The net result was that the Sarbanes-oxley reforms passed in 2002 were in

98
part a response to the problem of the auditors—not just of big companies that
had hopped the tracks. even under the new, post-2002 standards, however, the
four big auditing firms do not claim to be able to find accounting fraud where
it has been orchestrated from the higher ranks within an audited company.
Reasonable—Not Absolute—Assurance
From the auditors’ point of view, their job is to provide something called
“reasonable assurance” that a company’s books are on the up and up. Ac-
cording to Dennis nally, head of Pricewaterhousecoopers, “if the public has
a view that the auditor’s report on a set of financial statements is designed
to provide absolute assurance, that is not what the auditing profession and
the [auditing] literature requires today. We’re providing reasonable assur-
ance. There’s a big difference between absolute and reasonable.” (David
Reilly, “Accounting’s crisis Killer,” The Wall Street Journal, march 23
2007, on-line edition.)
Technically, auditors are charged with examining a company’s financial
statements to see if they contain any “material misstatements.” misstate-
ments are erroneous numbers that may reflect simple numerical errors, errors
in interpreting accounting rules—or deliberate fraud. They are “material”
if they are large enough to make a difference in the meaning the numbers
convey to a person reading the financial statements. (otherwise, they are
immaterial, meaning not worth worrying about.)
Because of the detail and complexity of financial statements, auditors rely
on statistical sampling techniques, rather than checking every entry. They
may check the largest magnitudes, or the ones most likely to yield misstate-
ments. in any case, once material misstatements are found, the auditors will
bring them to the company’s attention so that they can be fixed. As noted in
chapter i, only then can the auditors sign off on the statements.
According to a “forensic accountant,” here is where the problem of
detecting fraud arises. The auditors are much more likely to find acciden-
tal errors than deliberately cooked entries—or fraud. The reason is that
when someone sets out to come up with phony numbers, the network of
adjustments that can be made may prove difficult to pin down. in other
words, as long as the obvious links between numbers seem to jibe, it can
be difficult if not impossible to find anything wrong. Remember, not all
the numbers are examined, just a sample. (Tracy L. coenen, “Why Didn’t
our Auditors Find the Fraud?” in Wisconsin Law Journal, January 2006,

99
on-line at www.wislawjournal.com.)
The upshot is that by signing off on a company’s books, auditors do not
claim that they can say with total assurance that the books are clean. instead,
they claim only a reasonable assurance. Thus the auditor’s signature at the
end of an annual report really only means that a professional has given a
fairly thorough look at the financial statements and found them to conform
to Generally Accepted Accounting Principles, or GAAP.
By the same token, it turns out that audits are rarely the means by which
fraudulent corporate behavior is discovered. According to a study of 230
cases of alleged corporate fraud between 1996 and 2004, only 10 percent
came to light via audits. nearly half were discovered by means of internal
checks or whistle-blowing employees. Analysts and media (as in The Wall
Street Journal’s investigative reporting on enron) registered another 21
percent between them. (Alexander Dyck, Adair morse, and Luigi Zingales,
“Who Blows the Whistle on corporate Fraud?” nBeR Working Paper no.
12882, February 2007.)
What Did the Sarbanes-Oxley Act Do?
The Sarbanes-oxley (SoX) Act of 2002 was intended to provide inves-
tors with more confidence about the reliability of corporate accounting and
financial statements. it supplemented prior legislation (mainly concerning
the Sec), in light of enron’s and Worldcom’s collapse.
From a political perspective, many investors had lost much of their savings
in the dot-com bubble, and the combination of plunging stock values and
accounting scandals compelled congress to take action. Given the political
exigencies, some observers were quick to conclude that the result was more
expedient than real. indeed, in substantive terms the Act’s key provisions
may not seem to amount to much:
• makingcorporateexecutivesmoreaccountablefordubiousaccountingpractices.
• requirementsfortransparencyandfulldisclosureinfinancialstatements.• oversightandinspectionofauditors.• registrationofallpubliccompanieswithanewlycreatedPublicCompany
Accounting oversight Board (PcAoB).
• rulesforinvestmentbankandotheranalystswhomayexperiencecon-
flicts of interest.

100
• newpowersofenforcementandpunishmentwheretheseorearlierrulesare violated.
in historical perspective, SoX can be seen as an attempt to place the
rule-makers at arm’s length from the accounting profession. in 1973 the
Financial Accounting Standards Board (FASB) was created to help define
the principles the profession should follow. But it depended for its funding
on accounting’s main professional organization, the American institute of
certified Public Accountants (AicPA). Together, FASB and the AicPA
cooperated to debate and define the profession’s Generally Accepted Ac-
counting Principles (GAAP), which at last count numbered 159.
in an influential 1984 interpretation of “The House of GAAP,” Steven
Rubin portrayed FASB and AicPA as equal partners at the top of the layer-
cake of standard-setting procedures (Journal of Accountancy, June 1984,
pp. 122-128). in other words, when it came to principles, the profession
and an organization it funded collaborated.
Something similar also held for auditing standards. Here the standard-
setter was a group called the Public oversight Board, or PoB. it was also
funded by AicPA (i.e., accountants).
SoX ended these cozy arrangements. A key provision in the Act was to
shift FASB’s funding from the AicPA to public companies themselves. The
implication was that the rule-maker had been too dependent on the account-
ing profession and needed to gain arm’s-length separation.
The same intention can be seen in Sarbanes-oxley’s treatment of audit-
ing standards. Sarbanes-oxley replaced PoB with a new group, the Public
company Accounting oversight Board (PcAoB). While the alphabet soup
sounds similar, there is one big difference. PcAoB’s five-member board
would now be selected by the Sec, not by the AicPA. And its funding would
come not from the AicPA but from publicly traded companies. Put another
way, in light of the scandals of the prior few years, congress resorted to
asking the Sec itself to take a more direct role in the process.
The question that remains is whether such reforms have prevented further
examples of dubious accounting, some of which may turn out to entail ac-
counting fraud. one such practice is the backdating of stock options.
Backdated Stock Options: OK as Long as They Are Expensed
An employee, often newly hired, may be offered the option to acquire

101
the company’s stock at a future date, then to resell it in the open market.
The price the employee will have to pay (called the “strike price”) will be
a price the stock was selling for near the time the employee received the
option. if it is below the market price when the employee’s option “vests,” it
will be advantageous for the employee to cash out by exercising the option
at the strike price, then reselling at the higher market price. (if the market
price is lower than the strike price, the issue is moot.)
Stock options have been widely used in the technology sector, as a way
to attract and hold scarce high-performance, technically credentialed em-
ployees. The idea is that the employee will have an incentive to work hard
for the company so that the stock will rise. The usual practice of using a
vesting period (before which the option does not apply) is intended to keep
the employee not only working hard but also staying with company, despite
blandishments from other companies.
What is “backdating” when it comes to stock options? Backdating means
finding a date near the time the option is granted, so as to find the lowest
value of the company’s stock. For example, a new employee is given a
stock option on march 15, 2000, at the beginning of her employment. The
company’s stock that day sells for $40, a high for this particular stock. Then
bad news arrives, and the stock goes down to $30 a week later, march 22,
after which it turns around and crawls back toward $40. Someone in the
company pencils in an effective date on the stock option of march 22 (not
march 15 after all). Why? That way, once the option vests, say, three years
hence, any gain in the stock’s value will be measured relative to a strike
price of $30, not $40. every share will thus be worth $10 more than if the
agreement date were used.
now we come to the accounting problem. The increase in value to the
employee from backdating is also a cost to the company, although an al-
most invisible one on the books. As Warren Buffett and others have long
contended, it should therefore be entered as an expense on the company’s
income statement—as a cost to the company of compensating the employee.
The result of correctly entering it as an expense, of course, is to reduce
the company’s earnings (as always, the difference between revenues and
expenses).
Still, the point is that backdating stock options is legal, as long as the
expense is recorded by the company. unfortunately, almost nobody who
grants stock options bothers to mention the expense on the income state-

102
ment. That omission turns backdated stock options into accounting fraud.
nor was alleged ignorance of this technicality sufficient to keep a Silicon
Valley ceo (of a company called Brocade) out of jail, perhaps because he
used the device despite his email message to employees saying backdated
stock options were illegal. But he also told one employee, “it’s not illegal
if you don’t get caught.”
illegal backdating appears to have been a common practice that is now
likely to be handled in a more realistic and transparent way. As such, it looks
minor compared either to the practices of 2001-2002 or to the subprime
financial crisis of 2007.

103
IX.
ACCOUNTING IN THE SUBPRIME MELTDOWN
“Why were [the banks] permitted to set up those off-balance-sheet
entities that may or may not have had some formal relationship with
the bank? They were not regulated and [banks] didn’t hold an adequate
amount of capital against them. Why did that happen after the experi-
ence of Enron?”
—Paul Volcker, Chairman of the Federal Reserve, 1979-1987, in
testimony before the Joint Economic Committee, May 14, 2008
AT the time of this writing in mid-2008 the world’s financial
markets are struggling to work through a crisis of confidence
centered on subprime mortgage-based securities. (“Subprime”
means that the mortgage loans were extended to borrowers with poor
credit histories—and hence less likely to be repaid.) it turned out that
such securities could not withstand a downturn in house prices or a related
increase in mortgage delinquencies. And by April 2008 house prices had
fallen in all 20 of the largest u.S. markets, with a median decline from
peak prices of 16 percent.
This concluding chapter touches upon the accounting dimensions of the
subprime crisis, notably the use of off-balance-sheet deals by big banks to
escape regulatory oversight. We can begin by noting that the financial crisis
had three underlying sources. one was an overly expansive monetary policy
in the years following September 11, 2001, which set the stage for a tor-
rent of bad loans by financial institutions. A second and related factor was
a collapse of lending standards for home mortgages after 2004. The third
has earlier roots, traceable to financial innovations in the 1980s.
Too Much of a Good Thing: From Securitization to Liquidity Puts
During the 1980s individual home mortgages came to be combined in
“securitized” packages that could then be issued as new bonds and sold to
investors. over time this process of securitizing mortgages of different qual-
ity (i.e., varying degrees of risk) grew more refined and more widespread,
until it began to seem foolproof.
eventually, a good idea (diversifying risk by bundling more or less similar

104
mortgages through securitization) got pushed beyond its reasonable limits.
mathematical models were invoked to make the case that bundling riskier
mortgage-based assets with higher-rated assets in increasingly complex
packages could give sustained high returns. With the aid of the bond-rating
firms (and an accounting firm or two), bundles of mortgages with varying
degrees of risk got sliced up into marketable “tranches” or shares, some of
which in turn were re-bundled into new securities.
The various long-term, high-yield securities that resulted were typically
financed from short-term funds borrowed at lower interest rates. The spread
between the interest rates charged on the borrowed funds and the yields
on the long-term bundled securities was known as the “carry” on the deal.
The deal itself was part of the “carry trade.” Viewed for a time as virtually
a new stage of financial history, this version of the carry trade depended on
two key assumptions: continuing availability of short-term funds and rising
house prices. Both assumptions fell apart by mid-2007.
The securities themselves were known as collateralized Debt obligations
(cDos). They were typically packaged and sold by Structured investment
Vehicles (SiVs) or similar entities known as “conduits.” SiVs were invented
by big banks as places to hide debt, meaning to keep it off the banks’ bal-
ance sheets. SiVs and conduits provided the banks with a back-door way to
attain more leverage through borrowed money than the banking regulations
allowed. As noted in an earlier chapter, in good times increased leverage
raises earnings. But in bad times it can magnify losses.
Historically, SiVs came into being a generation ago when two emissar-
ies from citibank moved to London and set up a private shop there. The
symmetry here is that citigroup (the successor to citibank) turned out to
have ties to SiVs with assets of about $1.1 trillion in 2007, or fully half the
value of the assets citigroup carried on its own balance sheet at the end of
that year. (David Reilly, “Look under the Banks’ Hoods,” The Wall Street
Journal, on-line edition, February 29, 2008.)
As things turned out, citigroup retained a responsibility for the debt, even
though it did not show up on the bank’s balance sheet. instead, the liability
was an agreement by the bank to fund and support its SiVs. Technically,
this type of agreement came to be known as a “liquidity put,” meaning a
guarantee by the bank to re-purchase (or “repo”) the cDos at par if their
buyers wanted to unload them because of faltering returns.
in an example of how confusing such practices could get, citigroup
105
found itself making a half-billion dollar loan in mid-october 2007 that it
then immediately declared to be “non-performing,” meaning a worthless
asset. Top executives first stated optimistic readings of the company’s earn-
ings outlook, only to change their minds and announce a sharply weaker
position a few days later. The bank had, in effect, “co-signed” to make a
loan to a large London borrower. Then if other lenders opted out, citigroup
was committed to making the loan, regardless of its quality. of course, for
this commitment citigroup had received a fat fee, without having to show
any additional loans as assets on its balance sheet. When the other lenders
did back out, citigroup was left holding the bag. The loan was made, as
required, but then was immediately written off as uncollectible.
The surprising lesson from this sudden reversal was that the people who
ran citigroup did not understand how vulnerable the bank was. The arrange-
ments and liabilities proved mysterious to them, to their accountants, and,
one might add, to citigroup’s then resident adviser on risk management,
former Secretary of the Treasury Robert Rubin.
Easy Money, January 2002-July 2004
in retrospect, it appears that monetary policy remained too expansive
for too long after the recession of 2001 and the 9/11 attacks. “Real” or
inflation-adjusted interest rates hovered in the vicinity of 1 percent from
the beginning of 2002 to mid-2004. Real interest rates are widely viewed
as the true cost of borrowing money. unlike nominal interest rates (the ones
quoted in the newspaper), real interest rates take into account the rate of
inflation. if inflation is high, for example, borrowers can repay their loans
using cheaper dollars. in that case the real interest rate is much lower than
the nominal one.
Whatever the logic of Fed policy for keeping real interest rates low in
the wake of the dot-com crash and the 9/11 attacks, this easy-money policy
appears to have been pursued for too long. For two-and-a-half years, more
or less, so much liquidity was pumped into the American economy that the
real cost of loans was kept far below the levels of the 1990s.
in turn, easy money and correspondingly low mortgage rates set the
stage for the housing price bubble. House prices soared, consumers used
their homes as piggy-banks (as the saying went) by taking out home equity
loans and lines of credit, and mortgage originators could offer seemingly
irresistible terms to borrowers.

106
Throwing Caution to the Wind: Countrywide, 2004-2007
countrywide Financial was the nation’s largest private mortgage lender on
the eve of the subprime crisis, in mid-2007. The california-based mortgage
firm’s excesses between 2004 and 2007 reveal how competition for market
share led mortgage originators to lose all sense of perspective—especially
when house prices seemed only to go up. As itself one of the main casualties
of the subprime meltdown it helped create, countrywide would be sold for
a song to Bank of America in 2008.
Apart from the specific tactics the company used, countrywide was a
prime player in the “originate-to-distribute” game. This approach cut the
traditional link of accountability between the mortgage originator (such as
a savings bank) and the borrower. once originated (through the signing of
the mortgage agreement), the mortgage could be quickly distributed (sold)
to a third party, typically bundled with other mortgages in the process of
securitization. in this model, therefore, the originator has little incentive
to worry about whether the mortgage will continue to be paid off by the
homebuyer. That becomes someone else’s problem.
As to the tactics, under long-time ceo Angelo mozilo, who had built the
$200 billion company from scratch, countrywide maintained a relentless
campaign to increase market share in each of its several mortgage-related
business components. As competition heated up in 2004, when interest
rates bottomed out, countrywide began aggressively promoting so-called
“affordability loans.”
These included interest-only mortgages, adjustable-rate mortgages
(ARms), and “reduced-documentation” mortgages (also known as Liars’
Loans). The first required no repayment of principal for the mortgage’s
early years. The second, ARms, offered lower initial mortgage interest
rates, with higher rates to come later. The third, a classic subprime variant,
made mortgages available to people with poor credit histories or employ-
ment records.
As to ARms in particular, two variants show how dangerous the instru-
ments were for many homebuyers. one version carried substantial pre-
payment penalties. So rather than pay off the mortgage early, when rates
were low, borrowers were locked into eventual higher rates that would then
have to be paid over, say, 10 years or more. (This lock-in feature made them
highly attractive for re-sale to SiVs.)
The second is called a “pay-option” ARm, which leaves the timing of

107
payments up to the borrower. While this may work well for Wall Street
tycoons getting big annual year-end bonuses, it was a trap for most other
borrowers, because the unpaid interest got added to the mortgage, potentially
increasing the debt. once house prices stabilized and then started to decline,
pay-option mortgages often exceeded the market value of the house, leaving
borrowers (as the saying went) “under water.”
countrywide’s reliance on these riskier mortgage loans grew rapidly
in 2004 and after. According to a New York Times profile of the company,
subprime lending went from 4.6 percent of all its loans in 2003 to 18
percent in 2004. over the same one-year interval, ARms shot up from 18
percent of all loans to 49 percent. Pay-option ARms per se jumped from 6
percent in 2004 to 19 percent in 2005. (Gretchen morgenson and Geraldine
Fabrikant, “countrywide’s chief Salesman and Defender,” The New York
Times, november 11, 2007.)
From then on, countrywide and such counterparts as new century
Financial corporation competed with one another to see who could make
and then unload the most bad loans. (They did not describe the race in those
terms.) There followed a variety of slipshod transactions. on the borrowers’
side these included speculation by serial “flippers” who bet on ever-higher
house prices using easily obtained and often inflated mortgages. An unholy
triangle thus developed among originate-to-distribute mortgage brokers,
overly compliant real-estate appraisers, and (in some cases) buyers who
never intended to live in the houses they were buying.
But then house prices began to slow and even decline, initially in cities
and regions that had had the biggest price increases earlier in the decade.
By 2006, even as additional banks were still trying mightily to get in on
the high returns generated by the subprime game, some local real-estate
markets had already peaked.
Then in April 2007 the alarms began to sound. For one thing, two Bear-
Stearns hedge funds heavily invested in subprime securities took evasive
actions that would later get their managers indicted for deceiving investors.
For another, new century, the other giant california mortgage originator,
declared bankruptcy.
What About the Auditors?
in the wake of new century’s bankruptcy, court-appointed investigator
michael J. missal issued a 581-page report on the matter. As he put it in a

108
Reuters interview, “The predominant standard for loan quality was whether
the loans new century originated could be initially sold or securitized in
the secondary market…[which] created a ticking time bomb that detonated
in 2007.” This refers, of course, to the breakdown in accountability inherent
in the originate-to-distribute model.
Accountability or no, the debasement of mortgage-loan criteria would
come back to haunt the originator. new century held a meager $13 million
in reserves against what turned out to be billions of dollars of liabilities for
“repurchases.” These were mortgage loans returned to the company by Wall
Street securities firms because subprime borrowers (many with option ARm
mortgages) were failing to make their required payments on time, or at all.
At a crucial juncture, outside risk evaluators pointed out new century’s
untenable perch. in response, new century’s creditors closed the spigot.
The result: new century’s bankruptcy on April 2, 2007.
The missal report accused the company’s auditor, KPmG, of stretch-
ing the accounting rules for new century. KPmG remained as one of the
Big Four public accounting firms after Arthur Andersen went under in the
aftermath of enron. KPmG signed off on the woefully inadequate reserves
the company held against the liabilities for repurchases. When the alarm
sounded, it came from outsiders, not the auditor.
As with the bond rating firms (moody’s, S&P, and Fitch), the appearance
was that KPmG was earning as much or more from consulting as it was
from auditing firms per se. no wonder a partner of the firm would tell his
own auditors, in e-mail cited by missal, to lighten up with the audit because
“we are at risk of being replaced.”
This was not the first such criticism KPmG endured during the decade.
in the years before 2000, Xerox engaged in deceptive accounting practices
by booking multi-year leases of equipment as outright sales, thus overstating
revenues by $3 billion and income by $1.5 billion. When this deception came
to light, shareholders sued. KPmG, the auditor, was cited for complicity
and has been assessed over $100 million in penalties.
From 2001 to 2004, mortgage giant Fannie mae (FnmA) used “cookie
jar” and other accounting gimmicks to smooth earnings and meet bonus-
pay targets, according to the Sec. When FnmA’s officers were then fired,
their replacements sued KPmG, the auditor, as a party to the scam. As to
its incentives, KPmG made over 80 percent of its $53 million in 1998-2003
fees from FnmA for non-auditing services.

109
in 2005 KPmG admitted to promoting tax fraud and agreed to pay pen-
alties of $456 million. its aggressive “loss-generating” schemes for high-
income u.S. taxpayers had spawned $12 billion in bogus losses between
1996 and 2003, costing the u.S. Treasury an estimated $2.5 billion. The
fraudulent tax-shelter gambits included dummy investments and artificial
losses on currency swaps to the cayman islands.
enron had Arthur Andersen as its auditor. new century had KPmG. Did
such missteps mean that KPmG would go the way of Arthur Andersen? not
necessarily. As one research article put it at the time, KPmG may be “Too
Big to Fail,” on antitrust grounds. in other words, the government was not
likely to press for sanctions that would leave only a Big Three standing.
instead, enforcement was likely to focus on misbehaving individuals within
the partnerships, not the larger firms themselves. This option seemed feasible
in that the Big Four are more like loose agglomerations of local accounting
firms around the world than integrated companies.
Write-Downs: Global Reach
By June 2008, write-downs on subprime-related assets approached $400
billion and were expected to go much higher, as in the imF estimate of nearly
$1 trillion. By write-downs, we mean admissions by the financial institutions
themselves that assets they owned in the form of mortgage-backed securi-
ties had fallen in value. Why? The original mortgages had been written to
people who for various reasons would stop making their payments, thereby
making the downstream securities worth less—sometimes much less.
As an accounting matter, such write-downs were required under the Fair
Value rule in the Financial Accounting Standards Board’s Statement 157.
This requires firms to recognize losses or gains in the assets on their balance
sheet in a timely fashion. in a variation on the “mark-to-market” estimation
methods enron abused, companies are allowed to “guess” what possible
price assets on their balance sheets might fetch when there is not currently an
active market for the asset. controversy centers on whether this gives banks
too much leeway (making them too optimistic) or, conversely, whether the
banks are forced to take write-downs too soon, and too sharply, when they
might otherwise wait out the bad patch until asset prices rise.
in any case, at the level of individual banks, such write-downs added up
to $230 billion in the 20 financial institutions that had taken the largest hits
on their balance sheets by April 2008. Subprime pain, while largely origi-

110
nating in the u.S., had registered around the world. True, of the five firms
with the largest write-downs four were American (the fifth, spectacularly,
was Swiss, the union Bank of Switzerland). But 12 of the 20 with the larg-
est write-downs were foreign. For better or worse, financial markets had
become more globalized than ever before.
What did the write-downs mean for the profitability (and indeed, for some
firms, the viability) of the financial institutions in question?
The answer is less obvious than one might think. For simplicity, we will
consider only u.S. firms, but the same logic extends to the other dozen
as well. The lesson is that firms can take big hits on their balance sheets
while still managing to register positive earnings. examples are Wachovia,
JPmorgan chase, morgan Stanley, and Bank of America. The reason: asset
write-downs are a “charge” against earnings. if earnings are strong enough
from operations, earnings (profit) can dominate the loss from write-downs,
and the net effect can be positive.
on the other hand, for Bear Stearns, Washington mutual, merrill Lynch,
and citigroup, write-downs overpowered whatever positive earnings were
generated by ongoing operations since January 2007.
By June of 2008, for morgan Stanley and citigroup write-downs after
mid-2007 had erased 50 percent or more of all the profits earned over the
prior three-and-one-half years. indeed for merrill Lynch the write-downs
were half-again (153 percent) as large as the firm’s combined earnings for
the period from 2004 to mid-2007. (Louise Story, “nearly Half of Wall
Street Bank Profits Are Gone,” The New York Times, June 16, 2008.)
Small wonder, then, that in a story posted June 24, 2008, Bloomberg.
com predicted job losses in the financial sector would erase 175,000 highly
paid positions worldwide, or more than double the layoffs of 83,000 that
had already been announced since July 2007.
The Bond-Rating Agencies: Building a House of Cards
Then there were the regulatory failures. Financial regulation occurs not
only through the Fed and the Sec (and other government entities), but
also through private sector rule-makers such as the stock and commodity
exchanges, and the bond rating agencies.
many observers conclude that the leading bond rating agencies—
moody’s, Standard & Poor’s, and Fitch—were central players in the sub-
prime meltdown. Because the mortgage-backed securities they rated were

111
so complex, everybody else relied upon the rating agencies for risk and
pricing guidelines.
These agencies, which assign risk estimates to about 95 percent of bonds
issued worldwide, are in hot water for having assigned AAA (in effect, the
safest investment-grade) ratings to mortgage-backed securities, and then
suddenly and belatedly downgrading many of them to junk status (the
most risky).
This unseemly outcome was foreseen within the ratings agencies them-
selves, as an e-mail from December 2006 reveals. in a caustic Sec report,
an anonymous ratings employee from one of the big three is quoted as
follows: “Let’s hope we are all wealthy and retired by the time this house
of cards falters.” (michael m. Grynbaum, “Study Finds Flawed Practices
at Ratings Firms,” The new York Times, July 9, 2008, emphasis added.)
For that outcome, retirement within perhaps eight months would have been
necessary, since the subprime meltdown began in earnest in August 2007.
investors—the buyers of the securities—were left to bear much of the
burden. Beyond that, big banks fired ceos and wrote down their own hold-
ings by hundreds of billions of dollars.
Were investors at fault for not seeing the handwriting on the wall? Yes,
to the extent that they believed the rating agencies’ sunny risk evaluations.
What is still being sorted out is the way the rating agencies misled not
just investors but even the big banks themselves in this high-stakes shell
game.
While top officials at the agencies blame inadequate information and
faulty mathematical models, it is also clear that market incentives led to
over-optimistic ratings and subsequent foot-dragging in the face of new
information.
The raters are paid by the issuers of securities (the borrowers), not by
investors (the lenders). moreover, the bond rating agencies not only assigned
risk to the bundled (or “securitized”) issues of subprime mortgages—the
ones that turned sour once house prices began to fall—they were also active
(and well-paid) early-stage participants in the packaging of such issues into
more complex collateralized debt obligations.
The rating agencies added to their portfolio of services, stepping in to
show cDo originators how to attain the highest bond rating for a given level
of risk. As the rating agencies became more like investment banks, charging
additional fees for what amounted to consulting services, the ratings they

112
assigned became marketing tools.
not surprisingly, along with this new marketing role came a debasement
of the ratings. As moody’s admitted, the 2001-2006 default rates for its low-
est investment-grade cDos were at least 8 times as high as for comparably
rated corporate bonds. And that was before financial markets seized up in
the latter half of 2007.
no wonder there is now talk of more regulation of the raters, as signaled
by the beginning of the Sec’s formal oversight in September 2007. Still,
in an informal or “voluntary” set of arrangements, the Sec had long acted
as a guarantor of the cozy, monopolistic arrangements the rating agen-
cies enjoyed. in 1975 the Sec installed a certification process to anoint
quasi-official rating agencies. These were dubbed nationally Recognized
Statistical Rating organizations or nRSRos (also known by critics as “no
Room—Standing Room only”). in recent years today’s big three agen-
cies were the only such accredited raters. Their ratings became legally
required for many bond issuers. And all three were paid by the issuers of
the securities.
in the backwash of the subprime crisis, the Sec finally certified a ratings
firm that is paid by investors—not bond issuers. on December 21, 2007, the
Sec declared egan-Jones Ratings of Haverford, Pennsylvania, an nRSRo,
following petitions by egan-Jones for the better part of a decade.
one way to sum up the role the rating agencies played in the meltdown
is to note the contrast between the subprime and enron episodes. in enron,
the auditors, and especially Arthur Andersen, received enormous criticism.
But despite auditor KPmG’s missteps with new century in 2007, the audi-
tors were seldom cited as sources of the subprime meltdown. instead, many
observers singled out the bond rating agencies as central to the problem—
and perhaps also liable for investor lawsuits.
Where Were the Bank Regulators?
in testimony before congress Sec chair christopher cox contended that
the Securities and exchange commission was on top of the Bear Stearns
problem at every step of the way toward Bear’s takeover in early 2008 by
JPmorgan chase. At no point, cox said, did the investment bank’s reserves
fall below what the regulations required, meaning that there was never an
occasion for the Sec to intervene.
As to Bear’s demise, cox argued that when there is a silent run on a bank,

113
no amount of reserves will suffice. The rebuttal, of course, is that when
reserves are perceived as truly adequate there will be no run on the bank.
in the event, the Fed broke new ground and intervened to manage a bailout
for Bear Stearns. This took the form of Bear’s sale to JP morgan chase on
the weekend before St. Patrick’s Day 2008. With this move the Fed crossed
over into uncharted territory. Before this intervention, in other words, the
Fed was committed only to supporting commercial banks (not investment
banks) in their hour of need.
Why did the Fed choose to intervene to save a financial institution that
seemingly could have failed with no risk to American taxpayers? The an-
swer can be found in Fed meeting minutes released later. The Fed feared
a Bear Stearns bankruptcy would set off a “contagion,” igniting a chain of
contracts known as credit default swaps the system could not deliver on.
credit default swaps can be thought of as endlessly intertwined insurance
policies. The Fed evidently feared that one falling domino could trigger a
series of defaults on such contracts and a cascade of bank failures in the
u.S. and abroad.
What seems clear is that regulators, both public and private, failed to
monitor and control the u.S. financial system’s excesses. The subprime
mortgage debacle seemed to indicate a system-wide regulatory failure,
raising the likelihood of bank bailouts at taxpayers’ expense.
Do Regulators Contribute to Financial Crises?
What accounts for this apparent breakdown in supervision? in an article
presented at cambridge university at a conference on financial regulation,
Professor edward J. Kane of Boston college linked weak regulation in the
u.S. to financial globalization.
Kane suggests that u.S. regulators turned a blind eye to the dramatic dete-
rioration in recent lending practices because they feared foreign “regulatory
competition.” The premise is that financial institutions can to some extent
shop around for the regulatory regime that would benefit them most, in part
by setting up offshore affiliates in more permissive locations.
in this view, two reinforcing regulatory failures paved the way to the
subprime meltdown. First, regulators put too much trust in the risk evalua-
tions assigned by the bond rating agencies—moody’s, S&P, and Fitch. in
practice, such “insider ratings” proved much too sunny, partly because the
raters themselves were in on the gold rush, while it lasted.

114
Second, as already noted, the risky new securities that banks sponsored
became, in effect, invisible. once banks and affiliated SiVs securitized
subprime mortgages and bundled them into collateralized debt obligations,
the banks were allowed to park such cDos in the SiVs off the banks’
balance sheets and out of sight of the regulators. Yet the banks remained
responsible for the cDos. in short, some large banks had incurred much
more risk than met the eye.
Was all this a one-time derailment or a recurring episode in the history
of financial regulation? Kane makes a strong case for the latter view. one
of his tables, simplified here, posits five stages in a common scenario of
financial crises in which regulation, and government-subsidized lending to
favored political sectors, play a causal role.
New Rules for Banks?
one likely outcome of the subprime meltdown is an overhaul of bank
regulation. in particular, we can expect a more uniform treatment of invest-
ment banks (think Bear Stearns, before it was dissolved) and commercial
banks (think Bank of America).
Five Stages of a Regulation-Induced Banking Crisis
1) Loss exposures increase at highly leveraged banks, who then seek
safety-net subsidies tied to government-promoted forms of lending
(e.g., U.S. housing).
2) When problems upset financial markets, banks and regulators allow
losses to be hidden by resorting to accounting trickery on bank bal-
ance sheets.
3) Stress is placed on traditional safety-net support mechanisms, leading
to calls for public intervention and bailouts.
4) Public bailouts leave “zombie banks” (as in Japan) and no real solu-
tions.
5) Or the mess gets cleaned up, through bank closures and new banking
rules.
Source: Adapted from Edward J. Kane, “Regulation and Supervision: An Ethical
Perspective,” April 2008, Figure One.

115
Where should the new rule-book start? not by overturning deregulation
measures that allowed interstate branching and hence increased competi-
tion, or those that ended state usury laws capping interest rates on loans.
By general consensus, these reforms have worked fairly well.
instead, what may need a new look is the 1999 repeal of the Glass-
Steagall Act. enacted in 1933 as a reaction to shady stock manipulation in
the Roaring Twenties, Glass-Steagall mandated a separation of lending and
deal-making. The first function was to be handled by commercial banks,
the second by investment banks—and never the twain should meet. As
might be expected, by the mid-1980s, a half-century later, this separation
had begun to fray at the edges.
By 1987, in a 3-2 vote, the Federal Reserve Board gave its sanction
to ending the Glass-Steagall divide. As it happened, one of the two
dissenters was Paul Volcker, then Fed chair. in his view, Glass-Steagall
still served a useful function. (indeed, after stepping down later that
year, he would eventually be appointed to clean up the savings-and-loan
mess of the late 1980s, itself a result in part of a botched approach to
deregulation.)
in 1999, after the urge-to-merge ceos of citibank and the Travelers in-
surance company had personally lobbied President clinton, Glass-Steagall
was formally, once-and-for-all repealed. This opened the door to “full-
service” or “smorgasbord” or “one-stop” universal banks.
The rationale? in the new banking environment at the millennium, three
safeguards would supposedly protect the public from the abuses that had
led to the original act. (1) under then chief Arthur Leavitt, the Sec had
become a tiger with teeth, capable of patrolling the financial industry. (2)
investors (meaning largely institutional investors) had become highly so-
phisticated. (3) The bond rating agencies could serve the public interest by
evaluating and publicizing risks associated with corporate and (as it turned
out!) mortgage-backed securities.
in retrospect, of course, none of these three safeguards turned out to
insulate investors from the dot-com collapse of 2000—any more than they
prevented the subprime crisis. However weak the three slender reeds now
look, another problem with repeal was cited at the time by The Economist
magazine, a bastion of free-market thinking since at least 1850. As the
magazine pointed out in an unsigned opinion piece, “Killing Glass-Steagall,”
in its issue of october 30, 1999,
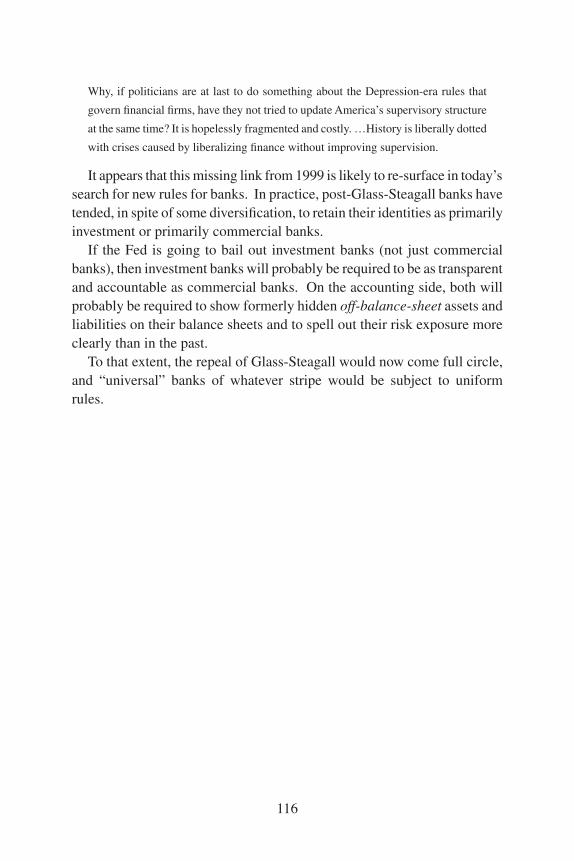
116
Why, if politicians are at last to do something about the Depression-era rules that
govern financial firms, have they not tried to update America’s supervisory structure
at the same time? it is hopelessly fragmented and costly. …History is liberally dotted
with crises caused by liberalizing finance without improving supervision.
it appears that this missing link from 1999 is likely to re-surface in today’s
search for new rules for banks. in practice, post-Glass-Steagall banks have
tended, in spite of some diversification, to retain their identities as primarily
investment or primarily commercial banks.
if the Fed is going to bail out investment banks (not just commercial
banks), then investment banks will probably be required to be as transparent
and accountable as commercial banks. on the accounting side, both will
probably be required to show formerly hidden off-balance-sheet assets and
liabilities on their balance sheets and to spell out their risk exposure more
clearly than in the past.
To that extent, the repeal of Glass-Steagall would now come full circle,
and “universal” banks of whatever stripe would be subject to uniform
rules.

117
GLOSSARY
Acid-test ratio (also called quick ratio): the ratio of cash plus temporary
investments plus receivables to total current liabilities.
Account receivable: a balance owed to a business by a customer as the
result of sales of merchandise or services on credit.
Accounting period: the period covered by a set of financial statements,
usually a quarter or a year.
Accrual: the recognition of a future cash receipt or payment. on the balance
sheet, accruals denote liabilities for deferred payment of expenses.
Additional paid-in capital (also called capital surplus and paid-in capi-
tal): the cumulative proceeds of a corporation’s offerings of stock at prices
in excess of par value.
Adjustable rate mortgage (ARM): a mortgage in which the introductory
interest rate can be changed by the lender over time as market interest rates
vary, or in which initial lower interest rates are contractually scheduled to
reset later at a higher rate. The “adjustment period” refers to the interval
between potential interest rate adjustments. one variant is a pay-option
ARm (or “option ARm”), which requires no payments at all in the early
months or years of a mortgage.
Adjusted operating cash flow: the sum of cash provided by operations,
cash payments for income taxes, and cash payments for net interest.
Allocation: the process of systematically apportioning a cash outlay or
receipt to the expenses or revenues of several accounting periods.
Allowance for doubtful accounts (also called allowance): a valuation
account that contains an estimate of the portion of accounts receivable that
is uncollectible.
Amortization: the process of allocating a revenue, expense, gain, or loss

118
over several accounting periods by recording the transaction as an asset
or liability as appropriate and then writing down the value of the asset or
liability systematically in subsequent accounting periods, recognizing the
amount of the write-down as an expense (in the case of an asset) or revenue
(in the case of a liability).
Asset: a physical, technical, or financial resource owned by an enterprise.
The FASB has defined assets as follows:
Assets are probable future economic benefits obtained or controlled by
a particular entity as a result of past transactions or events.
An asset has three essential characteristics: (a) it embodies a probable
future benefit that involves a capacity, singly or in combination with other
assets, to contribute directly or indirectly to future net cash inflows, (b) a
particular entity can obtain the benefit and control others’ access to it, and
(c) the transaction or other event giving rise to the entity’s right to or control
of the benefit has already occurred. Assets commonly have other features
that help identify them — for example, assets may be acquired at a cost and
they may be tangible, exchangeable, or legally enforceable. However, those
features are not essential characteristics of assets. Their absence, by itself,
is not sufficient to preclude an item’s qualifying as an asset. That is, assets
may be acquired without cost, they may be intangible, and although not
exchangeable they may be usable by the entity in producing or distributing
other goods or services. Similarly, although the ability of an entity to obtain
benefit from an asset and to control others’ access to it generally rests on
a foundation of legal rights, legal enforceability of a claim to the benefit
is not a prerequisite for a benefit to qualify as an asset if the entity has the
ability to obtain and control the benefit in other ways.
Asset replacement ratio: cash provided by operations less dividend pay-
ments, stated as a percentage of the average investment in assets. This ratio
is a measure of the rate at which an enterprise can replace its stock of assets
without relying on outside financing.
Audit: an examination of an enterprise’s accounting records and proce-
dures to determine whether the enterprise’s financial statements conform to
Generally Accepted Accounting Principles (GAAP). The auditors must be
independent public accountants who proceed in accordance with generally
asset

119
accepted auditing standards.
Average cost method: a method of valuing the units remaining in an
inventory at the end of an accounting period. Average cost is the total cost
of purchases during the period plus the value of the beginning inventory
divided by the sum of the number of units purchased and the number of
units in the beginning inventory.
Balance sheet (also called statement of financial condition, statement of
condition, statement of financial position, and statement of assets and li-
abilities): a financial statement that lists the values of the assets, liabilities,
and equity or net assets of an enterprise on a particular date.
Bond: an interest-bearing long-term debt security.
Bond-rating agencies: moody’s, Standard and Poor’s, and the smaller
Fitch are the three biggest rating agencies (deemed nationally Recognized
Statistical Rating organizations or nRSRos), whose job it is to assign al-
phabetical (AAA, BBB, etc.) risk ratings to municipal, corporate, or other
debt issues. in the run-up to the subprime crisis, the rating agencies were
later found to have compromised their methods and misled the investing
public, in particular by rating risky cDos as AAA or highest quality. The
big three rating agencies are paid by the debt issuer, not the investor, which
creates the appearance of a conflict of interest. A smaller nSRSo (only
recognized in December 2007) is egan-Jones, which is paid by investors,
not issuers of debt.
Book value (also called capital, equity, and net worth): the difference
between a business enterprise’s total assets and its total liabilities. Book
value is the residual interest that the owners of a business hold in the assets
of the business after its liabilities have been settled.
Capital: this word is used in many different ways. in financial statements,
it generally is synonymous with book value, equity, and net worth.
Capital lease (also called financial lease): a rental agreement that includes
most of the features of outright ownership. A capital lease is an alterna-
capital lease
120
tive to cash purchase and to borrowing as a means of financing the use of
equipment.
Capital maintenance: investments made to maintain an enterprise’s exist-
ing scale of operations. Depending on the context, capital maintenance can
apply to both the physical and the financial size of an enterprise’s capital
stock.
Capital surplus (also called additional paid-in capital and paid-in capi-
tal): the cumulative proceeds of a corporation’s offerings of stock at prices
in excess of par value.
Capitalization ratio: long-term liabilities divided by the sum of long-term
liabilities and total equity. There are a multitude of possible adjustments
to this basic formula.
Carrying value: the balance of an account adjusted for a related valuation
account.
Cash: currency and checking-account balances. in common usage, cash
includes cash equivalents, which are highly liquid short-term debt securities
such as Treasury bills and commercial paper.
Cash fixed charges coverage (see also fixed charges ratio): the ratio
of adjusted operating cash flow to fixed charges. This ratio measures the
margin by which an enterprise’s operations cover interest payments and
repayments of long-term debt.
Cash flow: a payment or receipt of cash.
Cash flow adequacy: the degree to which a business’s cash flows from
operations can fund fixed assets spending, inventory additions, and divi-
dends, in that order. if cash flows are inadequate, the business will have to
rely on outside financing to conduct some of these activities.
Cash flow adequacy ratio: the ratio of cash provided by operations plus
inventory additions to fixed assets spending plus inventory additions plus
capital maintenance

121
dividend payments.
Cash flow from financing: a transaction involving both a cash receipt or
payment and a change in equity or in long-term liabilities, including the
current portion of long-term debt. cash flows from financing exclude op-
erating cash flows, which produce changes in retained earnings, an equity
account.
Cash flow from investments: a transaction involving both a cash receipt
or payment and a change in a non-current asset.
Cash flow from operations: a cash flow involving a change in a current
operating asset or liability, a revenue, expense, gain or loss, or both.
Cash flow per share: cash provided by operations divided by the weighted
average number of common shares outstanding.
Cash operating margin: cash provided by operations as a percentage of
net sales.
Cash reinvestment ratio: depreciation and amortization plus proceeds
from sales of fixed assets as a percentage of fixed assets spending. This
ratio is a measure of the portion of fixed assets spending devoted to capital
maintenance.
Cash return on assets: the ratio of adjusted operating cash flow to the
average investment in assets.
CDO (collateralized debt obligation): complex securities that bundle or
package specific types of debt, such as mortgage or credit-card debt, and
then are sliced up into different “tranches” or shares to be sold as bonds
to investors. Such tranches carry different maturities, ratings of risk, and
yields. cDos quintupled in volume between 2003 and 2006, when they
reached $500 billion.
Clean opinion (also called unqualified opinion): a report of independent
accountants affirming that an enterprise’s financial statements are fairly
clean opinion

122
presented in all material respects, and in accordance with GAAP.
Commitment: commitments are agreements, usually formal contracts,
to transact business in the future. examples of commitments include pur-
chase orders, long-term purchase and supply contracts, lines of credit, and
employment contracts.
Common stock: the class of stock created when a business incorporates.
owners of common stock have the lowest-priority claim on a corporation’s
assets in a liquidation proceeding. A corporation may not pay dividends on
common stock until it pays dividends on preferred stock, if any.
Comprehensive income: the sum of revenues, expenses, gains, and losses
during an accounting period.
Conduits: Like SiVs, conduits borrow short-term by issuing commercial
paper and using the proceeds to issue longer-termed securities at higher
rates of interest. unlike SiVs, conduits typically are restricted in raising
funds to short-term notes.
Consolidation: the process of combining the accounting records of an
enterprise and its subsidiaries to produce a single set of financial statements.
consolidation involves adding together comparable account balances of a
parent and its subsidiaries and then netting out the effects of transactions
within the organization as a whole.
Contingent liability: losses or obligations that may result from past events
or transactions, pending some future outcome or decision. examples of
contingent liabilities include loan guarantees and pending litigation.
Contra-asset account: a valuation account used to adjust the carrying
value of an asset.
Corporation: a business that raises funds by issuing shares certifying a
proportional ownership stake in some or all of the business’s equity.
Cost of goods sold (sometimes called cost of products sold): purchasing
commitment

123
and production expenses attributable to the merchandise sold during an
accounting period. Technically, the cost of goods sold should include de-
preciation of production equipment, although in practice such depreciation
often is listed separately.
Cost principle: an accounting rule that requires enterprises to record ac-
quisitions of assets at cost.
Credit default swap (CDS): a contract to protect lenders from the possi-
bility of a default by a borrower. A cDS is one form of derivative, meaning
that its value depends on (derives from) the value of another asset. A cDS is
typically sold by a third party (not the borrower or lender, in simplest terms)
and can be understood as an insurance contract or “bet” on the likelihood
of a borrower’s default.
Cumulative effect of changes in accounting principles: when an enter-
prise changes the set of accounting principles that it uses, it must compute
what the earnings of previous periods would have been under the new set of
principles. The enterprise then must add the cumulative differences between
reported earnings and recomputed earnings to earnings for the current period.
This amount is the cumulative effect of changes in accounting principles.
Current: expected to be liquidated or settled within 1 year or the average
duration of one operating cycle, whichever is longer.
Current ratio: current assets divided by current liabilities. This ratio was
once a primary indicator of solvency.
Debt-equity ratio: total liabilities divided by total equity. There are a
multitude of possible adjustments to this basic formula.
Debt ratio: total liabilities divided by total assets. There are a multitude
of possible adjustments to this basic formula.
Debt refinancing ratio: the ratio of reduction of debt to issuance of debt.
if this ratio is below 1, an enterprise is increasing its leverage. if the ratio
is above 1, it is reducing its debt burden. The ratio measures an enterprise’s
debt refinancing ratio

124
reliance on debt as a source of financing.
Deferral: the process of recording cash flows during the current period as
assets and liabilities to be recognized as expenses and revenues in future
periods.
Deferred charges: costs that an enterprise incurs that it expects to benefit
its operations in more than one accounting period. examples include moving
costs and reorganization costs. An enterprise amortizes a deferred charge
over the expected duration of the effect of the transaction that incurred the
charge.
Deferred income taxes: a liability that accrues as a business recognizes
income or gains for financial reporting purposes but not for tax purposes.
The business recognizes the taxes due later as a current expense. Some busi-
nesses also maintain deferred income-tax accounts on the asset side of the
balance sheet. These accounts accumulate payments of tax due immediately
on income or gains that a business defers for financial reporting purposes.
Deficit: in a corporation, negative retained earnings. in partnerships and
sole proprietorships, which do not make a distinction between retained
earnings and paid-in capital, a deficit is simply negative equity. Similarly,
a deficit in a nonprofit enterprise denotes negative net assets.
Depletion: the amortization of the costs of acquiring natural resources.
Depreciation: the amortization of the costs of acquiring buildings, plant,
equipment, and other fixed assets.
Dilution: the reduction in the interests of a corporation’s existing stock-
holders due to the issuance of additional common stock at disadvantageous
terms.
Direct method: the computation of net cash flows from operations by tak-
ing the net total of a list of operating cash inflows and outflows.
Discontinued operations: divisions, subsidiaries, or entire business lines
deferral

125
that an enterprise has sold or liquidated or plans to sell or liquidate.
Discounting: (1) the sale of receivables to third parties before maturity, usu-
ally for less than face value; (2) reducing the value of a price or payment.
Dividend yield: the ratio of a corporation’s dividend per share to its market
price per share.
Earnings: at its broadest, the sum of revenues, expenses, gains, and losses
for an accounting period. There are many different ways to measure earn-
ings, depending on which items are included.
Earnings from operations (also called income from operations and oper-
ating earnings): revenues from an enterprise’s principal activities (oper-
ating revenues) net of expenses attributable to those activities (operating
expenses). This measure usually excludes the portion of the provision for
income taxes attributable to the enterprise’s principal activities.
Earnings multiple (also called price-earnings ratio, P-E ratio, price-
earnings multiple, multiple, and times earnings): market price divided
by earnings per common share before adjustment for extraordinary items.
estimated future per-share earnings often are used in this ratio.
Earnings per share (EPS): more accurately called earnings per common
share, this is earnings less preferred dividend requirements all divided by
the weighted average number of common shares outstanding during the ac-
counting period. When a corporation’s capital structure is such that current
common shareholders risk more than a 3 percent dilution of their interests,
the corporation must present primary and fully diluted ePS in its audited
financial statements. These measures account for the potential dilution.
Fully diluted ePS is the more conservative measure.
Economic entity: an organization that controls resources or incurs obliga-
tions, or both. economic entities include for-profit enterprises (businesses),
nonprofit enterprises, governments, and households.
Efficiency: the degree to which a business can minimize the cost of exist-
efficiency

126
ing operations by maximizing the use of resources.
Enterprise: a business or a nonprofit organization.
Equity (also called book value, capital, and net worth): the difference
between a business enterprise’s total assets and its total liabilities. equity
is the residual interest that the owners of a business hold in the assets of
the business after its liabilities have been settled.
Expense: strictly speaking, a cash outlay attributable to an enterprise’s
principal activities. The cash outlay need not occur in the same accounting
period in which the expense is recognized. in common usage, many losses
are labeled expenses and some expenses are labeled losses.
Extraordinary item: a gain or loss that is material, unusual, and not
expected to recur in the foreseeable future. extraordinary items often are
disaster-related.
Extras: noncash distributions to a corporation’s shareholders, including
spin-offs, warrants, rights, and stock dividends.
Financial Accounting Standards Board (FASB): an independent rule-
making organization for the accounting profession.
Financial lease (also called capital lease): a rental agreement that includes
most of the features of outright ownership. A financial lease is an alterna-
tive to cash purchase and to borrowing as a means of financing the use of
equipment.
Financial leverage index: the ratio of return on equity to return on as-
sets. When it exceeds 1, this ratio indicates a business’s effective use of
leverage.
Financial statement: a summary report on the financial operating results
of an enterprise (the changes in its accounts during a given period) or on its
financial position (the end-of-period balances of its accounts).
enterprise

127
First-in, first-out (FIFO) method: a method of valuing the units remaining
in an inventory at the end of an accounting period. The unit prices of the
most recent purchases are applied to units remaining in inventory.
Fixed charges ratio (see also cash fixed charges coverage): the ratio of
pretax operating earnings to the sum of net interest expense and principal
repayment requirements. This ratio is a conservative measure of long-term
solvency.
Fixed assets: properties, plant, equipment, and natural resources.
Flexibility: the degree to which a business can minimize the cost of ex-
panding its operations by keeping resources in reserve.
Foreign currency translation adjustment: the accumulation of dis-
crepancies arising from the consolidation of the financial statements of
foreign subsidiaries. The foreign currency translation adjustment appears
in the equity or net assets section of the parent enterprise’s balance sheet.
The discrepancies arise because equity accounts are translated at different
exchange rates than those used for asset and liability accounts.
Free cash flow: this phrase is used to describe many different quantities.
in this book, it is the margin by which the sum of inventory additions and
cash provided by operations exceeds fixed assets spending plus inventory
additions plus dividends. The notion behind any formula for free cash flow
is to determine the amount of cash that a business has at its discretion after
covering certain important nonoperating items, such as fixed assets spend-
ing. Two important uses for this residual cash are repayment of debt and
investments in affiliates.
Fund: a subset of accounts in the books of a nonprofit enterprise. A fund
consists of assets and liabilities used for a specific purpose (e.g., current
op er ations, buildings, equipment, endowment, etc.) and the resulting net
assets.
Fund balances: a synonym for the net assets of a nonprofit enterprise.
fund balances

128
Funds statement (also called statement of cash flows, statement of changes
in financial position, and statement of sources and applications of funds, or
source & app): a financial statement that reconciles an enterprise’s begin-
ning and ending cash balances for a given accounting period by listing the
various sources and uses of cash.
Gain: a cash receipt not attributable to an enterprise’s principal activities
and not a donation to or investment in the enterprise. The cash receipt need
not occur in the same period in which the gain is recognized. in common
usage, some gains are labeled revenues.
Generally Accepted Accounting Principles (GAAP): the set of rules that
govern accounting practices in the united States.
Going-concern assumption: an accounting principle that requires ac-
countants to value transactions on the assumption that an enterprise will
continue to operate, unless there is specific evidence to the contrary. This
assumption is a major justification for recording asset values at cost.
Goodwill: the excess of the purchase price of an acquisition over the fair
market value of its net identifiable assets. Goodwill represents payment in
recognition of the acquisition’s above-average earnings potential.
Gross profit margin: gross profit on sales as a percentage of net sales.
Gross profit on sales: net sales less the cost of goods sold.
Horizontal analysis: the intertemporal comparison of the line items in
an enterprise’s financial statements and of key ratios computed from those
statements.
Hurdle rate of return: the rate of return necessary to make an investment
worthwhile. This rate usually equals the cost of financing the investment.
Identifiable assets: assets other than goodwill.
Income from operations (also called earnings from operations and oper-
funds statement

129
ating earnings): revenues from an enterprise’s principal activities (oper-
ating revenues) net of expenses attributable to those activities (operating
expenses). This measure usually excludes the portion of the provision for
income taxes attributable to the enterprise’s principal activities.
Income statement (also called P&L, results of operations, statement of
earnings, statement of income, statement of operations, and statement of
profit and loss): a financial statement that lists an enterprise’s revenues,
expenses, gains, and losses for an accounting period and the total of those
items. The total for a business enterprise is called earnings or net income,
and the total for a nonprofit organization is called the change in net assets
or the change in fund balances.
Indirect method: the computation of net cash flows from operations by
adding noncash expenses and increases in current liabilities to net income,
and subtracting noncash revenues and increases in current assets.
Interest coverage ratio (also called times interest earned): the ratio of
pretax operating earnings to net interest expense. This ratio measures a
business’s long-term solvency.
Investment in assets: total assets plus accumulated depreciation less cur-
rent operating liabilities (current liabilities except dividends payable, notes
payable, and the current portion of long-term debt).
Last-in, first-out (LIFO) method: a method of valuing the units remaining
in an inventory at the end of an accounting period. The unit prices of the
beginning inventory and the earliest purchases in the period are applied to
units remaining in inventory.
Leverage: long-term borrowing. A lever is a device that allows the operator
to move disproportionately large objects. Leverage allows equity owners to
control a disproportionately large amount of assets.
Liability: a nonownership claim on a portion of the assets of an enterprise.
The FASB has defined liabilities as follows:
Liabilities are probable future sacrifices of economic benefits arising from
liability

130
present obligations of a particular entity to transfer assets or provide services
to other entities in the future as a result of past transactions or events.
A liability has three essential characteristics: (a) it embodies a present
duty or responsibility to one or more other entities that entails settlement by
probable future transfer or use of assets at a specified or determinable date,
on occurrence of a specified event, or on demand, (b) the duty or responsibil-
ity obligates a particular entity, leaving it little or no discretion to avoid the
future sacrifice, and (c) the transaction or other event obligating the entity
has already happened. Liabilities commonly have other features that help
identify them — for example, most liabilities require the obligated entity
to pay cash to one or more identified other entities and are legally enforce-
able. However, those features are not essential characteristics of liabilities.
Their absence, by itself, is not sufficient to preclude an item’s qualifying
as a liability. That is, liabilities may not require an entity to pay cash but to
convey other assets, to provide or stand ready to provide services, or to use
assets. And the identity of the recipient need not be known to the obligated
entity before the time of settlement. Similarly, although most liabilities rest
generally on a foundation of legal rights and duties, existence of a legally
enforceable claim is not a prerequisite for an obligation to qualify as a li-
ability if for other reasons the entity has the duty or responsibility to pay
cash, to transfer other assets, or to provide services to another entity.*
Liquidate: to convert to cash.
Liquidity: the ease with which an asset can be converted to cash. By defi-
nition, cash is perfectly liquid. The amount of time that the conversion to
cash takes is the most common measure of liquidity, although the cost of
conversion often is a consideration.
Liquidity put: An agreement between, for example, a bank and its affiliated
structured investment vehicles (SiVs) or conduits. it obligates the bank to
repurchase (or “repo”) securities such as cDos in the event that the buyer
returned the cDo to the SiV for failure to yield promised yields, such as
* Financial Accounting Standards Board of the Financial Accounting Foundation, “Statement of Financial Accounting Concepts No. 6: Elements of Financial Statements,” Financial Accounting Series 17 (December 1985), p. 13.
liquidate

131
when mortgages become delinquent and mortgage-based securities then fail
to deliver promised yields. During the subprime crisis of 2007 and 2008, it
was sometimes said that big banks moved risk out the front door (by park-
ing securities off the balance sheet with affiliated SiVs), only to have the
risk eventually show up at the back door, when the SiVs needed the banks
to honor the repurchase agreements.
Long-term: noncurrent, i.e., not expected to be liquidated or settled within
1 year or one operating cycle, whichever is longer. This term is applied to
liabilities much more often than to assets.
Loss: a cash payment not attributable to an enterprise’s principal activities
and not a payment to owners. The cash payment need not occur in the same
period in which the loss is recognized. in common usage, many losses are
labeled expenses and some expenses are labeled losses.
Lower of cost or market rule: an accounting rule that requires enterprises
to carry assets at current market values when their market values fall below
original cost.
Matching principle: a generally accepted accounting principle that re-
quires enterprises to match the revenues generated during an accounting
period with the expenses incurred to generate those revenues by recognizing
expenses accordingly.
Material uncertainty: an unresolved matter that, when resolved, has
some probability of making a significant impact on an enterprise’s financial
statements.
Minority interest: the share of the net assets of a majority-owned sub-
sidiary that the parent enterprise does not own. minority interest appears
as a liability and as a deduction from earnings in the accounts of a parent
enterprise.
Multiple (also called price-earnings ratio, P-E ratio, price-earnings
multiple, earnings multiple, and times earnings): market price divided
by earnings per common share before adjustment for extraordinary items.
multiple

132
estimated future per-share earnings often are used in this ratio.
Multiple-step income statement: an income statement that includes a
computation of gross profit (step 1) followed by a computation of earnings
(step 2).
Net assets: the difference between a nonprofit enterprise’s total assets
and its total liabilities. net assets are the residual assets of a nonprofit that
remain after its liabilities have been settled.
Net earnings (also called net income): revenues and gains for an account-
ing period net of expenses and losses.
Net identifiable assets: total assets less the sum of total liabilities and
goodwill.
Net income: (also called net earnings): revenues and gains for an account-
ing period net of expenses and losses.
Net loss: negative net earnings.
Net realizable value: the market value of an asset less anticipated selling
expenses.
Net sales: total sales revenues less allowances for discounts and returned
merchandise.
Net worth: the difference between an enterprise’s total assets and its total
liabilities. in a business context, net worth is synonymous with book value,
capital, and equity. in a nonprofit context, net worth is synonymous with
net assets.
Noncurrent: not expected to be liquidated or settled within 1 year or one
operating cycle, whichever is longer.
Note: a written promise to pay a debt. notes often bear interest.
multiple-step income statement

133
Off-balance-sheet financing: the use of sources of nonequity financing
that do not appear as liabilities in an enterprise’s accounts.
Operating cycle: in a manufacturing or merchandising company, the pe-
riod comprising the production or purchase of goods, the sale of goods on
account, and the conversion of accounts receivable to cash.
Operating earnings (also called earnings from operations and income
from operations): revenues from an enterprise’s principal activities (oper-
ating revenues) net of expenses attributable to those activities (operating
expenses). This measure usually excludes the portion of the provision for
income taxes attributable to the enterprise’s principal activities.
Operating lease: a rental agreement that includes few of the features of
outright ownership.
Operating profit margin (also called operating margin): pretax earnings
from operations as a percentage of net sales.
Operating working capital: current operating assets (current assets except
loans receivable from officers) less current operating liabilities (current li-
abilities except dividends payable, notes payable, and the current portion
of long-term debt).
Originate-to-distribute mortgage model: in contrast to the traditional
model in which a savings or commercial bank evaluates the credit-worthiness
of the prospective homebuyer and then holds the mortgage until its matu-
rity, in the originate-to-distribute model, the mortgage originator writes
up the mortgage contract, then, after taking up-front origination fees, sells
(distributes) the mortgage to a third party, typically a processing service,
who will then receive the actual mortgage payments. As a result of this
sequence, mortgage originators are less likely to concern themselves with
whether the borrower will be able to make the mortgage payments. This
was the model used in making a sizable share of the subprime mortgages
from 2004 on.
Other assets: a balance-sheet item that usually includes intangible assets
other assets

134
such as copyrights, patents, trademarks and other intellectual property
rights. other assets sometimes includes deferred charges if they are not
listed separately.
Overtrading: excessive turnover of an asset, which can restrict sales un-
necessarily.
P&L (also called income statement, results of operations, statement of
earnings, statement of income, statement of operations, and statement of
profit and loss): a financial statement that lists an enterprise’s revenues,
expenses, gains, and losses for an accounting period and the total of those
items. The total for a business enterprise is called earnings or net income,
and the total for a nonprofit organization is called the change in net assets
or the change in fund balances.
Paid-in capital (also called capital surplus and additional paid-in capi-
tal): the cumulative proceeds of a corporation’s offerings of stock at prices
in excess of par value.
Parent enterprise: an enterprise that owns the majority of the equity in
a business.
Partnership: a form of business organization in which the ownership of
the equity is allocated by an agreement among the principals in the busi-
ness, who are called partners.
Par value (also called stated value): the legal minimum book value of a
class of a corporation’s stock. A corporation’s directors cannot declare a
dividend that would reduce the total book value of equity below the total
par value of the corporation’s stock. Some states do not require a corpora-
tion to establish a par value for its stock.
Payable: a liability for the amount of a credit account, a note, or an ac-
crued expense.
Pay-option adjustable rate mortgage (option ARM): see Adjustable
rate mortgage.
overtrading
135
Preferred stock: classes of stock that take priority over common stock
in liquidation proceedings. Preferred stock also may be preferred as to
dividends, if a corporation cannot pay a dividend on common stock when
in arrears on its preferred dividends.
Present value: the sum of a series of future cash payments, e.g., dividends,
interest, or principal, adjusted for the time value of money. The time-value
adjustment involves discounting future payments by the amount of interest
foregone by not receiving them immediately.
Pretax earnings: earnings from operations (before income taxes) less net
interest expense and certain other nonoperating items.
Price-earnings ratio (also called P-E ratio, price-earnings multiple, earn-
ings multiple, multiple, and times earnings): market price divided by earn-
ings per common share before adjustment for extraordinary items. estimated
future per-share earnings often are used in this ratio.
Profitability: the extent to which a business’s revenues exceed its expenses.
Profitability usually is measured as a percentage of revenues, assets, or
equity.
Provision for income taxes: the income tax expense for the current ac-
counting period plus the net addition to deferred income tax liabilities.
Quality: the likelihood of an asset’s conversion to cash without any loss.
Quality of earnings: the ratio of operating cash flows to net earnings.
Quick assets: the sum of cash, temporary investments, and receivables.
Quick ratio (also called acid-test ratio): the ratio of cash plus temporary
investments plus receivables to total current liabilities.
Ratio analysis: the comparison of line items and groups of items within
a set of financial statements. Ratios are particularly useful for comparing
the financial statements of two or more enterprises.
ratio analysis

136
Realization principle: a generally accepted accounting principle that
requires enterprises to recognize revenues in the accounting period in
which they sell goods or render services, regardless of the timing of cash
receipts.
Receivable: a credit account or a note from the lender’s point of view; the
lender holds the right to receive the proceeds when the account or note is
liquidated. Receivables usually refers to the sum of accounts receivable
and notes receivable.
Recourse: a common provision of discounting transactions that requires
sellers of receivables to continue to assume the risk of delinquent and un-
collectible accounts.
Report of independent accountants (also called report of independent
auditors): the auditors’ opinion of the fairness of presentation of a set of
audited financial statements.
Results of operations (also called income statement, P&L, statement of
earnings, statement of income, statement of operations, and statement of
profit and loss): a financial statement that lists an enterprise’s revenues,
expenses, gains, and losses for an accounting period and the total of those
items. The total for a business enterprise is called earnings or net income,
and the total for a nonprofit organization is called the change in net assets
or the change in fund balances.
Retained earnings (also called reinvested earnings and profit employed in
the business): the cumulative sum of additions to a corporation’s equity,
consisting of earnings net of dividends.
Return on assets: the ratio of pretax operating earnings to average total
assets. This ratio measures the efficiency of a business’s operations and it
is a popular measure of return on investment.
Return on equity: the ratio of earnings applicable to common shareholders
to average common shareholders’ equity. This ratio is a popular measure
of return on investment.
realization principle

137
Return on investment: a business’s earnings as a percentage of the resource
base used to produce those earnings.
Revenue: strictly speaking, a cash receipt attributable to an enterprise’s
principal activities. The cash receipt need not occur in the same accounting
period in which the revenue is recognized. in common usage, many gains
are labeled revenues.
Securitization: the bundling or packaging of assets that generate cash flow,
such as individual mortgages, for resale as (in this case) mortgage-based
securities. The pooling process is intended to reduce the risk of default on
the individual loans.
Single-step income statement: an income statement that presents a com-
putation of earnings without a computation of gross profit.
SIV: structured investment vehicle; special purpose entity created by large
banks as an affiliate where liabilities can be recorded off the balance sheets
of the banks themselves, in a process that increases bank leverage beyond
what bank regulations allow. Like conduits, SiVs issue lower-interest
securities to raise money to pay for higher-yield issues of credit-card or
mortgage-based securities. unlike conduits, SiVs can use leverage and can
borrow by issuing longer-term securities.
Sole proprietorship: a form of business organization in which one prin-
cipal, the sole proprietor, owns all of the equity of a business.
Solvency: an enterprise’s ability to meet its obligations promptly.
Source & app (also called funds statement, statement of cash flows, state-
ment of changes in financial position, and statement of sources and ap-
plications of funds): a financial statement that reconciles an enterprise’s
beginning and ending cash balances for a given accounting period by listing
the various sources and uses of cash.
Specific identification method: a method of valuing the units remaining
in an inventory at the end of an accounting period. The method is to add
specific identification method

138
up the prices paid for each unit remaining in inventory.
Stated value (also called par value): the legal minimum book value of a
class of a corporation’s stock. A corporation’s directors cannot declare a
dividend that would reduce the total book value of equity below the total
stated value of the corporation’s stock. Some states do not require a corpo-
ration to establish a stated value for its stock.
Statement of assets and liabilities (also called balance sheet, statement
of financial condition, statement of condition, statement of financial posi-
tion): a financial statement that lists the values of the assets, liabilities, and
capital of an enterprise on a particular date.
Statement of cash flows (also called funds statement, statement of changes
in financial position, and statement of sources and applications of funds, or
source & app): a financial statement that reconciles an enterprise’s begin-
ning and ending cash balances for a given accounting period by listing the
various sources and uses of cash.
Statement of changes in net assets (also called statement of changes in
fund balances): a financial statement that reconciles the beginning-of-period
and end-of-period net assets of a nonprofit enterprise by accounting for net
earnings and donations for the period. in many cases, this statement also
documents transfers among an enterprise’s various funds.
Statement of condition (also called balance sheet, statement of financial
condition, statement of financial position, statement of assets and liabili-
ties): a financial statement that lists the values of the assets, liabilities, and
equity or net assets of an enterprise on a particular date.
Statement of earnings (also called income statement, P&L, results of
operations, statement of income, statement of operations, and statement of
profit and loss): a financial statement that lists an enterprise’s revenues,
expenses, gains, and losses for an accounting period and the total of those
items. The total for a business enterprise is called earnings or net income,
and the total for a nonprofit organization is called the change in net assets
or the change in fund balances.
stated value

139
Statement of financial condition (also called balance sheet, statement of
condition, statement of financial position, statement of assets and liabili-
ties): a financial statement that lists the values of the assets, liabilities, and
equity or net assets of an enterprise on a particular date.
Statement of income / operations (also called income statement, P&L,
results of operations, statement of earnings, statement of operations, and
statement of profit and loss): a financial statement that lists an enterprise’s
revenues, expenses, gains, and losses for an accounting period and the total
of those items. The total for a business enterprise is called earnings or net
income, and the total for a nonprofit organization is called the change in
net assets or the change in fund balances.
Statement of owners’ equity (also called statement of partners’ equity and
statement of shareholders’ equity): a financial statement that reconciles a
business’s beginning-of-period and end-of-period total equity by accounting
for the disposition of earnings, investments by owners, and distributions to
owners during an accounting period.
Statement of profit and loss (also called income statement, P&L, results
of operations, statement of earnings, statement of income, and statement
of operations): a financial statement that lists an enterprise’s revenues,
expenses, gains, and losses for an accounting period and the total of those
items. The total for a business enterprise is called earnings or net income,
and the total for a nonprofit organization is called the change in net assets
or the change in fund balances.
Statement of retained earnings: a financial statement that accounts for a
corporation’s allocation of net earnings between dividends and the retained
earnings account.
Statement of shareholders’/ share-owners’/ stockholders’ equity (also
called statement of owners’ equity and statement of partners’ equity): a
financial statement that reconciles a business’s beginning-of-period and
end-of-period total equity by accounting for the disposition of earnings,
investments by owners, and distributions to owners during an accounting
period.
statement of shareholders’ equity

140
Statement of sources and applications of funds (also called funds state-
ment, statement of cash flows, statement of changes in financial position,
and source & app): a financial statement that reconciles an enterprise’s
beginning and ending cash balances for a given accounting period by listing
the various sources and uses of cash.
Subprime loans: loans to borrowers with poor credit histories and there-
fore a higher probability of delinquency and default. Subprime mortgages
were thus mortgages extended to homebuyers with a higher likelihood of
defaulting on the mortgage, especially if house prices fell.
Subsidiary: a business in which one enterprise controls the election of
the board of directors, usually by owning the majority of that business’s
equity.
Surplus: a synonym for net assets, often used in the financial statements
of nonprofit enterprises.
Tax allocation: an accounting practice businesses use to reconcile tax
expenses recognized in published financial statements with actual tax pay-
ments. Tax allocation is necessary because of the many differences between
income as defined in tax statutes and income as measured by applying
generally accepted accounting principles (GAAP). Businesses reconcile
statutory taxes with GAAP taxes by using deferred income tax liabilities
and assets to allocate tax payments among the expenses of several account-
ing periods.
Times earnings (also called price-earnings ratio, P-E ratio, price-earnings
multiple, earnings multiple, and multiple): market price divided by earnings
per common share before adjustment for extraordinary items. estimated
future per-share earnings often are used in this ratio.
Times interest earned (also called interest coverage ratio): the ratio of
pretax operating earnings to net interest expense. This ratio measures a
business’s long-term solvency.
Total return: the sum of a corporation’s dividends, extras, and the change
statement of sources

141
in its share price for a given period, usually expressed as a percentage of
the beginning share price.
Treasury stock: stock that a corporation has issued and subsequently
repurchased.
Turnover: the ratio of net sales volume to the value of a balance-sheet
item.
Unqualified opinion (also called clean opinion): a report of independent
accountants affirming that an enterprise’s financial statements are fairly
presented in all material respects, and in accordance with GAAP.
Valuation account: an account used to adjust for changing circumstances
in the amount initially recorded in an asset, liability, or equity account. A
valuation account is part of the related account and is neither an asset nor
a liability in its own right. The valuation accounts that appear in financial
statements typically are contra-asset accounts, such as depreciation and
allowances.
Vertical analysis: the comparison of the size of each line item in a financial
statement to some benchmark item on that statement. Sales and total assets
are the most common benchmark items.
Working capital (see also operating working capital): current assets minus
current liabilities.
working capital


To buy publications or find out more about the American Institute for Economic Research please contact us at:
American Institute for Economic Research250 Division Street, PO Box 1000
Great Barrington, Massachusetts 01230
Phone: (413) 528-1216Fax: (413) 528-0103
Call or visit our website for pricing.

AIER Publications Currently Available
Personal Finance
The A-Z Vocabulary for Investors
Coin Buyer’s Guide
Homeowner or Tenant? How to Make a Wise Choice
How to Avoid Financial Fraud
How to Avoid Financial Tangles
How to Give Wisely: A Donor’s Guide to Charitable Giving
How to Invest Wisely
How to Make Tax-Saving Gifts
How to Read a Financial Statement
How to Use Credit Wisely
If Something Should Happen: How to Organize Your Financial and Legal Affairs
Life Insurance: From the Buyer’s Point of View
Sensible Budgeting with the Rubber Budget Account Book
What You Need to Know About Mutual Funds
What Your Car Really Costs: How to Keep a Financially Safe Driving Record
Retirement And Estate Planning
The Estate Plan Book—with 2001 Supplement
How to Build Wealth with Tax-Sheltered Investments
How to Choose Retirement Housing
How to Cover the Gaps in Medicare: Health Insurance and Long-Term Care
Options for the Retired
How to Plan for Your Retirement Years
How to Produce Savings in the Administration of an Estate
What You Need to Know about Social Security
Money And Banking
The Collapse of Deposit Insurance
Gold and Liberty
Money: Its Origins, Development, Debasement, and Prospects
The Pocket Money Book: A Monetary Chronology of the United States
Prospects for a Resumption of the Gold Standard
General Economics
The AIER Chart Book
The Constitutional Protection of Property Rights: America and Europe
Forecasting Business Trends
The Future of the Dollar
The Global Warming Debate: Science, Economics, and Policy
On the Gap between the Rich and the Poor
Property Rights: The Essential Ingredient for Liberty and Progress
Prospects for Reforming the IMF and the World Bank
Reconstruction of Economics
The United States Constitution: From Limited Government to Leviathan

American Institute for Economic Research, founded in 1933, is a non-political, nonprofit organization
engaged in scientific economic research.
AMERICAN INSTITUTEfor ECONOMIC RESEARCH250 Division Street, Post Office Box 1000Great Barrington, Massachusetts 01230