how to use borehole nuclear magnetic resonance - schlumberger
TRANSCRIPT

34 Oilfield Review
D avid A l l e nS t e ve Cra r yBob Fr e e d m a nSugar Land, Texas, USA
M a rc A n d r e a n iWerner KlopfMilan, Italy
Rob BadryC a l g a r y, Alberta, Canada
Charles FlaumBill Ke nyo nRobert KleinbergRidgefield, Connecticut, USA
Patrizio GossenbergAgip S.p.A.Milan, Italy
Ja ck Horkow i t zDale LoganMidland, Texas, USA
Julian SingerC a racas, Ve n e z u e l a
Jim W h i t eAberdeen, Scotland
For help in preparation of this article, thanks to GregGubelin, Schlumberger Wireline & Testing, Sugar Land,Texas, USA; Michael Herron, Sch l u m b e r g e r- D o l lR e s e a rch, Ridgefield, Connecticut, USA; James J.H oward, Phillips Petroleum Research, Bartlesville, Oklahoma, USA; Ja ck LaVigne, Schlumberger Wireline & Testing, Houston, Texas; Stuart Murchie and Kambiz A .S a f i nya, Schlumberger Wireline & Testing, Montrouge,France; Carlos E. Ollier, Schlumberger Wireline & Te s t-ing, Buenos Aires, Argentina; and Gordon Pirie, Consul-tation Services, Inc., Houston, Te x a s .AIT (Array Induction Imager Tool), APT (Accelerator Po r o s-ity Tool), CMR and CMR-200 (Combinable Magnetic Res-onance), ELAN (Elemental Log Analysis), ECS (ElementalCapture Spectrometer for geochemical logging), EPT(Electromagnetic Propagation Tool), Litho-Density, MAXIS(Multitask Acquisition and Imaging System), MDT (Modu-lar Formation Dynamics Tester), MicroSFL, RFT (RepeatFormation Tester Tool) and PL AT F O R M EX P R E S S are marks ofS ch l u m b e r g e r. MRIL (Magnetic Resonance Imager Log) isa mark of NUMAR Corpora t i o n .
Nuclear Magnetic Resonance (NMR) log-ging is creating excitement in the well log-ging community. Within the last ye a r, twoissues of The Log A n a l ys t were devo t e de x c l u s ively to NMR.1 The Oilfield Rev i ewpublished a comprehensive article explain-ing borehole NMR technology less thant wo years ago.2 R e c e n t l y, many specialworkshops and conference sessions onNMR have been held by professional log-ging societies. To d ay, Internet Web sitesp r ovide current information on NMR log-ging adva n c e s .3
W hy all the excitement? The reasons arec l e a r. First, the tools used to make high-quality borehole NMR measurements havei m p r oved significantly. The quality of mea-surements made in the field is approach i n gthat of laboratory instruments. Second, thesemeasurements tell petrophysicists, reservo i rengineers and geologists what they need tok n ow—the fluid type and content in thewell. The measurements also provide easy-to-use ways to identify hydrocarbons andpredict their producibility. Fi n a l l y, despite
How to Use Borehole Nuclear Magnetic Resonance
It is a rare event when a fundamentally new petrophysical logging
m e a s u rement becomes routinely available. Recent
developments in nuclear magnetic resonance
m e a s u rement technology have widened the
scope of formation fluid characterization. One
of the most significant innovations provides
new insight into re s e rvoir fluids by
p a rtitioning porosity into fractions
classed by mobility.

Summer 1997 35
the mysterious nature of the NMR tech-nique, the measurement principles are rela-t ively easy to understand.
Important advances have been made inapplying NMR measurements to detectingand differentiating all formation fluids, suchas free water and bound wa t e r, as well as dif-ferentiating gas from oil in hy d r o c a r b o n -bearing reservoirs. In this article, we reviewthe improvements in tool technology thata l l ow today ’s tools to measure differentporosity components in the formation (s e e“What is Sandstone Po ro s i ty, and How Is ItM e a s u re d ? ”, page 36). Then, we evaluate then e w, high-speed, cost-effective ways NMRcan be used with conventional logging mea-surements to determine critical formationproperties such as bound-water satura t i o nand permeability for predicting production.Fi n a l l y, we show how NMR measurements,in combination with other logging data, pro-vide a more accurate, quantitative and there-fore profitable understanding of formationsincluding shaly gas sands and those contain-ing viscous oil.
A Rapidly Developing Te c h n o l o g yThe first NMR logging measurements werebased on a concept developed by ChevronR e s e a rch. Early nuclear magnetic loggingtools used large coils, with strong currents, toproduce a static magnetic field in the forma-tion that polarized the hydrogen nuclei—protons—in water and hy d r o c a r b o n s .4 A f t e rq u i ckly sw i t ching off the static magneticfield, the polarized nuclei would precess inthe weak, but uniform, magnetic field of theearth. The precessing nuclei produced anexponentially decaying signal in the samecoils used to produce the static magneticfield. The signal was used to compute thefree-fluid index, FFI, that represents theporosity containing movable fluids.
These early tools had some technical defi-ciencies. First, the sensitive region for reso-nance signal included all of the boreholefluid. This forced the operator to use specialmagnetite-doped mud systems to eliminatethe large borehole background signal—an
expensive and time-consuming process. Inaddition, the strong polarizing currentswould saturate the resonance receiver forlong periods of time, up to 20 msec. Thisdiminished the tool sensitivity to fast-decay-ing porosity components, making earlytools sensitive only to the slow free-fluidparts of the relaxation decay signal. Thesetools also consumed huge amounts of
(continued on page 39)
1. The Log A n a l ys t 37, no. 6 (Nove m b e r- D e c e m b e r,1996); and The Log A n a l ys t 38, no. 2 (March - A p r i l ,1 9 9 7 ) .
2. Ke nyon B, Kleinberg R, Straley C, Gubelin G andMorriss C: “Nuclear Magnetic Resonance Imaging—Te chnology for the 21st Century,” Oilfield Rev i ew 7 ,no. 3 (Autumn 1995): 19-33.
3. The SPWLA provides an extensive bibliogra p hy ofNMR publications developed by Steve Prensky, U.S.Department of Interior Minerals Management Service,located at URL: http://www.spwla.org/, and informa-tion on the Schlumberger CMR tools can be found ath t t p : / / w w w. c o n n e c t . s l b . c o m .The NUMAR information Web site is located at URL:h t t p : / / w w w. n u m a r. c o m .
4. Early NMR tools did not contain permanent magnetsto polarize the spinning protons.

36 Oilfield Review
Simply put, porosity is the void space in all rocks
where fluids accumulate. In igneous rocks, this
space is quite small because the crystallization
growth process results in dominant interlocking
grain contacts. Similar arguments can be made
for metamorphic rocks. In contrast, sandstones
are formed by the deposition of discrete particles
creating abundant void space between individual
particle grains.
O b v i o u s l y, hydrocarbons are found only in
porous formations. These rocks can be formed by
the weathering and erosion of large mountains of
solid rock, with the eroded pieces deposited by
water and wind through various processes. As the
weathered particles are carried farther from the
source, a natural sorting of particle or grain size
occurs ( r i g h t ). Geology attempts to study how vari-
ations in original porosity created by different
grain packing configurations are altered by post-
depositional processes, whether they be purely
mechanical or geochemical, or some mixture of
the two.
During transportation, the smallest weathered
particles of rock, such as fine-grained sands and
silts, get carried the farthest. Other minerals, such
as mica, which is made of sheets of aluminosili-
cates, break down quickly through erosion, and
are also carried great distances. These sheet sili-
cates give rise to clay minerals, which are formed
by weathering, transportation and deposition.
Clays can also form in fluid-filled sediments
through diagenetic processes—chemical, such as
precipitation induced by solution changes; or bio-
logical, such as by animal burrows; or physically
through compaction, which leads to dewatering of
clays. The final formation porosity is determined
by the volume of space between the granular
m a t e r i a l (next page, top).
What Is Sandstone Porosity, and How Is It Measured?
■How weathering and transportation cause changes in scale of grain size. The decomposition of large rocks leadsto the development of clastic sedimentary deposits. Water and wind carry the finer grained materials the farthestfrom their source. Many materials that are resistant to water and chemical alteration become sand and silt grainseventually deposited in sediments. Other layered-lattice minerals in the original igneous rocks, such as micas andother silicates, become transformed into fine-grained clays through degradation and hydrothermal processes.

Summer 1997 37
But, all porosity is not equivalent. Clearly, what
is special about NMR is that it not only measures
the volume of the void space, assuming that it is
filled with a hydrogenated fluid, but also allows
some inferences to be made about pore size from
measurement of relaxation rates. This is the abil-
ity to apportion the porosity into different compo-
nents, such as movable fluids in large pores and
bound fluids in small pores.
In sandstone formations, the space surrounding
pores can be occupied by a variety of different min-
eral grains. In the simple case of well-sorted,
w a t e r-wet sandstones, water that is adhering to the
surface of the sand grains is tightly bound by sur-
face tension. Frequently, in these formations, the
spaces between sand grains are filled with clay
particles. Water also attaches itself to the surfaces
of clay particles, and since clays have large sur-
face-to-volume ratios, the relative volume of clay-
bound water is large. This water will always
remain in the formation, and is known as irre-
ducible water. In pure sands, this is also known as
c a p i l l a ry-bound water. All exposed mineral sur-
faces have adsorbed water, which link particle size
with volume of irreducible water.
The NMR measurements tell us two important
things. The echo signal amplitudes depend on the
volume of each fluid component. The decay rate,
or T2 for each component, reflects the rate of
relaxation, which is dominated by relaxation at the
grain surface. T2 is determined primarily by the
pore surface-to-volume ratios. Since porosities are
not equal—capillary-bound or clay-bound water
are not producible, but free water is—two equal
zones of porosity, but with entirely different pro-
ducibility potential, can be distinguished by their
T2 time distributions ( l e f t ).
Hydrogen nuclei in the thin interlayers of clay
water experience high NMR relaxation rates,
because the water protons are close to grain
surfaces and encounter the surfaces frequently.
Also, if the pore volumes are small enough that
the water is able to diffuse easily back and forth
across the water-filled pore, then the relaxation
rates will simply reflect the surface-to-volume
ratio of the pores. Thus, water in small pores
with larger surface-to-volume ratios has fast
relaxation rates and therefore short T2 porosity
components (next page, top left).
■Intergranular porosity. Thepores between these water-wet sand grains are occu-pied by fluids and fine layersof clay. The irreducible water(dark blue) is held againstthe sand grains by surf a c etension and cannot be pro-duced. Clay-bound water(shaded dark blue) is alsounproducible. Larger porescan contain free water ( l i g h tb l u e ), and in some casesthere are pockets of oil(green) isolated from thesand grains by capillaryw a t e r. The clay particles,and their associated clay-bound water layer, effec-tively reduce the diameter of the pore throats. Thisreduces the formation’s abil-ity to allow fluids to flow—p e r m e a b i l i t y.
■Good water and bad water. The amplitude of the NMR T2measurement is directly proportional to porosity, and the decayrate is related to the pore sizes and the fluid type and viscosity in the pore space. Short T2 times generally indicate small poreswith large surface-to-volume ratios and low permeability, whereaslonger T2 times indicate larger pores with higher permeability.Measurements were made in two samples with about the same T2 signal amplitudes, indicating similar porosity, but with consid-erably different relaxation times that clearly identify the samplewith the higher permeability.

38 Oilfield Review
On the other hand, in large pores with smaller
surface-to-volume ratios, it takes longer for the
hydrogen to diffuse across the pores. This will
decrease the number of encounters with the sur-
face and lower the relaxation rate—leading to a
longer T2 component in the NMR measurement.
Free water, found in large pores, is not strongly
bound to the grain surfaces by surface tension.
Longer T2 time components reflect the volume of
free fluid in the formation.
Another example of long T2 time fluid compo-
nents seen by NMR is the case of oil trapped inside
a strongly water-wet pore (above right). Here the
oil molecules cannot diffuse past the oil-water
interface to gain access to the grain surface. As a
result, the hydrogen nuclei in the oil relax at their
bulk oil rate, which is usually slow depending on
the oil viscosity. This leads to a good separation of
the oil and water signals in NMR T2 d i s t r i b u t i o n s .1
Neutron tools have traditionally been used for
porosity measurements. The scattering and slow-
ing down of fast neutrons in formations lead to the
detection of either thermal or epithermal neutrons,
depending on the tool design. Hydrogen has an
extremely large scattering cross section, and
because of its mass, it is particularly effective at
slowing down neutrons. Thus, the response of
neutron porosity tools is sensitive to the total
hydrogen concentration of the formation, which
leads to their porosity response (next page, top).
H o w e v e r, there are complications. Small differ-
ences in the other elemental neutron cross sec-
tions lead to changes in the porosity response for
different minerals, called the lithology effect.
There is also the effect of thermal absorbers,
especially in shales, which cause large systematic
increases in the porosity response of thermal neu-
tron tools. Fortunately, epithermal neutron poros-
ity tools, such as the APT Accelerator Porosity
Tool, are immune to this effect.
Finally, because the neutrons cannot discrimi-
nate between hydrogen in the fluids or hydrogen
that is an integral part of the grain structure, neu-
tron tools respond to the total hydrogen content of
the formation fluids and rocks. Even after all the
clay-bound water and surface water are removed,
clay minerals contain hydroxyls [OH]- in their
crystal structures—kaolinite and chlorite contain
[OH]8 and illite and smectite contain [OH]4—
making them read especially high to neutron
porosity tools.2
Density tools use gamma rays to determine
p o r o s i t y. Gamma ray scattering provides an accu-
rate measurement of the average formation bulk
d e n s i t y, and if the formation grain and fluid densi-
ties are assumed correctly, the total fluid-filled
porosity can be accurately determined (see “Gas-
Corrected Porosity from Density-Porosity and CMR
Measurements,” page 54). Usually, one assumes
the grain density for sandstone or limestone and
w a t e r-filled pores. Errors occur if the wrong grain
density is assumed—a lithology effect—or the
wrong fluid density is assumed, which occurs with
gas-filled pores.
Using Porosity Logs
Comparing one porosity measurement with another
leads to new information about the makeup of the
formation. Tr a d i t i o n a l l y, neutron and density-
porosity logs are combined, sometimes by simple
averaging. In many cases, the lithology effects on
the neutron porosity tend to cancel those on the
density porosity, so that the average derived poros-
ity is correct. If there are only two lithologies in a
water or oil filled formation, then porosity and the
fraction of each rock mineral can be determined
using a crossplot technique. In gas zones, neutron-
derived porosity reads low, if not zero, whereas
density-derived porosity reads slightly high. This
leads to the classic gas crossover signature—a
useful feature.
NMR T2 distributions provide for fluid discrimi-
nation. Since fluids confined to small pores near
surfaces have short T2 relaxation times and free
fluids in large pores have large T2 r e l a x a t i o n
times, partitioning the T2 distributions allows dis-
crimination between the different fluid compo-
nents (next page, bottom). Adding the amplitudes
of the observed fluid T2 components together gives
■Oil in the pore space of a water-wet rock. The lackof contact between oil and the rock grain surfaceallows the oil to take its bulk relaxation time, whichfor low-viscosity oils will generally be longer than the shortened water relaxation.■Interlayer water and hydroxyls in clay structures. Clay minerals are hydrated sili-
cates of aluminum which are fine grained, less than 0.002 mm. The layers are sheetstructures of either aluminum atoms octahedrally coordinated with oxygen atoms andhydroxyls [OH]-, or silica tetrahedral groups. These octahedral (A) and tetrahedral (B)sheets link together to form the basic lattice of clay minerals, either a two layer—oneof each sheet (AB), or a three layer (BAB) structure. In smectite clay, these latticessheets are then linked together by cations and interlayer water molecules. The hydrox-yls are seen as porosity by all neutron tools, but not NMR tools. The interlayer water,trapped between sheets of the clay lattice, is not producible.

Summer 1997 39
power to tip the polarized spinning hydro-gen nuclei and were not combinable withother logging tools.
Sparked by ideas developed at LosAlamos National Laboratories in NewMexico, USA, the application of NMR tech-nology in the oil field took a giant leap for-ward in the late 1980s with a new class ofNMR logging tools—the pulse-echo NMRlogging tools. Now, polarizing fields areproduced with high-strength permanentmagnets built into the tools (see “ Pu l s e - E c h oNMR Measure m e n t s ,” page 44) .5
Two tool styles are currently available forc o m m e rcial well logging. These tools use dif-ferent design strategies for their polarizingfields. To gain adequate signal strength, theNUMAR logging tool, the MagneticResonance Imager Log (MRIL), uses a com-bination of a bar magnet and longitudinalr e c e iver coils to produce a 2-ft [60-cm] long,thin cy l i n d e r-shaped sensitive region con-centric with and extending seve ral inch e saway from the borehole.6
The Schlumberger tool, the CMR Combin-able Magnetic Resonance tool, uses a direc-tional antenna sandw i ched between a pair ofbar magnets to focus the CMR measurementon a 6-in. [15-cm] zone inside the forma-tion—the same rock volume scanned byother essential logging measurements (nextp a g e).7 Complementary logging measure-ments, such as density and photoelectriccross section from the Litho-Density tool,dielectric properties from EPT Electro-magnetic Propagation Tool, microresistiv i t yfrom the MicroSFL and epithermal neutronporosity from the APT A c c e l e rator Po r o s i t yTool can be used with the CMR tool toenhance the interpretation and evaluation offormation properties. Also, the vertical reso-lution of the CMR measurement makes its e n s i t ive to rapid porosity variations, as seenin laminated shale and sand sequences.
a total NMR porosity which usually agrees with the
density porosity in water-filled formations. In gas
zones, like the neutron porosity, NMR depends on
the total hydrogen content, and therefore reads
l o w. This leads to an NMR gas crossover signature.
■What porosity toolsmeasure. NMRporosity tools candiscriminate betweencapillary-bound orclay-bound fluids bytheir short T2 compo-nents and free iso-lated fluids withlonger T2 compo-nents (top right). Bycontrast, neutronporosity tools aresensitive to the totalhydrogen content ofthe formation (left),and cannot distin-guish between fluidsof different mobility.
■NMR T2 time distributions provide clear picture of the fluid components. In water-filled sandstone formations, the T2 time distribution reflects the pore size distribution of the formation. Shorter T2 components are from water that is closeand bound to grain surfaces.
1. Kleinberg and Vinegar, reference 12 main text.
2. The protons, which are part of the hydroxyls found in theclays, are so tightly bound in the crystal structure that theNMR decay is much too fast to be seen by any boreholeNMR logging tool.
5. M u r p hy DP: “NMR Logging and Core A n a l y s i sS i m p l i f i e d ,” World Oil 216, no. 4 (April 1995): 6 5 - 7 0 .
6. Miller MN, Paltiel Z, Gillen ME, Granot J and BoutonJC: “Spin Echo Magnetic Resonance Logging: Po r o s i t yand Free Fluid Index Determination,” paper SPE20561, presented at the 65th SPE Annual Te ch n i c a lConference and Exhibition, New Orleans, Louisiana,USA, September 23-26, 1990.
7. Morriss CE, Macinnis J, Freedman R, Smaardyk J, S t raley C, Ke nyon WE, Vinegar HJ and Tutunjian PN:“ Field Test of an Experimental Pulsed Nuclear Mag-netism To o l ,” Transactions of the SPWLA 34th A n n u a lLogging Symposium, Calgary, Alberta, Canada, Ju n e13-16, 1993, paper GGG.

40 Oilfield Review
NMR in the Bore h o l eBorehole NMR measurements can prov i d edifferent types of formation porosity-relatedinformation. First, they tell how much fluidis in the formation. Second, they also supplydetails about formation pore size and struc-ture that are usually not available from con-ventional porosity logging tools. This leadsto a better description of fluid mobility—whether the fluid is bound by the formationr o ck or free to flow. Fi n a l l y, in some cases,NMR can be used to determine the type off l u i d — wa t e r, gas or oil.
The NMR measurement is a dynamic one,meaning that it depends on how it is made.Changing the wait time affects the totalpolarization. Changing the echo spacingaffects the ability to see diffusion effects inthe fluids. Tra n s verse relaxation decay times,T2, depend on grain surface structure, ther e l a x ivity of the surfaces and the ability ofthe Brownian motion of the water to samplethe surfaces. In some cases, when the porefluids are isolated from surface contact, theo b s e r ved relaxation rate approaches the bulkfluid relaxation ra t e s .
The first pulsed-echo NMR logging tools,introduced in the early 90s, were unable todetect the fast components of the resonanced e c ay. The shortest T2 was limited to the 3-
to 5-msec range, wh i ch allowed measure-ment of capillary-bound water and free flu-ids, together known as e f f e c t i ve p o r o s i t y.8H ow e ve r, clay-bound wa t e r, being moretightly bound, is believed to decay at am u ch faster rate than was measurable withthese tools. Within the last ye a r, improve-ments in these tools enable a factor- o f - t e nfaster decay rate measurement. Now mea-suring T2 d e c ay components in the 0.1 to0.5 msec range is possible. These improve-ments include electronic upgrades, moreefficient data acquisition and new signal-processing techniques that take adva n t a g eof the early-time information.
For example, NUMAR added a multi-plexed timing scheme to their standard toolsto boost the signal-to-noise ratio for fast-d e c ay modes. This was ach i e ved by com-bining a standard pulse-echo tra i n — c o n s i s t-ing of 400 echoes with an echo spacing of1.2 msec—and a rapid burst of short ech ot rainlets of 8 to 16 echoes with half the stan-dard echo spacing.9 This pulse sequence isrepeated 50 times to reduce the noise by afactor of seven. Now, this tool is sensitive tot ra n s verse decay components with T2 a sshort as 0.5 msec.
The Schlumberger CMR tool has also hadh a r dware improvements and signal-process-ing upgra d e s .1 0 The signal-to-noise per ech ohas been improved by 50% in the new reso-nance receive r. Also, the echo acquisitionrate has been increased 40%, from 0.32-msec spacing to 0.2 msec, increasingthe CMR ability to see fast decay times ( n ex tp a g e ) . In addition, the signal-processing soft-ware has been optimized for maximum sen-s i t ivity to the short T2 d e c ays. As a result, anew pulsed-echo tool, called the CMR-200tool, can measure formation T2 c o m p o n e n t sas short as 0.3 msec in continuous loggingmodes and as short as 0.1 msec in stationarylogging modes.
Total Poro s i t yNMR measurements now have the ability tosee more of the fluids in the formation,including the sub-3-msec microporosityassociated with silts and clays, and intra-particle porosity found in some carbonates.Therefore, the measurement provided byNMR tools is approaching the goal of alithology-independent t o tal poro s i ty m e a-surement for evaluating complex reservoirs.
Total porosity using NMR T2 d e c ay ampli-tudes depends on the hydrogen content ofthe formation, so in gas zones, NMR poros-
■CMR tool. The CMR tool ( l e f t ) is 14 ft [4.3 m] long and is combinable with many otherS c h l u m b e rger logging tools. The sensor is skid-mounted to cut through mud-cake andhave good contact with the formation. Contact is enhanced by an eccentralizing arm orby power calipers of other logging tools. Two strong internal permanent magnets pro v i d ea static polarizing magnetic field ( r i g h t ). The tool is designed to be sensitive to a volumeof about 0.5 in. to 1.25 in. [1.3 cm to 3.2 cm] into the formation and stretches the length ofthe antenna—about 6 in. [15 cm], providing the tool with excellent vertical re s o l u t i o n .The area in front of the antenna does not contribute to the signal, which allows the tool tooperate in holes with a limited amount of rugosity, similar to density tools. The antennaacts as both transmitter and receiver—transmitting the CPMG magnetic pulse sequenceand receiving the pulse echoes from the form a t i o n .
Summer 1997 41
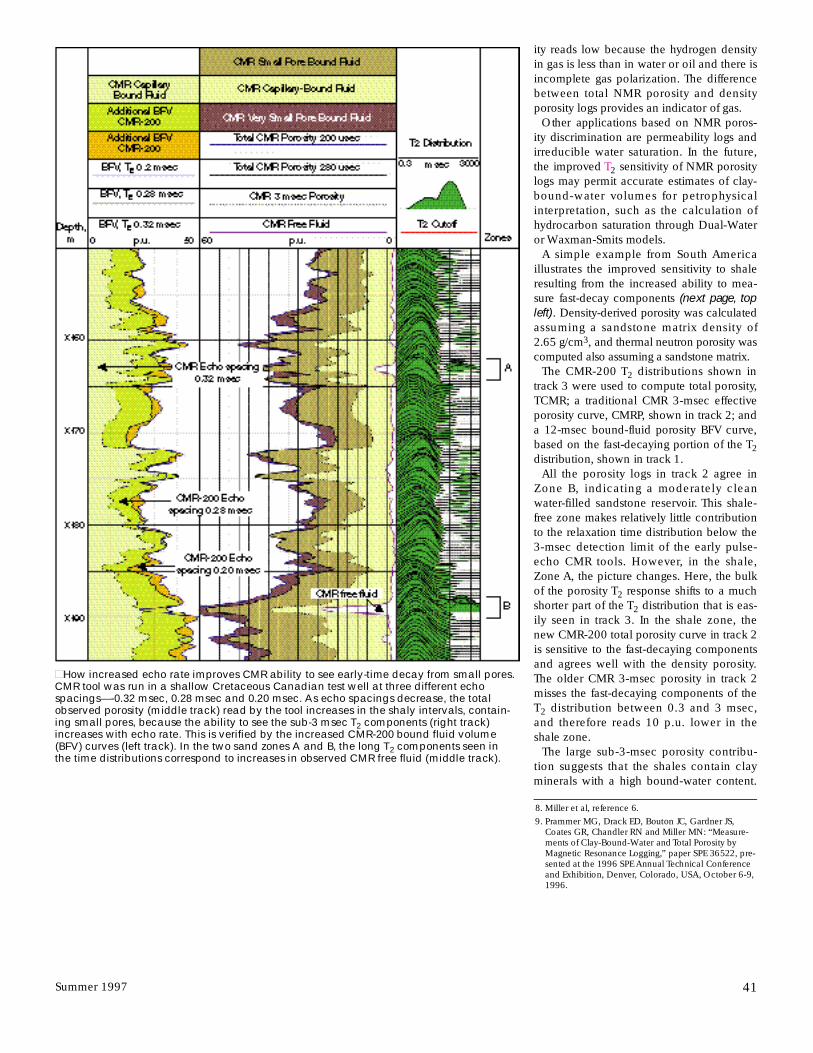
ity reads low because the hydrogen densityin gas is less than in water or oil and there isincomplete gas polarization. The differencebetween total NMR porosity and densityporosity logs provides an indicator of gas.
Other applications based on NMR poros-ity discrimination are permeability logs andirreducible water saturation. In the future,the improved T2 s e n s i t ivity of NMR porositylogs may permit accurate estimates of clay -b o u n d - water volumes for petrophy s i c a linterpretation, such as the calculation ofhydrocarbon saturation through Dual-Wa t e ror Waxman-Smits models.
A simple example from South A m e r i c ai l l u s t rates the improved sensitivity to shaleresulting from the increased ability to mea-sure fast-decay components ( n ext page, t o pl e f t ). Density-derived porosity was calculatedassuming a sandstone matrix density of 2.65 g/cm3, and thermal neutron porosity wa scomputed also assuming a sandstone matrix.
The CMR-200 T2 distributions shown int ra ck 3 were used to compute total porosity,TCMR; a traditional CMR 3-msec effectiveporosity curve, CMRP, shown in tra ck 2; anda 12-msec bound-fluid porosity BFV curve ,based on the fast-decaying portion of the T2distribution, shown in tra ck 1.
All the porosity logs in tra ck 2 agree inZone B, indicating a moderately cleanwa t e r-filled sandstone reservo i r. This shale-free zone makes relatively little contributionto the relaxation time distribution below the3-msec detection limit of the early pulse-e cho CMR tools. How e ve r, in the shale,Zone A, the picture changes. Here, the bulkof the porosity T2 response shifts to a muchshorter part of the T2 distribution that is eas-ily seen in tra ck 3. In the shale zone, thenew CMR-200 total porosity curve in tra ck 2is sensitive to the fast-decaying componentsand agrees well with the density porosity.The older CMR 3-msec porosity in tra ck 2misses the fast-decaying components of theT2 distribution between 0.3 and 3 msec,and therefore reads 10 p.u. lower in theshale zone.
The large sub-3-msec porosity contribu-tion suggests that the shales contain claym i n e rals with a high bound-water content.
■How increased echo rate improves CMR ability to see early-time decay from small pore s .CMR tool was run in a shallow Cretaceous Canadian test well at three diff e rent echo spacings—-0.32 msec, 0.28 msec and 0.20 msec. As echo spacings decrease, the totalobserved porosity (middle track) read by the tool increases in the shaly intervals, contain-ing small pores, because the ability to see the sub-3 msec T2 components (right track)i n c reases with echo rate. This is verified by the increased CMR-200 bound fluid volume(BFV) curves (left track). In the two sand zones A and B, the long T2 components seen inthe time distributions correspond to increases in observed CMR free fluid (middle track).
8. Miller et al, reference 6.9. P rammer MG, Dra ck ED, Bouton JC, Gardner JS,
Coates GR, Chandler RN and Miller MN: “Measure-ments of Clay - B o u n d - Water and Total Porosity byMagnetic Resonance Logging,” paper SPE 36522, pre-sented at the 1996 SPE Annual Te chnical Conferenceand Exhibition, Denve r, Colorado, USA, October 6-9,1 9 9 6 .

42 Oilfield Review
The thermal neutron log is reading too highin the shale zone because of the large ther-mal absorption cross section of the shale,probably caused by some trace absorptionelements such as boron or gadolinium asso-ciated with the clay s .
In tra ck 1, there is a strong correlationbetween the gamma ray log and the bound-fluid porosity curve, BFV, obtained usinge verything below a 12-msec T2 cutoff. Th i ssuggests another interesting application fortotal porosity measurements—the porosityassociated with short T2 components canp r ovide a good shale indicator that is inde-pendent of natural ra d i o a c t ivity in the for-mation. This is significant because there arem a ny important logging environments withclean sands that contain ra d i o a c t ive miner-als. In these environments, gamma ray logs
are not useful for differentiating sands andshales. At best, gamma ray logs are onlyq u a l i t a t ive shale indicators, and are usuallyused to estimate clay corrections used forcomputing effective porosity.
Finding Gas in Shaly Sands—A south Te x a swell illustrates the value of total CMR poros-ity logging in detecting gas in shaly sand for-mations. The interval consists of a shaleoverlying a shaly gas sand ( a b ove right) .Looking for gas with the traditional thermalneutron-density crossover is unreliable orimpossible in shaly formations, becausethermal neutron absorbers in shales forc ethe thermal neutron porosity tools to readtoo high—as can be seen in this example.This effect on the neutron log suppresses thegas signature, wh i ch means the neutron-porosity curve never consistently dropsb e l ow the density-porosity curve when thelogging tools pass a gas zone.
Fo r t u n a t e l y, total porosity NMR loggingworks well in these environments, simplify-ing the interpretation. Starting from the bot-tom of the interval, in the lower sand, ZoneC, the total CMR porosity TCMR agrees withthe density porosity. How e ve r, in Zone B atthe top of this shaly sand, the CMR-derive dporosity drops, crossing below the density-d e r ived porosity. This is the NMR-densitylogging crossover—a gas signature. Th eNMR porosity signal drops in the gas zonedue to the reduced concentration of hy d r o-gen in the gas and long gas polarizationtime—leading to incomplete polarization ofthe gas. The logged density-derived porosity,wh i ch assumed wa t e r-filled pores, readsslightly high in the gas zone—accentuatingthe crossover effect. Since gas affects bothCMR porosity and density porosity, theCMR-based gas signature works effective l yin shaly sands.
■Total porosity logging with the PL AT F O R M EX P R E S S tool diff e re n t i-ates sands and shales. The porosity logs are shown in track 2 ofthe wellsite display. Both neutron and density porosity werederived assuming a sandstone matrix. Total CMR poro s i t y(TCMR) correctly finds the tightly bound shale porosity seen inthe short T2 distributions shown in track 3. The neutron poro s i t ylog reads too high in the shale interval, Zone A, due to neutro nabsorbers in the shale. The gamma ray and bound-fluid poro s i t y ,BFV (all porosity with T2 below 12 msec) in track 1 show that theCMR measurement provides an alternative method for identify-ing shale zones.
■Using total CMR porosity and density to find gas. In track 2 thedeficit between total porosity ( red curve) and density poro s i t y(blue curve) in a shaly sand can be used to identify a gas zone.The traditional neutron-density crossover is suppressed by theshaliness, which opposes the gas effect in the therm a l - n e u t ro nlog ( g reen curve). The T2 time distributions show large contribu-tions from short relaxation times below 3-msec coming from theclay-bound water in the shales. The gas corrected poro s i t y ,(dashed black curve) is always less than the density poro s i t yand greater than the total CMR poro s i t y .

Summer 1997 43
Based on the petrophysical responses forCMR total porosity and density porosity, anew gas-corrected porosity φga s - c o r r, show nin tra ck 2, and the volume of gas Vga s,s h own in tra ck 1, are derived (see “ G a s - Co r -rected Po ro s i ty from Density- Po ro s i ty andCMR Measure m e n t s ,” page 54) .1 1 The newgas-corrected porosity, computed from theTCMR and density-porosity shown in tra ck2, gives a more accurate estimate of true
porosities in the gas zones. NMR wo r k shere, where the traditional neutron toold o e s n ’t, because NMR porosity respondsonly to changes in hydrogen concentra t i o n ,and not to neutron absorption in the shales.In the shale, Zone A, the total CMR and gas-corrected porosities again agree with thedensity-porosity curve, as expected.
Fi n a l l y, in the lowest interval, Zone C,b e l ow the gas sand, there is a transition intop o o r e r-quality sand with lower permeability
as evidenced by the short relaxation timesseen in the T2 distributions. This zone show slittle indication of gas because the totalCMR porosity, gas-corrected porosity anddensity-porosity logs are in agreement.
Another striking example, from a BritishGas well in Trinidad, shows how the CMR-d e r ived total porosity was used with density-d e r ived porosity to detect gas in shaly sands( l e f t ) . The interval contains shaly wa t e rzones at the bottom, Zone C, followed by athin, 6-ft [2-m] clean sand, Zone B, toppedby a section of shale, Zone A. There is a gas-water contact at XX184 ft in the lower partof the clean sand in Zone B. The CMR totalporosity curve, shown in tra ck 2, ove r l i e sthe density-porosity curve throughout thewa t e r-filled shaly sand intervals. In the cleansand, wh i ch contains gas, there is a larges e p a ration between the CMR total porosityand the density-porosity curves. Again, thereduction in the CMR porosity response isdue to the reduced concentration of hy d r o-gen in the gas. The large crossover of theset wo logs provides a clear flag for finding gasin the reservo i r.
The NMR logs shown in this example wereobtained with the early pulse-echo CMRtool. Comparing the early tool’s 3-msece f f e c t ive porosity log with the new totalporosity log demonstrates the improve m e n tp r ovided by the new CMR total porosityalgorithms. The total porosity and effectiveporosity curves, shown in tra ck 2, are similarin the clean sand, but the 3-msec porositylog misses the fast-decaying porosity in theshale zones. Similarly, the bound-fluidporosity log based on the early tool’s 3-mseclimited T2 distributions, shown in tra ck 3, ism u ch noisier and misses most of the bound-fluid porosity in the shale zones. The newCMR T2 distributions in tra ck 4 show largecontributions from the fast-decaying shalewith bound-fluid components between 0.3and 3 msec. Like the previous example, thenew total porosity-derived bound-fluid logn ow correlates well with the gamma ray, andcan be used as a improved shale indicator.As commercial CMR tools are upgraded toCMR-200 hardware, logging data and inter-pretation results, like those in this example,will improve .
■Detecting gas using total porosity logging with the PL AT F O R M EX P R E S S tool. A dramatici m p rovement in agreement between the CMR-200 total porosity (solid black), compare dto the 3-msec CMR porosity (dotted black), and density porosity ( re d ), shown in track 2, isobtained by including the fast-decaying shale-bound porosity components from the newCMR-200 T2 distribution shown in track 4. This enhances the ability to use the CMR totalp o rosity and density-porosity crossover as a flag to detect gas—pink-shaded area in track2. Improvements in the signal processing are obvious when the CMR-200 total bound-fluid log (solid black) is compared to the old 3 msec CMR bound-fluid log (dotted black)shown in track 1.
(continued on page 46)
10. Freedman R, Boyd A, Gubelin G, Morriss CE andFlaum C: “Measurement of Total NMR Porosity A d d sNew Value to NMR Logging,” Transactions of theSPWLA 38th Annual Logging Symposium, Houston,Texas, USA, June 15-18, 1997, paper 00.
11. Bob Freedman, personal communication, 1997.
44 Oilfield Review
A feature common to second-generation NMR log-
ging tools is the use of an advanced pulse-echo
spin flipping scheme designed to enhance the
measurement. This scheme, first developed nearly
fifty years ago for laboratory NMR measurements,
works in the following way.1
The Source —All hydrogen nuclei in water
[ H2O]; gas such as methane [CH4]; and oil [CnHm]
are single, spinning, electrically charged hydro-
gen nuclei—protons. These spinning protons cre-
ate magnetic fields, much like currents in tiny
electromagnets.
Proton Alignment—When a strong external
magnetic field—from the large permanent magnet
in a logging tool—passes through the formation
with fluids containing these protons, the protons
align along the polarizing field, much like tiny bar
magnets or magnetic compass needles. This pro-
cess, called polarization, increases exponentially
in time with a time constant, T1.2
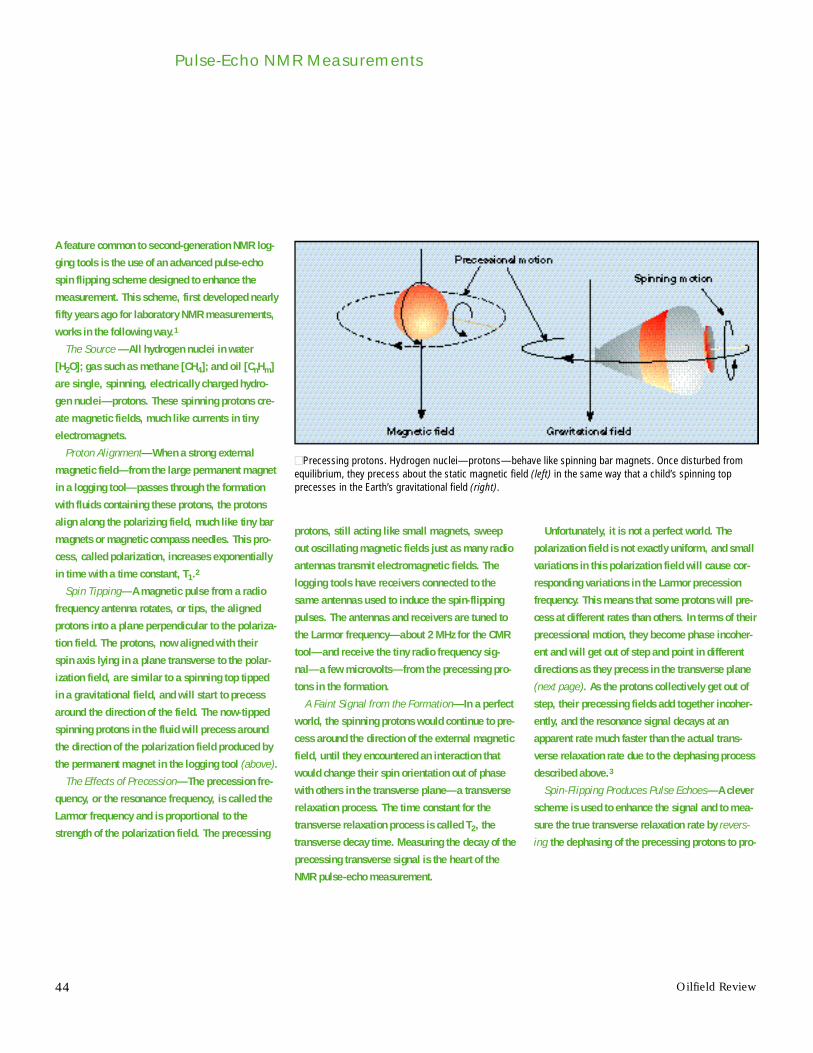
Spin Ti p p i n g—A magnetic pulse from a radio
frequency antenna rotates, or tips, the aligned
protons into a plane perpendicular to the polariza-
tion field. The protons, now aligned with their
spin axis lying in a plane transverse to the polar-
ization field, are similar to a spinning top tipped
in a gravitational field, and will start to precess
around the direction of the field. The now-tipped
spinning protons in the fluid will precess around
the direction of the polarization field produced by
the permanent magnet in the logging tool ( a b o v e ).
The Effects of Precession—The precession fre-
q u e n c y, or the resonance frequency, is called the
Larmor frequency and is proportional to the
strength of the polarization field. The precessing
protons, still acting like small magnets, sweep
out oscillating magnetic fields just as many radio
antennas transmit electromagnetic fields. The
logging tools have receivers connected to the
same antennas used to induce the spin-flipping
pulses. The antennas and receivers are tuned to
the Larmor frequency—about 2 MHz for the CMR
tool—and receive the tiny radio frequency sig-
nal—a few microvolts—from the precessing pro-
tons in the formation.
A Faint Signal from the Formation—In a perfect
world, the spinning protons would continue to pre-
cess around the direction of the external magnetic
field, until they encountered an interaction that
would change their spin orientation out of phase
with others in the transverse plane—a transverse
relaxation process. The time constant for the
transverse relaxation process is called T2, the
transverse decay time. Measuring the decay of the
precessing transverse signal is the heart of the
NMR pulse-echo measurement.
U n f o r t u n a t e l y, it is not a perfect world. The
polarization field is not exactly uniform, and small
variations in this polarization field will cause cor-
responding variations in the Larmor precession
f r e q u e n c y. This means that some protons will pre-
cess at different rates than others. In terms of their
precessional motion, they become phase incoher-
ent and will get out of step and point in different
directions as they precess in the transverse plane
(next page). As the protons collectively get out of
step, their precessing fields add together incoher-
e n t l y, and the resonance signal decays at an
apparent rate much faster than the actual trans-
verse relaxation rate due to the dephasing process
described above.3
Spin-Flipping Produces Pulse Echoes—A clever
scheme is used to enhance the signal and to mea-
sure the true transverse relaxation rate by r e v e r s-
i n g the dephasing of the precessing protons to pro-
Pulse-Echo NMR Measurements
■Precessing protons. Hydrogen nuclei—protons—behave like spinning bar magnets. Once disturbed fromequilibrium, they precess about the static magnetic field (left) in the same way that a child’s spinning top precesses in the Earth’s gravitational field (right).

Summer 1997 45
duce what is called a spin echo. This is done
applying a 180° spin flipping magnetic pulse a
short time—at half the echo spacing—after the
spins have been tipped into the transverse plane
and have started to dephase. By flipping the spins
180°, the protons continue to precess, in the same
transverse plane as before, but now the slowest
one is in first and the fastest one last. Soon the
slowest ones catch up with the fastest, resulting in
all spins precessing in phase again and producing
a strong coherent magnetization signal (called an
echo) in the receiver antenna. This process,
known as the pulse-echo technique, is repeated
many times; typically 600 to 3000 echoes are
received in the CMR tool.
The T2 Resonance Decay—The pulse-echo
technique used in today’s logging tools is called
the CPMG sequence, named after Carr, Purcell,
Meiboom and Gill who refined the pulse-echo
s c h e m e .4 It compensates for the fast decay
caused by reversible dephasing effects. However,
each subsequent echo will have an amplitude
that is slightly smaller than the previous one
because of remaining i r r e v e r s i b l e t r a n s v e r s e
relaxation processes.
Irreversible Relaxation Decay Rates— M e a s u r-
ing echo amplitudes determines their transverse
magnetization decay rate. The time constant T2
characterizes the transverse magnetization signal
d e c a y. The decay comes from three sources;
• intrinsic – the intrinsic bulk relaxation
rate in the fluids,
• surface – the surface relaxation rate,
a formation environmental effect
• diffusion – the diffusion-in-gradient
effect, which is a mix of environmental
and tool effects.
Bulk-fluid relaxation is caused primarily by the
natural spin-spin magnetic interactions between
neighboring protons. The relative motions of two
spins create a fluctuating magnetic field at one
spin due to the motion of the other. These fluctuat-
ing magnetic fields cause relaxation. The interac-
tion is most effective when the fluctuation occurs
at the Larmor frequency, 2 MHz for the CMR tool—
a very slow motion on the molecular time scale.
Molecular motions in water and light oils are
much more rapid, so the relaxation is very ineffi-
cient with long decay times. As the liquids
become more viscous, the molecular motions are
s l o w e r, and therefore are closer to the Larmor fre-
q u e n c y. Thus viscous oils relax relatively effi-
■Pulse-echo sequence and refocusing. Each NMR measurement comprises a sequence of transverse mag-netic pulses transmitted by an antenna—called a CPMG pulse-echo sequence (middle). Each CPMG sequencestarts with a pulse that tips the protons 90° and is followed by several hundred pulses that refocus the pro-tons by flipping them 180°. This creates a refocusing of the dephased spins into an echo. The reversible fastdecay of each echo—the free induction decay—is caused by variations in the static magnetic field (top). Theirreversible decay of the echoes—as each echo peak decays relative to the previous one—is caused by molec-ular interactions and has a characteristic time constant of T2—transverse relaxation time. The circled numbers correspond to steps numbered in the race analogy.
Imagine runners lined up at the start of a race (bottom). They are started by the 90° pulse (1). After severallaps, the runners are spread around the track (2, 3). Then the starter fires a second pulse of 180° (4, 5) andthe runners turn around and head in the other direction. The fastest runners have the farthest distance totravel and all of them will arrive at the same time if they return at the same rate (6a). With any variation inspeed, the runners arrive back at slightly different times (6b). Like the example of runners, the process of spin reversals is repeated hundreds of times during an NMR measurement. Each time the echo amplitude isless and the decay rate gives T2 relaxation time.
1. Hahn EL: “Spin Echoes,” Physical Review 80, no. 4 (1950):5 8 0 - 5 9 4 .
2. The time constant for this process, T1, is frequently knownas the spin-lattice decay time. The name comes from solid-state NMR, where the crystal lattice gives up energy to thespin-aligned system.
3. The observed fast decay due to the combined componentsof irreversable transverse relaxation decay interactions andthe reversable dephasing effect is frequently called the f r e einduction decay.
4. Carr HY and Purcell EM: “Effects of Diffusion on Free Precession in Nuclear Magnetic Resonance Experiments,”Physical Review 94, no. 3 (1954): 630-638.
Meiboom S and Gill D: “Modified Spin-Echo Method forMeasuring Nuclear Relaxation Times,” The Review of Scientific Instruments 29, no. 8 (1958): 688-691.

46 Oilfield Review
To tal Po ro s i ty for Better Pe r m e a b i l i tyA n sw e r s—In the North Sea, micaceoussandstones challenge density-derived poros-ity interpretation and permeability analysis,because grain densities are not well-know n .Here, CMR-derived total porosity provides am u ch better match to core porosity thanc o nventional porosity logging tools ( n ex tp a g e , t o p ) . In addition, permeability datad e r ived from CMR measurements are ofc o n s i d e rable value. Other sources of mea-suring this critically important reservo i rp a ra m e t e r, such as coring and testing,i nvoke high cost or high uncertainty.
Experience in these environments show sthat wellsite computations of CMR porosityand permeability using the default para m e-ters agree well with core data in at least75% of wells. Ty p i c a l l y, default para m e t e r sassume a fluid-hydrogen index of unity (forwater) and the Ti m u r-Coates equation with a33-msec T2 cutoff is used for computing thebound-fluid log.1 2 In most of these wells,the CMR tool is now being used to replacesome of the coring, especially in frontier off-shore drilling operations where coring cancost up to $6000 per meter.
An offshore Gulf of Mexico gas well,drilled with oil-base mud on the flank of alarge salt dome, provided an opportunity toe valuate fluid contacts in an established oiland gas field and determine hy d r o c a r b o np r o d u c t ivity in low - r e s i s t ivity zones. Previ-ous deep wells on this flank encountereddrilling difficulties leading to poor- t o - f a i rboreholes and degraded openhole log qual-i t y. This resulted in ambiguous petrophy s i-cal analysis and reservoir ch a racterization.
The combination of CMR measurementsand other logs provides a stra i g h t f o r wa r ddescription of the petrophysics in this well( n ext page, b o t t o m ) . These logs show manyh i g h - r e s i s t ivity zones in tra ck 2 and density-neutron crossovers in tra ck 3, wh i ch signalthese intervals as potentially gas-producing.Total CMR porosity is low in the gas inter-vals. There are some low - r e s i s t ivity interva l sthat could produce free wa t e r. Of specialinterest are the low - r e s i s t ivity zones at thebase of the gas sand in Zone C, wh i ch mayindicate a water leg, and the low - r e s i s t iv i t ysand in Zone D. The CMR bound-fluidporosity increases in these zones.
An ELAN Elemental Log Analysis interpre-tation, wh i ch combines resistivity and CMR
■Grain surface relaxation. Precessing protons diffuse about the pore space colliding with other protons andwith grain surfaces (left). Every time a proton collides with a grain surface there is a possibility of a relaxationinteraction occurring. Grain surface relaxation is the most important process affecting relaxation times. Exper-iments show that when the probability of colliding with a grain surface is high—in small pores (center)—relaxation is rapid and when the probability of colliding with a grain surface is low—in large pores (right)—relaxation is slower.
■Relaxation time versus viscosity. The bulk relaxationof crude oil can be estimated from its viscosity atr e s e rvoir conditions. T2 values are shown for variousecho spacings and have been computed for the CMRtool with a 20 gauss/cm magnetic field gradient. Diffu-sion-in-gradient effects, which depend on echo spac-ing, TE, dominate T2 rates for low viscosity liquids.
ciently with short T1 and T2 decay times ( r i g h t ). It
should be noted that for liquids with viscosity less
than 1 cp, T2 does not change much—and even
decreases for low viscosity. This is due to the dif-
fusion-in-gradient mechanism, which is strongest
for liquids with the largest diffusion coefficient—
lowest viscosity. This effect is also enhanced by
long echo spacing. The diffusion-in-gradient
mechanism does not affect T1.5
Fluids in contact with grain surfaces relax at a
much higher rate than their bulk rate. The surface
relaxation rate depends on the ability of the protons
in the fluids to make multiple interactions with the
surface. For each encounter with the grain surface,
there is a high probability that the spinning proton
in the fluid will be relaxed through atomic-level
electromagnetic field interactions. For the surface
process to dominate the overall relaxation decay,
the protons in the fluid must make many random
diffusion (Brownian motion) trips across the pores
in the formation ( a b o v e ). They collide with the grain
surface many times until a relaxation event occurs.
F i n a l l y, there is relaxation from diffusion in the
polarization magnetic field gradient. Because pro-
tons move around in the fluid, the compensation by
the CPMG pulse-echo sequence is never complete.
Some protons will drift into a different field
strength during their motion between spin flipping
pulses, and as a result they will not receive correct
phase adjustment for their previous polarization
field environment. This leads to a further, though
not significantly large, increase in the T2 r e l a x a t i o n
rates for water and oil. Gas, because of its high dif-
fusion mobility, has a large diffusion-in-gradient
effect. This is used to differentiate gas from oil.6
The pulse-echo measurements are analyzed in
terms of multiple exponentially decaying porosity
components. The amplitude of each component is
a measure of its volumetric contribution to porosity.
5. Kleinberg RL and Vinegar HJ: “NMR Properties of Reser-voir Fluids,” The Log Analyst 37, no. 6 (November-D e c e m b e r, 1996): 20-32.
6. Akkurt R, Vinegar HJ, Tutunjian PN and Guillory AJ: “NMRLogging of Natural Gas Reservoirs,” The Log Analyst 3 7 ,no. 6 (November- D e c e m b e r, 1996): 33-42. 12. The hydrogen index is the volume fraction of fresh
water that would contain the same amount of hy d r o-gen. The Ti m u r-Coates equation is a popular formulafor computing permeability from NMR measurements.Its implementation uses ratio of the free-fluid tobound-fluid volumes. It was first introduced in CoatesG and Denoo S: “The Producibility A n swer Product,”The Technical Rev i ew, 29, no. 2 (1981): 54-63.

Summer 1997
■Permeability logging using CMR totalporosity in North Sea micaceous sandstones.A good match (track 2), between core- andCMR-derived permeability using the defaultTimur-Coates equation, is common in manyNorth Sea reservoirs. This example is from anoil zone drilled with oil base mud.
■Gas production in the Gulf of Mexico.Bimodal CMR T2 distributions in track 4 showeffects of oil-base mud invasion with long T2and large bound-fluid components below the33-msec T2 cutoff. Neutron-density crossoverclearly shows gas zones. The low CMR signalis due to the low hydrogen content and longpolarization time of the gas. The bound-fluidmeasurement was used with the resistivitydata to determine movable water in thelower resistivity zones.
47

48 Oilfield Review
data, shows that there is little free water inthis entire interval ( l e f t ) . Most of the wa t e rcontained in these zones appears irre-ducible because the CMR bound-fluid vo l-ume matches the total water vo l u m ed e r ived from the resistivity logs. The upperthree sands were completed and the CMRtotal porosity, bound-fluid and permeabilitylogs allowed the operator to confidentlyp e r f o rate Zones A, B and C.1 3 The initialproduction from the upper three sand zoneswas 20 MMcf/D, 780 B/D [124 m3/d] ofcondensate with less than 1% wa t e r, con-firming the CMR interpretation. The low e rsands, Zones D and E, have not been com-pleted because of downdip oil production.H ow e ve r, the interpretation results fromthese zones have been included in theove rall well reserves analysis.
Another Gulf of Mexico example from aninfill development well in a faulted anticliner e s e r voir helped the operator determine if azone, believed to be safely updip from thewa t e r d r ive in a mature low - r e s i s t ivity oil-and gas-producing zone, would producesalt water or hydrocarbons. The CMRporosities and T2 distributions have beenadded to the standard density neutronPL AT F O R M EX P R E S S wellsite display ( n ext page).
S e ve ral sandstone intervals, Zones A, Band C, are easily identified by their longerT2 distributions that may correspond tohydrocarbons isolated in wa t e r-wet rocks orlarge wa t e r-filled pores. Zone C is morec o n d u c t ive—indicating wa t e r, but the CMRtotal porosity reads less than the density-porosity—indicating gas. There are high-r e s i s t ivity sands in Zones A and B that aredifficult to interpret from raw logs alone. Th epicture is confusing.
A petrophysical analysis, combining CMRand PL AT F O R M EX P R E S S data over this interva l ,r e veals the nature of the reservoir complex-ities—lithologic changes and the presenceof a wa t e r d r ive flood front (page 50, t o p ) .This interpretation—including the CMR-d e r ived permeability, verified by subse-quent core analysis—along with irreduciblewater analysis, shows that the upper resis-t ive sand, Zone A, is productive and con-tains oil with little free wa t e r. The middle,less resistive sand, Zone B, contains less oilwith a significant amount of potential pro-ducible wa t e r. The low - r e s i s t ivity sand,Zone C, appears to contain some oil, butwith a large amount of free water mostlikely coming from the wa t e r f l o o d .
■ELAN interpretation analysis. The CMR-resistivity interpretation suggests that there is nomovable water in the entire logged interval. The top three sand zones A, B and C, all withhigh permeability determined by the CMR tool, track 2, produced 20 MMcf/D of gas with780 B/D condensate and no water. The reserves indicated in the lower sand Zone E willbe completed at a later time.
13. W h e n e ver oil-base mud is used in wa t e r-wet rocks, it is easy to identify bound versus free fluid. Bound-fluid water has a short T2, and oil-base mud flushinginto the free-fluid pore space has a long T2. The T2 cutoff is obvious, making free fluid and boundfluid easy to distinguish for Ti m u r-Coates perme-ability calculations.

Summer 1997 49
The opera t o r, hoping that the logs mighth ave been affected by deep invasion, com-pleted and tested the lower sand, Zone C.H ow e ve r, it produced only salt wa t e r, con-sistent with the petrophysical interpretation.After a plug was set above this zone, theupper sands were completed and produce100 BOPD [16 m3/d] with only a 10%water cut, wh i ch is also in agreement withthe expectations from the ELAN interpreta-tion. It is clear that combining the porositydiscrimination and permeability informationfrom CMR measurements with other logs,s u ch as resistivity and nuclear porosity,helps explain what is happening to thewa t e r d r ive and hydrocarbons in pay zonesin this common, but complex, reservo i r.
Logging for Bound-FluidBound-fluid logging, a special applicationof NMR porosity logging, is based on theability of NMR to distinguish bound-fluidporosity from free- or mobile-fluid porosity.Bound-fluid porosity is difficult to measureby conventional logging methods. A fullNMR measurement requires a long wa i ttime to polarize all components of the for-mation, and a long acquisition time to mea-sure the longest relaxation times. How e ve r,experience has shown that the T2 r e l a x a t i o ntime of the bound fluid is usually less than33 msec in sandstone formations and lessthan 100 msec in carbonate formations. Infast bound-fluid NMR logging, it is possibleto use short wait times by accepting lessa c c u ra cy in measuring the longer T2 c o m-ponents. In addition, a short echo spacingand an appropriate number of ech o e sreduce the acquisition time and ensure thatthe measurement volume does not ch a n g esignificantly because of the faster toolm ovement. This logging mode can acquireNMR data at speeds up to 3600 ft/hr [1100 m/hr] because of the short relaxationtimes of the bound fluid.
The bound fluid volume can be used inconjunction with other high speed loggingmeasurements to calculate two key NMRa n swers—permeability and irreduciblewater saturation, Sw i r r. Ty p i c a l l y, the densitylog is used in shaly sands, and the density-neutron crossplot porosity log is used in gassands, carbonates and complex lithologies.The epithermal neutron porosity from the
■Wellsite PL AT F O R M EX P R E S S display. This example shows long T2 components in the low-resistivity pay sand, Zone C. This appears to the CMR tool to contain mostly free water inl a rge pores, but could contain isolated hydrocarbons with long T2. The upper two zoneshave high resistivity and potentially contain hydrocarbons. The total CMR poro s i t ymatches the density porosity except in the lower sections of Zones A and C, due to incom-plete polarization (with a 1.3 sec wait time) of the hydro c a r b o n s .

50 Oilfield Review
■Solving the mystery with ELAN interpre-tation. High permeability derived from theCMR tool, track 2, with water saturation,track 3, and irreducible water analysis,track 4, show that the low-resistivity paysand in Zone C will produce only water,p robably from the flood drive. The uppersand, Zone A, contains oil with only a littlef ree water. Zone C tested 100% salt water,w h e reas the upper zone is producing 100 BOPD with a low water cut. Note theexcellent agreement between the CMRp e rmeability and core-derived perm e a b i l-ity (black circ l e s ) in track 2.
■Bound-fluid logging with water- f ree pro-duction in a long oil-water transition zone.CMR readings indicate water- f ree pro d u c-tion above XX690 ft, where the water vol-ume, φSw, computed from resistivity logsmatches the bound-fluid volume (BFV) fro mthe CMR tool. Even though bound-fluid log-ging speeds are fast, long T2 c o m p o n e n t sa re seen in the CMR T2 d i s t r i b u t i o n s .

Summer 1997 51
APT tool is especially accurate because it isimmune to the thermal neutron absorbereffects frequently found in shales.1 4
Bound-fluid logging can also be used todetect heavy oil, since many high-viscosityoils have T2 components below the 33-msecor 100-msec cutoffs and above the 0.3-msecdetection limit of the CMR-200 tool. Th e s eoils will be properly measured in a bound-fluid log.
Our first example of bound-fluid loggingcomes from the North Sea, where long tra n-sition zones and zones of low - r e s i s t ivity payoften lead to uncertainty about the mobilefluid being oil or wa t e r, or both (p rev i o u sp a g e , b o t t o m ) . One method of predictingmobile water is to compare the bound-fluidvolume, BFV, seen by the CMR tool withφSw—the volume of water computed fromthe resistivity measurement. If the totalwater from the φSw calculation exceeds theBFV measurement, then the excess wa t e rwill be free fluid and therefore producible.1 5
In this example, the CMR bound-fluid toolwas run with the standard triple combo—neutron and density for total porosity and anAIT A r ray Induction Imager Tool for satura-tion—at 1500 ft/hr [460 m/hr]. The fast-log-ging CMR tool was run with a short wa i ttime of 0.4 sec and 600 echoes. This wellwas drilled with an oil-base mud, wh i chcreated a large signal at long T2 times due toi nvasion of oil filtrate. To fully capture theselong T2 components for a total CMR poros-ity measurement, wait times of 6 sec wo u l dh ave been required, at a correspondinglys l ower logging speed of 145 ft/hr [44 m/hr].
An interpretation based on density, neu-tron and resistivity logs yields the lithologyand fluid content. The T2 distributions showsignificant oil-filtrate signal seen at latetimes despite the short wait time. The lithol-ogy analysis shows little or no clay, consis-tent with the lack of T2 data below 3 msec.
In this well, a 100-msec cutoff was used todifferentiate the bound-fluid volume from thefree fluids; this is verified by excellent agree-ment with core permeability using the defaultTi m u r-Coates equation. Ideally, the T2 c u t o f fshould be confirmed independently, forexample by careful sampling with the MDTModular Formation Dynamics Tester toolaround the oil-water transition depths.
In another example, a real-time wellsiteq u i cklook display was developed for com-bining CMR bound-fluid logging with thePL AT F O R M EX P R E S S acquisition at 1800 ft/hr[550 m/hr] in the Gulf of Mexico. In offshorewells, with hourly operating expenses thatfar exceed logging costs, fast logging andimmediate answers are critical for timely
decision-making at the wellsite. The fieldq u i cklook incorporates the CMR measure-ments into a Dual-Water saturation compu-tation. The results are total porosity from theneutron-density and water saturation fromthe AIT induction tools ( a b ove ) . The wellsitepermeability computation, tra ck 2, uses theCMR bound-fluid results in a Ti m u r- C o a t e sanalysis with two estimates of total poros-ity—one from the traditional neutron-densitycrossplot porosity, and the other from a den-s i t y - d e r ived porosity.1 6
The first porosity estimate is more accura t ein the shaly sections but requires free- andb o u n d - water resistivity and wet-clay porosityp a rameters and is limited by the vertical reso-lution of the neutron measurement. The sec-ond porosity estimate has the advantages ofnot requiring any parameter picks for theshaly intervals and also has the higher ve r t i-
cal resolution inherent in the density mea-surement. The field-derived results show bothsand Zones, A and B, with good productionpotential and with low water cut. These log-ging results agree well with the sidewall corepermeabilities and porosities measured later,s h own as circles in tra cks 2 and 4.
Re p e a ta b i l i ty of Fast BFV Lo g g i n g— Th i sexample shows that accurate and repeatablebound-fluid volumes and permeabilities can
■PL AT F O R M EX P R E S S-CMR wellsite quicklook. The field interpretation results from high-speedCMR logging enable the operator to quickly identify that hydrocarbon pay Zones A andB, have high permeability, track 2, and high potential for water- f ree production becauseall the water in the interval, as shown in track 4, is either clay-bound or irreducible. Thewellsite interpretation results also compared well with core analysis obtained later.
14. Scott HD, Thornton JL, Olesen J-R, Hertzog RC,M c Keon DC, DasGupta T and Albertin IJ: “Responseof a Multidetector Pulsed Neutron Porosity To o l ,”Transactions of the SPWLA 35th Annual Lo g g i n gS y m p o s i u m, Tulsa, Oklahoma, USA, June 19-22,1994, paper J.
15. The BFV log measures the capillary-bound and non-mobile wa t e r.
16. L a Vigne J, Herron M and Hertzog R: “Density-Neu-tron Interpretation in Shaly Sands,” Transactions ofthe SPWLA 35th Annual Logging Symposium, Tu l s a ,Oklahoma, USA, June 19-22, 1994, paper EEE.

52 Oilfield Review
be measured at high logging speeds( a b ove ) . Three runs were made through aseries of sand-shale zones, where freshwater makes producibility evaluation diffi-cult and high-precision bound-fluid deter-mination is important. The three CMRpasses were made with 0.2-sec wait time,
200 echoes at 3400 ft/hr [1040 m/hr]; 0.3sec wait time, 600 echoes at 1800 ft/hr [549 m/hr]; and finally at 2.6 sec wait time,1200 echoes at 300 ft/hr [92 m/hr]. The datawere processed with total CMR porosity tog ive T2 distributions from 0.3 msec to 3 sec,s h own in tra cks 3, 4 and 5 for each run. Th ethree bound-fluid BFV logs, computed with
default 33-msec T2 cutoff and five - l e ve ls t a cking, are shown in tra ck 1. They agreewell with each other, having a root-mean-square error on the bound-fluid vo l u m e sabout of 1.2 p.u., wh i ch is comparable tothe typical statistical error found in othernon-NMR porosity logs. The BFV curve scorrelate well with the gamma ray except inZones A and B, with the shortest T2 va l u e s ,where the relaxation may be too rapid to beseen by the CMR tool.
Permeability estimates, in tra ck 6, werebased on the standard Ti m u r-Coates equa-tion. CMR bound-fluid logs and a robust totalporosity estimator based on the minimum ofthe density and neutron-density porositieswere used to compute the free-fluid and thebound-fluid volumes used in this permeabil-ity equation.1 7 At these logging speeds, allthree permeability estimates overlie onea n o t h e r, typically within a factor of 2.
Integrated AnswersBound-fluid logging is one example of howCMR measurements combine with otherlogging measurements to provide a simple,more accurate picture of the formation in afast, more efficient manner. The CMR toolcan be combined with the MDT tool to givebetter producibility answers. The in-situ,dynamic MDT measurements complementthe CMR continuous permeability log, andhelp verify the presence of produciblehydrocarbons. Wellsite efficiency is substan-tially increased when MDT sampling depthsare guided by CMR results.
R e s e r voirs often exhibit large vertical het-erogeneity due to the variability of sedi-mentary deposition, such as in laminatedformations. In vertical wells, formationproperties can change over distances smallcompared to the intrinsic vertical resolutionof logging tools. In horizontal wells, thed rainhole can be located near a bedboundary with different formation proper-ties above and below the logging tools. It isimportant that all logging sensors face thesame formation volume.
Two logging measurements that inve s t i g a t ethe same rock and fluid volume in a forma-tion are said to be coherent. Conve n t i o n a llog interpretation methods can be limited bya lack of volumetric coherence betweenlogs. For example, when subtracting thebound-fluid porosity response of an NMRtool from the total porosity response of anuclear tool to compute a free-fluid index,care must be taken to ensure that the
■Repeatability of bound-fluid logging. Logs and T2 distributions from three runs at 300,1800 and 3400 ft/hr in the same well show how well the bound-fluid volumes, track 1,a g ree even at fast logging speeds. The permeability results, track 6, from CMR bound-fluid logging overlie even at the highest logging speeds. The T2 distributions are similar,though the peaks in the sands seem to change somewhat, because there are not enoughechoes in the fast logging measurement to completely characterize the slower re l a x-ations. The longest T2 components disappear in the fast-logging mode.
17. Singer JM, Johnson L, Kleinberg RL and Flaum C:“ Fast NMR Logging for Bound-Fluid and Pe r m e a b i l-i t y,” Transactions of the SPWLA 38th Annual Lo g g i n gS y m p o s i u m, Houston, Texas, USA, June 15-18,1997, paper PP.

Summer 1997 53
nuclear tool does not sample a different vo l-ume than the NMR tool.1 8
An interesting example of combining CMRlogging with other coherent measurements,is the method of determining formation siltvolume developed with A g i p .1 9 Silt is animportant textural component in clasticr o cks because it relates to the dynamic con-ditions of transportation and deposition ofsediments. The quality of a reservoir is deter-mined by the amount of silt present in ther o ck formation. Fine silt dra s t i c a l l ydecreases permeability and the ability of ar e s e r voir to produce hydrocarbons. The siltcan be of any lithology; and, since it isrelated only to grain size, its volume anddeposition properties can be determinedwith the help of CMR logging, in combina-tion with EPT measurements.
Dielectric propagation time and attenua-tion increase with silt volume. These twologs, coupled with the APT epithermal neu-tron porosity, provide a porosity interpreta-tion unaffected by the large thermalabsorbers typically associated with silts andshales in formations, and are thereforeappropriate in determining silt volume incomplex lithologies.
A c c u ra cy in determining silt volume, aswell as a host of other para m e t e r s — p e r m e-a b i l i t y, fluid volumes and mobility—depends upon a high coherence betweenlogging measurements.
The CMR measurement’s ability to ch a ra c-terize grain size, using the T2 d i s t r i b u t i o n s ,coupled with other complimentary logs,was successfully used to understand a com-plex reservoir sequence of thinly laminatedsands, silt and shales in the presence ofwater and gas ( r i g h t ) . The well was drilledwith fresh wa t e r-base mud. The EPT dielec-tric attenuation and propagation timec u r ves, showing high bed resolution in tra ck1, cross each other—clearly identifying thesequence of silty sands and shales. Pe r m e-
■Avoiding water production in thinly layered gas sands with CMR data combined withother coherent logging measurements. There are nearly 20 gas pay-sands showing in thisinterval, all showing similar log profile characteristics—separation of the EPT dielectricp ropagation time TPL, and attenuation EAT T, logs in track 1 and the free-fluid volumesf rom CMR and epithermal neutron porosity, in track 4. The interpretation results identifyt h ree Zones (A, C and the lower part of Zone F) that contain free water in the re s e r v o i r s .The CMR tool responds well to thin beds (Zones B, D and G).
18. An example of an incoherent result would be thecase in wh i ch a nuclear tool is sampling a fewi n ches of formation, and an NMR tool is samplings e ve ral feet of formation, or vice versa. Then the net free fluid could be distorted and incorrectly computed by large porosity changes within the sample volume caused by shale laminations in theformation. If the nuclear and NMR tools are sam-pling the same volume of rock, then the combinedresults will always be correct because the differentmeasurements will be volume matched.
19. Gossenberg P, Galli G, Andreani M and Klopf W: “ANew Pe t r o p hysical Interpretation Model for ClasticR o cks Based on NMR, Epithermal Neutron and Elec-tromagnetic Logs,” Transactions of the SPWLA 37thAnnual Logging Symposium, New Orleans,Louisiana, USA, June 16-19, 1996, paper M.Gossenberg P, Casu PA, Andreani M and Klopf W: “A Complete Fluid Analysis Method Using NuclearMagnetic Resonance in Wells Drilled with Oil BasedM u d ,” Transactions of the Offshore MediterraneanCo n f e re n c e, Milan, Italy, March 19-21, 1997, paper 993.

54 Oilfield Review
ability curves were computed from the CMRbound-fluid log using both the Ti m u r- C o a t e sequation and the Ke nyon equation with thelogarithmic mean of T2.2 0 Both give reason-able agreement with permeability resultsd e r ived from core and the RFT Repeat Fo r-mation Tester tool.
The dry sand, silt and clay volume inter-pretation model, shown in tra ck 3, includesc l ay-bound wa t e r, capillary-bound water (orirreducible water), and movable water ( n ex tp a g e , t o p ) . By subtracting the irreduciblewater measured directly by the CMR bound-fluid log from total volume of wa t e r, φSw,computed from Rt after clay corrections, allfree water zones within the reservoirs areclearly determined. For example, Zone Fcannot be perforated without risk of largewater production. Apart from Zones A andF, most of the other reservoirs show dry gas.The epithermal neutron and density porositylogs are shown along with NMR logs int ra ck 4. There are intervals with clear exam-ples of gas crossover between the density-neutron porosity curves. Also, the separa t i o nbetween the APT neutron porosity and CMRporosity provides a good estimate of clay -water vo l u m e .
The logs show excellent correlationbetween the EPT and CMR curves. Th esequence of fining-up grain size in the sandsthrough Zone F is displayed on the logs asan increasing silt index. This is confirmed byincreasing attenuation and propagationtimes on the EPT logs—because of increas-ing conductivity in the silt, and an increasein bound-water porosity in the CMR logs—implying a decrease of movable fluid. Th eprofile on other pay reservoirs between bothtools shows similar ch a racteristics, especiallyin the EPT curve separation and the free-fluidvolumes from the CMR measurements.
The CMR measurements complement othercoherent logging measurements, such asdielectric, Litho-Density, microresistiv i t y,neutron capture cross sections and epither-mal neutron porosity, in providing a criticale valuation and complete interpretation inthese complex formation environments. Th eLitho-Density tool is needed for lithology—todetermine the T2 cutoff for CMR bound-fluid
In zones containing unflushed gas near the bore-
hole, total CMR porosity log—TCMR—underesti-
mates total porosity because of two effects: the
low hydrogen concentration in the gas and insuffi-
cient polarization of the gas due to its long T1
relaxation time. On the other hand, in the pres-
ence of gas, the density-derived porosity log DPHI,
which is usually based on the fluid being water,
overestimates the total porosity because the low
density of the gas reduces the measured formation
bulk density. Thus, gas zones with unflushed gas
near the wellbore can be identified by the deficit or
separation between DPHI and TCMR logs—the
NMR gas signature. The method of identifying gas
from the DPHI/TCMR deficit does not require that
the gas phase be polarized.1
The advantages of this method of detecting gas
include:
• faster logging in many environments since the
gas does not have to be polarized2
• more robust gas evaluation since the deficit in
porosity is often much greater than a direct
gas signal
• total porosity corrected for gas effects.
As an aid to interpreting gas-sand formations,
the gas-corrected porosity, φg a s - c o r r, and gas bulk-
volume, Vg a s, equations are derived from a petro-
physical model for the formation bulk density and
total CMR porosity responses.
The mixing law for the density log response is:
and for the total CMR porosity response:
.
In these equations, ρb is the log measured bulk-
formation density, ρm a is the matrix density of the
formation, ρf is the density of liquid phase in the
flushed zone at reservoir conditions, ρg is the den-
sity of gas at reservoir conditions, and φ is the
total formation porosity.
( H I )g is the hydrogen index—the volume fraction
of fresh water that would contain the same amount
of hydrogen—of gas at reservoir conditions, and
( H I )f is the hydrogen index of fluid in the flushed
zone at reservoir conditions. Sg is the flushed
zone gas saturation.
accounts for the polar-
ization of the gas, where W is wait time of the CMR
tool pulse sequence, and T1 , g is the longitudinal
relaxation time of the gas at reservoir conditions.
To simplify the algebra, a new parameter,
, is introduced, and formation bulk
density is eliminated by introducing d e n s i t y —
derived porosity, .
Solving these equations for the gas-corrected
p o r o s i t y, φg a s - c o r r, one gets:
,
and for the volume of gas, one gets:
The gas saturation can be obtained from these
equations by simply dividing the latter by the for-
m e r. Note that the gas-corrected porosity, φg a s - c o r r,
is the NMR analog of the neutron/density log
crossplot porosity, and is always less than D P H I
and greater than T C M R / ( H I )f.
—Bob Freedman
Gas-Corrected Porosity from Density-Porosity andCMR Measurements
20. Ke nyon WE, Day PI, Straley C and Willemsen JF: “ATh r e e - Part Study of NMR Longitudinal RelaxationProperties of Wa t e r- S a t u rated Sandstones,” SPE Fo r-mation Eva l u a t i o n 3 (1988): 622-636.
21. Freedman et al, 1997, reference 10.22. Bass C and Lappin-Scott H: “The Bad Guys and the
Good Guys in Petroleum Microbiology,” O i l f i e l dRev i ew 9, no. 1 (Spring 1997): 17-25.
1. To be able to attribute this deficit to gas, the wait time forthe logging sequence must be sufficiently long to polarizeall the liquids, including formation water and mud filtrate.
2. Oilbase muds are the exception and require long wait timesdue to the long T1 relaxation time of oil filtrate.

Summer 1997 55
logging—and the salinity independent CMRwater volume is used to correct the dielectricand resistivity logs—used for fluid satura t i o n .
Identification of Oil V i s c o s i ty and Ta rD e p o s i t s—A trend to produce heavy-oil froms h a l l ow reservoirs is creating the need todetect high viscosity oil and tar deposits. Fr e-q u e n t l y, due to the shallow depths and thecomplex filling history of the structures, reser-voirs were charged, then later breached andr e charged. This results in significant ch a n g e sin the properties of the hy d r o c a r b o n sthroughout the reservoir sections. One way todistinguish and identify these oils is to mea-sure their viscosity in situ using bulk relax-ation times from the CMR data. The bulkrelaxation rates of different oils can be mea-sured with reasonable accura cy, between 2and 10,000 cp, using the CMR tool.2 1
Field examples show that CMR log-d e r ived viscosities match drillstem test-d e r ived values. It is important to determinewh i ch part of the T2 signal distribution isfrom the oil bulk relaxation decay. In clean,coarse sands containing high-viscosity oil,this is a stra i g h t f o r ward process, because theoil, having a fast decay, is isolated from thewa t e r-wet rock having a slower decay, andsurface relaxation has little effect on the fastbulk oil decay. For low-viscosity oils in fine-g rained rocks, the bulk oil relaxation ra t e sare much slower and can easily be sepa-rated from the wa t e r- s a t u rated rock signal.
In some settings, over geological time, oilsh ave come into contact with wa t e r- b o r n ebacteria that produce impermeable seals—tar deposits at oil-water contacts.2 2 Th e s er e s e r voirs may receive a further oil ch a r g e ,wh i ch encases a tarry zone inside thehydrocarbon zone. In such a position, thetar zone could have a dramatic effect on themanagement of the field during production.
The tar, surrounded by other hy d r o c a r-bons, appears similar to the surrounding flu-ids when logged with non-NMR tech n i q u e s .E ven when cored intervals are available, thetar may be overlooked if the core samplesare cleaned, as they traditionally are, beforeanalysis. How e ve r, the CMR signature in atar zone is quite clear and distinct from thatof more mobile hydrocarbons or wa t e r. Ithas been suggested that long hy d r o c a r b o nchains within the tar cause it to behavealmost like a solid—dramatically shorteningthe T2 response. Tar is detected by thereduction in NMR porosity.
An example from the North Sea shows theclear tar detection signature—missing poros-ity and short T2 d e c ays ( l e f t ) . The well wa sdrilled with an oil-base mud through seve ra loil and water zones identified in tra ck 2.
■Silt volume interpretation using EPT, APT and CMR logs. The datain the crossplots come from a mixture of sands, mica and feldspar.EPT attenuation, EAT T, and propagation time, TPL, are cro s s p l o t t e d( l e f t ) along with the diff e rence between APT epithermal neutro np o rosity and CMR 3-msec effective porosity, shown as a Z-axis dis-c r i m i n a t o r. There are two clusters of points. One is for the silty sandw h e re gas is present (lower cluster). There is a departure from thesandstone line when silt increases. The second cluster is in severalnonpay reservoirs where clay minerals, associated with fine silt,f o rm the shales. The APT-CMR effective porosity diff e re n c ei n c reases in proportion to the clay content due to the clay-boundw a t e r. Since the gas content is properly controlled on the EPT cro s s-plot, the dielectric data are used to apply accurate gas corre c t i o n son the CMR porosity logs. On the CMR stand-alone crossplot ( r i g h t ),the silt index increases with the bound-fluid values. The scatter inthe CMR data is a gas effect induced by low polarization and vari-ation in hydrogen index. The APT-CMR diff e rence porosity is usedagain for Z-axis discrimination and the two clusters are identified.Fine silt in the shales follows the 45° clay trend line downwards tothe clay endpoint at the origin. Except for the gas scatter on CMRp o rosity, the crossplot confirms the high coherence existingbetween the three logs.
■Tar zonesdetected by theCMR tool. Inw a t e r, gas or oil,the CMR tool hasa clear tar signa-t u re as seen inZone C—a sup-p ression of thelong T2 c o m p o-nents (track 5)and a re d u c e dtotal poro s i t y(track 4). In thiswell the CMR toolis able to con-f i rm—by the pre s-ence of large T2contributions fro moil and no re d u c-tion in total CMRp o rosity—that thelower oil zone(Zone E) is not tar,but mobile oil,which could betrapped by alocal stratigraphicc l o s u re .

56 Oilfield Review
When the tar is in a conductive water zone,as it is in this example, it can be easily identi-fied by resistivity measurements. How e ve r,tar is frequently located in hy d r o c a r b o nzones, where there is no resistivity contra s tbetween tar and nontar hydrocarbon inter-vals. In such cases, NMR is the only routinelogging measurement that can identify the tar.
Like tar, heavy oil has a short T2 r e l a x a t i o nd e c ay time, so detecting heavy oil is similarto detecting tar, except that the heav y - o i lrelaxation times are sufficiently long to becaptured by the total porosity response ofthe CMR-200 tool. Essentially, the heav y - o i lT2 contribution shifts the signal below the 3-msec T2 cutoff, but not below the 0.3-msecdetection limit of the CMR-200 tool (r i g h t ).
This example is from a heavy-oil reservo i rin California. The low - g ravity (12 to 16°API)oil is produced by a steam-soak injectionmethod. The logs show that all porositylogs—total porosity, 3-msec effective poros-i t y, density and neutron porosity—agree inthe lower wet Zone B. The CMR porositiesagree in the wet zone because the formationdoes not have T2 values below 3-msec asso-ciated with clay-bound porosity or microp-o r o s i t y. In the upper oil-bearing Zone A ,total CMR-porosity reads about 5 p.u. higherthan the 3-msec porosity over most of thisi n t e r val, because the heavy oil has consider-able fast relaxing components below the 3-msec T2 s e n s i t ivity limit of the early 3-msec porosity measurement. The differentresponses of the two CMR porosity measure-ments to the heavy oil provide a clear delin-eation of the oil zone and show the oil-water contact between Zones A and B.
Logging Saves Dollars—Combining geo-chemical logs with CMR-derived permeabil-ity and free-fluid data, a major oil companywas able to select only productive zones fors t i m u l a t i o n — s aving $150,000 in a SouthTexas well.2 3 The objective was to complete,including fracture simulation, three high-r e s i s t ivity potential pay zones at the bottomof the well. Total porosity from CMR isapproximately 10 to 15 p.u. in all zones,where free fluid varies from 1 to 10 p.u.
H ow e ve r, spectral data from the ECS Ele-mental Capture Spectrometer sonde indi-cate significant differences in clay and car-
bonate cement volumes between zones( n ext page) .2 4 The two Zones, A and C,exhibit lower clay and higher carbonate—calcite cement—content than Zone B.Resistivity measurements and CMR-derivedbound fluid and permeability correlatewith the lithology changes. Increased clayvolumes in Zone B represent shales thatare clay - r i ch—suggesting a lower deposi-tional rate.
These important lithological differencesh ave significant influence on the electrical,m e chanical and fluid flow properties of ther e s e r voir intervals. Bound fluid and free flu-
ids, measured by the CMR tool, vary widelyfor any given porosity, and have a largeimpact on the permeability.
Based on the logging results, Zone C wa sp e r f o rated and fracture stimulated and iscurrently producing gas at a rate of 6 MMcf/D with a very low water cut of 10 BWPD. The pessimistic estimates of freefluid volumes and permeability from the
■How to see a heavy-oil water contact with total CMR porosity. Theoil-bearing Zone A and the oil-water contact between Zones A andB are clearly delineated by the separation between the total CMRp o rosity log, TCMR, and the 3-msec porosity log, CMRP, shown intrack 3. The oil-water contact is confirmed by the resistivity logs intrack 2. The large heavy oil contribution to the total porosity can beseen by short relaxation decay components above the oil-watercontact in the T2 distribution in track 4.
23. H o r k owitz JP and Cannon DE: “Complex Reservo i rE valuation in Open and Cased We l l s ,” Tr a n s a c t i o n sof the SPWLA 38th Annual Logging Symposium,Houston, Texas, USA, June 15-18, 1997, paper W.
24. Herron SL and Herron MM: “Quantitative Lithology:An Application for Open- and Cased-Hole Spec-t r o s c o py,” Transactions of the SPWLA 37th A n n u a lLogging Symposium, New Orleans, Louisiana, USA,June 16-19, 1996, paper E.

Summer 1997 57
CMR tool, confirmed by the increased claycontent shown by the geochemical logs,c o nvinced the client to cancel the expensivef racture stimulation and abandon the largemiddle zone, Zone B. The upper zone, ZoneA, is currently being perforated and a fra c-ture stimulation is planned based on theCMR and ELAN interpretation results, withan expected gas production rate in excess of10 MMcf/D.
The Outlook for the FutureThis is an exciting time for petrophy s i c i s t s ,r e s e r voir engineers and geologists who usewell logging measurements. Recenti m p r ovements in NMR logging tool tech n o l-ogy have dramatically increased the range ofrelaxation rates that can be measured in theborehole. To d ay, we can finally use thesetools to differentiate bound and free fluids inthe formation, determine permeability, andlog faster for bound fluids. We have seenm a ny examples of how to use these mea-surements to improve our understanding ofcomplex shaly sand formations. The CMRand MRIL tools are commercial and their useis already routine in many parts of the wo r l d .H ow e ve r, there is much more to learn.
More work needs to be done to under-stand how to use T2 distributions effective l yin carbonate formations, with theirextremely wide variations in porosity scaleand structure. Our interpretation of NMRresponses in shaly sand reveals bound andfree fluids. In the future, we must extend theinterpretation so that the measured relax-ation decay times and the T2 distributions incarbonates also reflect the mobility anddynamics of reservoir fluids in these farmore complex pore structures.
—RCH
■CMR combined with geochemical logs from the ECS tool. Decreased free fluid (track 1)and permeabilities from CMR logs (track 2) and hydrocarbons from an ELAN interpre t a-tion (track 4) show the middle interval (Zone B) was not worth the expensive fracture jobplanned by the operator. The low permeability is due to clay and carbonates seen in thisinterval (track 4). Two other Zones (A and C) in the same well, were identified with lowerclay, as seen by the geochemical logs, and CMR permeabilities are ten times better inthese intervals. Zone C was completed and is producing gas at a rate of 6 MMcf/D andZone A is expected to produce in excess of 10 MMcf/D.