how to use ctd data€¦ · 1 image captions/credits on page 2. gulf of mexico 2012 expedition...
TRANSCRIPT

1
Image captions/credits on Page 2.
Gulf of Mexico 2012 Expedition
Tools for Classroom Explorers
How to Use CTD DataFocus
CTD (conductivity, temperature, depth profiler)
Grade Level5-12 (Physical Science/Earth Science)
Focus QuestionHow does a CTD help explore Earth’s deep ocean?
Learning Objectivesn Students define “CTD” and explain how this instrument is used aboard
the Okeanos Explorer.n Students explain how relationships between temperature, salinity,
pressure, and density in seawater are useful to ocean explorers.n Students use data from the Okeanos Explorer to create and interpret
graphs of temperature, salinity, and depth.
Materialsq For Grades 5-8: Copies of CTD Data Collected on Okeanos Explorer Cruise
EX1004, Leg 3 Worksheet; one copy for each student or student group q For Grades 9-12: Copies of the Introduction to CTD Data Worksheet, one
for each student group q Computers with Internet accessq (Optional) Copies of Okeanos Explorer CTD Supplemental Datasheets for
one or more Okeanos Explorer cruisesq (Optional) Copies of Reality Check: When the CTD Stops Working, one for
each student group
Audio-Visual Materialsq (Optional) Interactive white board
Teaching TimeOne 45-minute class period; (more if students complete Supplemental Datasheets)
Seating ArrangementGroups of two to four students
Maximum Number of Students30

2
Image captions/credits on Page 2.
www.oceanexplorer.noaa.gov Gulf of Mexico Expedition 2012: How to Use CTD DataGrades 5-12 (Physical Science/Earth Science)
Key WordsNOAA Ship Okeanos ExplorerCTDConductivityTemperatureDepth
Background InformationExplanations and procedures in this lesson are written at a level appropriate to professional educators. In presenting and discussing this material with students, educators may need to adapt the language and instructional approach to styles that are best suited to specific student groups. On August 13, 2008, the NOAA Ship Okeanos Explorer was commissioned as “America’s Ship for Ocean Exploration;” the only U.S. ship whose sole assignment is to systematically explore our largely unknown ocean for the purposes of discovery and the advancement of knowledge. To fulfill this mission, an exploration strategy is used that involves three major activities: •Underwayreconnaissance; •Watercolumnexploration;and •Sitecharacterization.
Underway reconnaissance involves mapping the ocean floor and water column while the ship is underway, and using other sensors tomeasurechemicalandphysicalpropertiesofseawater.Watercolumn exploration involves making measurements of chemical and physical properties “from top to bottom” while the ship is stopped. In some cases these measurements may be made routinely at pre-selected locations, while in other cases they may be made to decide whether an area with suspected anomalies should be more thoroughly investigated.Sitecharacterizationinvolvesmoredetailedexplorationof a specific region, including obtaining high quality imagery, making measurements of chemical and physical seawater properties, and obtaining appropriate samples.
Key technologies involved with this strategy include:•Multibeamsonarmappingsystem;•CTDandotherelectronicsensorstomeasurechemicalandphysical
seawater properties; and•ARemotelyOperatedVehicle(ROV)capableofobtaininghigh-
quality imagery and samples in depths as great as 6,000 meters.
A fourth technological capability that is essential to the Okeanos Explorer exploration strategy is advanced broadband satellite communication. This capability provides the foundation for telepresence: technologies that allow people to observe and interact
Images from Page 1 top to bottom:Backdeck: Bobby Mohr, Tom Kok, and Jeff Williams discuss ‘the plan’ on the back deck. Image courtesy of the NOAA Okeanos Explorer Program.http://oceanexplorer.noaa.gov/okeanos/explora-tions/ex1202/logs/hires/mar21-2-hires.jpg
Anchor resting on the top of the Site 15429 wreck. Lophelia coral is also visible. After a great first marine archaeology dive on March 27, everyone was excited about explor-ing a second target. Site 15429 was initially located in 2009 with the National Institute for Undersea Science and Technology’s (NIUST) Ea-gle Ray autonomous underwater vehicle (AUV). The data showed a potential vessel resting on the seafloor. The remotely operated vehicle (ROV) dive confirmed what several members of the Science Team expected. The wreck appears to be a hotspot for Lophelia coral. It was a great day for both the marine archaeologists and the biologists. Image courtesy of NOAA Okeanos Explorer Program.http://oceanexplorer.noaa.gov/okeanos/explorations/ex1202/logs/hires/mar29_hires.jpg
Image of gridded bathymetry shown as a wireframe and draped over gridded backscatter data. Ever since the Team on Leg I of the Gulf of Mexico expedition mapped the DeSoto Canyon area in early March 2012, there was lots of speculation about one specific seafloor feature in approximately 400 meters of water. Not only did the feature seem to be the one spot of sig-nificant relief in an otherwise fairly flat area, but it also showed up in the backscatter data as a very ‘hard’ target. Image courtesy of NOAA Okeanos Explorer Program.http://oceanexplorer.noaa.gov/okeanos/explora-tions/ex1202/logs/hires/mar28_update_hires.jpg
Through the power of technology, scientists on the ship and on shore are able to view and learn about the complex ecosystems in the Gulf of Mexico. Deep-sea corals flourish in the dark depths of the Gulf of Mexico, providing founda-tions that attract lush communities of other animals, including brittle stars, anemones, crabs, and fish. This diversity of life on the seafloor may be out of sight, but it is has been squarely on the minds of scientists seeking to determine the short- and long-term ecologi-cal impacts of the Deepwater Horizon oil spill. Image courtesy of the NOAA Okeanos Explorer Program. http://oceanexplorer.noaa.gov/okeanos/explorations/ex1202/logs/hires/mar24-2-hires.jpg

3
Image captions/credits on Page 2.
www.oceanexplorer.noaa.gov Gulf of Mexico Expedition 2012: How to Use CTD DataGrades 5-12 (Physical Science/Earth Science)
with events at a remote location. Telepresence allows live images to be transmitted from the seafloor to scientists ashore, classrooms, newsrooms and living rooms, and opens new educational opportunities that are a major part of Okeanos Explorer’s mission for the advancement of knowledge. In addition, telepresence makes it possible for shipboard equipment to be controlled by scientists in shore-based Exploration Command Centers (ECCs). In this way, scientific expertise can be brought to the exploration team as soon as discoveries are made, and at a fraction of the cost of traditional oceanographic expeditions.
CTD arrays are a key technological capability aboard the Okeanos Explorer and most other modern ocean research vessels. CTD stands for conductivity, temperature, and depth, and refers to a package of electronic instruments that measure these properties. Conductivity is a measure of how well a solution conducts electricity and is directly related to salinity, which is the concentration of salt and other inorganic compounds in seawater. Salinity is one of the most basicmeasurementsusedbyoceanscientists.Whencombinedwithtemperature data, salinity measurements can be used to determine seawater density, which is a primary driving force for major ocean currents. Often, CTDs are attached to a much larger metal frame called a rosette, which may hold water sampling bottles that are used to collect water at different depths, as well as other sensors that can measure additional physical or chemical properties.
Ocean explorers often use CTD measurements to detect evidence of volcanoes, hydrothermal vents, and other deep-sea features that cause changestothephysicalandchemicalpropertiesofseawater.Massesof changed seawater are called plumes, and are usually found within a few hundred meters of the ocean floor. Since underwater volcanoes and hydrothermal vents may be several thousand meters deep, ocean explorers usually raise and lower a CTD rosette through several hundred meters near the bottom as the ship slowly cruises over the area being surveyed. This repeated up-and-down motion of the towed CTD may resemble the movement of a yo-yo; a resemblance that has led to the nickname “tow-yo” for this type of CTD sampling. See http://oceanexplorer.noaa.gov/technology/tools/sonde_ctd/sondectd.html and http://www.pmel.noaa.gov/vents/PlumeStudies/WhatIsACTD/CTDMethods.html for more information.
Temperature measurements from CTD sensors can be used to detect water temperature anomalies that may indicate the presence of volcanoes or hydrothermal vents. Two other sensors are also important to the search for these deep ocean features. Optical backscatter (OBS) sensors detect the presence of suspended particles that may come from hydrothermal vents or from the oxidation of methane, which causesprecipitatesofcarbonatematerialtoform.Oxidation-ReductionPotential(ORP)sensorsmeasureofthetendencyofasubstanceto
Senior Survey Technician Elaine Stuart works on the CTD while the altimeter battery recharges. Water sampling bottles, which are often attached to the rosette frame, have been removed for tow-yo operations. Sensors are mounted in the lower part of the frame where SST Stuart is working. Image courtesy of NOAA Okeanos Explorer Program.
A CTD with water sampling bottles attached to the rosette frame. Image courtesy of NOAA Okeanos Explorer Program.

4
Image captions/credits on Page 2.
www.oceanexplorer.noaa.gov Gulf of Mexico Expedition 2012: How to Use CTD DataGrades 5-12 (Physical Science/Earth Science)
gainorloseelectrons.ORPismeasuredinvolts,andincreasesdirectlywith the tendency of a substance to gain electrons and become reduced. Because chemosynthetic communities are based on chemical substances that can donate electrons, these chemical substances have atendencytoloseelectrons.SoadropinORPmaysignalthepresenceof chemosynthetic communities nearby.
The Okeanos Explorer is equipped with a Sea Bird SBE-9plus underwater CTD. Besides measuring conductivity, temperature, and depth, up to 8 additional sensors can be added to measure other physical and chemical characteristics. Note: Mention of proprietary names does not imply endorsement by NOAA.
This lesson introduces students to simple analysis of CTD data. In the future, students will have the opportunity to apply their analytic skills to investigate additional information from CTDs as the Okeanos Explorer continues its voyages of discovery in Earth’s deep ocean. The techniques presented in this lesson may be used to complete Okeanos Explorer CTD Supplemental Datasheets, which are linked from the “Education” layer of the Okeanos Explorer Atlas for selected
cruises (http://www.ncddc.noaa.gov/website/google_maps/OkeanosExplorer/mapsOkeanos.htm), as well as from the Education sectionofWebpagesprovidedforthesecruises(http://oceanexplorer.noaa.gov/okeanos/explorations/explorations.html).
Learning Procedure1. To prepare for this lesson,
a. Download an image of a CTD such as http://oceanexplorer.noaa.gov/okeanos/explorations/10index/logs/june27/media/ex_ctd.html.
b.ReviewbackgroundinformationonCTDtechnologyathttp://www.pmel.noaa.gov/vents/PlumeStudies/WhatIsACTD/CTDMethods.html
c.Grades5-8:ReviewproceduresontheCTD Data Collected on Okeanos Explorer Cruise EX1004, Leg 3 Worksheet and, optionally, one or more Okeanos Explorer CTD Supplemental Datasheets.
d.Grades9-12:ReviewproceduresontheIntroduction to CTD Data Worksheet, and, optionally, one or more Okeanos Explorer CTD Supplemental Datasheets. Download the data file EX0904_ctd_1.xls from http://oceanexplorer.noaa.gov/okeanos/edu/resources/media/ex0904_ctd_1.xls, and install it on computers that students willbeusingtocompletetheWorksheetactivity.Alternatively,you may have students download this file onto their own computer systems.
2. Briefly introduce the NOAA Ship Okeanos Explorer, which is the
only U.S. ship whose sole assignment is to systematically explore

5
Image captions/credits on Page 2.
www.oceanexplorer.noaa.gov Gulf of Mexico Expedition 2012: How to Use CTD DataGrades 5-12 (Physical Science/Earth Science)
Earth’s largely unknown ocean for the purposes of discovery and theadvancementofknowledge.Reviewtheoverallstrategyforocean exploration used aboard Okeanos Explorer, and the primary technologies involved with this strategy (discussed above).
Ask students why oceanographers would want to measure conductivity and temperature at certain depth intervals. Be sure students understand the relationship between conductivity and salinity.BrieflydescribeaCTD,emphasizingthatthesedevicesare often capable of measuring many other parameters in addition to conductivity, temperature, and depth. You may want to use information and/or images from http://www.pmel.noaa.gov/vents/PlumeStudies/WhatIsACTD/CTDMethods.html.
Note: Steps 3, and 4 are for Grades 5-8. For Grades 9-12, skip to Step 5.
3. (For Grades 5-8) If students are familiar with the concepts of seawater density, briefly review:•Thedefinitionofdensity;•Therelationshipsbetweentemperature,salinity,pressure,and
density in seawater; and•Themeaningofconductivityanditsrelationshiptosalinity.
Whenthisreviewiscomplete,proceedtoStep4.
If students are not familiar with these concepts, perform the following demonstrations:(a)Whilestudentswatch,dissolve2tablespoonsoftablesaltin
approximately 250 ml of hot tap water. Add three drops of liquid foodcoloring,andstirtomix.Waitatleastthreeminutes.Pourapproximately 400 ml of hot tap water into a clear 500 ml beaker. Hold the beaker so that the water is visible to students, and slowly pour the colored salt water down along the inside wall of the beaker. A shimmering pool of colored water should form on the bottom of the beaker, below the uncolored tap water. Have students record their observations in writing.
(b)Whilestudentswatch,placeapproximately100mloficeintoa container with approximately 150 ml cool tap water. Add three drops of liquid food coloring. Pour approximately 400 ml of hot tap water into a clear 500 ml beaker. Tell students to watch closely as you hold the beaker so that the water is visible to students, and slowly pour the colored ice water down along the inside wall of the beaker. The colored water will flow to the bottom of the beaker and form a layer beneath the warmer water, but will soon disperse into the larger volume of water. Have students record their observations in writing, being sure to include what happened when the colored ice water first flowed
6
Image captions/credits on Page 2.
www.oceanexplorer.noaa.gov Gulf of Mexico Expedition 2012: How to Use CTD DataGrades 5-12 (Physical Science/Earth Science)
into the warmer water.
Remindstudentsthatthedensityofasubstanceisrelatedtoanobject’s mass (how “heavy” it is) and volume (the object’s physical size).Ahandfulofstyrofoam,forexample,weighsmuchlessthana handful of rocks because the density of the styrofoam is less than the density of the rocks. Density is usually defined as “mass per unit volume,” and the density of an object or substance is stated in “grams per cubic centimeter.”
Have students record their inferences about the effect of dissolved
salt on the density of water, and the effect of temperature on thedensityofwater.Whenstudentshavefinishedwriting,leadadiscussion of their inferences. Students should understand that dissolved salt increases the density of water, and that the density of water also increases as temperature decreases. Tell students that in the ocean, density is also affected by water pressure. Since water pressure increases with increasing depth, the density of seawater also increases as depth increases.
4. Show the image of a CTD downloaded in Step 1, and explain that this is actually a collection of several electronic instruments that measure various things about seawater. The basic instruments measure temperature, depth, and conductivity. Tell students that conductivity measures how easily electric currents pass through a liquid, and that electric current passes much more easily through water containing salt than through fresh water. Also say that CTDs actually measure water pressure as a way to measure depth.
Mostofthedeviceseenintheimageisawater-samplingdevicecalled a rosette or carousel, which contains water-sampling bottles that are used to collect water at different depths. Before the CTD is lowered into the ocean, the bottles are opened so that water flows freely through them. As the CTD travels through the water column, scientists can monitor readings from the sensors. If something unusual appears in the measurements, the scientists can send a signal through the CTD cable that closes one or more of the bottles to collect a water sample from the location where the unusual measurements appeared.
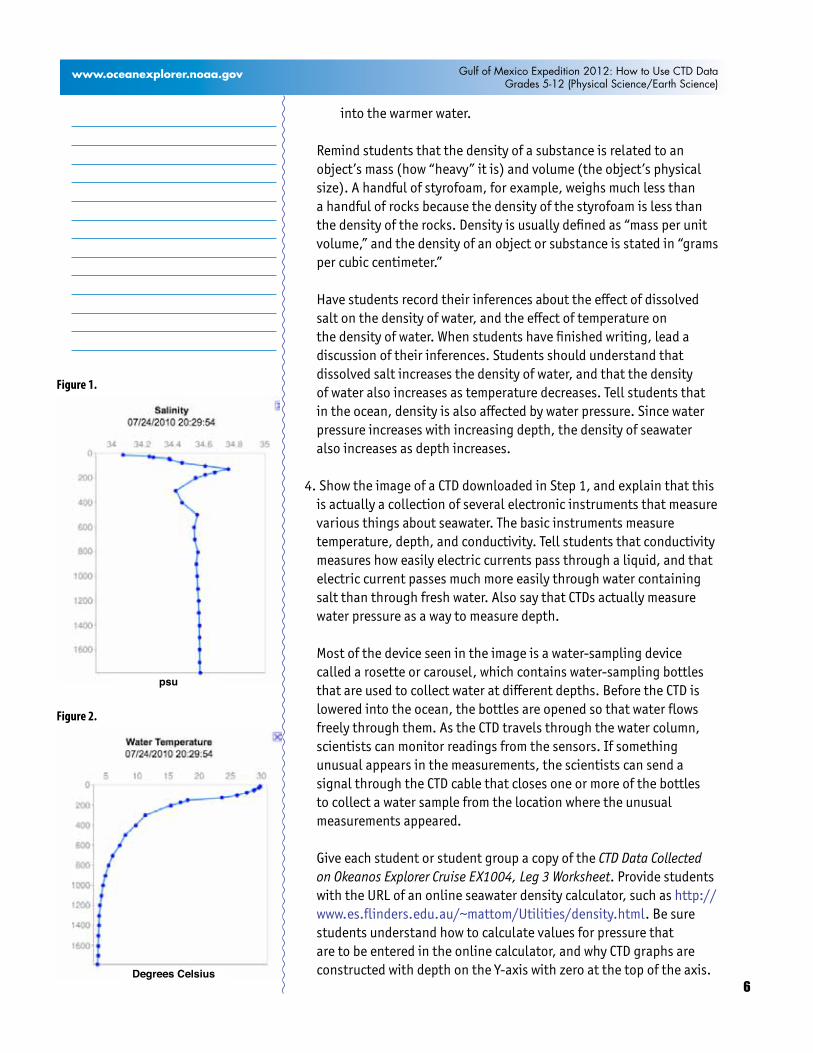
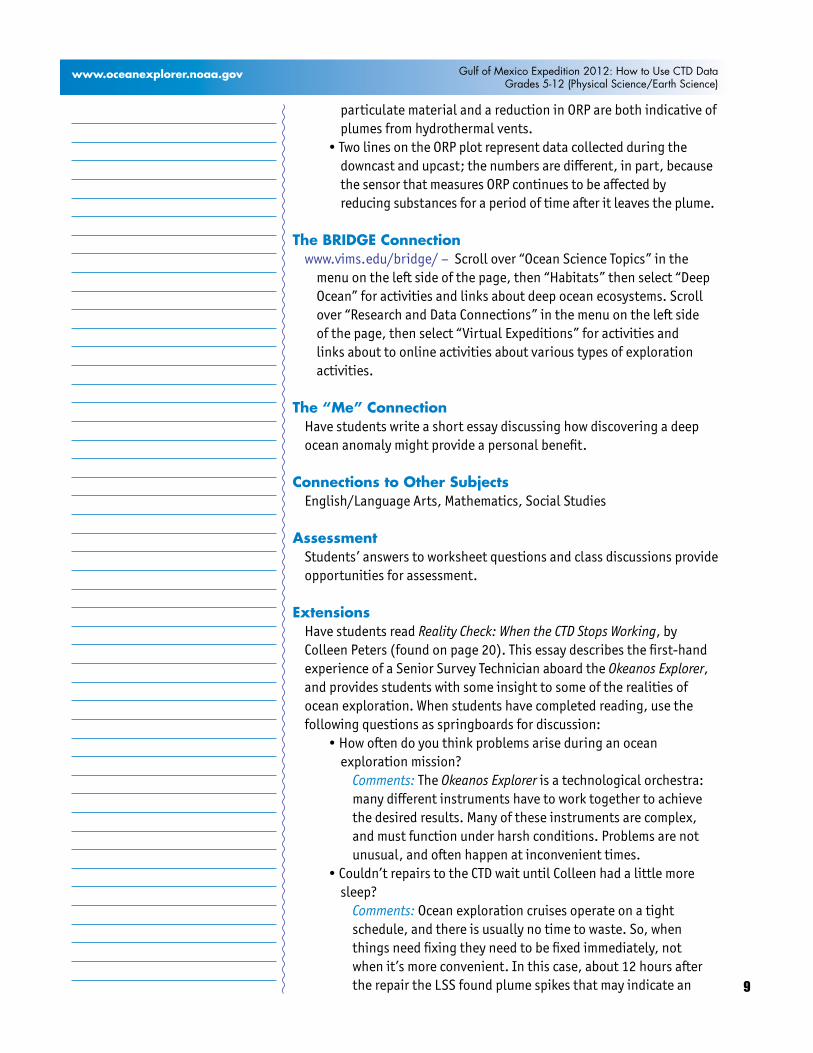
Give each student or student group a copy of the CTD Data Collected on Okeanos Explorer Cruise EX1004, Leg 3 Worksheet. Provide students withtheURLofanonlineseawaterdensitycalculator,suchashttp://www.es.flinders.edu.au/~mattom/Utilities/density.html. Be sure students understand how to calculate values for pressure that are to be entered in the online calculator, and why CTD graphs are constructedwithdepthontheY-axiswithzeroatthetopoftheaxis.
Figure 1.
Figure 2.
psu
Degrees Celsius

7
Image captions/credits on Page 2.
www.oceanexplorer.noaa.gov Gulf of Mexico Expedition 2012: How to Use CTD DataGrades 5-12 (Physical Science/Earth Science)
Whenstudentshavecompletedtheworksheetassignment,leadadiscussion of their results. Students’ graphs should resemble Figures 1 and 2. The discussion should include the following points:•Densitychangedmostrapidlynearthesurface.•Ingeneral,densityincreasesasdepthincreases.•Asdepthincreases,temperatureandsalinitytendtolevelout,
while density continues to increase because pressure continues to increase with increasing depth.
•Ifanunderwaterrobotisneutrallybuoyant,therobotwillsinkifit enters a water mass that has a lower density.
•Ifthewatermasshasagreaterdensity,therobotwillriseuntilitencounters a water mass whose density equals that of the robot.
For additional discussion about how CTDs are used to search for deep-seahydrothermalventsorvolcanoes,seethelesson,“What’saCTD?” [http://oceanexplorer.noaa.gov/okeanos/edu/lessonplans/media/hdwe_56_ctd.pdf]. For Grades 7-8, you may also want to have students complete the simulated analysis of CTD samples described in the lesson, “The Oceanographic Yo-Yo” [http://oceanexplorer.noaa.gov/okeanos/explorations/ex1103/background/edu/media/ex1103_oceanyoyo.pdf].
5.(ForGrades9-12)DiscusshowOBSandORPmaybeaffectedbyhydrothermal vent activity. Tell students that their assignment is to look for anomalies in CTD data collected aboard the Okeanos Explorer in 2009. Provide each student group with a copy of the Introduction to CTD Data Worksheet, and ensure that students have access to the file referenced in Step 1e. Tell students that this activity is intended tofamiliarizethemwithCTDdataandhowtheycanbeanalyzedto find anomalies that may indicate the presence of undiscovered features on the ocean floor. You may also want to mention that this skill will allow them to investigate additional data that will be available from future Okeanos Explorer missions.
6.WhenstudentshaveansweredquestionsontheWorksheet, lead a discussion of their results. This discussion should include:•ThetimerequiredtocompletetheentireCTDcastwas7160
seconds; just under two hours.•ThemaximumdepthrecordedbytheCTDwas2601.255meters.•Studentsshouldnoticethatthemaximumdepthoccurredabout
halfway through the cast; this is because data were recorded during the CTD’s ascent (the “up cast”), as well as during its descent (the “down cast”).
•Students’plotsofOBSandORPshouldresembleFigures3and4,respectively (see page 8).
•PlotsofOBSandORPbothshowanomaliesbetweendepthsof2,000 and 2,500 meters; increased OBS due to precipitates or

8
Image captions/credits on Page 2.
www.oceanexplorer.noaa.gov Gulf of Mexico Expedition 2012: How to Use CTD DataGrades 5-12 (Physical Science/Earth Science)
Figure 4.
Figure 3.
9
Image captions/credits on Page 2.
www.oceanexplorer.noaa.gov Gulf of Mexico Expedition 2012: How to Use CTD DataGrades 5-12 (Physical Science/Earth Science)
particulatematerialandareductioninORParebothindicativeofplumes from hydrothermal vents.
•TwolinesontheORPplotrepresentdatacollectedduringthedowncast and upcast; the numbers are different, in part, because thesensorthatmeasuresORPcontinuestobeaffectedbyreducing substances for a period of time after it leaves the plume.
The BRIDGE Connectionwww.vims.edu/bridge/ – Scroll over “Ocean Science Topics” in the
menu on the left side of the page, then “Habitats” then select “Deep Ocean” for activities and links about deep ocean ecosystems. Scroll over“ResearchandDataConnections”inthemenuontheleftsideofthepage,thenselect“VirtualExpeditions”foractivitiesandlinks about to online activities about various types of exploration activities.
The “Me” ConnectionHave students write a short essay discussing how discovering a deep ocean anomaly might provide a personal benefit.
Connections to Other SubjectsEnglish/LanguageArts,Mathematics,SocialStudies
AssessmentStudents’ answers to worksheet questions and class discussions provide opportunities for assessment.
ExtensionsHave students read Reality Check: When the CTD Stops Working, by Colleen Peters (found on page 20). This essay describes the first-hand experience of a Senior Survey Technician aboard the Okeanos Explorer, and provides students with some insight to some of the realities of oceanexploration.Whenstudentshavecompletedreading,usethefollowing questions as springboards for discussion:
•Howoftendoyouthinkproblemsariseduringanoceanexploration mission? Comments: The Okeanos Explorer is a technological orchestra:
many different instruments have to work together to achieve thedesiredresults.Manyoftheseinstrumentsarecomplex,and must function under harsh conditions. Problems are not unusual, and often happen at inconvenient times.
•Couldn’trepairstotheCTDwaituntilColleenhadalittlemoresleep? Comments: Ocean exploration cruises operate on a tight
schedule, and there is usually no time to waste. So, when things need fixing they need to be fixed immediately, not when it’s more convenient. In this case, about 12 hours after therepairtheLSSfoundplumespikesthatmayindicatean

10
Image captions/credits on Page 2.
www.oceanexplorer.noaa.gov Gulf of Mexico Expedition 2012: How to Use CTD DataGrades 5-12 (Physical Science/Earth Science)
undiscovered hydrothermal vent; and that discovery might have been missed if the repair was delayed!
•HowdidColleenapproachtherepairproblem? Comments: She started by focusing on the most likely source of
trouble—a cable that had already been problematic. She also thought through what she was going to do, so she had a plan. In addition, she was aware that she was tired, so she made a point of not rushing the repair.
•HowhardwasittofixtheCTDproblem? Comments: The repair involved relatively simple technology; somegrease,wirecutters,zipties,andelectricaltape.Similarly, the problem itself was fairly simple; just a cable. But simple things can create big problems; the near-disaster aboard Apollo 13 was caused by a malfunctioning switch that cost a few dollars.
Other Relevant Lesson Plans from NOAA’s Ocean Exploration Program
A Hydrothermal AdVENTure (from the Galapagos Rift 2011 Expedition)http://oceanexplorer.noaa.gov/okeanos/explorations/ex1103/background/edu/media/ex1103_htadvent.pdf
Focus:Hydrothermalvents(LifeScience;Grades5-6)
Students explain the overall structure of hydrothermal vents and how they are related to the motion of tectonic plates, and create a model of a hydrothermal vent.
The Oceanographic Yo-Yo (from the Galapagos Rift 2011 Expedition)http://oceanexplorer.noaa.gov/okeanos/explorations/ex1103/background/edu/media/ex1103_oceanyoyo.pdf
Focus: Using ocean chemistry to locate hydrothermal vents (Physical Science; grades 7-8)
Students explain the effects of hydrothermal vents on chemical and physical parameters of seawater, how oceanographers can use these effects to locate hydrothermal vents, and describe some of the instruments that oceanographers use to detect chemical clues that suggest the presence of hydrothermal vents.

11
Image captions/credits on Page 2.
www.oceanexplorer.noaa.gov Gulf of Mexico Expedition 2012: How to Use CTD DataGrades 5-12 (Physical Science/Earth Science)
Tools of Exploration - CTD (from the INDEX SATAL 2010 Expedition)http://oceanexplorer.noaa.gov/okeanos/explorations/10index/background/edu/media/ctd.pdf
Focus: Technology for deep ocean exploration: CTD (Chemistry/Earth Science; Grades 9-12)
Students will describe typical effects of hydrothermal vents, volcanoes, and cold seeps on chemical and physical parameters of seawater; explain how oceanographers can use CTD data to locate these geologicfeatures;andanalyzedatafromCTDcastsforthepresenceofanomalies.
We’ve Got Plumes! (from the Galapagos Rift 2011 Expedition) http://oceanexplorer.noaa.gov/okeanos/explorations/ex1103/background/edu/media/ex1103_gotplumes.pdf
Focus:HydrothermalVentChemistry(EarthScience/Chemistry;grades9-12)Students describe hydrothermal vents; explain how oxidation reduction potential and light-scattering sensor data may be used to detect the presenceofhydrothermalvents;andanalyzeCTDdatacollectedinthevicinityoftheGalapagosSpreadingCentertorecognizeaprobableplume from hydrothermal activity.
The following lessons are included in the NOAA Ship Okeanos Explorer Education Materials Collection Volume 2: How Do We Explore?
Grades 7-8The Oceanographic Yo-yohttp://oceanexplorer.noaa.gov/okeanos/edu/lessonplans/media/hdwe_78_yoyo.pdf
Focus: Ocean chemistry and hydrothermal vents (Physical Science)
Students explain the effects of hydrothermal vents on chemical and physical parameters of seawater; describe instruments aboard the Okeanos Explorerthatdetecttheseeffects;andanalyzedatafromtheOkeanos Explorer to find chemical clues that suggest the presence of hydrothermal vents.

12
Image captions/credits on Page 2.
www.oceanexplorer.noaa.gov Gulf of Mexico Expedition 2012: How to Use CTD DataGrades 5-12 (Physical Science/Earth Science)
Grades 9-12A Quest for Anomalieshttp://oceanexplorer.noaa.gov/okeanos/edu/lessonplans/media/hdwe_912_anomalies.pdf
Focus: Use of CTD data in ocean exploration (Earth Science/Physical Science/Technology)
Students describe and explain redox potential and optical backscatter, and how these parameters are related to deep-sea ecosystems and geologicfeatures;andanalyzedatafromCTDcastsaboardtheOkeanos Explorer for the presence of anomalies.
Other Resources The Web links below are provided for informational purposes only. Links outside of Ocean Explorer have been checked at the time of this page’s publication, but the linking sites may become outdated or non-operational over time.http://oceanexplorer.noaa.gov/okeanos/edu/welcome.html –Web
page for the Okeanos ExplorerEducationMaterialsCollection
http://www.pmel.noaa.gov/vents/PlumeStudies/WhatIsACTD/CTDMethods.html–WebpageaboutCTDsfromNOAA’sPacificMarineEnvironmentalLaboratory
Correlations to A Framework for K-12 Science Education: Practices, Crosscutting Concepts, and Core Ideas
Framework for K-12 Science EducationDimension 1. Scientific and Engineering Practices
1. Asking questions (for science) and defining problems (for engineering)
2. Developing and using models4.Analyzingandinterpretingdata5. Using mathematics and computational thinking6. Constructing explanations (for science) and designing solutions
(for engineering)7. Engaging in argument from evidence8. Obtaining, evaluating, and communicating information
Dimension 2. Crosscutting Concepts1. Patterns2.Causeandeffect:Mechanismandexplanation3. Scale, proportion, and quantity4. Systems and system models

13
Image captions/credits on Page 2.
www.oceanexplorer.noaa.gov Gulf of Mexico Expedition 2012: How to Use CTD DataGrades 5-12 (Physical Science/Earth Science)
Dimension 3. Disciplinary Core IdeasPhysical SciencesCoreIdeaPS4:WavesandTheirApplicationsinTechnologiesfor
Information Transfer PS4.C: Information Technologies and Instrumentation.
Earth and Space SciencesCore Idea ESS2: Earth’s SystemsESS2.B:PlateTectonicsandLarge-ScaleSystemInteractions
Engineering, Technology, and the Applications of ScienceCoreIdeaETS2:LinksAmongEngineering,Technology,Science,
and Society ETS2.A: Interdependence of Science, Engineering, and
Technology
Correlations to Common Core State Standards for MathematicsGrade 5 - Geometry: Graph points on the coordinate plane to
solve real-world and mathematical problems.
HighSchool:Modeling
Correlations to Common Core State Standards for English Language Arts
Grades6-12LiteracyinHistory/SocialStudies,Science,&Technical Subjects: Follow precisely a multistep procedure when carrying out experiments, taking measurements, or performing technical tasks.
Ocean Literacy Essential Principles and Fundamental ConceptsEssential Principle 5. The ocean supports a great diversity of life and ecosystems.
Fundamental Concept f. Ocean habitats are defined by environmental factors. Due to interactions of abiotic factors such as salinity, temperature, oxygen, pH, light, nutrients, pressure, substrate and circulation, ocean life is not evenly distributed temporally or spatially, i.e., it is “patchy”. Some regions of the ocean support more diverse and abundant life than anywhere on Earth, while much of the ocean is considered a desert.
Fundamental Concept g. There are deep ocean ecosystems that are independent of energy from sunlight and photosynthetic organisms. Hydrothermal vents, submarine hot springs, and methane cold seeps rely only on chemical energy and chemosynthetic organisms to support life.
Essential Principle 7. The ocean is largely unexplored.
Fundamental Concept a. The ocean is the last and largest unexplored place on Earth—less than 5% of it has been explored. This is the great frontier for the next generation’s explorers and

14
Image captions/credits on Page 2.
www.oceanexplorer.noaa.gov Gulf of Mexico Expedition 2012: How to Use CTD DataGrades 5-12 (Physical Science/Earth Science)
researchers, where they will find great opportunities for inquiry and investigation.
Fundamental Concept b. Understanding the ocean is more than a matter of curiosity. Exploration, inquiry and study are required to better understand ocean systems and processes.
Fundamental Concept d. New technologies, sensors and tools are expanding our ability to explore the ocean. Ocean scientists are relying more and more on satellites, drifters, buoys, subsea observatories and unmanned submersibles.
Fundamental Concept f. Ocean exploration is truly interdisciplinary. It requires close collaboration among biologists, chemists, climatologists, computer programmers, engineers, geologists, meteorologists, and physicists, and new ways of thinking.
Send Us Your FeedbackIn addition to consultation with expedition scientists, the development of lesson plans and other education products is guided by comments and suggestions from educators and others who use these materials. Please send questions and comments about these materials to: [email protected].
For More InformationPaula Keener, Director, Education Programs NOAAOfficeofOceanExplorationandResearchHollingsMarineLaboratory331FortJohnsonRoad,CharlestonSC29412843.762.8818 843.762.8737 (fax) [email protected]
AcknowledgementsThis lesson was developed and written for NOAA’s Office of Ocean ExplorationandResearch(OER)byDr.MelGoodwin,ScienceandTechnologyConsultanttoOER’sEducationTeam.Design/layout:CoastalImagesGraphicDesign,Mt.Pleasant,SC.
CreditIf reproducing this lesson, please cite NOAA as the source, and provide thefollowingURL:http://oceanexplorer.noaa.gov

15
Image captions/credits on Page 2.
Gulf of Mexico Expedition 2012: How to Use CTD DataGrades 5-12 (Physical Science/Earth Science)
www.oceanexplorer.noaa.gov
CTD Data Collected on Okeanos Explorer Cruise EX1004
Leg 3 Worksheet (Grades 5-6)
These data are from a CTD cast made aboard the Okeanos Explorer onJuly24,2010,aspartoftheINDEX-SATAL2010Expedition.
1.Makeagraphofsalinityanddepth.PutdepthontheY-axisofeachgraph,andputzeroattheTOPoftheY-axis.Oceanographers like to plot CTD data with depth on the y-axis and the greatest depths at the bottom of the plot, since that is the way we usually think about a profile of the water column.
2.Makeagraphoftemperatureanddepth,withdepthontheY-axis as in Step 1.
3. Use an online calculator to find the density of seawater at each depth. These calculators require you to enter values of pressure as well as temperature and salinity. Pressure in the ocean (in bars) is nearly equal to the depth in meters divided by 10 (in other words, for every 1 m increase in depth, pressure increases 0.1 bar). Pressure at the ocean surface (depth = 0 m) is equal to 1 bar, so pressure underwater is equal to
[(depth in meters) ÷ 10] + 1.0
4.Wherediddensitychangemostrapidly?
5. In general, what happens to density as depth increases?
6. How do changes in density with increasing depth differ from changes in temperature and salinity with increasing depth?
7. If an underwater robot is neutrally buoyant (that is, it does not rise or sink in the water column) at a certain depth, what will happen if the robot enters a water mass that has a lower density?
8.Whatwillhappenifthewatermasshasagreaterdensity?
CTD DataDepth Temperature Salinity Density(m) (°C) (psu)* (g/cm3)20 29.5 34.15 _________40 28.5 34.24 _________60 28.5 34.25 _________80 27.0 34.35 _________100 25.5 34.45 _________125 24.0 34.60 _________150 23.5 34.76 _________175 18.0 34.65 _________200 16.5 34.60 _________220 15.0 34.54 _________320 11.5 34.40 _________420 10.0 34.46 _________520 8.0 34.55 _________620 7.0 34.52 _________720 6.0 34.53 _________820 5.5 34.56 _________920 5.0 34.54 _________1050 4.5 34.55 _________1150 4.5 34.56 _________1250 4.5 34.57 _________1350 4.0 34.57 _________1450 4.0 34.58 _________1550 4.0 34.58 _________1650 4.0 34.58 _________1750 4.0 34.58 _________1800 4.0 34.59 _________
* Salinity is measured by conductivity (how easily electricity flows through a seawater sample). The software used to process conductivity data from the Okeanos Explorer’s CTD converts the conductivity measurement to salinity values in practical salinity units (psu). Before psu was adopted as a standard unit, salinity was measured in parts-per-thousand (abbreviated ppt or o/oo), and you still may see references to these units, which are almost the same as psu.

16
Image captions/credits on Page 2.
Gulf of Mexico Expedition 2012: How to Use CTD DataGrades 5-12 (Physical Science/Earth Science)
www.oceanexplorer.noaa.gov
Educator’s ReferenceCompleted CTD Data Table
Depth Temperature Salinity Density(m) (°C) (psu)* (g/cm3)20 29.5 34.15 1.02140 28.5 34.24 1.02260 28.5 34.25 1.02280 27.0 34.35 1.023100 25.5 34.45 1.023125 24.0 34.60 1.024150 23.5 34.76 1.024175 18.0 34.65 1.026200 16.5 34.60 1.026220 15.0 34.54 1.027320 11.5 34.40 1.028420 10.0 34.46 1.028520 8.0 34.55 1.029620 7.0 34.52 1.030720 6.0 34.53 1.030820 5.5 34.56 1.031920 5.0 34.54 1.0321050 4.5 34.55 1.0321150 4.5 34.56 1.0331250 4.5 34.57 1.0331350 4.0 34.57 1.0341450 4.0 34.58 1.0341550 4.0 34.58 1.0351650 4.0 34.58 1.0351750 4.0 34.58 1.0351800 4.0 34.59 1.036

17
Image captions/credits on Page 2.
Gulf of Mexico Expedition 2012: How to Use CTD DataGrades 5-12 (Physical Science/Earth Science)
www.oceanexplorer.noaa.gov
Introduction to CTD Data Worksheet
Figure A.
NOTE: The following instructions are for Microsoft Excel®2008. Other versions of Excel or other spreadsheets will require slightly different procedures. See user documentation for how to import text files and make graphs from these files. If you have difficulty opening the file referenced in Step 1 and are using an older version of Excel®, you may need the Office Compatibility Pack. This can be downloaded from: http://www.microsoft.com/download/en/details.aspx?displaylang=en&id=3. If you would like to open the file in a newer version of Excel, be sure that you have turned on “Compatibility Mode”. If you only want to look at Excel® files, you may want to try the Excel® Viewer (http://www.microsoft.com/download/en/details.aspx?id=10), but this will not allow you to graph or edit the data.
1.Openthe“CTDdata.xlsx”fileinMicrosoftExcel®.Thesedatawerecollectedduring a CTD cast aboard the Okeanos Explorer on June 8, 2009. The first rowshowsthecontentsofeachcolumn:Dataandtime;Latitudeindecimaldegrees;Longitudeindecimaldegrees;Elapsedtimesincethestartofthecast in seconds; Depth in meters; Temperature in °C; Conductivity in Siemens per meter; Salinity in Practical Salinity Units; Optical Backscatter (OBS); and Oxidation-ReductionPotential(ORP).TheunitsofOBSandORParen’treallyimportant, because we are only concerned with finding readings that are distinctly different from other readings near the same depth (anomalies).
2. How much time was needed to complete the entire CTD cast?3.WhatwasthemaximumdepthrecordedbytheCTD?4. Plot OBS as a function of Depth:
a. Select the Depth and OBS columnsb. Under the “Insert” menu select “Chart...” A pop-up menu will appear.c. In the popup menu, click on the “XY (Scatter)” tab.d.Clickonthe“SmoothedLineScatter”button.Nowyoushouldhavea
graph that resembles Figure A.

18
Image captions/credits on Page 2.
Gulf of Mexico Expedition 2012: How to Use CTD DataGrades 5-12 (Physical Science/Earth Science)
www.oceanexplorer.noaa.gov
5. Oceanographers like to plot CTD data with depth on the y-axis and the greatest depths at the bottom of the plot, since that is the way we usually think about a profile of the water column. For a x-y plot, Excel plots the first column on the x-axis. So, to make an “oceanographer’s plot” we need to re-arrange the data so that temperature values come before depth values. a.SelecttheOBScolumnandtheDepthcolumntotheRIGHTofthe
Temperature column.b.Clickonthe“SmoothedLineScatter”button(the“XY(Scatter)”tab
should still be selected). Now you should have a graph that resembles Figure B.
Figure B.

19
Image captions/credits on Page 2.
Gulf of Mexico Expedition 2012: How to Use CTD DataGrades 5-12 (Physical Science/Earth Science)
www.oceanexplorer.noaa.gov
c. To make the greatest depths appear at the bottom of the plot, double click on the y-axis. The “Format Axis” window will appear. Click the “Scale” buttonontheleftsideofthewindow,thencheckthe“ValuesinReverseOrder” box, then click “OK.” Now your graph should resemble Figure C.
Figure C.
20
Image captions/credits on Page 2.
Gulf of Mexico Expedition 2012: How to Use CTD DataGrades 5-12 (Physical Science/Earth Science)
www.oceanexplorer.noaa.gov
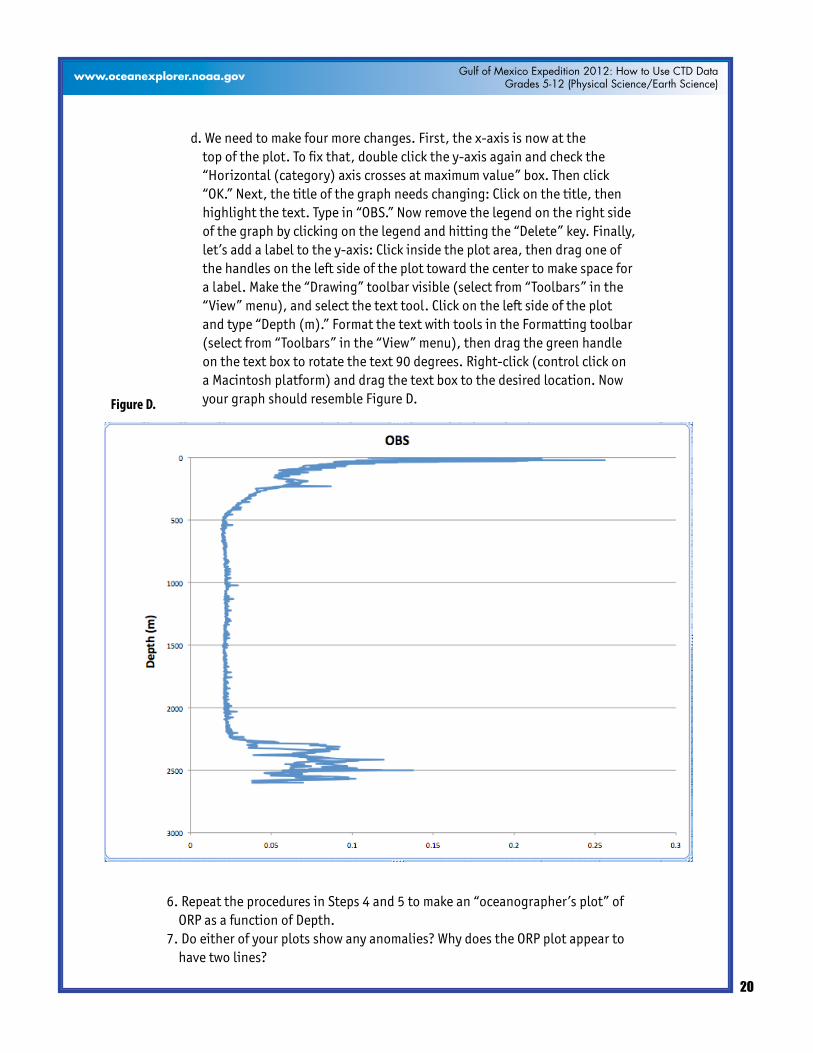
d.Weneedtomakefourmorechanges.First,thex-axisisnowatthetop of the plot. To fix that, double click the y-axis again and check the “Horizontal(category)axiscrossesatmaximumvalue”box.Thenclick“OK.” Next, the title of the graph needs changing: Click on the title, then highlight the text. Type in “OBS.” Now remove the legend on the right side of the graph by clicking on the legend and hitting the “Delete” key. Finally, let’s add a label to the y-axis: Click inside the plot area, then drag one of the handles on the left side of the plot toward the center to make space for alabel.Makethe“Drawing”toolbarvisible(selectfrom“Toolbars”inthe“View”menu),andselectthetexttool.Clickontheleftsideoftheplotand type “Depth (m).” Format the text with tools in the Formatting toolbar (selectfrom“Toolbars”inthe“View”menu),thendragthegreenhandleonthetextboxtorotatethetext90degrees.Right-click(controlclickonaMacintoshplatform)anddragthetextboxtothedesiredlocation.Nowyour graph should resemble Figure D.
6.RepeattheproceduresinSteps4and5tomakean“oceanographer’splot”ofORPasafunctionofDepth.
7.Doeitherofyourplotsshowanyanomalies?WhydoestheORPplotappeartohave two lines?
Figure D.
21
Image captions/credits on Page 2.
Gulf of Mexico Expedition 2012: How to Use CTD DataGrades 5-12 (Physical Science/Earth Science)
www.oceanexplorer.noaa.gov
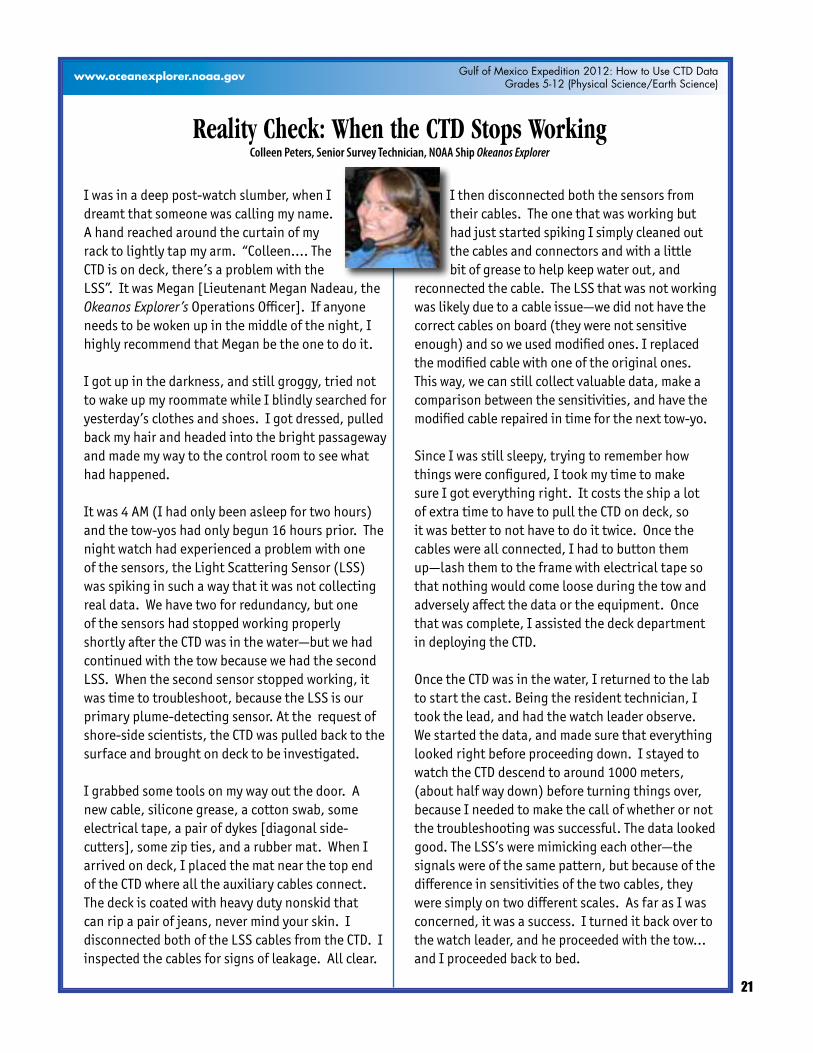
I was in a deep post-watch slumber, when I dreamt that someone was calling my name. A hand reached around the curtain of my rack to lightly tap my arm. “Colleen…. The CTD is on deck, there’s a problem with the LSS”.ItwasMegan[LieutenantMeganNadeau,theOkeanos Explorer’s Operations Officer]. If anyone needs to be woken up in the middle of the night, I highlyrecommendthatMeganbetheonetodoit.
I got up in the darkness, and still groggy, tried not to wake up my roommate while I blindly searched for yesterday’s clothes and shoes. I got dressed, pulled back my hair and headed into the bright passageway and made my way to the control room to see what had happened.
Itwas4AM(Ihadonlybeenasleepfortwohours)and the tow-yos had only begun 16 hours prior. The night watch had experienced a problem with one ofthesensors,theLightScatteringSensor(LSS)was spiking in such a way that it was not collecting realdata.Wehavetwoforredundancy,butoneof the sensors had stopped working properly shortly after the CTD was in the water—but we had continued with the tow because we had the second LSS.Whenthesecondsensorstoppedworking,itwastimetotroubleshoot,becausetheLSSisourprimary plume-detecting sensor. At the request of shore-side scientists, the CTD was pulled back to the surface and brought on deck to be investigated.
I grabbed some tools on my way out the door. A new cable, silicone grease, a cotton swab, some electrical tape, a pair of dykes [diagonal side-cutters],somezipties,andarubbermat.WhenIarrived on deck, I placed the mat near the top end of the CTD where all the auxiliary cables connect. The deck is coated with heavy duty nonskid that can rip a pair of jeans, never mind your skin. I disconnectedbothoftheLSScablesfromtheCTD.Iinspected the cables for signs of leakage. All clear.
I then disconnected both the sensors from their cables. The one that was working but had just started spiking I simply cleaned out the cables and connectors and with a little bit of grease to help keep water out, and
reconnectedthecable.TheLSSthatwasnotworkingwas likely due to a cable issue—we did not have the correct cables on board (they were not sensitive enough) and so we used modified ones. I replaced the modified cable with one of the original ones. This way, we can still collect valuable data, make a comparison between the sensitivities, and have the modified cable repaired in time for the next tow-yo.
Since I was still sleepy, trying to remember how things were configured, I took my time to make sure I got everything right. It costs the ship a lot of extra time to have to pull the CTD on deck, so it was better to not have to do it twice. Once the cables were all connected, I had to button them up—lash them to the frame with electrical tape so that nothing would come loose during the tow and adversely affect the data or the equipment. Once that was complete, I assisted the deck department in deploying the CTD.
Once the CTD was in the water, I returned to the lab to start the cast. Being the resident technician, I took the lead, and had the watch leader observe. Westartedthedata,andmadesurethateverythinglooked right before proceeding down. I stayed to watch the CTD descend to around 1000 meters, (about half way down) before turning things over, because I needed to make the call of whether or not the troubleshooting was successful. The data looked good.TheLSS’sweremimickingeachother—thesignals were of the same pattern, but because of the difference in sensitivities of the two cables, they were simply on two different scales. As far as I was concerned, it was a success. I turned it back over to the watch leader, and he proceeded with the tow… and I proceeded back to bed.
Reality Check: When the CTD Stops WorkingColleen Peters, Senior Survey Technician, NOAA Ship Okeanos Explorer