how to use gprs statistics
DESCRIPTION
How to Use GPRS StatisticsTRANSCRIPT

How to use
GSR7/8 E/GPRS Statistics
Author/Editor:Bernd [email protected] Performance Group ViennaCustomer Systems Introduction and Support
Date: Wednesday, 23. Mai 2005Document version: 1.0Status: Released
Abstract:The evaluation of performance and the detection, analysis and optimisation of performance problems in E/GPRS networks is complex and difficult compared to the GSM world. A range of BSS statistics have been developed and provided by Motorola and with every GSM System Release they get more evolved and powerful.
This document is intended to help understanding, in which areas and situation which E/GPRS BSS statistic can be useful and what purpose they actually serve. It provides detailed information on most BSS E/GPRS raw and key statistics as well as an overview section, which contains a ranking formula and selected key stats to quickly get a performance overview over a set of cells.
This document is targeted for GSR versions 1740, 1760 and 1800.
Motorola Confidential Proprietary
This document and the information contained in it is CONFIDENTIAL INFORMATION of Motorola, and shall not be used, published, disclosed, or disseminated outside Motorola in whole or in part without Motorola´s consent. This document contains trade secrets of Motorola.
Reverse engineering of any or all of the information in this document is prohibited. The copyright notice does not imply publication of the document

GSD CSISHow to use E/GPRS Statistics
SIGN-OFF FORM
Author Bernd Brantner signature Date 23.05.2005
Revised signature Date
Revised signature Date
HISTORY OF REVISIONS
Revision Date Author Revised by Changes Description
0.1 01.03.2005 Bernd Brantner Initial draft
0.2 18.03.2005 Bernd Brantner Added several stats and charts.
0.3 23.03.2005 Bernd Brantner Added ranking formula
0.4 30.03.2005 Bernd Brantner SPG internal review
0.6 14.04.2005 Bernd Brantner various Included review comments
1.0 23.05.2005 Bernd Brantner released
System Performance Group Vienna Page 2/137Motorola Confidential Proprietary

GSD CSISHow to use E/GPRS Statistics
Table of Content1 GPRS Statistics – Scope and Limitations..........................................................................8
1.1 Scope......................................................................................................................... 81.2 Stats Limitations........................................................................................................ 9
1.2.1 Statistical Confidence..................................................................................101.2.2 Detecting a performance change..................................................................101.2.3 Minimum pegging........................................................................................ 11
1.3 Other methods of problem investigation & optimisation..........................................122 Statistics Overview.......................................................................................................... 13
2.1 Ranking................................................................................................................... 132.2 Health Key Statistics...............................................................................................15
3 Statistics Deep Dive........................................................................................................ 163.1 Accessibility – TBF Establishment..........................................................................17
3.1.1 Paging.......................................................................................................... 183.1.1.1 ACCESS_PER_PCH...................................................................................183.1.1.2 ACCESS_PER_PPCH.................................................................................193.1.1.3 PCH_Q_PAGE_DISCARD.........................................................................193.1.1.4 PPCH_Q_PAGE_DISCARD.......................................................................203.1.1.5 GPRS_PAGING_OVERFLOW_RATE.......................................................20
3.1.2 RACH.......................................................................................................... 203.1.2.1 GPRS_RACH_ARRIVAL...........................................................................213.1.2.2 G_RACH_UNSVCD_BTS..........................................................................21
3.1.3 TBF establishment.......................................................................................223.1.3.1 CHANNEL_REQS – Two-phase, one-phase, enhanced one-phase access. . .23
3.1.3.1.1 Received................................................................................................ 233.1.3.1.2 Success................................................................................................... 243.1.3.1.3 Reject..................................................................................................... 253.1.3.1.4 Unserviced............................................................................................. 26
3.1.3.2 UL_CHANNEL_REQUESTS_UNSERVICED_RATE...............................263.1.3.3 GPRS_PRR_BLK_USG – optimised two-phase access...............................27
3.1.3.3.1 Dynamic PRR block allocation for two-phase access.............................273.1.3.3.2 GPRS_PRR_BLK_USG.........................................................................29
3.1.3.4 UL_CHANNEL_REQS_UNSVCE_1ST_PHASE_OPT_2PHASE_RATE. 293.1.3.5 UL_CHANNEL_REQUESTS_SUCCESS_RATE.......................................303.1.3.6 UL_CHANNEL_REQUESTS_REJECTION_RATE...................................32
3.1.4 Channel Established.....................................................................................333.1.4.1 PDTCH_SEIZURE...................................................................................... 333.1.4.2 UL_TBF_SUCCESS_RATE.......................................................................333.1.4.3 DL_TBF_SUCCESS_RATE.......................................................................34
3.2 Throughput.............................................................................................................. 363.2.1 User Throughput Statistics...........................................................................36
3.2.1.1 MEAN_USER_THROUGHPUT_PER_TIMESLOT...................................363.2.1.2 THROUGHPUT_PER_TERMINAL_TYPE................................................40
3.2.2 Packet Loss.................................................................................................. 423.2.2.1 Cell reselection / LLC discard mechanism...................................................423.2.2.2 BVC buffer overflow...................................................................................433.2.2.3 Bad RF conditions........................................................................................ 44
System Performance Group Vienna Page 3/137Motorola Confidential Proprietary

GSD CSISHow to use E/GPRS Statistics
3.2.2.4 Out of sequence GTP packet arrival.............................................................443.2.2.5 PDU lifetime................................................................................................ 443.2.2.6 BSSGP General Protocol Error Handling.....................................................443.2.2.7 Gi Interface.................................................................................................. 443.2.2.8 Gb Interface (Frame Relay)..........................................................................443.2.2.9 SGSN Node processing capacity..................................................................45
3.2.3 RLC Efficiency............................................................................................ 453.2.3.1 Retransmissions on RLC layer.....................................................................46
3.2.3.1.1 Pre-emptive retransmissions...................................................................463.2.3.1.2 RLC block loss....................................................................................... 463.2.3.1.3 RLC transmit window stalls...................................................................46
3.2.3.2 Short TBFs - Blocks per TBF......................................................................463.2.3.3 SCT blocks.................................................................................................. 483.2.3.4 Auto Downlink blocks.................................................................................48
3.2.4 Bandwidth Reduction...................................................................................493.2.4.1 PDCH Reduction.........................................................................................493.2.4.2 TBF Interleaving.......................................................................................... 493.2.4.3 Coding Scheme Demotion...........................................................................50
3.2.5 Abnormal TBF Releases..............................................................................503.2.6 Short TBFs................................................................................................... 50
3.3 Traffic..................................................................................................................... 513.3.1 RLC_BLKS and RADIO_BLKS..................................................................51
3.3.1.1 The anatomy of block statistics....................................................................533.3.2 RLC Control blocks.....................................................................................55
3.3.2.1 AIR_DL_CONTROL_BLKS.......................................................................563.3.2.2 AIR_UL_CONTROL_BLKS.......................................................................56
3.3.3 LLC Frames................................................................................................. 563.3.3.1 DL_LLC_FRAMES_GB.............................................................................563.3.3.2 DL_LLC_FRAMES_PCU...........................................................................573.3.3.3 UL_LLC_FRAMES..................................................................................... 583.3.3.4 USER_TRAFFIC_VOLUME......................................................................583.3.3.5 MEAN_USER_TRAFFIC_PER_TBF.........................................................603.3.3.6 LLC_TRAFFIC_VOLUME_INDICATOR..................................................61
3.3.4 Discarded Data............................................................................................. 623.3.4.1 PDU_DISCARD_FR...................................................................................623.3.4.2 PDU_DISCARD_LLC.................................................................................633.3.4.3 LLC_ABNORMAL_TBF_RELEASE_RATE.............................................643.3.4.4 LLC_BUFFER_OVERFLOW_RATE.........................................................653.3.4.5 LLC_DISCARDS_ON_CELL_RESELECTION.........................................65
3.3.5 TBF Failures................................................................................................ 663.3.5.1 AIR_DL_TBF_FAILURES.........................................................................663.3.5.2 AIR_UL_TBF_FAILURES.........................................................................713.3.5.3 TBF_FAILURE_RATE...............................................................................73
3.3.6 DL_RLC_MAC_WINDOW_STALL..........................................................743.3.7 Length of TBFs............................................................................................ 77
3.3.7.1 TBF_TIME statistics.................................................................................... 773.3.7.2 MEAN_TBF_DURATION..........................................................................79
3.4 Utilisation................................................................................................................ 80
System Performance Group Vienna Page 4/137Motorola Confidential Proprietary

GSD CSISHow to use E/GPRS Statistics
3.4.1 Gb Interface Utilisation................................................................................803.4.2 PCU Utilisation............................................................................................ 80
3.4.2.1 PRP_LOAD................................................................................................. 813.4.3 PDCH Utilisation/Congestion......................................................................82
3.4.3.1 Soft congestion............................................................................................823.4.3.2 Hard congestion........................................................................................... 833.4.3.3 AVAIL_PDTCH.......................................................................................... 833.4.3.4 BUSY_PDTCH............................................................................................ 843.4.3.5 DOWNLINK_BIAS..................................................................................... 843.4.3.6 PDTCH_UTILISATION_BY_ALLOCATION...........................................863.4.3.7 PDTCH_UTILISATION_BY_TRAFFIC....................................................863.4.3.8 PDTCH_UTILISATION_PER_TERMINAL_TYPE...................................873.4.3.9 TERMINAL_TYPE_ACTIVITY.................................................................883.4.3.10 PDTCH_CONGESTION.........................................................................893.4.3.11 GPRS_CELL_CONGESTION.................................................................903.4.3.12 CELL_CONGESTION_TIME.................................................................913.4.3.13 TBF_INTERLEAVING_ACTIVITY.......................................................923.4.3.14 TBF_SESSIONS...................................................................................... 933.4.3.15 CONG_REL_DL_SCTS..........................................................................933.4.3.16 NO_PDTCH_AVAIL..............................................................................943.4.3.17 NO_PDTCH_AVAIL_TIME...................................................................943.4.3.18 CHANNELS_SWITCHED......................................................................953.4.3.19 GPRS_32K_NOT_AVAIL......................................................................963.4.3.20 EGPRS_64K_NOT_AVAIL....................................................................963.4.3.21 TBF_DROP_RATE_ON_PACCH_LOST...............................................96
3.4.4 Coding Scheme Utilisation...........................................................................973.4.4.1 CS12_ON_32K_CHAN...............................................................................973.4.4.2 CS1234_ON_64K_CHAN...........................................................................973.4.4.3 CODING_SCHEME_CHANGE..................................................................98
3.4.5 RLC/MAC Efficiency..................................................................................993.4.5.1 RLC_MAC_OVERHEAD...........................................................................99
3.5 Radio Quality........................................................................................................ 1013.5.1 BLER statistics..........................................................................................101
3.5.1.1 DL_BLER.................................................................................................. 1013.5.1.2 Per Carrier BLER statistics........................................................................102
3.5.2 Coding Scheme Usage...............................................................................1033.5.2.1 CS_USAGE............................................................................................... 1033.5.2.2 MCS_USAGE............................................................................................ 1053.5.2.3 BANDWIDTH_INDICATOR....................................................................108
3.6 Mobility................................................................................................................. 1123.6.1 NCCR........................................................................................................ 112
3.6.1.1 NCC_CELL_RESELECTION_SUCCESS_RATE....................................1123.6.2 SCR........................................................................................................... 1133.6.3 NACC........................................................................................................ 113
3.7 Performance of Higher Layers...............................................................................1134 Feature Related Statistics............................................................................................... 114
4.1 Quality of Service statistics (R4)...........................................................................114TIMER_EXP_PAP_CONV........................................................................................... 114
System Performance Group Vienna Page 5/137Motorola Confidential Proprietary

GSD CSISHow to use E/GPRS Statistics
PFC_ADMISSION........................................................................................................ 114PFC_ADMISSION_OTHER......................................................................................... 115PFC_REJECTION........................................................................................................ 116PFC_REJECTION_OTHER.......................................................................................... 116PFC_REJECT_CAUSES............................................................................................... 117DL_LLC_DATA_VOLUME........................................................................................118UL_LLC_DATA_VOLUME........................................................................................119PFC_UPGRADE........................................................................................................... 120PFC_DOWNGRADE_SUCCESS.................................................................................120PFC_DOWNGRADE_FAILURE.................................................................................121PFC_PREEMPTIONS................................................................................................... 122PFC_REJ_DGRD_PRMPT_PRP..................................................................................122PFC_REJ_DGRD_PRMPT_CELL................................................................................124PDU_DISCARD_LLC.................................................................................................. 125
4.2 VersaTRAU statistics............................................................................................126UL_EGPRS_BACKHAUL_USED...............................................................................126DL_EGPRS_BACKHAUL_ USED..............................................................................127UL_EGPRS_BACKHAUL_DEMAND.........................................................................127DL_EGPRS_BACKHAUL_DEMAND.........................................................................128EGPRS_64K_CHANNEL_WIDTH..............................................................................129
Appendix A – List of GPRS raw statistics.............................................................................132Appendix B – List of GPRS Key Statistics............................................................................134Appendix C – References...................................................................................................... 135Appendix D – Abbreviations................................................................................................. 137
Table of FiguresFigure 1 - Formula of standard deviation................................................................................10Figure 2 - Detecting a change, half hour values.......................................................................10Figure 3 - Detecting a change, daily values.............................................................................11Figure 4 – Uplink TBF establishment (one-phase access).......................................................17Figure 5 – Downlink TBF establishment (MS in standby mode).............................................17Figure 6 – Ladder diagram: Successful uplink TBF establishment..........................................23Figure 7 - Table: Types of channel requests statistics..............................................................23Figure 8 – Two-phase access procedure without reserved PRR blocks....................................28Figure 9 – Two-phase access procedure with reserved PRR blocks.........................................28Figure 10 - Number of reserved PRR blocks as function of RACH Arrival Rate.....................28Figure 11 - Max. RLC Throughput per Coding Scheme and Timeslot....................................37Figure 12 – Correlation Chart: DL Mean User Throughput per TS vs. DL PDTCH Utilisation
by Traffic (16k-TRAU only)........................................................................................... 38Figure 13 - BVC Buffer Overflow..........................................................................................43Figure 14- Correlation Chart: DL Bandwidth Indicator vs. DL Mean TBF Duration...............47Figure 15 - Correlation Chart: DL CS-1 Usage vs. DL Mean TBF Duration...........................48Figure 16 - DL Radio Blocks vs. DL RLC blocks...................................................................54Figure 17 - Mean DL TBF Radio Blocks per TBF vs DL TBF Duration.................................55Figure 18 - DL TBF Establishment when on the PDTCH.......................................................68Figure 19 - DL TBF Establishment when not on the PDTCH, but PCTA is current................69
System Performance Group Vienna Page 6/137Motorola Confidential Proprietary

GSD CSISHow to use E/GPRS Statistics
Figure 20 - DL TBF Establishment when no on PDTCH, PCTA is needed.............................70Figure 21 - UL TBF Establishment – one phase access...........................................................72Figure 22 - UL TBF Establishment – two phase access...........................................................73Figure 23 - Analysis of DL RLC/MAC Window Stalls...........................................................76Figure 24 - Mapping between timeslots pending service and PRP load...................................81Figure 25 - PRP load range..................................................................................................... 81Figure 26 - Bin ranges for GPRS_CELL_CONGESTION......................................................90Figure 27 - Formula of GPRS_CELL_CONGESTION...........................................................91Figure 28 - Formula of Cell Availability.................................................................................93Figure 29 – CODING_SCHEME_CHANGE bins...................................................................98Figure 30 - RLC block sizes in relation to coding scheme.....................................................108Figure 31 – TIMER_EXP_PAP_CONV Statistic Specification.............................................114Figure 32 - PFC_ADMISSION Statistics Specification.........................................................115Figure 33 - PFC_ADMISSION_OTHER Statistics Specification..........................................116Figure 34 – PFC_REJECTION Statistics Specification.........................................................116Figure 35 – PFC_REJECTION _OTHER Statistics .Specification........................................117Figure 36 – PFC_REJECT_CAUSES Statistics Specification...............................................118Figure 37 – DL_LLC_DATA_VOLUME Statistics Specification.........................................119Figure 38 – UL_LLC_DATA_VOLUME Statistics Specification.........................................120Figure 39 - PFC_UPGRADE Statistics Specification............................................................120Figure 40 - PFC_DOWNGRADE_SUCCESS Statistic Specification....................................121Figure 41 - PFC_DOWNGRADE_FAILURE Statistic Specification....................................122Figure 42 - PFC_PREMEPTIONS Statistics Specification....................................................122Figure 43- PFC_REJ_DGRD_PRMPT_PRP Statistics Specification....................................124Figure 44 - PFC_REJ_DGRD_PRMPT_CELL Statistics Specification.................................125Figure 45 - UL_EGPRS_BACKHAUL_USED.....................................................................127Figure 46 - DL_EGPRS_BACKHAUL_USED.....................................................................127Figure 47 - UL_EGPRS_BACKHAUL_DEMAND..............................................................128Figure 48 - DL_EGPRS_BACKHAUL_USED.....................................................................129Figure 49 - EGPRS_64K_CHANNEL_WIDTH...................................................................129Figure 50 - Example usage of the VT carrier stats to measure backhaul efficiency...............130
System Performance Group Vienna Page 7/137Motorola Confidential Proprietary

GSD CSISHow to use E/GPRS Statistics
1 GPRS Statistics – Scope and Limitations
1.1 ScopeThe evaluation of performance and the detection and analysis of performance problems in E/GPRS networks is complex and difficult compared to the GSM world. A range of BSS statistics have been developed and provided by Motorola and with every GSM System Release they get more evolved and powerful. This document is intended to help understanding, in which areas and situation which statistic can be useful and what purpose they actually serve.
E/GPRS statistics can be used in several ways. They can help to: detect problems compare and rank cells verify performance
in multiple situations like: daily optimisation problem analysis software rollout performance verification
In many cases E/GPRS statistics can only indicate problems but don’t allow root cause analysis. BSS statistics can be used to identify issues on a high level view, while sometimes only thorough drive testing combined with systematic log collection provide enough information to get to the bottom of a problem. Of course not every detected issue needs further clarification by other means than stats but it helps to set the stage for the upcoming chapters.
The methods of problem identification and analysis are:
E/GPRS statistics Drive tests & benchmarking Log collection & analysis Call Trace, GPRS Trace
As can be seen it is essential to perceive statistics as only one tool on the road from spotting a problem (performance degradation) to solving it. Imagine an operator’s representative complaining about low throughput (= bad performance) in a cell. Individual subscriber-perceived problems like this can have a multitude of reasons and statistics can certainly help to narrow down the root cause. Is it bad RF quality? Frequent cell reselections during the test? Resource congestion? Badly performing FTP server? Sub-optimal BSS parameter setting? A problem in the SGSN? A problem in the RAN?
Most likely an optimisation engineer has to repeat the test with a proper test equipment to rule out phone and laptop configuration issues. If the problem is still seen client/server and system logs need to be taken to see where the problem lies.
System Performance Group Vienna Page 8/137Motorola Confidential Proprietary

GSD CSISHow to use E/GPRS Statistics
In the example above some of the possible root causes can be found by E/GPRS statistics analysis, some not. When an end user performance limitation arises, stats are used for a first overview – to narrow down the possible root causes. Further analysis can involve additional measures as mentioned above (drive testing, log taking, call trace, GPRS trace). Various possible root causes can be imagined; Statistics can maybe point to the right direction but rarely provide enough evidence to figure out THE problem’s cause.
Here’s how this document is structured: The statistics overview (see chapter 2) introduces a method of cell ranking and 5 health
key statistics, which can be used for detecting optimisation problems or problematic cells respectively.
The statistics deep dive (see chapter 3) describe the E/GPRS raw and key statistics, which are organised in chapters, indicating, in which phase of a data call or in which instance problems might occur.
Only E/GPRS statistics (BSS raw and key stats) are within the scope of this document. It does not include details about benchmarking procedures or log file analysis. However, it does include references to documents, which cover this kind of information (see 1.3).
1.2 Stats LimitationsBSS raw and key statistics have two shortcomings:
Low granularity Low sample size (but this is variable) – minimum pegging criterion
For gauge type statistics and key statistics (a mean and/or max value is calculated over the course of a stats interval) the minimum granularity of 30min introduces an inaccuracy that must be understood in order to classify the information drawn from it. For a start, the variance of a statistic within the stats interval is not known.
Example: The throughput key statistic DL_MEAN_USER_THROUGHPUT_PER_TIMESLOT calculates the average throughput of user data normalised to one timeslot. The average over 30 minutes is normally quite low as hardly any cell is so highly utilised with long FTP sessions that the mean throughput comes even close to the maximum.
The low sample size is the other problem. Nowadays GPRS networks still have very low utilisation compared to voice traffic, making the use of statistics difficult. Without a sufficient amount of traffic during the stats interval the values taken from raw and key stats are just random numbers with little meaning. Neither a single sample nor a series can be seriously used for comparison.
System Performance Group Vienna Page 9/137Motorola Confidential Proprietary

GSD CSISHow to use E/GPRS Statistics
1.2.1 Statistical ConfidenceAccording to the rules of statistical data analysis a change can only be detected if that change is higher than one times the standard deviation, and this only with 66% confidence, assuming a normal distribution of samples. To be 95% confident, the change has to be 2 times the standard deviation. This should be taken into consideration, when interpreting BSS statistics and trying to detect a performance degradation or improvement.
The calculation of the standard deviation values quoted in this document uses the following formula:
Figure 1 - Formula of standard deviation
1.2.2 Detecting a performance changeWhen analysing stats per network element in half hour granularity it is almost certain that the variance is too big to detect performance changes with the required confidence (see Figure 2). If this is the case, the way to go is to summarise the data per day (daily summary, see Figure 3) and/or per network element (BSC summary). The standard deviation will vary when altering the granularity of statistics (summarisation of intervals or network elements).
90
91
92
93
94
95
96
97
98
99
100
19M
AR
2005
:00:
00:0
0
19M
AR
2005
:10:
00:0
0
19M
AR
2005
:20:
00:0
0
20M
AR
2005
:06:
00:0
0
20M
AR
2005
:16:
00:0
0
21M
AR
2005
:02:
00:0
0
21M
AR
2005
:12:
00:0
0
21M
AR
2005
:22:
00:0
0
22M
AR
2005
:08:
00:0
0
22M
AR
2005
:18:
00:0
0
23M
AR
2005
:04:
00:0
0
23M
AR
2005
:14:
00:0
0
24M
AR
2005
:00:
00:0
0
24M
AR
2005
:10:
00:0
0
24M
AR
2005
:20:
00:0
0
25M
AR
2005
:06:
00:0
0
25M
AR
2005
:16:
00:0
0
26M
AR
2005
:02:
00:0
0
26M
AR
2005
:12:
00:0
0
26M
AR
2005
:22:
00:0
0
27M
AR
2005
:08:
00:0
0
27M
AR
2005
:18:
00:0
0
28M
AR
2005
:04:
00:0
0
28M
AR
2005
:14:
00:0
0
29M
AR
2005
:00:
00:0
0
29M
AR
2005
:10:
00:0
0
29M
AR
2005
:20:
00:0
0
30M
AR
2005
:06:
00:0
0
30M
AR
2005
:16:
00:0
0
UL TBFSuccessRate (%)
Mean before Rollout
2
2
ROLLOUT
Before Rollout:Mean = 97.449 = 1.816
Figure 2 - Detecting a change, half hour values
System Performance Group Vienna Page 10/137Motorola Confidential Proprietary
where:n = number of samplesx = value of sample
Only 66% confidence, that changes after the rollout are singnificant, because the variation of values is so high.

GSD CSISHow to use E/GPRS Statistics
Detecting a change - Data summarised per day
95.5
96
96.5
97
97.5
98
98.5
99
99.5
100S
a, 1
9.03
So,
20.
03
Mo,
21.
03
Di,
22.0
3
Mi,
23.0
3
Do,
24.
03
Fr, 2
5.03
Sa,
26.
03
So,
27.
03
Mo,
28.
03
Di,
29.0
3
Mi,
30.0
3
UL TBFSuccessRate (%)
Mean before Rollout
2
2
ROLLOUT
Before Rollout:Mean = 97.980 = 0.735
Figure 3 - Detecting a change, daily values
Please note: Accumulating the BSS stats to daily values can (and normally will) result in including intervals not fulfilling the minimum pegging criteria (see 1.2.3). It is best to exclude these intervals. The same applies to accumulating the BSS stats to BSC level.
When a performance degradation on summarised statistics is detected (> 2 times ), the statistic counters can be analysed per day and half hour stats interval.
1.2.3 Minimum pegging In case conclusive performance values are needed (e.g. for throughput calculation), a minimum pegging criterion for the amount of traffic needs to be fulfilled.The required minimum RLC blocks per cell and interval are dependent on the number of GPRS calls performed in a cell and on their duration. E.g., a single GPRS MS occupying all cell resources, doing a long data call and occupying all cell resources during the entire stats interval might distort the cell’s performance snapshot provided by the BSS statistics if the MS is located in an above-average radio quality area or in a place of very poor radio conditions.
A high percentage of very short TBFs on the other hand don’t reflect the true performance since coding scheme usage is mostly limited to the (configurable) initial coding scheme. Short TBFs start with the initial coding scheme (configurable and normally set to CS-2, EDGE: MCS-3) and may be finished before higher coding schemes are utilised.
System Performance Group Vienna Page 11/137Motorola Confidential Proprietary
95% confidence, that changes after the rollout are singnificant.

GSD CSISHow to use E/GPRS Statistics
A minimum pegging of RLC_ACK_NEW_BLKS = 100 (= 10000 blocks) per PDTCH within a half hour interval are needed to ensure a sufficient sample size as well as a long enough mean TBF duration (see 3.3.7.2). These 10000 out of 90000 possible RLC/MAC blocks equal an 11% utilisation of radio resources during the half hour stats interval.
The cell-level traffic volume has to exceed this threshold that the BSS stats are really reflecting the end user performance perception of data applications. Note that summarising statistics per BSC and/or day without removing intervals which don’t fulfil this criterion should be prevented.
1.3 Other methods of problem investigation & optimisationWhen the statistics are insufficient to analyse a performance problem other measures like drive testing and logs can help analysing the problem. For a detailed description of benchmarking and log analysis please see further reading: Step 1 - Benchmark a GPRS System - Measurement Standards [10] and Step 2 - Performance Troubleshooting in a Nutshell [11].
System Performance Group Vienna Page 12/137Motorola Confidential Proprietary

GSD CSISHow to use E/GPRS Statistics
2 Statistics Overview
This chapter provides instruments for a high-level statistics overview; a method of cell ranking, which allows the sorting of intervals by their “importance” and 5 health key statistics, which can be checked as a first take on GPRS performance. If these health key statistics show a problem, a statistics deep dive (means: look at additional stats; see chapter 3) can help. Ranking and health key statistics can be constantly monitored to detect issues; however, it is not possible to detect problems these stats don’t show. Additional measures (drive testing, taking logs) must be taken, when the root cause cannot be found with statistics alone.
2.1 RankingThe statistics approach (see 1.1) can be facilitated by ranking. CAT (the OMC COP tool) provides in its GSR8 version a ranking formula, which allows sorting the stats intervals according to their importance (traffic volume) and some other problem indicators to provide a sorting criterion for all intervals per day of a BSC. The formula has the following attributes:
The ranking formula uses PM key stats. The ranking value has a range of 0 to 1. The ranking formula consists of 4 parts: Traffic, Utilisation by Traffic, TBF Failure
Rate, and Bandwidth Indicator. The ranking formula elements are all designed to have a range of 0 to 1 (0 = "good",
"unimportant", 1 = "bad", "important"). Each element has its weighting factor (w, x, y, z) The weighting factors w, x, y, z are user definable but have default values. w+x+y+z = 1 should always be true, otherwise the ranking value can exceed 1. CAT
ensures that users cannot break this law. Every time a formula part is “broken”, i.e. a raw stat is not available (has value “.”or
“?”), this part is excluded from the ranking formula (value of 0). Normalisation (make the range 0 to 1) is done by the ranking formula, except for
traffic. CAT provides NORMALISED_DL_TRAFFIC and NORMALISED_UL_TRAFFIC in the following way:
o Normalise the DL traffic based on the busiest cell (largest value of PM key stat DL_USER_TRAFFIC_GPRS) in every BSC for the current interval.
o Find the largest traffic value in the PM database and assign 1 to it. All other cells get a value between 0 and 1 depending on their percentage from the largest traffic interval.
o Repeat steps 1 and 2 for UL_USER_TRAFFIC_GPRS to calculate NORMALISED_UL_TRAFFIC.
o Do this for every BSC separately.
There are two versions of the ranking formula (for GSR7 and 8), as the new GSR8 statistic TBF_DL_ASGN_PACCH allows a more accurate calculation of TBF failures (see also the TBF_FAILURE_RATE key stats, 3.3.5.3).
GSR7 (1740, 1760) formula:
System Performance Group Vienna Page 13/137Motorola Confidential Proprietary

GSD CSISHow to use E/GPRS Statistics
w*(NORMALISED_DL_TRAFFIC + NORMALISED_UL_TRAFFIC)/2 + x*(DL_PDTCH_UTILISATION_BY_TRAFFIC + UL_PDTCH_UTILISATION_BY_TRAFFIC)/200 + y*(((AIR_DL_TBF_FAILURES_DT + AIR_DL_TBF_FAILURES_DR + AIR_DL_TBF_FAILURES_T)/DL_PDTCH_SEIZURE) + ((AIR_UL_TBF_FAILURES_DT + AIR_UL_TBF_FAILURES_T)/ (CHANNEL_REQS_SUCCESS_P_C+CHANNEL_REQS_SUCCESS_P_P+CHANNEL_REQS_SUCCESS_P_R+CHANNEL_REQS_SUCCESS_PKTS+CHANNEL_REQS_SUCCESS_E_C+CHANNEL_REQS_SUCCESS_CP_A+CHANNEL_REQS_SUCCESS_E_1P_CCC+CHANNEL_REQS_SUCCESS_E_1P_PCCC+CHANNEL_REQS_SUCCESS_E_PUAPRR+CHANNEL_REQS_SUCCESS_E_PTR+CHANNEL_REQS_SUCCESS_E_PUAPDAK)/2)) + z*(a - DL_BANDWIDTH_INDICATOR_GPRS - UL_BANDWIDTH_INDICATOR_GPRS)/62
GSR8 (1800 onwards) formula:w*(NORMALISED_DL_TRAFFIC + NORMALISED_UL_TRAFFIC)/2 +x*(DL_PDTCH_UTILISATION_BY_TRAFFIC + UL_PDTCH_UTILISATION_BY_TRAFFIC)/200 +y*(((AIR_DL_TBF_FAILURES/(TBF_DL_ASGN_PACCH + IMM_ASSGN_CAUSE_6)) + (AIR_UL_TBF_FAILURES/(CHANNEL_REQS_SUCCESS_P_C+CHANNEL_REQS_SUCCESS_P_P+CHANNEL_REQS_SUCCESS_P_R+CHANNEL_REQS_SUCCESS_PKTS+CHANNEL_REQS_SUCCESS_E_C+CHANNEL_REQS_SUCCESS_CP_A+CHANNEL_REQS_SUCCESS_E_1P_CCC+CHANNEL_REQS_SUCCESS_E_1P_PCCC+CHANNEL_REQS_SUCCESS_E_PUAPRR+CHANNEL_REQS_SUCCESS_E_PTR+CHANNEL_REQS_SUCCESS_E_PUAPDAK)/2)) + z*(a - DL_BANDWIDTH_INDICATOR_GPRS – UL_BANDWIDTH_INDICATOR_GPRS)/62 a = 66 for 16k TRAU (CS-1/2 only)a = 106 for 32k TRAU (CS-3/4)When 16k and 32k TRAU resources are mixed in a cell, the bandwidth indicator formula part doesn’t work properly and its impact can be reduced by decreasing z.
The current default values for the weighting factors are:w = 0.2x = 0.3y = 0.35z = 0.15
For further reading on the 4 formula parts please see the following chapters: 3.3.3.4 for USER_TRAFFIC_VOLUME, 3.4.3.7 for PDTCH_UTILISATION_BY_TRAFFIC, 3.3.5.3 for TBF_FAILURE_RATE and 3.5.2.3 for BANDWIDTH_INDICATOR.
Please note that the ranking formula explained above currently excludes EDGE traffic and EDGE bandwidth indicator.
System Performance Group Vienna Page 14/137Motorola Confidential Proprietary

GSD CSISHow to use E/GPRS Statistics
However, when EDGE cells are to be ranked, the formula can be modified: the traffic part should use the DL_USER_TRAFFIC_EGPRS and
UL_USER_TRAFFIC_EGPRS to build the NORMALISED_TRAFFIC value the bandwidth indicator term needs to be changed to z*(248 -
DL_BANDWIDTH_INDICATOR_EGPRS - UL_BANDWIDTH_INDICATOR_EGPRS)/204)
2.2 Health Key StatisticsThe 5 following key statistics cover the basics of E/GPRS performance. Detailed descriptions and ranges can be found in the assorted chapters, follow the references. If one of them show problematic values, additional analysis is required.
Area Key statistics name Description References
Separate formula for UL and DL?
Channel Setup
TBF Success Rate
This rate covers the TBF setup from channel request until the TBF is successfully established
See 3.1.4.2 and 3.1.4.3
yes (DL formula is
GSR8 only)
Transfer Quality
Mean User Throughput per
Timeslot
This throughput figure serves as a measure to compare cells against each other.
See 3.2.1.1 yes
TBF Failure TBF Failure Rate This rate covers TBF Failures See 3.3.5.3 yes
Congestion
TBF Interleaving
Activity(GSR7 1740)
or GPRS_CELL_CONGESTION
(GSR8)
The TBF Interleaving Activity provides information about the degree of interleaving (number of TBFs per PDCH). In GSR8 the distribution stat GPRS_CELL_CONGESTION provides more detailed information on TBF interleaving.
See 3.4.3.13
and 3.4.3.11
yesfor TBF
Interleaving Activity
nofor
GPRS_CELL_CONGESTION
Cell Reselection
Indicator
LLC Discards on Cell
Reselection (GSR8)
This rate provides information on the percentage of discarded LLC frames due to intra-PRP cell reselections.
See 3.3.4.5 no
System Performance Group Vienna Page 15/137Motorola Confidential Proprietary

GSD CSISHow to use E/GPRS Statistics
3 Statistics Deep Dive
This chapter describes the E/GPRS raw and key statistics, which are organised in sub-chapters, indicating, in which phase of a data call or in which instance problems might occur. The further analysis can involve additional measures as mentioned above (drive testing, log taking, call trace, GPRS trace).
The following chapters organise BSS raw and key statistics (see Appendix A and Appendix B) in the following areas:
Setupo Accessibility – TBF Establishment (see 3.1)
Data Transfero Throughput (see 3.2)o Traffic (see 3.3)o Utilisation (see 3.4)o Quality (see 3.5)o Mobility (see 3.6)
Description, Usage and typical values (if applicable) help to understand the statistic and its usage. Typical problems found in GPRS networks are mentioned along with possible root causes, wherever known and applicable.
The stats are linked from all other areas, wherever it makes sense to check them to further analyse a problem in order to find the root cause.
System Performance Group Vienna Page 16/137Motorola Confidential Proprietary

GSD CSISHow to use E/GPRS Statistics
3.1 Accessibility – TBF EstablishmentThe network access up the point where a TBF is established and data is transmitted or received plays an important part in overall performance (A Temporary Block Flow is a logical connection to send or receive data (LLC PDUs) and is maintained only for the duration of the data transfer). It is the first area where user expectations (fast network access) can be disappointed.
Several BSS statistics illustrate and help to analyse the whole process from counting paging messages (ACCESS_PER_PCH, ACCESS_PER_PPCH) until "first PDU received/sent" (PDTCH_SEIZURE). Figure 4 and Figure 5 below show a simplified ladder diagram of UL and DL TBF establishment.
CHANNEL REQUEST
PACKET UL ASSIGNMENT
MS BSS
Data
RACH
PDCH
AGCH
Figure 4 – Uplink TBF establishment (one-phase access)
Figure 5 – Downlink TBF establishment (MS in standby mode)
Accessibility problems prevent or at least delay the user data to be transmitted or sent, which has direct impact on the higher layer application.
Problems with TBF Establishment can be: Unserviced RACHes Unserviced Channel Requests Rejected Channel Requests
System Performance Group Vienna Page 17/137Motorola Confidential Proprietary

GSD CSISHow to use E/GPRS Statistics
Here is a list of the accessibility related raw and key statistics, which will be discussed in the following sub-sections:
ACCESS_PER_PCH Peg at the RSS (BTS)ACCESS_PER_PPCHDL_PDTCH_SEIZURE, UL_PDTCH_SEIZURE
Peg at the PRM (PCU)
GPRS_RACH_ARRIVAL (RACH load)G_RACH_UNSVCD_BTSCHANNEL_REQS_RECCHANNEL_REQS_SUCCESSCHANNEL_REQS_REJECTCH_REQ_UNSVCD_PCUPCH_Q_PAGE_DISCARDPPCH_Q_PAGE_DISCARDUL Channel Requests Unserviced Rate [%]
Key statisticsUL Channel Requests Success Rate [%]UL TBF Success Rate [%]DL TBF Success Rate [%]
3.1.1 PagingMobile terminated GPRS calls require the MS to be paged from the system. A problem with paging would be a PCH queue overflow. The key statistic GPRS Paging Overflow Rate (key stat is available for PCH and PPCH) indicates the percentage of discarded PS pages. The less paging blocks are configured the higher is the probability of PCH queue overflow. Normally this value is 0 as no paging messages are discarded from the queue. An increased value (>10%) indicates that more paging blocks are needed (increase parameter BS_PA_MFRMS, reduce parameter BS_AG_BLKS_RES or BS_PAG_BLKS_RES in case of PCCCH/PBCCH). Alternatively the areas with same RAC (PS pages) or LAC (CS pages) can be shrinked (RAC/LAC split).
3.1.1.1 ACCESS_PER_PCHThe ACCESS_PER_PCH statistic tracks the number of attempted transmissions of PAGING REQUEST messages sent on the PCH. It pegs on the RSS (BTS) before scheduling on the physical channel and counts the number of attempts, so the unsuccessful cases, that don’t result in channel assignment, are also counted.
Name Bin # DescriptionACCESS_PER_PCH_PS_CS 0 Both CS and PS pages within the PAGING
REQUEST message.ACCESS_PER_PCH_CS 1 Only CS pages within the PAGING REQUEST
message.ACCESS_PER_PCH_PS 2 Only PS pages within the PAGING REQUEST
System Performance Group Vienna Page 18/137Motorola Confidential Proprietary

GSD CSISHow to use E/GPRS Statistics
message.
Applicable release: 1740 onwards
3.1.1.2 ACCESS_PER_PPCHThe ACCESS_PER_PPCH statistic tracks the number of attempted transmissions of PAGING REQUEST messages sent on the PPCH. It counts the number of attempts, so the unsuccessful cases, that don’t result in channel assignment, are also counted.
Name Bin # DescriptionACCESS_PER_PPCH_PS_CS 0 Both CS and PS pages within the PACKET
PAGING REQUEST message.ACCESS_PER_PPCH_CS 1 Only CS pages within the PACKET PAGING
REQUEST message.ACCESS_PER_PPCH_PS 2 Only PS pages within the PACKET PAGING
REQUEST message.
Applicable release: 1740 onwards
3.1.1.3 PCH_Q_PAGE_DISCARDThe PCH_Q_PAGE_DISCARD statistic tracks the number of paging requests discarded from the PCH queue before they could be transmitted. It pegs each time a page from the MSC is overwritten while in the queue. The statistic pegs for CS and PS pages as well as for the assignments which the BSS was going to send over the PCH.
A page may be discarded from the queue for the following reasons: queue overflow priority insertion causing an overflow in_queue timer expiry.
The only cause for discarding pages in the Motorola BSS is queue overflow.
Name Bin # DescriptionPCH_Q_PAGE_DISCARD_CS 0 CS pages discardedPCH_Q_PAGE_DISCARD_PS 1 PS pages discarded.
Applicable release: 1740 onwards
3.1.1.4 PPCH_Q_PAGE_DISCARDThe PPCH_Q_PAGE_DISCARD statistic tracks the number of paging requests discarded from the PPCH queue before they could be transmitted. It pegs each time a page from the MSC is overwritten while in the queue.
System Performance Group Vienna Page 19/137Motorola Confidential Proprietary

GSD CSISHow to use E/GPRS Statistics
A page may be discarded from the queue for the following reasons: queue overflow priority insertion causing an overflow in_queue timer expiry.
The only cause for discarding pages in the Motorola BSS is queue overflow.
Name Bin # DescriptionPPCH_Q_PAGE_DISCARD_CS 0 CS pages discardedPPCH_Q_PAGE_DISCARD_PS 1 PS pages discarded.
3.1.1.5 GPRS_PAGING_OVERFLOW_RATEDescription:These key statistics provide the rate of PS paging messages, which get discarded from the queue due to queue overflow before they get transmitted.
1 unit represents a percentage.
Applicable release: 1740 onwards
Range:Should be zero. Otherwise paging overflow leads to delay in TBF establishments.
Usage:If this key statistic exceeds 0, the PCH/PPCH usage in the affected cells is very high, leading to queue overflows. This may be caused either by inappropriate database parameter settings for PS paging or by too large location areas (LA).
Formulae:GPRS_PAGING_OVERFLOW_RATE_PCH =PCH_Q_PAGE_DISCARD_PS*100/ACCESS_PER_PCH_PS
GPRS_PAGING_OVERFLOW_RATE_PPCH =PPCH_Q_PAGE_DISCARD_PS*100/ACCESS_PER_PPCH_PS
3.1.2 RACH
3.1.2.1 GPRS_RACH_ARRIVALThe GPRS_RACH_ARRIVAL statistic tracks the mean, minimum, and maximum number of GPRS RACH request arrivals over CCCH per second. At the PCU this statistic is pegged into bins, which allows for higher granularity. At the end of the interval the mean, min and max values are derived from the bins and uploaded to the OMC.
System Performance Group Vienna Page 20/137Motorola Confidential Proprietary

GSD CSISHow to use E/GPRS Statistics
GPRS_RACH_ARRIVAL_MAXGPRS_RACH_ARRIVAL_MEANGPRS_RACH_ARRIVAL_MIN
Applicable release: 1740 onwards
Usage:This statistic can be used to check the RACH Arrival Rate, which plays an important part in the GSR7 Enhanced Scheduling feature.
When the RACH arrival rate reaches the RACH throttle threshold, the BTS may request the PCU to set up reserved PRR blocks on the PDCHs, allowing more RACHs to be handled at the BTS via the reserved PRR blocks, and removing the requirement for RSL bandwidth utilization. Once the RACH arrival rate subsides, these reserved blocks are taken away.
The RACH throttle threshold is derived from the parameter percent_traf_cs, which defines a percentage of RSL bandwidth as reserved for CS traffic only.
To learn more on the enhanced scheduling feature and other related statistics see the chapter 3.1.3.3.
This statistic can be used as well for GSL dimensioning.
3.1.2.2 G_RACH_UNSVCD_BTSThe G_RACH_UNSVCD_BTS statistic tracks the total number of uplink GPRS RACH requests unserviced by the BTS.
Name Bin # DescriptionG_RACH_UNSVCD_BTS Sum of all binsG_RACH_BTS_RSL 0 RSL bandwidth limitationG_RACH_BTS_PRR 1 No PRR blockG_RACH_BTS_AGCH 2 AGCH discard
Applicable release: 1740 onwards
Usage:Bin 0: RSL bandwidth limitationThis bin is pegged, when the rate of received packet channel request messages per second exceeds the threshold on the RSL link, set by percent_traf_cs; the RACHes at the BTS are then throttled. If the Enhanced Scheduling feature RDB 4441 is unrestricted and enabled, the BTS starts to use the dynamic reserved PRR allocation (see chapter 3.1.3.3.2) where the channel requests don’t need to be forwarded to the PCU thus saving RSL bandwidth. The BTS needs reserved PRR blocks to handle the channel request, so the parameter gprs_min_prr_blks must be > 0. If PRR blocks are successfully used this bin is zero.
System Performance Group Vienna Page 21/137Motorola Confidential Proprietary

GSD CSISHow to use E/GPRS Statistics
Bin 1: No PRR blockIf RACH throttling due to RSL bandwidth limitation occurs, this bin is pegged every time there is no reserved PRR block left. This is an indication that the parameter gprs_min_prr_blks should be increased. See also the statistic GPRS_PRR_BLK_USG (see 3.1.3.3.2).
Bin 3: AGCH dicardThis bin can be used to check how many AGCH discards happen compared to the GPRS_ACCESS_PER_AGCH.
3.1.3 TBF establishmentIt is necessary to differentiate between uplink and downlink TBF establishment:
Uplink: When a GPRS mobile wants to transfer data to the network it must first request and then be assigned uplink GPRS resources. This is called uplink TBF establishment and the procedure can be outlined as follows:1. The mobile requests a TBF resource from the PCU, pegging the statistic
CHANNEL_REQS_REC.2. The PCU grants the mobile a resource to enable it to transfer data, pegging the
statistic CHANNEL_REQS_SUCCESS.3. The BSS receives uplink data from the mobile, pegging the statistic
UL_PDTCH_SEIZURE. Downlink: When downlink resources are required to deliver data to the mobile two
ways of setting up a downlink TBF are possible:1a. When a mobile is in packet transfer mode, the PCU can send a Packet Downlink
Assignment using PACCH to establish downlink TBF pegging the statistic TBF_DL_ASGN_PACCH.
1b. When a mobile is in packet idle mode, the PCU can establish a TBF by sending an IMMEDIATE ASSIGNMENT message with the cause value GPRS - downlink packet access or EGPRS - downlink packet access pegging the statistic IMM_ASSGN_CAUSE (two different bins for GPRS and EGPRS!).
2. When the PCU starts to send data and receives the first PDAN message from the mobile the statistic DL_PDTCH_SEIZURE is pegged.
System Performance Group Vienna Page 22/137Motorola Confidential Proprietary

GSD CSISHow to use E/GPRS Statistics
Figure 6 – Ladder diagram: Successful uplink TBF establishment
3.1.3.1 CHANNEL_REQS – Two-phase, one-phase, enhanced one-phase accessThe channel setup can be done in either one or two phases, depending on the network and MS capabilities. Motorola GPRS networks support both packet access methods and provide enhancements (enhanced one-phase, optimised two-phase), so it is up to the network (MS capability), which packet access method is used. These statistics which track the channel setup are channel requests statistics and are pegged at the PRM (PCU). Applicable release: 1740 onwards
Usage:There are 4 types of channel requests statistics, which are described on the following pages.
Received CHANNEL_REQS_RECSuccessful CHANNEL_REQS_SUCCESSRejected CHANNEL_REQS_REJECTUnserviced CH_REQ_UNSVCD_PCUFigure 7 - Table: Types of channel requests statistics
3.1.3.1.1 ReceivedThis raw stat is pegged for every channel request received by the PRM (PCU). The bins correspond to the various types of channel requests.
Name Bin # DescriptionCHANNEL_REQS_REC Sum of all binsCHANNEL_REQS_REC_P_C 0 Bin 0: A GPRS One-Phase access
channel request on CCCH is received.
System Performance Group Vienna Page 23/137Motorola Confidential Proprietary

GSD CSISHow to use E/GPRS Statistics
CHANNEL_REQS_REC_P_P 1 Bin 1: A GPRS One-Phase access packet channel request on PCCCH is received.
CHANNEL_REQS_REC_B_C 2 Bin 2: A GPRS single block allocation on CCCH is received.
CHANNEL_REQS_REC_B_P 3 Bin 3: A GPRS single block allocation on PCCCH is received.
CHANNEL_REQS_REC_P_R 4 Bin 4: A GPRS Packet Resource Request (PRR) message is received (second phase of two phase access).
CHANNEL_REQS_REC_CP_A 5 Bin 5: A GPRS Channel Request in Packet Downlink ACK/NACK (PDAK) message is received.
CHANNEL_REQS_REC_E_C 6 Bin 6: An Enhanced One-Phase (EOP) access indication is received.
CHANNEL_REQS_REC_EGPRS_1PH_CC 7 Bin 7: EGPRS One-Phase access on CCCH is received.
CHANNEL_REQS_REC_EGPRS_1PH_PCC 8 Bin 8: An EGPRS One-Phase access on PCCCH is received.
CHANNEL_REQS_REC_EGPRS_SBK_CC 9 Bin 9: An EGPRS Single Block Allocation on CCCH is received.
CHANNEL_REQS_REC_EGPRS_SBK_PCC 10 Bin 10: An EGPRS Single Block Allocation on PCCCH is received.
CHANNEL_REQS_REC_EGPRS_PKRS_RQ 11 Bin 11: An EGPRS Packet Resource Request is received.
CHANNEL_REQS_REC_EGPRS_CRQPDAK 12 Bin 12: An EGPRS Channel Request in Packet Downlink ACK/NACK (PDAK) message is received.
3.1.3.1.2 SuccessThis raw stat is pegged for every channel request which the PCU is able to service by sending an assignment message (IA or PUA) at the PRM (PCU).
System Performance Group Vienna Page 24/137Motorola Confidential Proprietary

Name Bin # DescriptionCHANNEL_REQS_SUCCESS Sum of all binsCHANNEL_REQS_SUCCESS_P_C 0 A GPRS One-Phase Access Packet
Immediate Assignment (PIA) is sent on CCCH.
CHANNEL_REQS_SUCCESS_P_P 1 A GPRS One-Phase Access Packet Uplink Assignment (PUA) is sent on PCCCH.
CHANNEL_REQS_SUCCESS_B_C 2 A GPRS Single Block Allocation PIA is sent on CCCH.
CHANNEL_REQS_SUCCESS_B_P 3 A GPRS Single Block Allocation PUA is sent on PCCCH.
CHANNEL_REQS_SUCCESS_P_R 4 A GPRS PUA (in response to Packet Resource Request) is sent to establish a TBF (only the first PUA is counted).
CHANNEL_REQS_SUCCESS_PKTS 5 A GPRS Packet Timeslot Reconfiguration (PTR) is sent to establish a new TBF or to re-assign the downlink TBF (only the first PTR is counted).
CHANNEL_REQS_SUCCESS_E_C 6 An Enhanced One-Phase (EOP) Access indication is received on CCCH.
CHANNEL_REQS_SUCCESS_CP_A 7 A GPRS PUA in response to a “channel request” received in a Packet Downlink ACK.
CHANNEL_REQS_SUCCESS_E_1P_CCC 8 An EOP Access PUA is sent on CCCH.
CHANNEL_REQS_SUCCESS_E_1P_PCCC 9 An EOP access PUA is sent on PCCCH.
CHANNEL_REQS_SUCCESS_E_SB_CCC 10 An EGPRS Single Block Allocation PIA is sent on CCCH.
CHANNEL_REQS_SUCCESS_E_SB_PCCC 11 An EGPRS Single Block Allocation PUA is sent on PCCCH.
CHANNEL_REQS_SUCCESS_E_PUAPRR 12 An EGPRS PUA (in response to Packet Resource Request (PRR)) is sent to establish a TBF (only the first PUA is counted).
CHANNEL_REQS_SUCCESS_E_PTR 13 An EGPRS PTR is sent to establish a new TBF or to re-assign
Motorola Confidential Proprietary
This document and the information contained in it is CONFIDENTIAL INFORMATION of Motorola, and shall not be used, published, disclosed, or disseminated outside Motorola in whole or in part without Motorola´s consent. This document contains trade secrets of Motorola.
Reverse engineering of any or all of the information in this document is prohibited. The copyright notice does not imply publication of the document

GSD CSISHow to use E/GPRS Statistics
the downlink TBF (only the first PTR is counted).
CHANNEL_REQS_SUCCESS_E_PUAPDAK 14 An EGPRS PUA in response to a “channel request” in a PDAK.
3.1.3.1.3 RejectThis raw stat is pegged when a PAR is sent.
CHANNEL_REQS_REJECT
3.1.3.1.4 UnservicedThis raw stat is pegged for each channel request unserviced by the PCU.
Name Bin # DescriptionCH_REQ_UNSVCD_PCU Sum of all binsCH_REQ_PCU_R_BW 0 RACH - RSL bandwidth limitationCH_REQ_PCU_R_RTD 1 RACH - Round Trip Delay
(RTD) / A timeout occursCH_REQ_PCU_R_IR 2 RACH - Insufficient resourcesCH_REQ_PCU_P_RDT 3 PRACH - Round Trip Delay
(RTD) / A timeout occursCH_REQ_PCU_P_IR 4 PRACH - Insufficient resourcesCH_REQ_PCU_PR_RTD 5 PRR - Round Trip Delay (RTD) /
A timeout occursCH_REQ_PCU_PR_IR 6 PRR - Insufficient resourcesCH_REQ_PCU_PD_IR 7 PDAK - Insufficient resources
Known reasons of insufficient resources on RACH/PRACH/PRR/PDAK (Bins 2, 4, 6, 7): No resource in the cell => Number of Available PDTCH * 4 have been reached in
this case stat NO_PDTCH_AVAIL_TIME should also be pegged No TFI available in the cell => 32 TFI only relevant for cells with at least 8 PDCH No resource in the PRP managing the cell => 120 active TS. The statistic
PRP_LOAD for this PRP should have reached a max of 400. No available MCN in the PRP managing the cell – a SWFM should be issued No ms_index available on the timeslot => 8
3.1.3.2 UL_CHANNEL_REQUESTS_UNSERVICED_RATEDescription:This key statistic calculates the percentage of channel requests received by the PCU, which are not serviced.
1 unit represents a percentage.
System Performance Group Vienna Page 26/137Motorola Confidential Proprietary

GSD CSISHow to use E/GPRS Statistics
Applicable release: 1740 onwards
Range:A value of max. 0.5% should not be exceeded.
Usage:This rate fluctuates due to mobile IOT issues and software problems. When a “problematic” mobile is present in a cell, it will cause the statistic to increase.
Formula:UL_CHANNEL_REQUESTS_UNSERVICED_RATE =CH_REQ_UNSVCD_PCU*100/ CHANNEL_REQS_REC
3.1.3.3 GPRS_PRR_BLK_USG – optimised two-phase accessTo understand this statistic’s use it is required to understand the following feature:
3.1.3.3.1 Dynamic PRR block allocation for two-phase accessAll the channel access methods (two-phase, one-phase, enhanced one-phase) are covered by the CHANNEL_REQUESTS statistics (see 3.1.3.1) except the case of optimised two-phase access (see Figure 9), which is used instead of the standard two-phase access (see Figure 8) if the GSR7 Enhanced One-Phase Access feature introduced by Enhanced Scheduling feature RDB 4441 is unrestricted. The cell parameter gprs_min_prr_blks specifies the minimum number of dynamic PRR blocks created per cell and measured over four 51-multiframes. With the BSS parameter prr_aggr_factor > 0 the number of reserved blocks can be automatically increased when the RACH arrival rate exceeds the RACH throttle threshold defined by percent_traf_cs (see Figure 10).
Note that PRR blocks will only be used if:
A mobile specifically requests a two phase access The RACH arrival rate exceeds the GPRS RACH throttle threshold (see chapter 3.1.2.2 -
G_RACH_UNSVCD_BTS and 3.1.3.1 - CH_REQ_UNSVCD_PCU), whereby mobiles that have requested a one phase access will be forced to use two phase access.
The disadvantage of reserved PRR blocks is that uplink resources are reserved solely for PRRs, and cannot be used for data transfer. Therefore the total available uplink bandwidth is reduced.
System Performance Group Vienna Page 27/137Motorola Confidential Proprietary

GSD CSISHow to use E/GPRS Statistics
Figure 8 – Two-phase access procedure without reserved PRR blocks
Figure 9 – Two-phase access procedure with reserved PRR blocks
Figure 10 - Number of reserved PRR blocks as function of RACH Arrival Rate
System Performance Group Vienna Page 28/137Motorola Confidential Proprietary

GSD CSISHow to use E/GPRS Statistics
3.1.3.3.2 GPRS_PRR_BLK_USGDescription: This statistic samples the mean, minimum, and maximum number of PRR blocks used approximately every second (four multiframes). At the PCU this statistic is pegged into bins, which allows higher granularity. At the end of the interval the mean, min and max values are derived from the bins and uploaded to the OMC.
GPRS_PRR_BLK_USG_MAXGPRS_PRR_BLK_USG_MEANGPRS_PRR_BLK_USG_MIN
Applicable release: 1740 onwards
Usage:These stats can be used to check, whether the minimum number of reserved PRR blocks per 4 multiframes defined with the parameter gprs_min_prr_blks is sufficient or should be de- or increased.
Example:If on a cell the gprs_min_prr_blks is set to 4 (1 reserved PRR block per multiframe) check the GPRS_PRR_BLK_USG stats. If for several intervals GPRS_PRR_BLK_USG_MAX = 4 and the GPRS_PRR_BLK_USG_MEAN is > 2, the parameter gprs_min_prr_blks should be increased to 6 or 8. Then the stats should be checked again until the GPRS_PRR_BLK_USG_MEAN is less then half of the configured number.
3.1.3.4 UL_CHANNEL_REQS_UNSVCE_1ST_PHASE_OPT_2PHASE_RATEDescription:This key statistic calculates the percentage of channel requests received by the BTS during the first phase of optimised two-phase access (number of reserved PRR blocks > 0), which are not serviced.
During an optimised two-phase access the channel request (first phase) is not forwarded to the PCU. Therefore this key statistic attempts to calculate the number of unserviced channel requests received by the BTS (leaving out the bin for ‘no PRR blocks left’) and dividing it by the number of RACHes handled by the BTS (optimised two-phase access). The number of RACHes handled by the BTS can be derived by calculating the number of all packet RACHes received by the BTS MINUS the PS RACHes forwarded to the PCU (one-phase, first phase of two-phase including optimised two-phase) MINUS the number of unserviced RACHes due to RSL congestion (no enhanced scheduling enabled).
1 unit represents a percentage.
Applicable release: 1740 onwards
Range:A value of max. 0.5% should not be exceeded.
System Performance Group Vienna Page 29/137Motorola Confidential Proprietary

GSD CSISHow to use E/GPRS Statistics
Usage:The standard GPRS access method is the one-phase access. However mobiles, which support more than 1 timeslot in the uplink (e.g. class 10), have more data to send in the uplink, they can perform a two phase access. If the optimised two-phase access, which is a GSR7 improvement to the GSR6 Enhanced Scheduling feature, is used, this key statistic can identify problems during the first phase (RACH/IA).
Formula:UL_CHANNEL_REQS_UNSVCE_1ST_PHASE_OPT_2PHASE_RATE =(G_RACH_BTS_RSL + G_RACH_BTS_AGCH)*100/(GPRS_ACCESS_PER_RACH - CHANNEL_REQS_REC_P_C - CHANNEL_REQS_REC_EGPRS_1PH_CC - CHANNEL_REQS_REC_B_C - CHANNEL_REQS_REC_EGPRS_SBK_CC - CHANNEL_REQS_REC_E_C - G_RACH_BTS_RSL)
Note: This key statistic is only valid for cells which don’t use PBCCH!
3.1.3.5 UL_CHANNEL_REQUESTS_SUCCESS_RATEDescription:This key statistic monitors the success of uplink channel requests; this is a very important area as the mobile needs to access the network before it can exchange data. Low end-to-end throughput can be rooted in a low UL channel request success rate.
When a GPRS mobile wants to transfer data to the network it must first request and then be assigned uplink GPRS resources. This is called uplink TBF establishment and the procedure can be outlined as follows:
1. The mobile requests a TBF resource from the PCU, pegging the statistic CHANNEL_REQS_REC.
2. The PCU grants the mobile a resource to enable it to transfer data, pegging the statistic CHANNEL_REQS_SUCCESS.
3. The PCU receives uplink data from the mobile, pegging the statistic UL_PDTCH_SEIZURE.
This key statistic compares the number of TBF requests for resources (step 1) with the number of TBF requests that are successfully answered by the PCU (step 2).
1 unit represents a percentage.
Applicable release: 1740 onwards
Usage:A low uplink channel request success rate suggests that a significant number of requests are being lost or rejected by the PCU for some reason. The following information may be useful to determine the cause of this problem:
System Performance Group Vienna Page 30/137Motorola Confidential Proprietary

GSD CSISHow to use E/GPRS Statistics
1. The BSS may be rejecting channel requests. The key statistic UL_TBF_REJECTION_RATE (see 3.1.3.6) indicates if a low UL channel request success rate is related to TBF rejections.
2. In GSR7 there are two new statistics added that will provide more detail on the major reasons why channel requests are being unserviced.
G_RACH_UNSVCD_BTS (see 3.1.2.2). CH_REQ_UNSVCD_PCU (see 3.1.3.1.4).
3. A low uplink TBF success rate may be caused by either: a high demand for GPRS in this cell compared with the number of GPRS
timeslots configured in the cell or a high demand for GPRS in the cells in this BSS compared with the capacity of
the PCU for the BSS. High BLER – Bad RF quality
4. Two other key statistics can be consulted. PDTCH_UTILISATION_BY_ALLOCATION (see 3.4.3.6 and PDTCH_UTILISATION_BY_TRAFFIC (see 3.4.3.7) provide information on GPRS traffic per-cell compared with the GPRS capacity of each cell.
5. There may be a problem at the PCU/PRP that is preventing mobiles from attaching successfully. For example, Absolute Frame Number (AFN) mismatches at the PRP will contribute to a high TBF rejection rate. If this is the case, consider toggling (Disable and then Enable) the gprs_enabled parameter on the cell to fix the problem.
6. The GPRS capacity of this cell or the GPRS capacity of the BSS may need to be increased if this key statistic indicates a problem frequently. The GPRS capacity of a specific cell is likely to be the cause if the problem is repeating mostly on that cell. The GPRS capacity of the PCU for a specific BSS is likely to be the cause if the problem is repeating on different cells in that BSS. The key statistic PRP_LOAD (see 3.4.2.1) can be checked for this.
7. From BSS software release GSR7 onwards the number of PCUs supported by the BSS is increased from one to three. When configuring the additional PCUs the cells must be manually assigned to each of up to 3 PCUs per BSS. If the load is not shared properly between the PCUs, it could lead to congestion on some cells.
Formula:UL_CHANNEL_REQUESTS_SUCCESS_RATE =(CHANNEL_REQS_SUCCESS_P_C + CHANNEL_REQS_SUCCESS_P_P + CHANNEL_REQS_SUCCESS_P_R + CHANNEL_REQS_SUCCESS_CP_A + CHANNEL_REQS_SUCCESS_E_C + CHANNEL_REQS_SUCCESS_PKTS + CHANNEL_REQS_SUCCESS_E_1P_CCC + CHANNEL_REQS_SUCCESS_E_1P_PCCC + CHANNEL_REQS_SUCCESS_E_PUAPRR + CHANNEL_REQS_SUCCESS_E_PTR + CHANNEL_REQS_SUCCESS_E_PUAPDAK)*100/(CHANNEL_REQS_REC_P_C + CHANNEL_REQS_REC_P_P + CHANNEL_REQS_REC_P_R + CHANNEL_REQS_REC_CP_A + CHANNEL_REQS_REC_E_C + CHANNEL_REQS_REC_EGPRS_1PH_CC + CHANNEL_REQS_REC_EGPRS_1PH_PCC + CHANNEL_REQS_REC_EGPRS_PKRS_RQ + CHANNEL_REQS_REC_EGPRS_CRQPDAK)
Note: By leaving out the Bins 2 and 3 and respectively 9 and 10 the first phase of two-phase accesses are not taken into account. This is necessary because these bins peg as well for other single block allocations such as Measurement Reports.
System Performance Group Vienna Page 31/137Motorola Confidential Proprietary

GSD CSISHow to use E/GPRS Statistics
Note: It is not possible to split this formula in a GPRS and an EGPRS part because an EGPRS channel request might be served with GPRS resources, causing the CHANNEL_REQS_SUCCESS statistic to be pegged in a GPRS bin.
3.1.3.6 UL_CHANNEL_REQUESTS_REJECTION_RATEDescription:This key statistic shows the percentage of uplink channel requests that are rejected by the PCU.
1 unit represents a percentage.
Applicable release: 1740 onwards
Usage:The Channel Request Rejections may be caused by either:
a high demand for GPRS in this cell compared with the number of GPRS timeslots configured in the cell or
a high demand for GPRS in the cells in this BSS compared with the capacity of the PCU for the BSS.
Underlying problems: There may be a problem at the PCU/PRP that is preventing mobiles from attaching
successfully. For example, Absolute Frame Number (AFN) mismatches at the PRP will contribute to a high TBF rejection rate. If this is the case, consider toggling (Disable and then Enable) the gprs_enabled parameter on the cell to fix the problem.
The GPRS capacity of this cell or the GPRS capacity of the BSS may need to be increased if this key statistic shows high values frequently. The GPRS capacity of a specific cell is likely to be the cause if the problem is repeating mostly on that cell. The GPRS capacity of the PCU for a specific BSS is likely to be the cause if the problem is repeating on different cells in that BSS.
Note: The use of the CHANNEL_REQS_REJECT raw statistic imposes a problem. Immediate Assignments (and consequently CHANNEL_REQS_REJECT) is only sent in case of two-phase accesses; therefore CHANNEL_REQS_REJECT eventually does not represent the real rejection rate. This can be verified by calculating (100 – UL_CHANNEL_REQUESTS_SUCCESS_RATE).
Formula:UL_CHANNEL_REQUESTS_REJECTION_RATE =CHANNEL_REQS_REJECT*100/CHANNEL_REQS_REC
3.1.4 Channel Established
System Performance Group Vienna Page 32/137Motorola Confidential Proprietary

GSD CSISHow to use E/GPRS Statistics
3.1.4.1 PDTCH_SEIZUREDL_PDTCH_SEIZUREUL_PDTCH_SEIZURE
Description:These statistics measure successful PDTCH seizure on UL and DL. The purpose of this statistic is to count the number of TBF(s) on the downlink. The statistic is obtained by measuring the receipt of the first RLC block on the PDTCH.
DL_PDTCH_SEIZURE is pegged each time a DL TBF is successfully established, the mobile is listening on the PDTCH and the network receives the first DAK from the mobile.
UL_PDTCH_SEIZURE is pegged when: The first uplink data block is received during a two-phase uplink TBF establishment. A first uplink data block containing a valid TLLI is received during a one-phase uplink
TBF establishment.
Applicable release: 1740 onwards
3.1.4.2 UL_TBF_SUCCESS_RATEDescription:This key statistic measures the success of uplink TBF establishment by providing the percentage of mobiles that have requested an uplink TBF resource and successfully send data using this TBF.
When a GPRS mobile wants to transfer data to the network it must first request and then be assigned uplink GPRS resources. This is called uplink TBF establishment and the procedure can be outlined as follows:
4. The mobile requests a TBF resource from the PCU, pegging the statistic CHANNEL_REQS_REC.
5. The BSS grants the mobile a resource to enable it to transfer data, pegging the statistic CHANNEL_REQS_SUCCESS.
6. The PUC receives uplink data from the mobile, pegging the statistic UL_PDTCH_SEIZURE.
This key statistic compares the number of TBF requests for resources (step 1) with the number of TBFs that are actually used to send data (step 3).
1 unit represents a percentage.
Applicable release: 1740 onwards
Range:
System Performance Group Vienna Page 33/137Motorola Confidential Proprietary

GSD CSISHow to use E/GPRS Statistics
A value below 98% should be investigated. As usual, it is important to see the absolute values. When 1 out of 4 mobiles requesting a channel fail to establish the UL TBF this rate is 75% although it is not considered problematic.
Usage:This key statistic is used together with the DL TBF Success Rate (see 3.1.4.3) to check cell accessibility. It is recommended to use this key statistic as a starting point to see the overall UL TBF success rate. If it shows problematic values the channel setup rates (see 3.1.3.2, 3.1.3.5 and 3.1.3.6) can be consulted to see, in which phase the problem is located.
Note: By leaving out the Bins 2 and 3 respectively 9 and 10 the first phase of two-phase accesses are not taken into account. This is necessary because these bins peg as well for other single block allocations such as Measurement Reports.
Formula:UL_TBF_SUCCESS_RATE =UL_PDTCH_SEIZURE*100/ (CHANNEL_REQS_REC_P_C + CHANNEL_REQS_REC_P_P + CHANNEL_REQS_REC_P_R + CHANNEL_REQS_REC_CP_A + CHANNEL_REQS_REC_E_C + CHANNEL_REQS_REC_EGPRS_1PH_CC + CHANNEL_REQS_REC_EGPRS_1PH_PCC + CHANNEL_REQS_REC_EGPRS_PKRS_RQ + CHANNEL_REQS_REC_EGPRS_CRQPDAK)
3.1.4.3 DL_TBF_SUCCESS_RATEDescription:This key statistic monitors the success of downlink TBF establishment, which was not possible up to GSR8. Two ways of setting up a downlink TBF (pegged in three different statistics) exist:
1. When a mobile is in packet transfer mode, the PCU can send Packet Downlink Assignment using PACCH to establish downlink TBF. The stat TBF_DL_ASGN_PACCH represents the number of PDAs sent by PCU using the PACCH channels.
2. When a mobile is in packet idle mode, the PCU can establish a TBF by sending an IMMEDIATE ASSIGNMENT message with the cause value GPRS - downlink packet access or EGPRS - downlink packet access. The statistic IMM_ASSGN_CAUSE is pegged for every Immediate Assignment; for the purpose of calculating a downlink TBF success rate only the bins for GPRS and EGPRS downlink packet access are needed.
Successfully established TBFs are pegged in DL_PDTCH_SEIZURE.
1 unit represents a percentage.
Applicable release: 1800
Usage:This key statistic is used together with the UL TBF Success Rate (see 3.1.4.2) to check cell accessibility.
Formula:
System Performance Group Vienna Page 34/137Motorola Confidential Proprietary

GSD CSISHow to use E/GPRS Statistics
DL_TBF_SEIZURE_RATE =(DL_PDTCH_SEIZURE *100) / (TBF_DL_ASGN_PACCH + IMM_ASSGN_CAUSE_6 + IMM_ASSGN_CAUSE_8)
System Performance Group Vienna Page 35/137Motorola Confidential Proprietary

GSD CSISHow to use E/GPRS Statistics
3.2 ThroughputThroughput degradation can be directly experienced by GPRS end users. It is merely an indication, that a problem or opportunity for optimisation exists, not a problem by itself. A multitude of possible root causes for “low throughput” exist; including problems in the areas of utilisation, quality and mobility; not to forget user handling errors and misconfigured terminal equipment (MS, laptop). High level causes for sub-optimal throughput are:
Packet Loss RLC Efficiency Bandwidth Reduction Abnormal TBF Releases Short TBFs
The following sections describe the problems listed above and which statistics can help to isolate them. But first of all, here are some key statistics to check on throughput:
3.2.1 User Throughput StatisticsUser throughput statistics have to be used cautious.
The used raw statistics in the throughput calculation have a minimum granularity of 30 or 60 min (stats interval), which is not very much. Throughput statistics would be only accurate, if:
test users occupy a dedicated cell during the whole stats interval the number of RLC blocks transmitted or received are a multiple of 100 as this the
pegging interval for RADIO_BLKS statistics the tests ends before the interval is finished as only completed TBFs are counted in the
RADIO_BLKS statistics. not too many SCT periods happen, as they extend the TBF time but no RADIO_BLKS
are pegged.
The only real usage of throughput statistics is the change of them over time and the comparison between different cells in order to detect throughput degradation. It is still necessary to ensure, that enough data blocks are transmitted/received (see 3.3.1) to have statistically meaningful data (see 1.2.1).
3.2.1.1 MEAN_USER_THROUGHPUT_PER_TIMESLOTDescription:The following cell key statistic provides the mean user throughput (no retransmissions included) normalised to one timeslot. It allows a comparison of cell performance as the throughput per used timeslot is calculated for all successful RLC blocks for the times, when there is actually traffic in the cell.
1 unit represents 1 kbps.
System Performance Group Vienna Page 36/137Motorola Confidential Proprietary

GSD CSISHow to use E/GPRS Statistics
Applicable release: 1740 onwards
Range:The maximum possible value can be achieved by constant utilisation of all equipped PDTCHs with RLC traffic throughout the stats interval (see first column of Figure 11). As these statistics are normalised per timeslot, the actual multislot class of the mobile station doesn’t matter.
Coding Scheme
Max. RLC Throughput 1 TS (kbps)
Max. RLC Throughput 2 TS (kbps)
Max. RLC Throughput 3 TS (kbps)
Max. RLC Throughput 4 TS (kbps)
CS-1 9.2 18.4 27.6 36.8CS-2 13.6 27.1 40.65 54.2CS-3 15.8 31.5 47.3 63.0CS-4 21.6 43.1 64.7 86.2MCS-1 10.6 21.2 31.8 42.4MCS-2 13.0 26.0 39.0 52.0MCS-3 16.6 33.2 49.8 66.4MCS-4 19.4 38.8 58.2 77.6MCS-5 23.95 47.9 71.85 95.8MCS-6 31.15 62.3 93.45 124.6MCS-7 46.95 93.9 140.85 187.8MCS-8 56.55 113.1 169.65 226.2MCS-9 61.35 122.7 184.05 245.4Figure 11 - Max. RLC Throughput per Coding Scheme and Timeslot
Typical values for GPRS throughput per TS are 2 to 8 kbps, but this is totally dependent on the cell’s utilisation during the desired stats interval: The higher the utilisation by traffic (see 3.4.3.7), the higher the mean throughput per timeslot will be, given the fact that a stats interval typically lasts 30-60 minutes. The utilisation by allocation (see 3.4.3.5) does not always correlate in the same way, as the allocated resources could be used for low bandwidth TBFs as well.
System Performance Group Vienna Page 37/137Motorola Confidential Proprietary
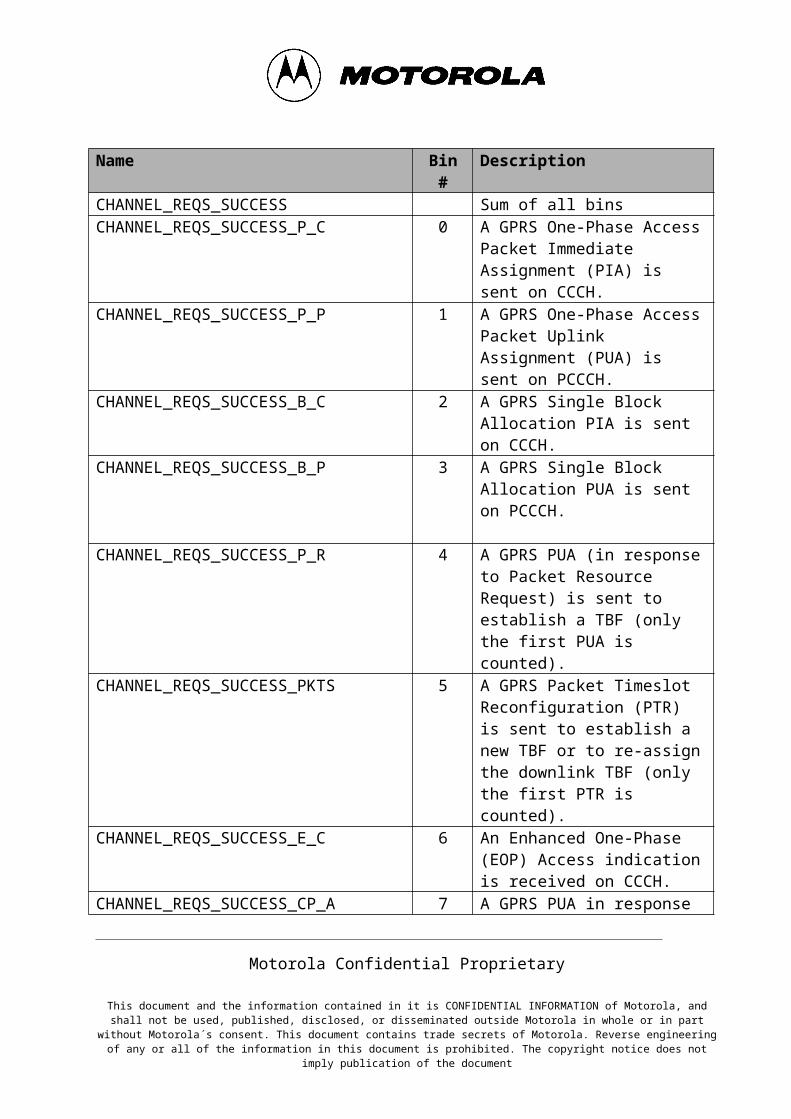
GSD CSISHow to use E/GPRS Statistics
0
0.5
1
1.5
2
2.5
3
3.5
4
4.5
5
0 2 4 6 8 10 12 14
DL PDTCH Utilisation by Traffic (%)
DL M
ean
User
Thr
ough
put p
er T
S (k
bps)
DL Mean User Throughputper TS vs. DL PDTCHUtilisation by TrafficLinear Trendline
Figure 12 – Correlation Chart: DL Mean User Throughput per TS vs. DL PDTCH Utilisation by Traffic (16k-TRAU only)
Usage:The mean user throughput per timeslot statistic can help to identify problems with end-to-end throughput as perceived by the subscriber. As stated above (see 3.2.1) the main usage for these key statistics is the ability to compare cells (BSCs) with each other and see changes over time.However, it is still necessary to ensure, that enough data blocks are transmitted/received (see 3.3.1) to have statistically meaningful data (see 1.2.1). Please note that the throughput calculation is based on the RADIO_BLKS statistics (see 3.3.1), which count only blocks of successful TBFs. All blocks of abnormally released TBFs and blocks, whose TBFs are not finished when the stats interval is completed are not considered!
Note: This key statistic looks for the normalised throughput per timeslot and not for the throughput per timeslots allocated to the mobile and is therefore more a cell indicator than a mobile throughput indicator.
Reasons for low throughput are listed in the following chapters (see 3.2.2 onwards)
Formulae:DL_MEAN_USER_THROUGHPUT_PER_TIMESLOT = ((DL_RADIO_BLKS_1_TS_CS_1 + DL_RADIO_BLKS_2_TS_CS_1 + DL_RADIO_BLKS_3_TS_CS_1 + DL_RADIO_BLKS_4_TS_CS_1)*22 +(DL_RADIO_BLKS_1_TS_CS_2 + DL_RADIO_BLKS_2_TS_CS_2 + DL_RADIO_BLKS_3_TS_CS_2 + DL_RADIO_BLKS_4_TS_CS_2)*33 +
System Performance Group Vienna Page 38/137Motorola Confidential Proprietary

GSD CSISHow to use E/GPRS Statistics
(DL_RADIO_BLKS_1_TS_CS_3 + DL_RADIO_BLKS_2_TS_CS_3 + DL_RADIO_BLKS_3_TS_CS_3 + DL_RADIO_BLKS_4_TS_CS_3)*39 +(DL_RADIO_BLKS_1_TS_CS_4 + DL_RADIO_BLKS_2_TS_CS_4 + DL_RADIO_BLKS_3_TS_CS_4 + DL_RADIO_BLKS_4_TS_CS_4)*53 +(DL_RADIO_BLKS_1_TS_MCS_1 + DL_RADIO_BLKS_2_TS_MCS_1 + DL_RADIO_BLKS_3_TS_MCS_1 + DL_RADIO_BLKS_4_TS_MCS_1)*22 +(DL_RADIO_BLKS_1_TS_MCS_2 + DL_RADIO_BLKS_2_TS_MCS_2 + DL_RADIO_BLKS_3_TS_MCS_2 + DL_RADIO_BLKS_4_TS_MCS_2)*28 +(DL_RADIO_BLKS_1_TS_MCS_3 + DL_RADIO_BLKS_2_TS_MCS_3 + DL_RADIO_BLKS_3_TS_MCS_3 + DL_RADIO_BLKS_4_TS_MCS_3)*37 +(DL_RADIO_BLKS_1_TS_MCS_4 + DL_RADIO_BLKS_2_TS_MCS_4 + DL_RADIO_BLKS_3_TS_MCS_4 + DL_RADIO_BLKS_4_TS_MCS_4)*44 +(DL_RADIO_BLKS_1_TS_MCS_5 + DL_RADIO_BLKS_2_TS_MCS_5 + DL_RADIO_BLKS_3_TS_MCS_5 + DL_RADIO_BLKS_4_TS_MCS_5)*56 +(DL_RADIO_BLKS_1_TS_MCS_6 + DL_RADIO_BLKS_2_TS_MCS_6 + DL_RADIO_BLKS_3_TS_MCS_6 + DL_RADIO_BLKS_4_TS_MCS_6)*74 +(DL_RADIO_BLKS_1_TS_MCS_7 + DL_RADIO_BLKS_2_TS_MCS_7 + DL_RADIO_BLKS_3_TS_MCS_7 + DL_RADIO_BLKS_4_TS_MCS_7)*112 +(DL_RADIO_BLKS_1_TS_MCS_8 + DL_RADIO_BLKS_2_TS_MCS_8 + DL_RADIO_BLKS_3_TS_MCS_8 + DL_RADIO_BLKS_4_TS_MCS_8)*136 +(DL_RADIO_BLKS_1_TS_MCS_9 + DL_RADIO_BLKS_2_TS_MCS_9 + DL_RADIO_BLKS_3_TS_MCS_9 + DL_RADIO_BLKS_4_TS_MCS_9)*148)*0.8/((DL_TBF_TIME_1_TS + DL_TBF_TIME_2_TS*2 + DL_TBF_TIME_3_TS*3 + DL_TBF_TIME_4_TS*4)*0.02)
UL_MEAN_USER_THROUGHPUT_PER_TIMESLOT = ((UL_RADIO_BLKS_8PSK_1_TS_CS_1 + UL_RADIO_BLKS_8PSK_2_TS_CS_1 + UL_RADIO_BLKS_GMSK_1_TS_CS_1 + UL_RADIO_BLKS_GMSK_2_TS_CS_1)*22 +(UL_RADIO_BLKS_8PSK_1_TS_CS_2 + UL_RADIO_BLKS_8PSK_2_TS_CS_2 + UL_RADIO_BLKS_GMSK_1_TS_CS_2 + UL_RADIO_BLKS_GMSK_2_TS_CS_2)*33 +(UL_RADIO_BLKS_8PSK_1_TS_CS_3 + UL_RADIO_BLKS_8PSK_2_TS_CS_3 + UL_RADIO_BLKS_GMSK_1_TS_CS_3 + UL_RADIO_BLKS_GMSK_2_TS_CS_3)*39 +(UL_RADIO_BLKS_8PSK_1_TS_CS_4 + UL_RADIO_BLKS_8PSK_2_TS_CS_4 + UL_RADIO_BLKS_GMSK_1_TS_CS_4 + UL_RADIO_BLKS_GMSK_2_TS_CS_4)*53 +(UL_RADIO_BLKS_8PSK_1_TS_MCS_1 + UL_RADIO_BLKS_8PSK_2_TS_MCS_1 + UL_RADIO_BLKS_GMSK_1_TS_MCS_1 + UL_RADIO_BLKS_GMSK_2_TS_MCS_1)*22 +(UL_RADIO_BLKS_8PSK_1_TS_MCS_2 + UL_RADIO_BLKS_8PSK_2_TS_MCS_2 + UL_RADIO_BLKS_GMSK_1_TS_MCS_2 + UL_RADIO_BLKS_GMSK_2_TS_MCS_2)*28 +(UL_RADIO_BLKS_8PSK_1_TS_MCS_3 + UL_RADIO_BLKS_8PSK_2_TS_MCS_3 + UL_RADIO_BLKS_GMSK_1_TS_MCS_3 + UL_RADIO_BLKS_GMSK_2_TS_MCS_3)*37 +(UL_RADIO_BLKS_8PSK_1_TS_MCS_4 + UL_RADIO_BLKS_8PSK_2_TS_MCS_4 + UL_RADIO_BLKS_GMSK_1_TS_MCS_4 + UL_RADIO_BLKS_GMSK_2_TS_MCS_4)*44 +(UL_RADIO_BLKS_8PSK_1_TS_MCS_5 + UL_RADIO_BLKS_8PSK_2_TS_MCS_5)*56 +(UL_RADIO_BLKS_8PSK_1_TS_MCS_6 + UL_RADIO_BLKS_8PSK_2_TS_MCS_6)*74 +(UL_RADIO_BLKS_8PSK_1_TS_MCS_7 + UL_RADIO_BLKS_8PSK_2_TS_MCS_7)*112 +(UL_RADIO_BLKS_8PSK_1_TS_MCS_8 + UL_RADIO_BLKS_8PSK_2_TS_MCS_8)*136 +(UL_RADIO_BLKS_8PSK_1_TS_MCS_9 + UL_RADIO_BLKS_8PSK_2_TS_MCS_9)*148)*0.8/
System Performance Group Vienna Page 39/137Motorola Confidential Proprietary

GSD CSISHow to use E/GPRS Statistics
((UL_TBF_TIME_8PSK_1_TS + UL_TBF_TIME_GMSK_1_TS + UL_TBF_TIME_8PSK_2_TS*2 + UL_TBF_TIME_GMSK_2_TS*2)*0.02)
3.2.1.2 THROUGHPUT_PER_TERMINAL_TYPEDescription:This key statistic calculates the TBF throughput performance per terminal type, which relates to the maximum number of timeslots, the corresponding terminal type can utilise. No retransmissions are included, as they effectively reduce the user throughput.E.g. the statistic DL_RADIO_BLKS_2_TS is pegged for mobiles, which support a maximum of 2 timeslots in the downlink:
MS multislot class 2. MS multislot class 3 with 1 Tx timeslots simultaneously active. MS multislot class 5. MS multislot class 6 with 2 Tx timeslots simultaneously active. Multislot class 7, 11 and 12 that support more than 2 timeslots on the uplink will be
treated as 2-uplink capable (Motorola implementation until GSR9)For more examples, see 3GPP TS05.02, Annex B [4].
1 unit represents 1 kbps.
Applicable release: 1740 onwards
Range:The maximum possible RLC throughput values (full utilisation over the stats interval) can be seen in Figure 11. Typical values for these key statistics range from 1 to 20 kbps. Important is not the actual value but the change over time and compared to other network entities of the same level (e.g. cell vs. cell).
Usage:This key statistic can help to identify throughput problems related to a certain terminal type. Other key statistics need to be verified to find the root cause for throughput problems. While the key statistics MEAN_USER_THROUGHPUT_PER_TIMESLOT (see 3.2.1.1) show good throughput per timeslot, it might be that “higher” terminal types (e.g. mobiles capable of 4 DL TS) suffer from timeslot congestion, which prevents the mobiles from getting as many timeslots as they could handle. Please note that the throughput calculation is based on the RADIO_BLKS statistics (see 3.3.1), which count only blocks of successful TBFs. All blocks of abnormally released TBFs and blocks, whose TBFs are not finished when the stats interval is completed are not considered!
Reasons for low throughput are listed in the following chapters (see 3.2.2 onwards)
Formulae:DL_THROUGHPUT_TERMINAL_1_TS =(DL_RADIO_BLKS_1_TS_CS_1*22 + DL_RADIO_BLKS_1_TS_CS_2*33 + DL_RADIO_BLKS_1_TS_CS_3*39 + DL_RADIO_BLKS_1_TS_CS_4*53 + DL_RADIO_BLKS_1_TS_MCS_1*22 + DL_RADIO_BLKS_1_TS_MCS_2*28 +
System Performance Group Vienna Page 40/137Motorola Confidential Proprietary

GSD CSISHow to use E/GPRS Statistics
DL_RADIO_BLKS_1_TS_MCS_3*37 + DL_RADIO_BLKS_1_TS_MCS_4*44 + DL_RADIO_BLKS_1_TS_MCS_5*56 + DL_RADIO_BLKS_1_TS_MCS_6*74 + DL_RADIO_BLKS_1_TS_MCS_7*112 + DL_RADIO_BLKS_1_TS_MCS_8*136 + DL_RADIO_BLKS_1_TS_MCS_9*148)*0.8/ (DL_TBF_TIME_1_TS*0.02)
DL_THROUGHPUT_TERMINAL_2_TS =(DL_RADIO_BLKS_2_TS_CS_1*22 + DL_RADIO_BLKS_2_TS_CS_2*33 + DL_RADIO_BLKS_2_TS_CS_3*39 + DL_RADIO_BLKS_2_TS_CS_4*53 + DL_RADIO_BLKS_2_TS_MCS_1*22 + DL_RADIO_BLKS_2_TS_MCS_2*28 + DL_RADIO_BLKS_2_TS_MCS_3*37 + DL_RADIO_BLKS_2_TS_MCS_4*44 + DL_RADIO_BLKS_2_TS_MCS_5*56 + DL_RADIO_BLKS_2_TS_MCS_6*7 4 + DL_RADIO_BLKS_2_TS_MCS_7*112 + DL_RADIO_BLKS_2_TS_MCS_8*136 + DL_RADIO_BLKS_2_TS_MCS_9*148)*0.8/ (DL_TBF_TIME_2_TS*0.02)
DL_THROUGHPUT_TERMINAL_3_TS =(DL_RADIO_BLKS_3_TS_CS_1*22 + DL_RADIO_BLKS_3_TS_CS_2*33 + DL_RADIO_BLKS_3_TS_CS_3*39 + DL_RADIO_BLKS_3_TS_CS_4*53 + DL_RADIO_BLKS_3_TS_MCS_1*22 + DL_RADIO_BLKS_3_TS_MCS_2*28 + DL_RADIO_BLKS_3_TS_MCS_3*37 + DL_RADIO_BLKS_3_TS_MCS_4*44 + DL_RADIO_BLKS_3_TS_MCS_5*56 + DL_RADIO_BLKS_3_TS_MCS_6*74 + DL_RADIO_BLKS_3_TS_MCS_7*112 + DL_RADIO_BLKS_3_TS_MCS_8*136 + DL_RADIO_BLKS_3_TS_MCS_9*148)*0.8/ (DL_TBF_TIME_3_TS*0.02)
DL_THROUGHPUT_TERMINAL_4_TS =(DL_RADIO_BLKS_4_TS_CS_1*22 + DL_RADIO_BLKS_4_TS_CS_2*33 + DL_RADIO_BLKS_4_TS_CS_3*39 + DL_RADIO_BLKS_4_TS_CS_4*53 + DL_RADIO_BLKS_4_TS_MCS_1*22 + DL_RADIO_BLKS_4_TS_MCS_2*28 + DL_RADIO_BLKS_4_TS_MCS_3*37 + DL_RADIO_BLKS_4_TS_MCS_4*44 + DL_RADIO_BLKS_4_TS_MCS_5*56 + DL_RADIO_BLKS_4_TS_MCS_6*74 + DL_RADIO_BLKS_4_TS_MCS_7*112 + DL_RADIO_BLKS_4_TS_MCS_8*136 + DL_RADIO_BLKS_4_TS_MCS_9*148)*0.8/ (DL_TBF_TIME_4_TS*0.02)
UL_THROUGHPUT_TERMINAL_1_TS =(UL_RADIO_BLKS_8PSK_1_TS_CS_1*22 + UL_RADIO_BLKS_8PSK_1_TS_CS_2*33 + UL_RADIO_BLKS_8PSK_1_TS_CS_3*39 + UL_RADIO_BLKS_8PSK_1_TS_CS_4*53 + UL_RADIO_BLKS_8PSK_1_TS_MCS_1*22 + UL_RADIO_BLKS_8PSK_1_TS_MCS_2*28 + UL_RADIO_BLKS_8PSK_1_TS_MCS_3*37 + UL_RADIO_BLKS_8PSK_1_TS_MCS_4*44 + UL_RADIO_BLKS_8PSK_1_TS_MCS_5*56 + UL_RADIO_BLKS_8PSK_1_TS_MCS_6*74 + UL_RADIO_BLKS_8PSK_1_TS_MCS_7*112 + UL_RADIO_BLKS_8PSK_1_TS_MCS_8*136 + UL_RADIO_BLKS_8PSK_1_TS_MCS_9*148 + UL_RADIO_BLKS_GMSK_1_TS_CS_1*22 + UL_RADIO_BLKS_GMSK_1_TS_CS_2*33 + UL_RADIO_BLKS_GMSK_1_TS_CS_3*39 + UL_RADIO_BLKS_GMSK_1_TS_CS_4*53 + UL_RADIO_BLKS_GMSK_1_TS_MCS_1*22 + UL_RADIO_BLKS_GMSK_1_TS_MCS_2*28 + UL_RADIO_BLKS_GMSK_1_TS_MCS_3*37 + UL_RADIO_BLKS_GMSK_1_TS_MCS_4*44)*0.8/ (UL_TBF_TIME_8PSK_1_TS + UL_TBF_TIME_GMSK_1_TS)*0.02
UL_THROUGHPUT_TERMINAL_2_TS =
System Performance Group Vienna Page 41/137Motorola Confidential Proprietary

GSD CSISHow to use E/GPRS Statistics
(UL_RADIO_BLKS_8PSK_2_TS_CS_1*22 + UL_RADIO_BLKS_8PSK_2_TS_CS_2*33 + UL_RADIO_BLKS_8PSK_2_TS_CS_3*39 + UL_RADIO_BLKS_8PSK_2_TS_CS_4*53 + UL_RADIO_BLKS_8PSK_2_TS_MCS_1*22 + UL_RADIO_BLKS_8PSK_2_TS_MCS_2*28 + UL_RADIO_BLKS_8PSK_2_TS_MCS_3*37 + UL_RADIO_BLKS_8PSK_2_TS_MCS_4*44 + UL_RADIO_BLKS_8PSK_2_TS_MCS_5*56 + UL_RADIO_BLKS_8PSK_2_TS_MCS_6*74 + UL_RADIO_BLKS_8PSK_2_TS_MCS_7*112 + UL_RADIO_BLKS_8PSK_2_TS_MCS_8*136 + UL_RADIO_BLKS_8PSK_2_TS_MCS_9*148 + UL_RADIO_BLKS_GMSK_2_TS_CS_1*22 + UL_RADIO_BLKS_GMSK_2_TS_CS_2*33 + UL_RADIO_BLKS_GMSK_2_TS_CS_3*39 + UL_RADIO_BLKS_GMSK_2_TS_CS_4*53 + UL_RADIO_BLKS_GMSK_2_TS_MCS_1*22 + UL_RADIO_BLKS_GMSK_2_TS_MCS_2*28 + UL_RADIO_BLKS_GMSK_2_TS_MCS_3*37 + UL_RADIO_BLKS_GMSK_2_TS_MCS_4*44)*0.8/ (UL_TBF_TIME_8PSK_2_TS + UL_TBF_TIME_GMSK_2_TS)*0.02
3.2.2 Packet LossIt is not possible to distinguish between a virtually lost packet, i.e. when a packet appears lost due to large delays, and a truly lost packet. The essential question is how long it is worth to wait for one packet. Packet loss can happen in nearly every instance of an End-to-End GPRS network. The following chapter tries to highlight the different scenarios of packet loss and points to BSS statistics, which can help to identify them.
Here is a short list of root causes for packet loss: Cell reselection / LLC discard mechanism BVC buffer overflow Bad RF conditions Out of sequence GTP packet arrival PDU lifetime BSSGP General Protocol Error Handling Gi Interface Gb Interface (Frame Relay) SGSN Node processing capacity
For further discussion on Packet Loss Analysis please see the document Packet Loss Analyis.doc [13].
3.2.2.1 Cell reselection / LLC discard mechanismThe event of standard mobile-controlled cell reselection always leads to packet loss and delay in LLC unacked mode (typical mode). In GSR7 there is no statistic available to count cell reselections and discarded LLC frames. In GSR8 there are statistics, which provide information about number of discarded frames: PDU_DISCARD_FR and PDU_DISCARD_LLC (see 3.3.4.1 and 3.3.4.2).
Here is a list of statistics, which can be consulted for packet loss due to cell reselection / LLC discard mechanism:
System Performance Group Vienna Page 42/137Motorola Confidential Proprietary

GSD CSISHow to use E/GPRS Statistics
PDU_DISCARD_FR (see 3.3.4.1) PDU_DISCARD_LLC (see 3.3.4.2) LLC_ABNORMAL_TBF_RELEASE_RATE (see 3.3.4.3)
3.2.2.2 BVC buffer overflowThe BVC aggregates traffic from several MSs into a common stream and applies the flow control to the aggregate. A problem might occur when a single MS causes high downlink data traffic; the whole PCU BVC buffer gets filled as shown in Figure 13.
The blue line represents the BVC bugger level, filled with packets and increasing over time, which is overflowed as soon as the packets contained in the buffer reaching the maximum limit represented by the red line.
Figure 13 - BVC Buffer Overflow
The statistic to check for BVC buffer overflow is PDU_DISCARD_LLC. Two of its bins (PDU_DSCRD_LLC_CELL_BUF_OVRFLW, PDU_DSCRD_LLC_MS_BUF_OVRFLW) peg discarded LLC frames due to buffer overflow (see 3.3.4.2)
3.2.2.3 Bad RF conditionsDirect impacts of bad RF conditions are an increased block error rate (BLER stats, see 3.5.1) and thus a change in the Coding Scheme Usage statistics distribution and BANDWIDTH_INDICATOR (see 3.5.2). Check these statistics to see whether there is a relationship of throughput degradation and packet loss due to bad RF.
System Performance Group Vienna Page 43/137Motorola Confidential Proprietary

GSD CSISHow to use E/GPRS Statistics
3.2.2.4 Out of sequence GTP packet arrivalNo BSS statistics exist for this problem on the Gn interface. SGSN statistics might exist, however.
3.2.2.5 PDU lifetimePDU lifetime defines the remaining time period that the PDU is considered as valid within the BSS. If a PDU is held for a period exceeding the “PDU Lifetime” time period, the PDU is locally discarded. There is no BSS or SGSN statistic for this type of event.
3.2.2.6 BSSGP General Protocol Error HandlingIn the BSSGP layer as specified in the ETSI recommendation, any BSSGP data packet or signalling packet that doesn’t have the Information Element set properly is eligible to be discarded.
No BSS statistics exist for BSSGP discards on Gb. SGSN statistics might exist, however.
3.2.2.7 Gi InterfacePacket loss may also happen in the Gi-interface, where it connects the GGSN with the outside Public Data Network. Especially in corporate intranet systems, various routers with fairly high traffic and complex routing policies exist.
Packets are often dropped because of congestion along the path from the server to the GGSN. If there is not enough buffer space in one of the routers then queue buffer overflow will occur. A router usually has incoming interface buffers, system buffers and outgoing interface buffers. Depending on where a packet is dropped, it is called an input drop or an output drop. Input drops usually occur when the router can't process packets fast enough, while output drops occur when the outgoing link is too busy.
No BSS statistics exist to detect packet loss due to Gi congestion. GSN statistics might exist, however.
3.2.2.8 Gb Interface (Frame Relay)The Gb-Interface, which uses a Frame Relay connection, is also prone to packet loss.
Three possible scenarios exist, which result in packet loss on Gb:1. During peak traffic periods the traffic shaping mechanism within Frame Relay can mark
frame relay packets with DE (discard eligible). In such cases the frame relay network may not route this packet to its destination. No BSS statistic exists for this type of packet loss as the packet is never seen on the BSS.
System Performance Group Vienna Page 44/137Motorola Confidential Proprietary

GSD CSISHow to use E/GPRS Statistics
2. Packet loss due to CRC errors: This is easily noticeable in the network analyser tool such as RADCOM or Tektronix-K1205. The cell statistic PDU_DSCRD_FR_DL_CRC (see 3.3.4.1) counts discarded frames due to CRC errors.
3. An SNDCP packet is segmented into several LLC PDUs. If one or more LLC PDUs are missing the SNDCP packet fails to be reconstructed by the other end and gets deleted. The GSR8 statistic PDU_DISCARD_FR (see 3.3.4.1) has bins which track this case. Also, the tool Gbsnoop [15] can be used for frame relay analysis.
3.2.2.9 SGSN Node processing capacityWhen the maximum SGSN Node processing capacity is reached due to high GPRS traffic, the SGSN will drop packets.
No BSS statistic exists for this type of packet loss. SGSN statistics might exist, however.
3.2.3 RLC EfficiencyEven without losing packets the throughput can be affected by ineffective RLC transmission.
The following problems decrease the efficiency on RLC layer:
Retransmissions on RLC layer Short TBFs - Blocks per TBF
The following items do not decrease the efficiency on RLC layer: SCT blocks Auto Downlink blocks Unassigned block periods Control blocks
In GSR6 the AIR_BLOCK statistics used to include the SCT blocks (CS-1 RLC data blocks containing dummy LLC frames. There was also a bug which caused DL dummy control blocks used to assign UL blocks to be counted as well, therefore they were not reliable. In GSR7 1740 onwards, however, dummy blocks peg into a separate RLC block statistic: DL_RLC_DDTR_BLKS (see 3.3.1). The RADIO_BLKS statistic (see 3.3.1) pegs only for user data blocks anyway.
3.2.3.1 Retransmissions on RLC layerRLC block retransmissions can be caused by:
Pre-emptive retransmission feature RLC block loss – Negatively ACKed RLC data block RLC transmit window stall – congestion on RLC
System Performance Group Vienna Page 45/137Motorola Confidential Proprietary

GSD CSISHow to use E/GPRS Statistics
3.2.3.1.1 Pre-emptive retransmissionsAt the end of a DL TBF, when all data has been sent to the MS, the PCU has to wait for the final PDAN message of the MS. During this time the air interface resources can be idle if they aren’t used for other mobiles. The Motorola PCU uses this time to retransmit the last unacknowledged blocks.In the case, that these blocks have not been received successfully, they already have been retransmitted and the whole transmission is accelerated. This is to ensure the block is received successful to avoid any possible re-transmission for the whole data block which will slow down the user throughput.
The statistics DL_RLC_RETX_BLKS and UL_RLC_RETX_BLKS (see 3.3.1) count the number of pre-emptive retransmissions (or ACK pending blocks and acknowledged retransmissions).
Pre-emptive retransmissions are not performance affecting but the retransmissions of NACKd RLC blocks (in case of acknowledged RLC mode) introduce jitter and delay. There is no BSS statistic which helps analysing jitter, though. For more information on Jitter Analysis see [13] and [14].
3.2.3.1.2 RLC block lossTo check the explicitly NACKd blocks, which cause retransmissions the statistic DL_RLC_NACK_BLKS (see 3.3.1) can be used.
3.2.3.1.3 RLC transmit window stallsTransmit window stalls happen when the amount of transmitted blocks waiting for acknowledgement exceeds the RLC window size, which is 64 for GPRS and 512 for EGPRS. The mobile timer T3182 starts when the window stall is detected. When it expires, the mobile performs an abnormal TBF release with access retry or cell reselection, depending on the state of N3102.
The statistic DL_RLC_STALL_BLKS (see 3.3.1) count the number of stalled blocks, while the key statistic DL_RLC_MAC_WINDOW_STALL (see 3.3.6) gives a percentage of stalled compared to newly acknowledged blocks.
3.2.3.2 Short TBFs - Blocks per TBFThe initial CS can be configured (parameters init_dl_cs, init_ul_cs, egprs_init_dl_cs, egprs_init_ul_cs) but normally it is either CS-1 or CS-2 (EDGE: MCS-3).The average coding scheme utilisation (key statistics CS-Usage, see 3.5.2) is very dependent on the duration of TBFs (see 3.3.7.2). Short TBFs distort the coding scheme usage stats towards lower values because the initial coding scheme is low. Only long TBFs average this effect out.
The key statistics CS-Usage (see 3.5.2.1) and Bandwidth Indicator (see 3.5.2.3) can be checked against Mean TBF Duration (see 3.3.7.2). A high amount of short TBFs can explain a high CS-1 Usage. The correlation of DL Bandwidth Indicator vs. DL Mean TBF Duration can be seen in Figure 14. It can be seen that the longer the DL TBFs last in average, the higher the average
System Performance Group Vienna Page 46/137Motorola Confidential Proprietary

GSD CSISHow to use E/GPRS Statistics
coding scheme is. The correlation of DL CS-1 Usage vs. DL Mean TBF Duration (see Figure 15) shows the direct impact of the initial coding scheme.
If this correlation is not clearly visible over a series of stats intervals further analysis is required to see whether bad RF quality leads to coding scheme demotion (see 3.2.4.3 and 3.5.2).
0
10
20
30
40
50
60
0 5 10 15 20 25 30 35 40
DL Mean TBF Duration (s)
DL B
andw
idth
Indi
cato
r (by
tes)
DL Bandwidth Indicator vs.DL Mean TBF Duration
CS-1
CS-2
CS-3
CS-4
Figure 14- Correlation Chart: DL Bandwidth Indicator vs. DL Mean TBF Duration
System Performance Group Vienna Page 47/137Motorola Confidential Proprietary

GSD CSISHow to use E/GPRS Statistics
0
1
2
3
4
5
6
71
1.1
1.2
1.3
1.4
1.5
1.6
1.7
1.8
1.9
Dl Mean TBF Duration (s)
DL C
S-1
Usag
e (%
)
DL CS-1 Usage vs. DL MeanTBF Duration
Linear (DL CS-1 Usage vs.DL Mean TBF Duration)
Figure 15 - Correlation Chart: DL CS-1 Usage vs. DL Mean TBF Duration
3.2.3.3 SCT blocksSuper coat-tailing keeps the DL TBF of an MS open by transmitting CS-1 DL RLC data blocks containing DL dummy LLC frames for the duration specified by the BSS parameter delay_dl_rel_dur (in number of 20ms block periods). In DL, the MS can receive further data immediately, effectively reducing the DL TBF setup time to zero while SCT is running. As the polling bit is set in each DL dummy data block, the MS has to answer every time with a PDAN, in which the MS can request an UL TBF, thus also reducing the UL TBF establishment time. The dummy blocks are always sent at CS1 to ensure, that the MS can decode them even under adverse RF conditions.
In pre-GSR7 releases the SCT blocks were included in the AIR_xL_DATA_BLKS, thus affecting the coding scheme usage and user throughput calculation. In GSR7 1740 onwards the RADIO_BLKS and RLC_BLKS statistics (see 3.3.1) exclude the SCT blocks (RADIO_BLKS stat) or put them into a separate bin (RLC_BLKS stat) so that they don’t affect the user throughput and coding scheme usage calculation. The statistic DL_RLC_DDTR_BLKS pegs for DL dummy blocks.
3.2.3.4 Auto Downlink blocksThe auto downlink mechanism allows the automatic establishment of a downlink TBF as soon as an uplink TBF has been established. The PCU sends CS-1 DL RLC data blocks containing
System Performance Group Vienna Page 48/137Motorola Confidential Proprietary
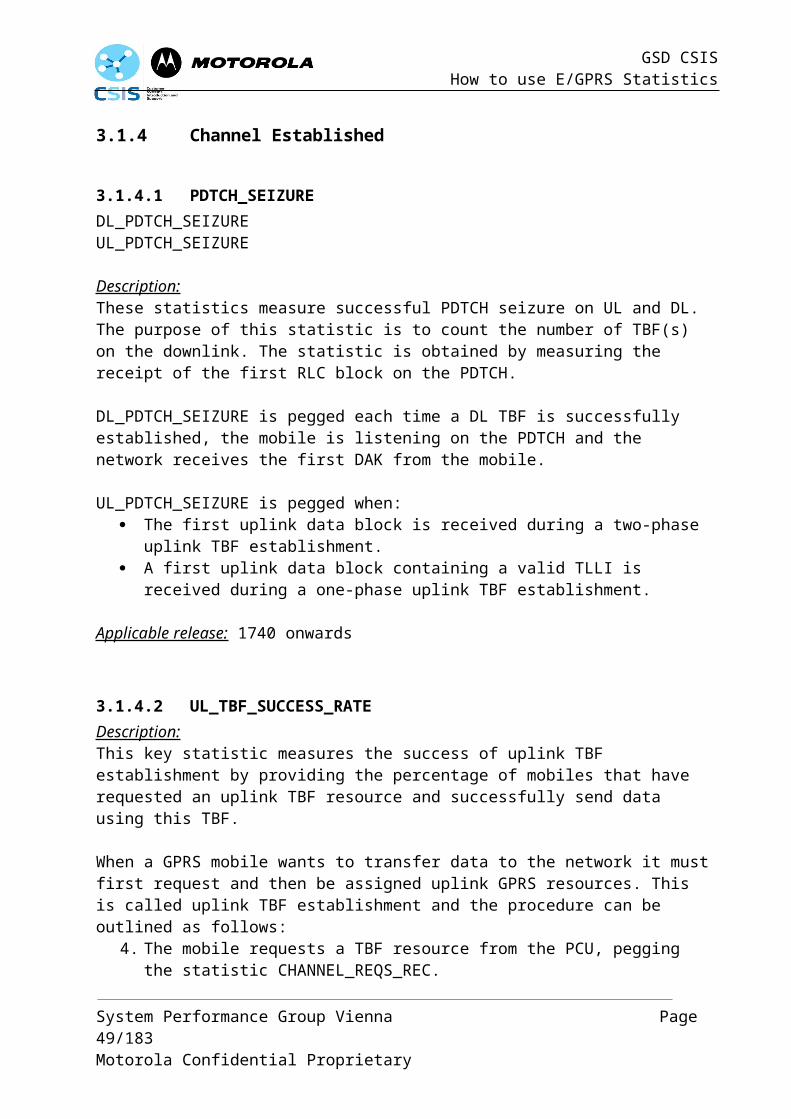
GSD CSISHow to use E/GPRS Statistics
dummy LLC frames for the duration of a configurable number of 20ms block periods (parameter auto_dl_dur). After the timer expires, the downlink TBF gets released if no block is sent so far.
It is the same mechanism as in SCT; the DL RLC blocks containing dummy LLC frames are excluded from the RADIO_BLK and RLC_BLK statistics (see 3.3.1), so that they don’t affect the user throughput and coding scheme usage calculation. The statistic DL_RLC_DDTR_BLKS pegs for DL blocks containing dummy LLC frames.
3.2.4 Bandwidth ReductionThe highest possible throughput a user can achieve in a specific cell is, when the user MS’s capability (MS multislot class) is not limited by the cell’s bandwidth. As soon as the bandwidth is limited the user experiences a degradation below the performance he’s/she’s grown accustomed to.
3.2.4.1 PDCH ReductionA reduction of available PDCHs can be be caused by either a resource outage or by “timeslot stealing”.
Timeslot stealing can have two reasons:Switchable GPRS PDCHs are reconfigured to GSM timeslots, when the number of idle GSM TCHs are reduced below a threshold specified by the BSS parameter gprs_reconfig_thresh_idle_tch. The dynamic channel reconfiguration feature (cell parameter channel_reconfiguration_switch), which can even take the last reserved PDCH!
Both cases can be detected with the statistics AVAIL_PDTCH (see 3.4.3.3). Timeslot stealing on 16k, 32k and 64k TRAUs can be see seen with the statistics GPRS_CHANNELS_SWITCHED, GPRS_32K_CHANNELS_SWITCHED and EGPRS_64K_CHANNELS_SWITCHED (see 3.4.3.18)
3.2.4.2 TBF InterleavingThe TBF scheduler within the PCU tries to make best use of the cell’s resources and can either decide to reduce the number of PDCHs allocated to a user or to interleave the TBFs onto the same resources. Up to 4 TBFs can share the same PDCH, thus reducing the TBF performance to ¼.
The key statistic TBF Interleaving Activity (see 3.4.3.13) can be used to check the approximate amount of interleaving over the duration of a stats interval.
System Performance Group Vienna Page 49/137Motorola Confidential Proprietary

GSD CSISHow to use E/GPRS Statistics
3.2.4.3 Coding Scheme DemotionCoding scheme demotion indicates an increased BLER (see 3.5.1 and 3.5.2). As soon as RLC blocks are lost or corrupted the CS selection algorithm reduces the coding scheme to increase the error protection and thus the likeliness, that erroneous blocks can be corrected.
The key statistics Coding Scheme Usage (see 3.5.2.1) and Bandwidth Indicator (see 3.5.2.3) can be used to verify the distribution of coding schemes and the mean block size (which indicates the mean coding scheme).
3.2.5 Abnormal TBF ReleasesAbnormal TBF releases because of cell reselection are normal in NC0/NC1 mode. All abnormal TBF releases peg the TBF_FAILURES statistics (see 3.3.5). To see the amount of cell reselections the GPRS trace facility and CTP-G can be used, which is available in GSR8.
3.2.6 Short TBFsSee 3.2.3.2.
System Performance Group Vienna Page 50/137Motorola Confidential Proprietary

GSD CSISHow to use E/GPRS Statistics
3.3 TrafficThis chapter contains statistics related to traffic size, amount and duration.
Traffic related statistics and key stats can be used to prioritise cells according to their importance and to verify, whether enough RLC packets are available during the selected time and network element granularity to ensure the required level of statistical confidence (see chapter 1.2.1).
Note: Traffic should not be the only measure for prioritising cells as cells with serious channel-setup problems won’t get high priority. A concept of ranking can be seen in chapter 2.
3.3.1 RLC_BLKS and RADIO_BLKS
Since GSR7 the AIR_xL_DATA_BLKS statistics have been replaced by two new vast sets of statistics:
RADIO_BLKS
System Performance Group Vienna Page 51/137Motorola Confidential Proprietary

DL_RADIO_BLKS_1_TSDL_RADIO_BLKS_1_TS_CS_1DL_RADIO_BLKS_1_TS_CS_2DL_RADIO_BLKS_1_TS_CS_3DL_RADIO_BLKS_1_TS_CS_4DL_RADIO_BLKS_1_TS_MCS_1DL_RADIO_BLKS_1_TS_MCS_2DL_RADIO_BLKS_1_TS_MCS_3DL_RADIO_BLKS_1_TS_MCS_4DL_RADIO_BLKS_1_TS_MCS_5DL_RADIO_BLKS_1_TS_MCS_6DL_RADIO_BLKS_1_TS_MCS_7DL_RADIO_BLKS_1_TS_MCS_8DL_RADIO_BLKS_1_TS_MCS_9DL_RADIO_BLKS_2_TSDL_RADIO_BLKS_2_TS_CS_1DL_RADIO_BLKS_2_TS_CS_2DL_RADIO_BLKS_2_TS_CS_3DL_RADIO_BLKS_2_TS_CS_4DL_RADIO_BLKS_2_TS_MCS_1DL_RADIO_BLKS_2_TS_MCS_2DL_RADIO_BLKS_2_TS_MCS_3DL_RADIO_BLKS_2_TS_MCS_4DL_RADIO_BLKS_2_TS_MCS_5DL_RADIO_BLKS_2_TS_MCS_6DL_RADIO_BLKS_2_TS_MCS_7DL_RADIO_BLKS_2_TS_MCS_8DL_RADIO_BLKS_2_TS_MCS_9
DL_RADIO_BLKS_3_TSDL_RADIO_BLKS_3_TS_CS_1DL_RADIO_BLKS_3_TS_CS_2DL_RADIO_BLKS_3_TS_CS_3DL_RADIO_BLKS_3_TS_CS_4DL_RADIO_BLKS_3_TS_MCS_1DL_RADIO_BLKS_3_TS_MCS_2DL_RADIO_BLKS_3_TS_MCS_3DL_RADIO_BLKS_3_TS_MCS_4DL_RADIO_BLKS_3_TS_MCS_5DL_RADIO_BLKS_3_TS_MCS_6DL_RADIO_BLKS_3_TS_MCS_7DL_RADIO_BLKS_3_TS_MCS_8DL_RADIO_BLKS_3_TS_MCS_9DL_RADIO_BLKS_4_TSDL_RADIO_BLKS_4_TS_CS_1DL_RADIO_BLKS_4_TS_CS_2DL_RADIO_BLKS_4_TS_CS_3DL_RADIO_BLKS_4_TS_CS_4DL_RADIO_BLKS_4_TS_MCS_1DL_RADIO_BLKS_4_TS_MCS_2DL_RADIO_BLKS_4_TS_MCS_3DL_RADIO_BLKS_4_TS_MCS_4DL_RADIO_BLKS_4_TS_MCS_5DL_RADIO_BLKS_4_TS_MCS_6DL_RADIO_BLKS_4_TS_MCS_7DL_RADIO_BLKS_4_TS_MCS_8DL_RADIO_BLKS_4_TS_MCS_9
UL_RADIO_BLKS_8PSK_1_TSUL_RADIO_BLKS_8PSK_1_TS_CS_1UL_RADIO_BLKS_8PSK_1_TS_CS_2UL_RADIO_BLKS_8PSK_1_TS_CS_3UL_RADIO_BLKS_8PSK_1_TS_CS_4UL_RADIO_BLKS_8PSK_1_TS_MCS_1UL_RADIO_BLKS_8PSK_1_TS_MCS_2UL_RADIO_BLKS_8PSK_1_TS_MCS_3UL_RADIO_BLKS_8PSK_1_TS_MCS_4UL_RADIO_BLKS_8PSK_1_TS_MCS_5UL_RADIO_BLKS_8PSK_1_TS_MCS_6UL_RADIO_BLKS_8PSK_1_TS_MCS_7UL_RADIO_BLKS_8PSK_1_TS_MCS_8UL_RADIO_BLKS_8PSK_1_TS_MCS_9UL_RADIO_BLKS_8PSK_2_TSUL_RADIO_BLKS_8PSK_2_TS_CS_1UL_RADIO_BLKS_8PSK_2_TS_CS_2UL_RADIO_BLKS_8PSK_2_TS_CS_3UL_RADIO_BLKS_8PSK_2_TS_CS_4UL_RADIO_BLKS_8PSK_2_TS_MCS_1UL_RADIO_BLKS_8PSK_2_TS_MCS_2UL_RADIO_BLKS_8PSK_2_TS_MCS_3UL_RADIO_BLKS_8PSK_2_TS_MCS_4UL_RADIO_BLKS_8PSK_2_TS_MCS_5UL_RADIO_BLKS_8PSK_2_TS_MCS_6UL_RADIO_BLKS_8PSK_2_TS_MCS_7UL_RADIO_BLKS_8PSK_2_TS_MCS_8UL_RADIO_BLKS_8PSK_2_TS_MCS_9
RLC_BLKSDL_RLC_ACK_NEW_BLKSDL_RLC_ACK_NEW_BLKS_CS_1DL_RLC_ACK_NEW_BLKS_CS_2DL_RLC_ACK_NEW_BLKS_CS_3DL_RLC_ACK_NEW_BLKS_CS_4DL_RLC_ACK_NEW_BLKS_MCS_1DL_RLC_ACK_NEW_BLKS_MCS_2DL_RLC_ACK_NEW_BLKS_MCS_3DL_RLC_ACK_NEW_BLKS_MCS_4DL_RLC_ACK_NEW_BLKS_MCS_5DL_RLC_ACK_NEW_BLKS_MCS_6DL_RLC_ACK_NEW_BLKS_MCS_7DL_RLC_ACK_NEW_BLKS_MCS_8DL_RLC_ACK_NEW_BLKS_MCS_9DL_RLC_UNACK_NEW_BLKSDL_RLC_UNACK_NEW_BLKS_CS_1DL_RLC_UNACK_NEW_BLKS_CS_2DL_RLC_UNACK_NEW_BLKS_CS_3DL_RLC_UNACK_NEW_BLKS_CS_4DL_RLC_UNACK_NEW_BLKS_MCS_1DL_RLC_UNACK_NEW_BLKS_MCS_2DL_RLC_UNACK_NEW_BLKS_MCS_3DL_RLC_UNACK_NEW_BLKS_MCS_4DL_RLC_UNACK_NEW_BLKS_MCS_5DL_RLC_UNACK_NEW_BLKS_MCS_6DL_RLC_UNACK_NEW_BLKS_MCS_7DL_RLC_UNACK_NEW_BLKS_MCS_8DL_RLC_UNACK_NEW_BLKS_MCS_9DL_RLC_RETX_BLKSDL_RLC_RETX_BLKS_CS_1DL_RLC_RETX_BLKS_CS_2DL_RLC_RETX_BLKS_CS_3DL_RLC_RETX_BLKS_CS_4DL_RLC_RETX_BLKS_MCS_1DL_RLC_RETX_BLKS_MCS_2DL_RLC_RETX_BLKS_MCS_3DL_RLC_RETX_BLKS_MCS_4DL_RLC_RETX_BLKS_MCS_5
DL_RLC_RETX_BLKS_MCS_6DL_RLC_RETX_BLKS_MCS_7DL_RLC_RETX_BLKS_MCS_8DL_RLC_RETX_BLKS_MCS_9DL_RLC_STALLED_BLKSDL_RLC_STALLED_BLKS_CS_1DL_RLC_STALLED_BLKS_CS_2DL_RLC_STALLED_BLKS_CS_3DL_RLC_STALLED_BLKS_CS_4DL_RLC_STALLED_BLKS_MCS_1DL_RLC_STALLED_BLKS_MCS_2DL_RLC_STALLED_BLKS_MCS_3DL_RLC_STALLED_BLKS_MCS_4DL_RLC_STALLED_BLKS_MCS_5DL_RLC_STALLED_BLKS_MCS_6DL_RLC_STALLED_BLKS_MCS_7DL_RLC_STALLED_BLKS_MCS_8DL_RLC_STALLED_BLKS_MCS_9DL_RLC_NACK_BLKSDL_RLC_NACK_BLKS_CS_1DL_RLC_NACK_BLKS_CS_2DL_RLC_NACK_BLKS_CS_3DL_RLC_NACK_BLKS_CS_4DL_RLC_NACK_BLKS_MCS_1DL_RLC_NACK_BLKS_MCS_2DL_RLC_NACK_BLKS_MCS_3DL_RLC_NACK_BLKS_MCS_4DL_RLC_NACK_BLKS_MCS_5DL_RLC_NACK_BLKS_MCS_6DL_RLC_NACK_BLKS_MCS_7DL_RLC_NACK_BLKS_MCS_8DL_RLC_NACK_BLKS_MCS_9UL_RLC_ACK_NEW_BLKSUL_RLC_ACK_NEW_BLKS_CS_1UL_RLC_ACK_NEW_BLKS_CS_2UL_RLC_ACK_NEW_BLKS_CS_3UL_RLC_ACK_NEW_BLKS_CS_4UL_RLC_ACK_NEW_BLKS_MCS_1
UL_RLC_ACK_NEW_BLKS_MCS_2UL_RLC_ACK_NEW_BLKS_MCS_3UL_RLC_ACK_NEW_BLKS_MCS_4UL_RLC_ACK_NEW_BLKS_MCS_5UL_RLC_ACK_NEW_BLKS_MCS_6UL_RLC_ACK_NEW_BLKS_MCS_7UL_RLC_ACK_NEW_BLKS_MCS_8UL_RLC_ACK_NEW_BLKS_MCS_9UL_RLC_UNACK_NEW_BLKSUL_RLC_UNACK_NEW_BLKS_CS_1UL_RLC_UNACK_NEW_BLKS_CS_2UL_RLC_UNACK_NEW_BLKS_CS_3UL_RLC_UNACK_NEW_BLKS_CS_4UL_RLC_UNACK_NEW_BLKS_MCS_1UL_RLC_UNACK_NEW_BLKS_MCS_2UL_RLC_UNACK_NEW_BLKS_MCS_3UL_RLC_UNACK_NEW_BLKS_MCS_4UL_RLC_UNACK_NEW_BLKS_MCS_5UL_RLC_UNACK_NEW_BLKS_MCS_6UL_RLC_UNACK_NEW_BLKS_MCS_7UL_RLC_UNACK_NEW_BLKS_MCS_8UL_RLC_UNACK_NEW_BLKS_MCS_9UL_RLC_RETX_BLKSUL_RLC_RETX_BLKS_CS_1UL_RLC_RETX_BLKS_CS_2UL_RLC_RETX_BLKS_CS_3UL_RLC_RETX_BLKS_CS_4UL_RLC_RETX_BLKS_MCS_1UL_RLC_RETX_BLKS_MCS_2UL_RLC_RETX_BLKS_MCS_3UL_RLC_RETX_BLKS_MCS_4UL_RLC_RETX_BLKS_MCS_5UL_RLC_RETX_BLKS_MCS_6UL_RLC_RETX_BLKS_MCS_7UL_RLC_RETX_BLKS_MCS_8UL_RLC_RETX_BLKS_MCS_9
Both peg in 100 blocks, which means that every 100 blocks of a specific type the relevant counter is increased by 1. If there is less than 100 blocks of a specific type the relevant counter pegs 0.
This leaves the user with the question:
Motorola Confidential Proprietary
This document and the information contained in it is CONFIDENTIAL INFORMATION of Motorola, and shall not be used, published, disclosed, or disseminated outside Motorola in whole or in part without Motorola´s consent. This document contains trade secrets of Motorola.
Reverse engineering of any or all of the information in this document is prohibited. The copyright notice does not imply publication of the document

GSD CSISHow to use E/GPRS Statistics
Which block counters to use?
Here is a short summary of the properties, these stats have:
RADIO_BLKS – End user performance Only data blocks (no retransmissions, SCT, control blocks) Separate pegging for terminal type (1, 2, 3, 4 TS used) Separate pegging for all coding schemes Only blocks of successful TBFs are considered. This can be a drawback. TBFs which
are failing after some time are not tracked in this statistics. Possible causes:o Happens frequently: Some mobiles don’t ack the FIN acknowledgement and these
end with abnormal TBF releases even that the user got all the data. The amount of times this happens can be estimated in the TBF_FAILURES statistics (see 3.3.5) in the termination bin.
o Less frequent: Cell reselections (they also cause abnormal TBF releases).
RLC_BLKS – System performance Separate pegging for all coding schemes Separate pegging of several RLC block types
o Number of new Acknowledge Mode (AM) blockso Number of delayed downlink TBF release (Super coat-tail) blockso Number of retransmitted AM blockso Number of NACKed blockso Number of stalled blockso Number of new Unacknowledge Mode (UM) blocks
Blocks of unsuccessful TBFs (failed at some point) are counted.
Compared to RLC_ACK_NEW_BLKS the RADIO_BLKS statistics have a major flaw: They don’t include blocks of unsuccessful TBFs, which means that all moving mobiles, which perform cell reselections are not considered at all. Therefore the total number of RADIO_BLKS needs to be compared to the total number of RLC_ACK_NEW_BLKS to check, whether the number of affected blocks is tolerable or not.
RADIO_BLKS stats have been created for throughput calculations – every other (traffic-related) analysis should use the RLC_BLKS stats.
3.3.1.1 The anatomy of block statisticsFigure 16 shows a BSC summary of 3 statistics:
DL Radio Blocks = (Sum of all DL_RADIO_BLKS stats)*100 DL_Rlc_Ack_New_Blks = (Sum of all DL_RLC_ACK_NEW_BLKS)*100 DL RLC/MAC Overhead = ((DL_RLC_DDTR_BLKS + DL_RLC_RETX_BLKS +
DL_RLC_NACK_BLKS)*100 +AIR_DL_CONTROL_BLKS)*100/(DL_RLC_ACK_NEW_BLKS + DL_RLC_DDTR_BLKS + DL_RLC_RETX_BLKS + DL_RLC_NACK_BLKS)
System Performance Group Vienna Page 53/137Motorola Confidential Proprietary

GSD CSISHow to use E/GPRS Statistics
It can be clearly seen that both block (RLC and RADIO block) statistics peg in a similar way, sometimes slightly shifted. That comes from the fact, that RADIO_BLKS peg only after a TBF is finished. All the TBFs that are active over interval boundaries get pegged in the next interval while RLC_BLKS peg in the previous one. Only in three intervals (07FEB2005:09:30:00-10:00:00) there is a discrepancy between RLC and Radio Block statistics. During this time a drive test with a 50MB FTP download has been performed in three cells (out of 130 cells in this BSC!). Because of the frequent cell reselections the TBFs got abnormally released and thus didn’t peg the RADIO_BLKS stats.
This example shows the problem with RADIO_BLKS stats very well. Some key statistics use RLC block stats, some use RADIO_BLKS stats; in order to interpret them correctly, one has to check the difference between the blocks stats!
Another interesting thing can be seen in Figure 16: Sometimes a slight increase in the total number of blocks leads to a significant reduction of RLC/MAC Overhead (from >70% to <50%). Why?
0
100000
200000
300000
400000
500000
600000
700000
800000
07FE
B20
05:0
0:00
:00
03:0
0:00
06:0
0:00
09:0
0:00
12:0
0:00
15:0
0:00
18:0
0:00
21:0
0:00
08FE
B20
05:0
0:00
:00
03:0
0:00
06:0
0:00
09:0
0:00
12:0
0:00
15:0
0:00
18:0
0:00
21:0
0:00
09FE
B20
05:0
0:00
:00
03:0
0:00
06:0
0:00
09:0
0:00
12:0
0:00
15:0
0:00
18:0
0:00
21:0
0:00
Date_Time
DL B
lock
s
0
10
20
30
40
50
60
70
80
90
100
DL R
LC/M
AC O
verh
ead
[%]
DL RLC ACK NEW Blocks
DL Radio Blocks
DL RLC/MAC Overhead [%]
only slight increase oftotal number of blocks...
...significant reductionof RLC/MAC Overhead
HugediscrepancybetweenRLC andRadio blocks
RLC and RadioBlocks slightlyshifted
Figure 16 - DL Radio Blocks vs. DL RLC blocks
The reason can be seen in Figure 17. As soon as TBFs last longer the number of blocks per TBF increases, which lead to a better utilisation of resources (see also the reduction of % SCT blocks). In the highlighted intervals the number of downlink radio blocks per TBF is increased by more than 500% (from 15 to 85 blocks/TBF).
System Performance Group Vienna Page 54/137Motorola Confidential Proprietary
why?

GSD CSISHow to use E/GPRS Statistics
0
10
20
30
40
50
60
70
80
90
07FE
B20
05:0
0:00
:00
03:0
0:00
06:0
0:00
09:0
0:00
12:0
0:00
15:0
0:00
18:0
0:00
21:0
0:00
08FE
B20
05:0
0:00
:00
03:0
0:00
06:0
0:00
09:0
0:00
12:0
0:00
15:0
0:00
18:0
0:00
21:0
0:00
09FE
B20
05:0
0:00
:00
03:0
0:00
06:0
0:00
09:0
0:00
12:0
0:00
15:0
0:00
18:0
0:00
21:0
0:00
Date_Time
Mea
n DL
Rad
io B
lock
s/TB
F
0
1
2
3
4
5
6
Mea
n DL
TBF
Dur
atio
n [s
], %
SCT
blo
cks
Mean DL Radio Blocks per TBF
Mean DL TBF Duration
% SCT blocks- More Radio Blocks per TBF- Longer TBFs- Less % of Super Coattail Blocks
Figure 17 - Mean DL TBF Radio Blocks per TBF vs DL TBF Duration
The example above shows the complexity of interaction between different (key) statistics. The dependency of meaningful data from the number of RLC blocks shows the importance of deciding whether enough blocks are available to give a good indication of performance.
3.3.2 RLC Control blocksThe control blocks statistics peg basically the signalling messages necessary to control the management of resources.
Range:The amount of signalling messages up to the PCU algorithms.
Usage: The number of control blocks is important to calculate the RLC/MAC Overhead key statistic (see 3.4.5.1). The shorter the average TBF is, the higher is the percentage of overhead (control, retransmitted, super coat-tail and NACK’d) blocks.
System Performance Group Vienna Page 55/137Motorola Confidential Proprietary

GSD CSISHow to use E/GPRS Statistics
3.3.2.1 AIR_DL_CONTROL_BLKSThe AIR_DL_CONTROL_BLKS statistic tracks the number of downlink control RLC blocks sent by PCU. Examples for downlink control blocks are:
Packet Uplink ACK/NACK Packet Uplink Assignment Packet Downlink Assignment Packet Timeslot Reconfigure Packet Power Control/Timing Advance Packet Cell Change Order
This statistic also pegs for retransmissions of DL control blocks.
3.3.2.2 AIR_UL_CONTROL_BLKSThe AIR_UL_CONTROL_BLKS statistic tracks the number of uplink control RLC blocks received by the PCU. Examples for Uplink control blocks are:
Packet Downlink ACK/NACK Packet Control Acknowledgment Packet Resource Request Uplink Dummy Control Block
This statistic also pegs for retransmissions of UL control blocks.
3.3.3 LLC FramesThe new LLC frame stats available in GSR8 consist of the following statistics:
DL_LLC_FRAMES_GBDL_LLC_FRAMES_PCUUL_LLC_FRAMESDL_LLC_DATA_VOLUMEUL_LLC_DATA_VOLUME
Please note that DL_LLC_DATA_VOLUME and UL_LLC_DATA_VOLUME are related to the GSR8 QoS feature and currently not included in this doc.
3.3.3.1 DL_LLC_FRAMES_GBDescription:This cell statistic counts the total number of downlink LLC frames correctly received from SGSN over the Gb link.
System Performance Group Vienna Page 56/137Motorola Confidential Proprietary

GSD CSISHow to use E/GPRS Statistics
Name Bin # RangeDL_LLC_FRAMES_GB Sum of all binsDL_LLC_FRAMES_GB_20 0 0-20DL_LLC_FRAMES_GB_40 1 21-40DL_LLC_FRAMES_GB_80 2 41-80DL_LLC_FRAMES_GB_160 3 81-160DL_LLC_FRAMES_GB_320 4 161-320DL_LLC_FRAMES_GB_640 5 321-640DL_LLC_FRAMES_GB_1280 6 641-1280DL_LLC_FRAMES_GB_OVER1280 7 1281 and up
1 unit represents 10 LLC frames.
Applicable release: 1800
Range:This statistic counts absolute numbers, so it hard to provide a range. The more LLC frames are sent over the Gb interface the more bandwidth is needed on Gb.
Usage:Each bin represents an LLC frame size. This statistic can be used to approximately calculate the DL LLC traffic volume (see 3.3.3.6). Another application is calculating the rate of LLC Abnormal TBF Releases (see 3.3.4.3), excluding abnormal TBF releases due to cell reselections.
3.3.3.2 DL_LLC_FRAMES_PCUDescription:This cell statistic counts the total number of downlink LLC frames correctly received from another cell managed by the same PCU.
Name Bin # RangeDL_LLC_FRAMES_PCU Sum of all binsDL_LLC_FRAMES_PCU_20 0 0-20DL_LLC_FRAMES_PCU_40 1 21-40DL_LLC_FRAMES_PCU_80 2 41-80DL_LLC_FRAMES_PCU_160 3 81-160DL_LLC_FRAMES_PCU_320 4 161-320DL_LLC_FRAMES_PCU_640 5 321-640DL_LLC_FRAMES_PCU_1280 6 641-1280DL_LLC_FRAMES_PCU_OVER1280 7 1281 and up
1 unit represents 10 LLC frames.
Applicable release: 1800
Range:
System Performance Group Vienna Page 57/137Motorola Confidential Proprietary

GSD CSISHow to use E/GPRS Statistics
This statistic counts absolute numbers, so it hard to provide a range. The more LLC frames are sent from other cells, the more cell reselections take place.
Usage:Each bin represents an LLC frame size. This statistic can be used to approximately calculate the DL LLC traffic volume (see 3.3.3.6). Another application is calculating the rate of LLC Abnormal TBF Releases (see 3.3.4.3), excluding abnormal TBF releases due to cell reselections.
3.3.3.3 UL_LLC_FRAMESDescription:This cell statistic counts the total number of uplink LLC frames correctly received by the PCU.
Name Bin # RangeUL_LLC_FRAMES Sum of all binsUL_LLC_FRAMES_20 0 0-20UL_LLC_FRAMES_40 1 21-40UL_LLC_FRAMES_80 2 41-80UL_LLC_FRAMES_160 3 81-160UL_LLC_FRAMES_320 4 161-320UL_LLC_FRAMES_640 5 321-640UL_LLC_FRAMES_1280 6 641-1280UL_LLC_FRAMES_OVER1280 7 1281 and up
1 unit represents 10 LLC frames.
Applicable release: 1800
Range:This statistic counts absolute numbers, so it hard to provide a range. The more LLC frames are sent over the Gb interface the more bandwidth is needed on Gb.
Usage:Each bin represents an LLC frame size. This statistic can be used to approximately calculate the UL LLC traffic volume (see 3.3.3.6). Another application is calculating the rate of LLC Abnormal TBF Releases (see 3.3.4.3), excluding abnormal TBF releases due to cell reselections.
3.3.3.4 USER_TRAFFIC_VOLUMEDescription:This key statistic calculates the downlink and uplink traffic volume, excluding retransmitted and other overhead blocks and measured at the RLC/MAC layer.
1 unit represents 1 kBytes.
System Performance Group Vienna Page 58/137Motorola Confidential Proprietary

GSD CSISHow to use E/GPRS Statistics
Applicable release: 1740 onwards
Range:The more traffic the better for the operator. More traffic also means that all statistics have a higher relevance as the sample size increases over which most of the stats are summarised or averaged.
Usage:The user traffic volume key statistics should be used for prioritising problem cells in a network. Those cells that carry the highest amount of user traffic and which also suffer performance problems should in general be targeted first for optimisation.These statistics only care about user data. To get a view on the total amount of data, the key statistic RLC_MAC_OVERHEAD (see 3.4.5.1) needs to be looked at. It provides the percentage of “overhead” (retransmissions, control blocks), which comes on top of the user traffic volume.
Formulae:DL_USER_TRAFFIC_GPRS =((DL_RLC_ACK_NEW_BLKS_CS_1 + DL_RLC_UNACK_NEW_BLKS_CS_1)*22 + (DL_RLC_ACK_NEW_BLKS_CS_2 + DL_RLC_UNACK_NEW_BLKS_CS_2)*33 + (DL_RLC_ACK_NEW_BLKS_CS_3 + DL_RLC_UNACK_NEW_BLKS_CS_3)*39 + (DL_RLC_ACK_NEW_BLKS_CS_4 + DL _RLC_UNACK_NEW_BLKS_CS_4)*53) * 100/1024
UL_USER_TRAFFIC_GPRS =((UL_RLC_ACK_NEW_BLKS_CS_1 + UL_RLC_UNACK_NEW_BLKS_CS_1)*22 + (UL_RLC_ACK_NEW_BLKS_CS_2 + UL_RLC_UNACK_NEW_BLKS_CS_2)*33 + (UL_RLC_ACK_NEW_BLKS_CS_3 + UL_RLC_UNACK_NEW_BLKS_CS_3)*39 + (UL_RLC_ACK_NEW_BLKS_CS_4 + UL_RLC_UNACK_NEW_BLKS_CS_4)*53)*100/1024
DL_USER_TRAFFIC_EGPRS =((DL_RLC_ACK_NEW_BLKS_MCS_1 + DL_RLC_UNACK_NEW_BLKS_MCS_1)*22 + (DL_RLC_ACK_NEW_BLKS_MCS_2 + DL_RLC_UNACK_NEW_BLKS_MCS_2)*28 + (DL_RLC_ACK_NEW_BLKS_MCS_3 + DL_RLC_UNACK_NEW_BLKS_MCS_3)*37 + (DL_RLC_ACK_NEW_BLKS_MCS_4 + DL_RLC_UNACK_NEW_BLKS_MCS_4)*44 + (DL_RLC_ACK_NEW_BLKS_MCS_5 + DL_RLC_UNACK_NEW_BLKS_MCS_5)*56 + (DL_RLC_ACK_NEW_BLKS_MCS_6 + DL_RLC_UNACK_NEW_BLKS_MCS_6)*74 + (DL_RLC_ACK_NEW_BLKS_MCS_7 + DL_RLC_UNACK_NEW_BLKS_MCS_7)*112 + (DL_RLC_ACK_NEW_BLKS_MCS_8 + DL_RLC_UNACK_NEW_BLKS_MCS_8)*136 + (DL_RLC_ACK_NEW_BLKS_MCS_9 + DL_RLC_UNACK_NEW_BLKS_MCS_9) *148) *100/1024
UL_USER_TRAFFIC_EGPRS =((UL_RLC_ACK_NEW_BLKS_MCS_1 + UL_RLC_UNACK_NEW_BLKS_MCS_1)*22 + (UL_RLC_ACK_NEW_BLKS_MCS_2 + UL_RLC_UNACK_NEW_BLKS_MCS_2)*28 + (UL_RLC_ACK_NEW_BLKS_MCS_3 + UL_RLC_UNACK_NEW_BLKS_MCS_3)*37 + (UL_RLC_ACK_NEW_BLKS_MCS_4 + UL_RLC_UNACK_NEW_BLKS_MCS_4)*44 + (UL_RLC_ACK_NEW_BLKS_MCS_5 + UL_RLC_UN ACK_NEW_BLKS_MCS_5)*56 +
System Performance Group Vienna Page 59/137Motorola Confidential Proprietary

GSD CSISHow to use E/GPRS Statistics
(UL_RLC_ACK_NEW_BLKS_MCS_6 + UL_RLC_UNACK_NEW_BLKS_MCS_6)*74 + (UL_RLC_ACK_NEW_BLKS_MCS_7 + UL_RLC_UNACK_NEW_BLKS_MCS_7)*112 + (UL_RLC_ACK_NEW_BLKS_MCS_8 + UL_RLC_UNACK_NEW_BLKS_MCS_8)*136 + (UL_RLC_ACK_NEW_BLKS_MCS_9 + UL_RLC_UNACK_NEW_BLKS_MCS_9)*148) *100/1024
3.3.3.5 MEAN_USER_TRAFFIC_PER_TBFDescription:This key statistic estimates the mean amount of successfully acknowledged RLC blocks transported in a downlink/uplink TBF, excluding retransmitted blocks.
1 unit represents 1 kBytes/TBF.
Applicable release: 1740 onwards
Range:This statistic directly relates to the key statistic MEAN_TBF_DUATION (see 3.3.7.2). The longer a TBF lasts, the more data are normally transmitted over it. A typical range would be <5 blocks/TBF for a mean TBF duration of 1s and >50 blocks/TBF for a mean TBF duration of 3s.
Usage:The RLC/MAC throughput key metrics are generally used to identify poorly performing cells. However, where TBFs are short, there may be no opportunity for coding scheme changes. It is therefore useful to refer to the TBF_Traffic key statistics to verify that a cell is not dominated by short TBFs. To verify the typical TBF duration the key statistic MEAN_TBF_DUATION (see 3.3.7.2) should be checked.
Formulae:DL_MEAN_USER_TRAFFIC_PER_TBF =(((DL_RLC_ACK_NEW_BLKS_CS_1 + DL_RLC_UNACK_NEW_BLKS_CS_1)*22 + (DL_RLC_ACK_NEW_BLKS_CS_2 + DL_RLC_UNACK_NEW_BLKS_CS_2)*33 + (DL_RLC_ACK_NEW_BLKS_CS_3 + DL_RLC_UNACK_NEW_BLKS_CS_3)*39 + (DL_RLC_ACK_NEW_BLKS_CS_4 + DL_RLC_UNACK_NEW_BLKS_CS_4)*53 + (DL_RLC_ACK_NEW_BLKS_MCS_1 + DL_RLC_UNACK_NEW_BLKS_MCS_1)*22 + (DL_RLC_ACK_NEW_BLKS_MCS_2 + DL_RLC_UNACK_NEW_BLKS_MCS_2)*28 + (DL_RLC_ACK_NEW_BLKS_MCS_3 + DL_RLC_UNACK_NEW_BLKS_MCS_3)*37 + (DL_RLC_ACK_NEW_BLKS_MCS_4 + DL_RLC_UNACK_NEW_BLKS_MCS_4)*44 + (DL_RLC_ACK_NEW_BLKS_MCS_5 + DL_RLC_UNACK_NEW_BLKS_MCS_5)*56 + (DL_RLC_ACK_NEW_BLKS_MCS_6 + DL_RLC_UNACK_NEW_BLKS_MCS_6)*74 + (DL_RLC_ACK_NEW_BLKS_MCS_7 + DL_RLC_UNACK_NEW_BLKS_MCS_7)*112 + (DL_RLC_ACK_NEW_BLKS_MCS_8 + DL_RLC_UNACK_NEW_BLKS_MCS_8)*136 + (DL_RLC_ACK_NEW_BLKS_MCS_9 + DL_RLC_UNACK_NEW_BLKS_MCS_9)*148)* 100)/ (1024*DL_PDTCH_SEIZURE)
UL_MEAN_USER_TRAFFIC_PER_TBF =
System Performance Group Vienna Page 60/137Motorola Confidential Proprietary

GSD CSISHow to use E/GPRS Statistics
((UL_RLC_ACK_NEW_BLKS_CS_1 + UL_RLC_UNACK_NEW_BLKS_CS_1)*22 + (UL_RLC_ACK_NEW_BLKS_CS_2 + UL_RLC_UNACK_NEW_BLKS_CS_2)*33 + (UL_RLC_ACK_NEW_BLKS_CS_3 + UL_RLC_UNACK_NEW_BLKS_CS_3)*39 + (UL_RLC_ACK_NEW_BLKS_CS_4 + UL_RLC_UNACK_NEW_BLKS_CS_4)*53 + (UL_RLC_ACK_NEW_BLKS_MCS_1 + UL_RLC_UNACK_NEW_BLKS_MCS_1)*22 + (UL_RLC_ACK_NEW_BLKS_MCS_2 + UL_RLC_UNACK_NEW_BLKS_MCS_2)*28 + (UL_RLC_ACK_NEW_BLKS_MCS_3 + UL_RLC_UNACK_NEW_BLKS_MCS_3)*37 + (UL_RLC_ACK_NEW_BLKS_MCS_4 + UL_RLC_UNACK_NEW_BLKS_MCS_4)*44 + (UL_RLC_ACK_NEW_BLKS_MCS_5 + UL_RLC_UNACK_NEW_BLKS_MCS_5)*56 + (UL_RLC_ACK_NEW_BLKS_MCS_6 + UL_RLC_UNACK_NEW_BLKS_MCS_6)*74 + (UL_RLC_ACK_NEW_BLKS_MCS_7 + UL_RLC_UNACK_NEW_BLKS_MCS_7)*112 + (UL_RLC_ACK_NEW_BLKS_MCS_8 + UL_RLC_UNACK_NEW_BLKS_MCS_8)*136 + (UL_RLC_ACK_NEW_BLKS_MCS_9 + UL_RLC_UNACK_NEW_BLKS_MCS_9)*148)* 100/ (1024*UL_PDTCH_SEIZURE)
3.3.3.6 LLC_TRAFFIC_VOLUME_INDICATORDescription:This key statistic gives an estimation of DL and UL LLC traffic for a certain cell. The average bin values are used, so the error introduced is minimised but still – this statistic is quite inaccurate. It is merely an indicator, as the name says. The worst case error is +/- 50% in case only the bin 1 (LLC_FRAMES_GB_20 or DL_LLC_FRAMES_PCU_20) is pegged; +/- 25% on average.
1 unit represents 1 kByte.
Applicable release: 1800
Range:This key statistic counts absolute numbers, so it hard to provide a range. The more LLC frames are sent over the Gb interface the more bandwidth is needed on Gb.
Usage:Gb bandwidth dimensioning.
Formulae:DL_LLC_TRAFFIC_VOLUME_INDICATOR =((DL_LLC_FRAMES_GB_20 + DL_LLC_FRAMES_PCU_20)*10 +(DL_LLC_FRAMES_GB_40 + DL_LLC_FRAMES_PCU_40)*30 +(DL_LLC_FRAMES_GB_80 + DL_LLC_FRAMES_PCU_80)*60 +(DL_LLC_FRAMES_GB_160 + DL_LLC_FRAMES_PCU_160)*120 +(DL_LLC_FRAMES_GB_320 + DL_LLC_FRAMES_PCU_320)*240 +(DL_LLC_FRAMES_GB_640 + DL_LLC_FRAMES_PCU_640)*480 +(DL_LLC_FRAMES_GB_1280 + DL_LLC_FRAMES_PCU_1280)*960 +(DL_LLC_FRAMES_GB_OVER1280 + DL_LLC_FRAMES_PCU_OVER1280)*1420)*10 / 1000
System Performance Group Vienna Page 61/137Motorola Confidential Proprietary

GSD CSISHow to use E/GPRS Statistics
UL_LLC_TRAFFIC_VOLUME_INDICATOR =((UL_LLC_FRAMES_20*10 + UL_LLC_FRAMES_40*30 + UL_LLC_FRAMES_80*60 + UL_LLC_FRAMES_160*120 + UL_LLC_FRAMES_320*240 + UL_LLC_FRAMES_640 *480 + UL_LLC_FRAMES_1280*960 + UL_LLC_FRAMES_OVER1280*1420)*10) / 1000
3.3.4 Discarded Data
3.3.4.1 PDU_DISCARD_FRDescription:This GBL statistic indicates the number of uplink and downlink LLC PDUs discarded by Frame Relay.
Name Bin # DescriptionPDU_DISCARD_FR Sum of all binsPDU_DSCRD_FR_DL_CRC 0 DL LLC frames discarded due to
CRC errorsPDU_DSCRD_FR_DL_HDLC 1 DL LLC frames discarded due to
HDLC errors (excluding CRC errors)
PDU_DSCRD_FR_UL 2 UL LLC frames discarded
1 unit represents 1 LLC frame.
Applicable release: 1800
Range:This statistic counts absolute numbers, so it is hard to provide a range. The more LLC frames are sent over the Gb interface (see 3.3.3), the higher the number of discarded frames can and will be.
Usage:This is a GBL statistic, so it counts discarded LLC PDUs between PCU and SGSN. A high number of discarded downlink LLC frames (CRC or HDLC errors, Bin 0 and 1) indicates a problem with the SGSN, while a high number of discarded uplink LLC frames (Bin 2) indicates a problem on the PCU side.
SGSN statistics or a tracing tool like GbSnoop [15] can be consulted for further investigation on the exact location and cause of packet loss.
3.3.4.2 PDU_DISCARD_LLCDescription:This cell statistic counts the number of DL LLC frames discarded by the PCU.
System Performance Group Vienna Page 62/137Motorola Confidential Proprietary

GSD CSISHow to use E/GPRS Statistics
Name Bin # DescriptionPDU_DISCARD_LLC Sum of all binsPDU_DSCRD_LLC_ABNORM_TBFREL 0 Discard data due to abnormal TBF
releasePDU_DSCRD_LLC_CELL_BUF_OVRFLW 1 Cell buffer overflowPDU_DSCRD_LLC_INA_MOVE_PKT 2 Buffer discarded due to inability to
move the packets internallyPDU_DSCRD_LLC_MS_BUF_OVRFLW 3 MS buffer overflowPDU_DSCRD_LLC_OUT_SEQ_LLC 4 Discard data in target cell to avoid
out of sequence LLC deliveryPDU_DSCRD_LLC_PFC_REJECT_DELET 5 Discard LLC frames of rejected
PFCsPDU_DSCRD_LLC_RESEL_INAREA 6 Discard LLC for cell reselection
within the same routing areaPDU_DSCRD_LLC_RESEL_OUTAREA 7 Discard LLC for cell reselection
outside the same routing area
1 unit represents 1 LLC frame.
Applicable release: 1800
Range:This statistic counts absolute numbers, so it is hard to provide a range. The more LLC frames are processed by the PCU (see statistics DL_LLC_FRAMES_GB, DL_LLC_FRAMES_PCU, UL_LLC_FRAMES; see 3.3.3), the higher the number of discarded frames can and will be.
Usage:
Bin 0: Number of LLC PDUs discarded due to abnormal TBF releaseAbnormal TBF releases indicate problems with TBF maintenance; cell reselection, a very prominent reason for abnormal TBF release is not counted in this bin. So it is possible to build a key statistic: LLC Abnormal TBF Releases (see 3.3.4.3).
Bin 1, 3: Number of LLC frames discarded due to buffer overflowBuffer overflow shouldn’t happen at all. IOT or software problems might cause buffer overflows. It is recommended to check if BSSGP flow control is working correctly:
Enable CBL (Current bucket level) feature: When it is enabled, a current bucket level (buffer full percentage) is included with every flow control message, to correct the estimation error in the SGSN.
Reduce he timer parameter bssgp_fc_period_c, which specifies the rate at which the BSS sends flow control messages for a given BVC or MS.
Bin 2: Buffer discarded due to inability to move the packets internallyThis bin pegs for discarded LLC frames due to cell reselection within the same routing area.
Bin 5: Number of LLC PDUs discarded due to PFC rejection
System Performance Group Vienna Page 63/137Motorola Confidential Proprietary

GSD CSISHow to use E/GPRS Statistics
When PFCs are rejected the associated DL data gets discarded. UL data can’t be discarded as the BSS doesn’t know which PFC it belongs to.
PFCs can be rejected due the following reasons: PCU storage for PFCs is full The cell is already serving maximum number of mobiles (4 per timeslot) PRP is serving maximum number of timeslots (30 active TS per PRP) Maximum number of PFCs for this TLLI is reached PCU cannot meet the MTBR for the requested PFC
Bin 6, 7: Discard LLC for cell reselection within /outside the same routing area Bin 6 and 7 can be checked to see if packet loss due to cell reselections in a certain cell happens within the same routing area or over RA boundaries. If Bin 7 show high amount of data compared to other cells and compared to Bin 6, the routing area boundaries should be changed to non-hotspot locations; the average reselection duration and thus the amount of lost packets should decrease.
3.3.4.3 LLC_ABNORMAL_TBF_RELEASE_RATEDescription:This key statistic calculates the percentage of discarded LLC frames due to abnormal TBF releases.
1 unit represents 1 LLC frame.
Applicable release: 1800
Range: The more TBFs (DL_PDTCH_SEIZURE, DL_PDTCH_SEIZURE, whatever is larger)
have been established during the stats interval the higher the percentage of this statistic can be.
The TBF duration (see 3.3.7.2) affects this statistic as well. Very short TBFs will be finished before a cell reselection takes place more often then longer TBFs.
The value should be very small (< 1%)
Usage:This key statistic considers only the case of abnormal TBF releases excluding cell reselections or buffer overflows. It can be compared to the key statistics LLC_DISCARDS_ON_CELL_RESELECTION (see 3.3.4.5), TBF_FAILURE_RATE (includes cell reselections, see 3.3.5.3) and TBF_DROP_RATE_ON_PACCH_LOST (see 3.4.3.21).Due to the relatively inaccurate bins this key statistic cannot provide a lot of detail. The mean value of every bin is used for the calculation of LLC frame sizes in the formula above.
Formula:LLC_ABNORMAL_TBF_RELEASES =
System Performance Group Vienna Page 64/137Motorola Confidential Proprietary

GSD CSISHow to use E/GPRS Statistics
(PDU_DSCRD_LLC_ABNORM_TBFREL *100) / ((DL_LLC_FRAMES_PCU + DL_LLC_FRAMES_GB + UL_LLC_FRAMES) *10)
3.3.4.4 LLC_BUFFER_OVERFLOW_RATEDescription:This key statistic calculates the percentage of discarded LLC blocks due to buffer overflows.
1 unit represents a percentage.
Applicable release: 1800
Range:When the value is >1%, the PDU_DSCRD_LLC_CELL_BUF_OVRFLW and PDU_DSCRD_LLC_MS_BUF_OVRFLW (see 3.3.4.2) should be checked separately. IOT or software problems might cause buffer overflows. It is recommended to check if BSSGP flow control is working correctly:
Enable CBL (Current bucket level) feature: When it is enabled, a current bucket level (buffer full percentage) is included with every flow control message, to correct the estimation error in the SGSN.
Reduce he timer parameter bssgp_fc_period_c, which specifies the rate at which the BSS sends flow control messages for a given BVC or MS.
Usage:This key statistic considers only the case of buffer overflows. Ideally it should be 0. A higher value has to be closely analysed.
Formula:DL_LLC_BUFFER_OVERFLOW_RATE =(PDU_DSCRD_LLC_CELL_BUF_OVRFLW + PDU_DSCRD_LLC_MS_BUF_OVRFLW)*100 /((DL_LLC_FRAMES_PCU + DL_LLC_FRAMES_GB + UL_LLC_FRAMES)*10)
3.3.4.5 LLC_DISCARDS_ON_CELL_RESELECTIONDescription:This key statistic calculates the percentage of discarded LLC frames due to intra-PRP cell reselections.
1 unit represents a percentage.
Applicable release: 1800
Range:Needs to be checked during lab tests and IDT.
Usage:
System Performance Group Vienna Page 65/137Motorola Confidential Proprietary

GSD CSISHow to use E/GPRS Statistics
This key statistic calculates a rate of lost LLC frames due to intra-PRP cell reselection. It can help to correct the TBF_FAILURE_RATE key statistics (see 3.3.5.3), which include abnormal TBF releases due to cell reselections. A value of 10% for the LLC_DISCARDS_ON_CELL_RESELECTION could be translated to a 10% reduction of the combined DL_TBF_FAILURE_RATE+UL_TBF_FAILURE_RATE (no differentiation for UL and DL!). This statistic should be reduced as soon as SCR (see 3.6.2) or NACC (see 3.6.3) is introduced and mobiles actually support it.
A higher percentage of LLC_DISCARDS_ON_CELL_RESELECTION indicates a problem.
Formula:LLC_DISCARDS_ON_CELL_RESELECTION =(PDU_DSCRD_LLC_RESEL_INAREA + PDU_DSCRD_LLC_RESEL_OUTAREA + PDU_DSCRD_LLC_INA_MOVE_PKT)*100 /((DL_LLC_FRAMES_PCU + DL_LLC_FRAMES_GB + UL_LLC_FRAMES)*10)
3.3.5 TBF FailuresThe TBF_FAILURES statistics peg in bins for several different events of TBF failures. It is important to know where in the ladder diagram the bins are pegged to have an understanding about how they relate to other statistics like PDTCH_SEIZURE or CHANNEL_REQUEST statistics.
E.g.: It is not possible to simply divide DL_TBF_FAILURES by DL_PDTCH_SEIZURE to calculate a normalised DL TBF Failure Rate ranging from 0-100%. Some bins of DL_TBF_FAILURES peg before, some after DL_PDTCH_SEIZURE.
3.3.5.1 AIR_DL_TBF_FAILURESAIR_DL_TBF_FAILURES_DR (delayed release)AIR_DL_TBF_FAILURES_DT (data transfer)AIR_DL_TBF_FAILURES_ET (establishment)AIR_DL_TBF_FAILURES_T (termination)AIR_DL_TBF_FAILURES is pegged in four bins: ESTABLISH, TRANSFER, DDTR and TERMINATION. The stat is pegged when a TBF fails due to a problem with the air interface such as missing too many DAKs or failure to confirm establishment. Check Figure 18, Figure 19 and Figure 20 for a detailed ladder diagram of TBF modes to see where the specific bins of AIR_DL_TBF_FAILURES are pegged.
DL_PDTCH_SEIZURES is pegged each time a DL TBF is successfully established and the mobile is listening on the PDTCH. Specifically it is pegged when the network receives the first DAK from the mobile. Please see Figure 18, Figure 19 and Figure 20 for this detail.
Figure 18 shows establishment of the DL TBF when the mobile is already listening on the PDTCH. This would be the case of an ongoing UL TBF, or for T3192 running.
System Performance Group Vienna Page 66/137Motorola Confidential Proprietary

GSD CSISHow to use E/GPRS Statistics
Figure 19 shows establishment of the DL TBF when the mobile is not listening on the PDTCH, but new PCTA information is not needed.
Figure 20 shows establishment of the DL TBF when the mobile is not listening on the PDTCH and new PCTA information is needed.
NOTE: Every one-phase access (MC merge) cause an abnormal TBF release but does NOT peg the AIR_DL_FAILURES stat.
System Performance Group Vienna Page 67/137Motorola Confidential Proprietary

GSD CSISHow to use E/GPRS Statistics
Figure 18 - DL TBF Establishment when on the PDTCH
System Performance Group Vienna Page 68/137Motorola Confidential Proprietary

GSD CSISHow to use E/GPRS Statistics
Figure 19 - DL TBF Establishment when not on the PDTCH, but PCTA is current
System Performance Group Vienna Page 69/137Motorola Confidential Proprietary

GSD CSISHow to use E/GPRS Statistics
Figure 20 - DL TBF Establishment when no on PDTCH, PCTA is needed
System Performance Group Vienna Page 70/137Motorola Confidential Proprietary

3.3.5.2 AIR_UL_TBF_FAILURESAIR_DL_TBF_FAILURES_DT (data transfer)AIR_DL_TBF_FAILURES_ET (establishment)AIR_DL_TBF_FAILURES_T (termination)AIR_UL_TBF_FAILURES is pegged in three bins, ESTABLISH, TRANSFER, and TERMINATION. The stat is pegged when a TBF fails due to a problem over the air interface such as failing to receive data, or failing to receive a control ack. Please check Figure 21 and Figure 22 for a detailed ladder diagram of TBF modes, to see where the bins of AIR_UL_TBF_FAILRUES are pegged.
UL_PDTCH_SEIZURE is pegged when the UL TBF is confirmed established, measured by the network receiving data on the PDTCH. Please see Figure 21 and Figure 22 for this detail.
Figure 21 shows UL TBF establishment using one-phase access.
Figure 22 shows UL TBF establishment using two-phase access. This method would also be used when a DL TBF is active. Note that the diagram begins with the PUA which would be sent in response to the PRR or request in DAK from the mobile.
Motorola Confidential Proprietary
This document and the information contained in it is CONFIDENTIAL INFORMATION of Motorola, and shall not be used, published, disclosed, or disseminated outside Motorola in whole or in part without Motorola´s consent. This document contains trade secrets of Motorola.
Reverse engineering of any or all of the information in this document is prohibited. The copyright notice does not imply publication of the document

Figure 21 - UL TBF Establishment – one phase access
System Performance Group Vienna Page 72/137Motorola Confidential Proprietary

Figure 22 - UL TBF Establishment – two phase access
3.3.5.3 TBF_FAILURE_RATEDescription:These key statistics calculate the rate of abnormally released TBFs.
1 unit represents a percentage.
Applicable release: 1740, 1800 (different formulae)
Range:The TBF Failure Rate includes cell reselections, therefore it is not possible to provide typical good/bad values.Usage:
System Performance Group Vienna Page 73/137Motorola Confidential Proprietary

These key statistics can be used to see the percentage of dropped TBFs due to radio link failures. Other key statistics can be checked to see, whether there is a connection between TBF failures and radio quality: MEAN_TBF_DURATION (see 3.3.7.2) and BLER statistics (see 3.5.1).
Formulae:DL_TBF_FAILURE_RATE_GSR7 = AIR_DL_TBF_FAILURES*100/ (DL_PDTCH_SEIZURE+ AIR_DL_TBF_FAILURES_EST)
DL_TBF_FAILURE_RATE_GSR8 = AIR_DL_TBF_FAILURES*100/ (TBF_DL_ASGN_PACCH + IMM_ASSGN_CAUSE_6 + IMM_ASSGN_CAUSE_8)
UL_TBF_FAILURE_RATE = (AIR_UL_TBF_FAILURES_DT+AIR_UL_TBF_FAILURES_T)*100/(CHANNEL_REQS_SUCCESS_P_C+CHANNEL_REQS_SUCCESS_P_P+CHANNEL_REQS_SUCCESS_P_R+CHANNEL_REQS_SUCCESS_PKTS+CHANNEL_REQS_SUCCESS_E_C+CHANNEL_REQS_SUCCESS_CP_A+CHANNEL_REQS_SUCCESS_E_1P_CCC+CHANNEL_REQS_SUCCESS_E_1P_PCCC+CHANNEL_REQS_SUCCESS_E_PUAPRR+CHANNEL_REQS_SUCCESS_E_PTR+CHANNEL_REQS_SUCCESS_E_PUAPDAK)
Note: In the denominator all CHANNEL_REQS_SUCCESS bins except single block allocations are summed up. The single block allocations are excluded because they can be used for packet measurement reports, which should not be captured here.
Caution: The first phase of optimised two-phase access is not captured in this key statistic. Failures in the first phase can be seen in the statistic G_RACH_UNSVCD_BTS (see 3.1.2.2) only. See also the ladder diagrams in Figure 21 and Figure 22.
3.3.6 DL_RLC_MAC_WINDOW_STALLDescription:This key statistic calculates the percentage of RLC blocks, which are retransmitted due to an RLC window stall. If the window is stalled, all DL RLC blocks sent during this period are pegged as stalled. Stalled blocks supersede other types of transmissions of NEW, NACK and RETX blocks. For example, a NACK data block sent during a stalled window condition is treated as a stalled block and gets pegged as such.
1 unit represents a percentage.
Applicable release: 1740 onwards
Range:
System Performance Group Vienna Page 74/137Motorola Confidential Proprietary

The more blocks of a certain CS or MCS are stalled, the higher the percentage of the corresponding key statistic is.
Usage:The following can cause for window stalls:
Software problems. No stats can help here. In-depth analysis has to take place. Heavy interleaving (check key stats TBF_INTERLEAVING_ACTIVITY (see 3.4.3.9)
and USER_TRAFFIC_VOLUME (see 3.3.3.4). RF problems. When lower coding scheme blocks already stall, an RF problem can be
suspected. To crosscheck, whether an RF problem exists the key statistic Downlink BLER (see 3.5.1.1) or the carrier BLER statistics (see 3.5.1.2) can be consulted.
The following charts (see Figure 23) show an exemplary statistics analysis. The BLER statistics don’t correlate with the window stalls. On Mi, 13.04 an increased BLER for CS-2 blocks can be seen but the high window stall of 40% occurs a day later. It could be explained by an increased traffic load for some time, but the low TBF Interleaving Activity doesn’t support this thesis. When looking at the half hour intervals, it becomes obvious, that the reason for this high percentage of window stalls is based on just one stats interval, with very low traffic.
0.000.540.460.380.36 0.22 0.21 0.49 0.05 0.19 0.37 0.540.530.00
0
5
10
15
20
25
30
35
40
45
Mo,
04.
04
Di,
05.0
4
Mi,
06.0
4
Do,
07.
04
Fr, 0
8.04
Sa,
09.
04
So,
10.
04
Mo,
11.
04
Di,
12.0
4
Mi,
13.0
4
Do,
14.
04
Fr, 1
5.04
Sa,
16.
04
So,
17.
04
Date
DL R
LC/M
AC W
indo
w S
tall
(%),
DL T
BF In
terle
avin
g Ac
tivity
(TBF
per
TS)
0
2000
4000
6000
8000
10000
12000
14000
16000
18000
DL U
ser T
raffi
c Vo
lum
e G
PRS
(kBy
tes)
DL RLC/MAC Window Stall CS-1 (%)DL RLC/MAC Window Stall CS-2 (%)DL RLC/MAC Window Stall CS-3 (%)DL RLC/MAC Window Stall CS-4 (%)DL User Traffic Volume GPRS (kB)DL TBF Interleaving Activity (TBF per TS)
System Performance Group Vienna Page 75/137Motorola Confidential Proprietary

0
0.5
1
1.5
2
2.5
3
3.5
4
Mo,
04.
04
Di,
05.0
4
Mi,
06.0
4
Do,
07.
04
Fr, 0
8.04
Sa,
09.
04
So,
10.
04
Mo,
11.
04
Di,
12.0
4
Mi,
13.0
4
Do,
14.
04
Fr, 1
5.04
Sa,
16.
04
So,
17.
04
Date
DL B
LER
(%)
DL_BLER_CS1DL_BLER_CS2DL_BLER_CS3DL_BLER_CS4
0
10
20
30
40
50
60
70
80
90
100
14A
PR
2005
:00:
00:0
0
14A
PR
2005
:01:
00:0
0
14A
PR
2005
:02:
00:0
0
14A
PR
2005
:03:
00:0
0
14A
PR
2005
:04:
00:0
0
14A
PR
2005
:05:
00:0
0
14A
PR
2005
:06:
00:0
0
14A
PR
2005
:07:
00:0
0
14A
PR
2005
:08:
00:0
0
14A
PR
2005
:09:
00:0
0
14A
PR
2005
:10:
00:0
0
14A
PR
2005
:11:
00:0
0
14A
PR
2005
:12:
00:0
0
14A
PR
2005
:13:
00:0
0
14A
PR
2005
:14:
00:0
0
14A
PR
2005
:15:
00:0
0
14A
PR
2005
:16:
00:0
0
14A
PR
2005
:17:
00:0
0
14A
PR
2005
:18:
00:0
0
14A
PR
2005
:19:
00:0
0
14A
PR
2005
:20:
00:0
0
14A
PR
2005
:21:
00:0
0
14A
PR
2005
:22:
00:0
0
14A
PR
2005
:23:
00:0
0
Date and Time
DL R
LC/M
AC W
indo
w S
tall
(%)
DL RLC/MAC Window Stall CS-2 (%)
DL RLC/MAC Window Stall CS-3 (%)CS2: 800 blocks (25.78 kBytes) are stalled,900 blocks (29 kBytes) are acked.
CS3: 300 blocks (11.42 kBytes) are stalled,400 blocks (15.23 kBytes) are acked.
Figure 23 - Analysis of DL RLC/MAC Window Stalls
Formulae:DL_RLC_MAC_WINDOW_STALL_CS1 =DL_RLC_STALLED_BLKS_CS_1*100/DL_RLC_ACK_NEW_BLKS_CS_1
DL_RLC_MAC_WINDOW_STALL_CS2 =DL_RLC_STALLED_BLKS_CS_2*100/DL_RLC_ACK_NEW_BLKS_CS_2
System Performance Group Vienna Page 76/137Motorola Confidential Proprietary

DL_RLC_MAC_WINDOW_STALL_CS3 =DL_RLC_STALLED_BLKS_CS_3*100/DL_RLC_ACK_NEW_BLKS_CS_3
DL_RLC_MAC_WINDOW_STALL_CS4 =DL_RLC_STALLED_BLKS_CS_4*100/DL_RLC_ACK_NEW_BLKS_CS_4
DL_RLC_MAC_WINDOW_STALL_MCS1 =DL_RLC_STALLED_BLKS_MCS_1*100/DL_RLC_ACK_NEW_BLKS_MCS_ 1
DL_RLC_MAC_WINDOW_STALL_MCS2 =DL_RLC_STALLED_BLKS_MCS_2*100/DL_RLC_ACK_NEW_BLKS_MCS_2
DL_RLC_MAC_WINDOW_STALL_MCS3 =DL_RLC_STALLED_BLKS_MCS_3*100/DL_RLC_ACK_NEW_BLKS_MCS_3
DL_RLC_MAC_WINDOW_STALL_MCS4 =DL_RLC_STALLED_BLKS_MCS_4*100/DL_RLC_ACK_NEW_BLKS_MCS_4
DL_RLC_MAC_WINDOW_STALL_MCS5 =DL_RLC_STALLED_BLKS_MCS_5*100/DL_RLC_ACK_NEW_BLKS_MCS_5
DL_RLC_MAC_WINDOW_STALL_MCS6 =DL_RLC_STALLED_BLKS_MCS_6*100/DL_RLC_ACK_NEW_BLKS_MCS_6
DL_RLC_MAC_WINDOW_STALL_MCS7 =DL_RLC_STALLED_BLKS_MCS_7*100/DL_RLC_ACK_NEW_BLKS_MCS_7
DL_RLC_MAC_WINDOW_STALL_MCS8 =DL_RLC_STALLED_BLKS_MCS_8*100/DL_RLC_ACK_NEW_BLKS_MCS_8
DL_RLC_MAC_WINDOW_STALL_MCS9 =DL_RLC_STALLED_BLKS_MCS_9*100/DL_RLC_ACK_NEW_BLKS_MCS_9
3.3.7 Length of TBFs
3.3.7.1 TBF_TIME statisticsDL_TBF_TIME_1_TSDL_TBF_TIME_2_TSDL_TBF_TIME_3_TSDL_TBF_TIME_4_TSUL_TBF_TIME_8PSK_1_TSUL_TBF_TIME_8PSK_2_TSUL_TBF_TIME_GMSK_1_TS
System Performance Group Vienna Page 77/137Motorola Confidential Proprietary

UL_TBF_TIME_GMSK_2_TS
Description:The DL_TBF_TIME_x_TS cell statistics count the cumulative length in number of 20ms radio block periods of all downlink TBFs for mobiles that support a maximum of x TS in the downlink direction (whereby x stands for terminal type 1, 2, 3 or 4). The TBF time is measured from the TBF set-up time to the time the mobile acknowledges the full TBF. The TBF time includes all the delayed downlink TBF release phases except the very last one so as to accurately reflect the perceived throughput.
The UL_TBF_TIME_GMSK_x_TS cell statistics count the cumulative length in number of 20ms radio block periods of all uplink TBFs for mobiles that support a maximum of x TS in the uplink direction (whereby x stands for terminal type 1 or 2) and do not support 8PSK modulation in the uplink. The TBF time starts with the set-up of the TBF and finishes when all the uplink RLC radio blocks have been received without error. The statistic UL_TBF_TIME_GMSK_1_TS also pegs for mobiles whose multislot class is not known before the end of the UL TBF. The accuracy of this statistic may be reduced due to these unknown multislot cases.
The UL_TBF_TIME_8PSK_x_TS cell statistics count the cumulative length in number of 20ms radio block periods of all uplink TBFs for mobiles that support a maximum of x TS in the uplink direction (whereby x stands for terminal type 1 or 2) and do support 8PSK modulation in the uplink. The TBF time starts with the set-up of the TBF and finishes when all the uplink RLC radio blocks have been received without error. The statistic UL_TBF_TIME_8PSK_1_TS also pegs for 8PSK-capable mobiles whose multislot class is not known before the end of the UL TBF. The accuracy of this statistic may be reduced due to these unknown multislot cases.
1 unit represents a 20ms block period.
Applicable release: 1740 onwards
Range:The more TBF_TIME a terminal type accounts for, the more data is typically sent (UL stats) or received (DL stats) by this terminal type, although some bursty traffic the TBF_TIME might be show high values while only a few bytes are transferred. Nowaday’s mobile stations are mostly class 8 or 10 (EDGE: class 4, 8 or 10). This should be reflected in the distribution of these stats.
Usage:These statistics give an indication about the distribution of multislot classes among the MS population in a cell/network. It should be ensured that at least the same number of PDCHs as the highest terminal type seen in DL_TBF_TIME, DL_RADIO_BLKS or DL_RLC_BLKS (see 3.3.1) is configured. If fewer resources are available, the user bandwidth is reduced compared to what the MS would support.Another application of these statistics is the calculation of MEAN_TBF_DURATION (see 3.3.7.2) and the analysis of throughput and utilisation per terminal type:
THROUGHPUT_PER_TERMINAL_TYPE (see 3.2.1.2)
System Performance Group Vienna Page 78/137Motorola Confidential Proprietary

PDTCH_UTILISATION_PER_TERMINAL_TYPE (see 3.4.3.8) TERMINAL_TYPE_ACTIVITY (see 3.4.3.9)
3.3.7.2 MEAN_TBF_DURATIONDescription:This key statistics provide the mean duration of successful TBFs in up- and downlink.
1 unit represents 1 second.
Applicable release: 1740 onwards
Range:The typical mean TBF duration ranges from <1s (not very much GPRS traffic, only RAUs and WAP type services are used) to 3s (heavy GPRS usage; peak traffic; FTPs and email down/uploads are executed over longer periods. Note that mean statistics present an average over the whole stats interval; therefore its values are normally quite low.
Usage:Cells that are dominated by short TBFs (e.g. high number of Routing Area Updates, WAP sessions), will tend to have a high usage of the initial GPRS or EDGE coding scheme used by the PCU (CS-1 or CS-2; MCS-3), which could lead to lower throughputs. See Figure 14 and Figure 15 for correlation charts.
Note: TBF Failures, which happen during data transfer, SCT and termination, are excluded from the count of TBFs in the denominator. Only successfully completed TBFs are considered; otherwise the mean TBF duration could be heavily influenced by TBF failures, also due to reselections.
Formulae:DL_MEAN_TBF_DURATION =(DL_TBF_TIME_1_TS + DL_TBF_TIME_2_TS + DL_TBF_TIME_3_TS + DL_TBF_TIME_4_TS)*0.02 / (DL_PDTCH_SEIZURE - AIR_DL_TBF_FAILURES_DT - AIR_DL_TBF_FAILURES_DR - AIR_DL_TBF_FAILURES_T)
UL_MEAN_TBF_DURATION =(UL_TBF_TIME_8PSK_1_TS + UL_TBF_TIME_8PSK_2_TS + UL_TBF_TIME_GMSK_1_TS + UL_TBF_TIME_GMSK_2_TS)*0.02 / (UL_PDTCH_SEIZURE - AIR_UL_TBF_FAILURES_DT - AIR_UL_TBF_FAILURES_T)
System Performance Group Vienna Page 79/137Motorola Confidential Proprietary

3.4 UtilisationThis chapter discusses statistics appropriate for detecting issues and problems related to UTILISATION – LOAD –CONGESTION. As high load/congestion usually leads to bandwidth reduction, this topic is closely tied to the Throughput chapter (see 3.1).
3.4.1 Gb Interface UtilisationThe link between PCU and SGSN typically consists of several physical Gb links. Congestion can be caused if either one Gb link or the total Gb bandwidth is used up. In Motorola’s PCU the UL traffic for each BVC (cell) can only be routed via one Gb link. If it is too narrow for a cell’s traffic, it constitutes a bottleneck. However, most of the SGSNs can route a BVC on more than one Gbs.
SGSN Packet Drop Rate should be obtained for further analysis. There is, however, no BSS statistic available to detect Gb interface congestion.
3.4.2 PCU UtilisationThere are different capacity limitations on the PCU:
Number of channel requests per second per PRPo GPRS_RACH_ARRIVAL (see 3.1.2.1) to check the number of RACH requests
per second;o DL/UL PDTCH_Q_LENGTH to get an idea of the number resource requests in
the DL/UL request queues.o CH_REQ_UNSVCD_PCU (see 3.1.3.1.4) provides bins for different reasons,
channel requests are not serviced. MC table limitation is 2000 entries (IAs per 32 seconds) Number of active PD’s per block period
o PRP_LOAD (DPROC stat, see 3.4.2.1), which is available to identify cells suffering from bandwidth limitation due to limited PRP capacity. This statistic is related to the number of active PDs per PRP.
PD’s receive/transmit RLC data blocks per PRP Gb-Link capacity
The following GBL statistics can help analysing the Gb link:o GBL_DL_DATA_THRPUTo GBL_DL_DATA_THRPUT_HISTo GBL_UL_DATA_THRPUTo GBL_UL_DATA_THRPUT_HISTo GBL_UNAVAILABLE
GSL capacityo The X.25/LAPD statistic LAPD_CONGESTION measures the time in ms, the
link is congested.
System Performance Group Vienna Page 80/137Motorola Confidential Proprietary

RSL capacity (BSC to Site for GPRS RACH/IA/Paging etc)o The X.25/LAPD statistic LAPD_CONGESTION measures the time in ms, the
link is congested. CCCH capacity (e.g. GPRS IAs on AGCH)
The number of IA messages on AGCH can be checked against the number of AGCH discards:
o IMM_ASSIGN Cause 5 and 6 for GPRS and Cause 7 and 8 for EGPRSo GPRS_ACCESS_PER_AGCHo G_RACH_UNSVCD_BTS (see 3.1.2.2) has a bin for AGCH discard.
3.4.2.1 PRP_LOADDescription:This DPROC statistic measures the load of the PRP board. PRP_LOAD_MEAN is calculated over the interval, PRP_LOAD_MAX is determined per block period. A PRP can support 120 TS, in 4 groups of 30 that will be served round robin each block period. The load of the PRP board is determined by measuring the number of timeslots pending service for data transfers within a 20 millisecond block period.
Number of timeslots pending service in a 20ms block period
PRP_LOAD
0-30 0-10031-60 101-20061-90 201-30091-120 301-400
Figure 24 - Mapping between timeslots pending service and PRP load
Bin # Min Max1 0 22 3 53 6 104 11 205 21 406 41 607 61 1008 101 1609 161 26010 261 400
Figure 25 - PRP load range
1 unit represents 1% PRP load.
Applicable release: 1740 onwards
Range:
System Performance Group Vienna Page 81/137Motorola Confidential Proprietary

PRP_LOAD_MEAN should be below 75%. If it constantly exceeds 100% another PRP should be added.
Usage:The maximum bandwidth is 30 air TS. When more TS have to be served, PRP_LOAD_MAX exceeds 100% (=30 TS) and subscribers don’t get the maximum data rate anymore. The PCU triggers the cell re-balancer if more than 50 PDs are active on a PRP and balances the cell to a PRP with less than 20 PD’s active. This PRP load is computed every 8 seconds. Each cell shift to another PRP requires that the BVC is blocked (cause: cell congested) and unblocked as soon as initialised on the new PRP. This impacts of course the subscriber, the PRP context won’t be deactivated but the mobile might select another cell for the period his is GPRS barred for that short time. However, it is sufficient to have the PRP_LOAD_MEAN well below 100 to ensure good PCU performance; a small delay in service of some TS will not be noticeable at the end user side.
The statistic NO_PDTCH_AVAIL_TIME (see 3.4.3.17) and the events BVC block/unblock can be used to identify occurrences of cell re-balancing.
3.4.3 PDCH Utilisation/CongestionCongestion in the packet switched domain requires a completely different view compared to circuit switched domain. A voice call resource (TCH) is either available or not but a data call can utilise 1 to 4 timeslots (PDCHs) and TBFs can be interleaved, so that not only one but up to 4 users share the same resources. We speak of soft and hard congestion.
Hard congestion is the equivalent to congestion in GSM and means that no resources are left to serve a user, whereby soft congestion happens when the network grants fewer resources to the mobile than requested. The TBF scheduler within the PCU decides, whether a mobile gets less timeslots. The block scheduler decides if a mobile gets interleaved with other mobiles onto the same PDCHs (TBF interleaving) See also 3.2.4.2.
3.4.3.1 Soft congestionA basic check ofGPRS_AVAIL_PDTCH_MEAN + EGPRS_AVAIL_PDTCH_MEAN – MAX(DL_BUSY_PDTCH_MEAN; UL_BUSY_PDTCH_MEAN)should result in 2 unused PDCHs in average.
In GSR7 the cell statistics DL_PDTCH_CONGESTION and UL_PDTCH_CONGESTION (see 3.4.3.10) count the number of congested block periods. The definition, when a PDCH is congested (1 to 4 MS per PDCH) is set by the cell parameter gprs_cell_cgt_thr. It can be used as soft congestion detector, when setting it to 1 (= 1 MS per PDCH). These two statistics are removed in GSR8 and replaced by GPRS_CELL_CONGESTION.
System Performance Group Vienna Page 82/137Motorola Confidential Proprietary

In GSR8 a new distribution statistic, GPRS_CELL_CONGESTION (see 3.4.3.11) is introduced.
The key statistic TBF Interleaving Activity (see 3.4.3.13) as well as the statistic TBF_SESSIONS (see 3.4.3.14) allows checking the grade of mean interleaving onto a cell’s PDCHs.
3.4.3.2 Hard congestionThe statistic NO_PDTCH_AVAIL (see 3.4.3.16) and NO_PDTCH_AVAIL_TIME (see 3.4.3.17) allow to check how often and for how long neither reserved nor switchable PDCHs are available because all resources are taken for GSM voice calls. Note that this only means that no GPRS is available and NOT that there was an actual attempt.
Here starts the list of statistics related to PDTCH Utilisation/Congestion
3.4.3.3 AVAIL_PDTCHGPRS_AVAIL_PDTCH_MAXGPRS_AVAIL_PDTCH_MEANEGPRS_AVAIL_PDTCH_MAXEGPRS_AVAIL_PDTCH_MEAN
Description:These 4 cell statistics measure the mean and maximum number of available (reserved or switchable) PDCHs, including the PCCCH/PBCCH timeslot, which supports only 2 TBFs interleaved instead of 4. A PDCH is available when its administrative state is unlocked or shutting down and the operational state is enabled. It is unavailable when its administrative state changes to locked or the operational state changes to disabled. The statistic is then incremented or decremented when there is a change in PDCH states as described above.
GPRS_AVAIL_PDTCH measures available GPRS PDCHs and EGPRS_AVAIL_PDTCH measures available EGPRS PDCHs.
1 unit represents 1 available PDCH.
Applicable release: 1740 onwards
Range:The number of configured PDCHs should not be smaller than 4, as the maximum number of timeslots a mobile can use is 4. When GPRS_AVAIL_PDTCH_MEAN+ EGPRS_AVAIL_PDTCH_MEAN is reduced, an outage can be assumed.
Usage:When GPRS_AVAIL_PDTCH_MEAN+ EGPRS_AVAIL_PDTCH_MEAN is reduced, the utilisation of the remaining PDCHs will increase. The key statistics
System Performance Group Vienna Page 83/137Motorola Confidential Proprietary

PDTCH_UTILISATION_BY_ALLOCATION (see 3.4.3.6) and PDTCH_UTILISATION_BY_TRAFFIC (see 3.4.3.7) can be consulted.
3.4.3.4 BUSY_PDTCHDL_BUSY_PDTCH_MAXDL_BUSY_PDTCH_MEANUL_BUSY_PDTCH_MAXUL_BUSY_PDTCH_MEAN
Description:These 4 cell statistics measure the mean and maximum number of active (busy) PDCHs in the UL and DL. It also includes times of no activity, which makes this key statistic useful for resource planning but less useful for throughput evaluations. Times of no activity reduce the average.
1 unit represents 1 busy PDTCH.
Applicable release: 1740 onwards
Range:GPRS_AVAIL_PDTCH_MEAN + EGPRS_AVAIL_PDTCH_MEAN – MAX(DL_BUSY_PDTCH_MEAN; UL_BUSY_PDTCH_MEAN) should not be lower than 2.
Usage:These statistics should be used to assess the occupancy of GPRS resources in the uplink and downlink directions. When compared with the number of PDCHs equipped in a cell, these key statistics can be used to identify cells requiring a capacity upgrade. See key statistic PDTCH_UTILISATION_BY_ALLOCATION (3.4.3.6). For example, if DL_BUSY_PDTCH_MEAN exceeds a certain percentage of the number of PDCHs equipped in the cell, more PDCHs must be equipped.
Note: The utilisation of PDCHs overhead blocks such as super coattail RLC/MAC blocks. Given that a cell may have a relatively high PDTCH utilisation caused mainly by super-coattail RLC/MAC block transmissions; this statistic does not give a true indication of the efficiency of the GPRS resources.
3.4.3.5 DOWNLINK_BIASDescription:These key statistics measure the ratio of downlink to uplink traffic in the cell.
No unit. Ratio.
Applicable release: 1740 onwards
Range:
System Performance Group Vienna Page 84/137Motorola Confidential Proprietary

A typical value for DL_BIAS summarised per day is 2-8, meaning that 2 to 8 times as much DL data is received than UL data sent.
Usage:These key statistics provide information about the characteristics of the applications being used in a cell in terms of the predominant direction of transmission. If the majority of cell traffic is in the downlink direction, then optimisation activities should be focussed on downlink GPRS/EGPRS resources.
Together with the key statistic UL_TERMINAL_TYPE_ACTIVITY (see 3.4.3.9) DOWNLINK_BIAS can be used to tune the PCU parameter gprs_ul_dl_bias.
Formulae:DL_BIAS_GPRS =(DL_RLC_ACK_NEW_BLKS_CS_1 + DL_RLC_ACK_NEW_BLKS_CS_2 + DL_RLC_ACK_NEW_BLKS_CS_3 + DL_RLC_ACK_NEW_BLKS_CS_4 + DL_RLC_UNACK_NEW_BLKS_CS_1 + DL_RLC_UNACK_NEW_BLKS_CS_2 + DL_RLC_UNACK_NEW_BLKS_CS_3 + DL_RLC_UNACK_NEW_BLKS_CS_4)/ (UL_RLC_ACK_NEW_BLKS_CS_1 + UL_RLC_ACK_NEW_BLKS_CS_2 + UL_RLC_ACK_NEW_BLKS_CS_3 + UL_RLC_ACK_NEW_BLKS_CS_4 + UL_RLC_UNACK_NEW_BLKS_CS_1 + UL_RLC_UNACK_NEW_BLKS_CS_2 + UL_RLC_UNACK_NEW_BLKS_CS_3 + UL_RLC_UNACK_NEW_BLKS_CS_4)
DL_BIAS_EGPRS = (DL_RLC_ACK_NEW_BLKS_MCS_1 + DL_RLC_ACK_NEW_BLKS_MCS_2 + DL_RLC_ACK_NEW_BLKS_MCS_3 + DL_RLC_ACK_NEW_BLKS_MCS_4 + DL_RLC_ACK_NEW_BLKS_MCS_5 + DL_RLC_ACK_NEW_BLKS_MCS_6 + DL_RLC_ACK_NEW_BLKS_MCS_7 + DL_RLC_ACK_NEW_BLKS_MCS_8 + DL_RLC_ACK_NEW_BLKS_MCS_9 + DL_RLC_UNACK_NEW_BLKS_MCS_1 + DL_RLC_UNACK_NEW_BLKS_MCS_2 + DL_RLC_UNACK_NEW_BLKS_MCS_3 + DL_RLC_UNACK_NEW_BLKS_MCS_4 + DL_RLC_UNACK_NEW_BLKS_MCS_5 + DL_RLC_UNACK_NEW_BLKS_MCS_6 + DL_RLC_UNACK_NEW_BLKS_MCS_7 + DL_RLC_UNACK_NEW_BLKS_MCS_8 + DL_RLC_UNACK_NEW_BLKS_MCS_9) / (UL_RLC_ACK_NEW_BLKS_MCS_1 + UL_RLC_ACK_NEW_BLKS_MCS_2 + UL_RLC_ACK_NEW_BLKS_MCS_3 + UL_RLC_ACK_NEW_BLKS_MCS_4 + UL_RLC_ACK_NEW_BLKS_MCS_5 + UL_RLC_ACK_NEW_BLKS_MCS_6 + UL_RLC_ACK_NEW_BLKS_MCS_7 + UL_RLC_ACK_NEW_BLKS_MCS_8 + UL_RLC_ACK_NEW_BLKS_MCS_9 + UL_RLC_UNACK_NEW_BLKS_MCS_1 + UL_RLC_UNACK_NEW_BLKS_MCS_2 + UL_RLC_UNACK_NEW_BLKS_MCS_3 + UL_RLC_UNACK_NEW_BLKS_MCS_4 + UL_RLC_UNACK_NEW_BLKS_MCS_5 + UL_RLC_UNACK_NEW_BLKS_MCS_6 + UL_RLC_UNACK_NEW_BLKS_MCS_7 + UL_RLC_UNACK_NEW_BLKS_MCS_8 + UL_RLC_UNACK_NEW_BLKS_MCS_9)
3.4.3.6 PDTCH_UTILISATION_BY_ALLOCATIONDescription:This key statistic shows the ratio of busy to available PDCHs in a cell.
System Performance Group Vienna Page 85/137Motorola Confidential Proprietary

1 unit represents a percentage.
Applicable release: 1740 onwards
Range:If any of the two PDTCH_UTILISATION_BY_ALLOCATION key stats exceeds 90% more PDTCHs should be equipped. In any case,GPRS_AVAIL_PDTCH_MEAN + EGPRS_AVAIL_PDTCH_MEAN – MAX(DL_BUSY_PDTCH_MEAN;UL_BUSY_PDTCH) should not be smaller than 2.
Usage:This key statistic can be used to check if the number of allocated PDTCHs in a cell is adequate. However, the precise threshold for upgrading GPRS resources is dependent on the quality of service requirements of the relevant network.
Formulae:DL_PDTCH_UTILISATION_BY_ALLOCATION =DL_BUSY_PDTCH_MEAN*100/ (GPRS_AVAIL_PDTCH_MEAN + EGPRS_AVAIL_PDTCH_MEAN)
UL_PDTCH_UTILISATION_BY_ALLOCATION =UL_BUSY_PDTCH_MEAN*100/ (GPRS_AVAIL_PDTCH_MEAN + EGPRS_AVAIL_PDTCH_MEAN)
3.4.3.7 PDTCH_UTILISATION_BY_TRAFFICDescription:This key statistic monitors the utilisation of GPRS resources per cell, to detect where the GPRS traffic (data + control blocks) is high compared to the GPRS capacity of the cell.
1 unit represents a percentage.
Applicable release: 1740 onwards
Range:A percentage frequently higher than 25% should lead to adding PDTCHs in the affected cell. In any case, GPRS_AVAIL_PDTCH_MEAN + EGPRS_AVAIL_PDTCH_MEAN – MAX(DL_BUSY_PDTCH_MEAN;UL_BUSY_PDTCH) should not be smaller than 2.
Usage:Together with the key statistic PDTCH_UTILISATION_BY_ALLOCATION (see 3.4.3.6) for monitoring timeslot utilisation and PDTCH_UTILISATION_PER_TERMINAL_TYPE (see 3.4.3.8) for monitoring PDTCH utilisation by traffic and per terminal type, this key statistic gives a good indication of overall GPRS utilisation on the cell. Additional, similar statistics are
System Performance Group Vienna Page 86/137Motorola Confidential Proprietary

GPRS_CELL_CONGESTION (see 3.4.3.11) and CELL_CONGESTION_TIME (see 3.4.3.12).
Formulae:DL_PDTCH_UTILISATION_BY_TRAFFIC =((DL_RLC_ACK_NEW_BLKS + DL_RLC_UNACK_NEW_BLKS + DL_RLC_NACK_BLKS + DL_RLC_RETX_BLKS + DL_RLC_DDTR_BLKS)*100 + AIR_DL_CONTROL_BLKS)*100/ ((GPRS_AVAIL_PDTCH_MEAN + EGPRS_AVAIL_PDTCH_MEAN)*INTERVAL*50)
UL_PDTCH_UTILISATION_BY_TRAFFIC =((UL_RLC_ACK_NEW_BLKS + UL_RLC_UNACK_NEW_BLKS + UL_RLC_RETX_BLKS)*100 + AIR_UL_CONTROL_BLKS)*100/ ((GPRS_AVAIL_PDTCH_MEAN + EGPRS_AVAIL_PDTCH_MEAN)*INTERVAL*50)
3.4.3.8 PDTCH_UTILISATION_PER_TERMINAL_TYPEDescription:This key statistic provides the PDTCH utilisation rate on a per-terminal-type basis. It compares the maximum possible number of RLC/MAC blocks per terminal type with the actual sent data blocks per terminal type. Although the formulae are similar to Throughput per Terminal Type (DL/UL), this key statistic provides different information. The focus here is on the RLC blocks, not on throughput.
1 unit represents a percentage.
Applicable release: 1740 onwards
Range: Nowadays MS support mostly 3 and 4 TS MS in the downlink and 1 or 2 TS in the uplink. This should be reflected in these stats.
Usage:This set of key statistics provides another way of viewing PDTCH utilisation. The piece of the “traffic cake” that each MS multislot class is responsible for can be checked.
Reasons for low utilisation of a certain terminal type: TBF Interleaving and timeslot sharing reduces the effective bandwidth per TBF (see
TBF_INTERLEAVING_ACTIVITY, 3.4.3.13). Bad RF quality (see BLER statistics, 3.5.1 and DL_RLC_MAC_WINDOW_STALL,
3.3.6). Frequent super coattail periods within the TBFs (see raw statistic
DL_RLC_DDTR_BLKS, 3.3.1). Low number of PDTCHs equipped. This leads to less data transmitted in more TBF
time (see PDTCH_UTILISATION_BY_ALLOCATION, 3.4.3.6).
System Performance Group Vienna Page 87/137Motorola Confidential Proprietary

Note: RLC signalling blocks are not considered; therefore this key statistic can never reach 100%.
Formulae:DL_PDTCH_UTILISATION_1_TS =DL_RADIO_BLKS_1_TS*10000/DL_TBF_TIME_1_TS
DL_PDTCH_UTILISATION_2_TS =DL_RADIO_BLKS_2_TS*10000/(DL_TBF_TIME_2_TS*2)
DL_PDTCH_UTILISATION_3_TS =DL_RADIO_BLKS_3_TS*10000/(DL_TBF_TIME_3_TS*3)
DL_PDTCH_UTILISATION_4_TS =DL_RADIO_BLKS_4_TS*10000/(DL_TBF_TIME_4_TS*4)
UL_PDTCH_UTILISATION_1_TS =(UL_RADIO_BLKS_8PSK_1_TS + UL_RADIO_BLKS_GMSK_1_TS)*10000/ (UL_TBF_TIME_8PSK_1_TS + UL_TBF_TIME_GMSK_1_TS)
UL_PDTCH_UTILISATION_2_TS = (UL_RADIO_BLKS_8PSK_2_TS + UL_RADIO_BLKS_GMSK_2_TS)*10000/ ((UL_TBF_TIME_8PSK_2_TS + UL_TBF_TIME_GMSK_2_TS)*2)
3.4.3.9 TERMINAL_TYPE_ACTIVITYDescription:This set of key statistics calculates the percentage of activity per terminal type, (terminal type relates to the maximum number of timeslots the corresponding multislot class can utilise).
1 unit represents a percentage.
Applicable release: 1740 onwards
Range:Not applicable.
Usage:This set of key statistics can be used to see, which terminal type account for which percentage of TBF time. It complements the meaning of other “terminal type” key statistics THROUGHPUT_PER_TERMINAL_TYPE (see 3.2.1.2) and PDTCH_UTILISATION_PER_TERMINAL_TYPE (see 3.4.3.8) in the way that it allows to weight the key statistics for the more active (in terms of TBF time) terminal types.Another use is the help in resource planning, e.g. if mobiles capable of 4 downlink timeslots account for most of the TBF time, it is important to have at least 4 PDTCHs equipped to serve this terminal type.
System Performance Group Vienna Page 88/137Motorola Confidential Proprietary

Note: Higher terminal types (mobiles with more timeslots) tend to have shorter TBFs because they can receive and transmit the required data in shorter time due to the higher bandwidth; thus this key statistic is biased towards lower terminal types.
Formulae:DL_TERMINAL_TYPE_ACTIVITY_1_TS =DL_TBF_TIME_1_TS * 100/ (DL_TBF_TIME_1_TS + DL_TBF_TIME_2_TS + DL_TBF_TIME_3_TS + DL_TBF_TIME_4_TS)
DL_TERMINAL_TYPE_ACTIVITY_2_TS =DL_TBF_TIME_2_TS * 100 / (DL_TBF_TIME_1_TS + DL_TBF_TIME_2_TS + DL_TBF_TIME_3_TS + DL_TBF_TIME_4_TS)
DL_TERMINAL_TYPE_ACTIVITY_3_TS =DL_TBF_TIME_3_TS * 100 / (DL_TBF_TIME_1_TS + DL_TBF_TIME_2_TS + DL_TBF_TIME_3_TS + DL_TBF_TIME_4_TS)
DL_TERMINAL_TYPE_ACTIVITY_4_TS =DL_TBF_TIME_4_TS * 100 / (DL_TBF_TIME_1_TS + DL_TBF_TIME_2_TS + DL_TBF_TIME_3_TS + DL_TBF_TIME_4_TS)
UL_TERMINAL_TYPE_ACTIVITY_1_TS =(UL_TBF_TIME_8PSK_1_TS + UL_TBF_TIME_GMSK_1_TS) * 100 / (UL_TBF_TIME_8PSK_1_TS + UL_TBF_TIME_GMSK_1_TS + UL_TBF_TIME_8PSK_2_TS + UL_TBF_TIME_GMSK_2_TS)
UL_TERMINAL_TYPE_ACTIVITY_2_TS =(UL_TBF_TIME_8PSK_2_TS + UL_TBF_TIME_GMSK_2_TS) * 100 / (UL_TBF_TIME_8PSK_1_TS + UL_TBF_TIME_GMSK_1_TS + UL_TBF_TIME_8PSK_2_TS + UL_TBF_TIME_GMSK_2_TS)
3.4.3.10 PDTCH_CONGESTIONDL_PDTCH_CONGESTIONUL_PDTCH_CONGESTION
Description:These cell statistics count the number of times a cell is congested due to MS load on the available air resources on the downlink (DL_PDTCH_CONGESTION) or uplink (UL_PDTCH_CONGESTION). Air interface congestion is defined by the cell parameter gprs_cell_cgt_thr and can be set from 1 to 4 MS per TS. If it set to 1 the PDTCH_CONGESTION statistics are pegged as soon as there is traffic in the cell. The PDTCH congestion is computed every 8s in 20ms block periods when the congestion threshold is reached.
1 unit represents a 20ms block period.
System Performance Group Vienna Page 89/137Motorola Confidential Proprietary

Applicable release: 1740 only
Range:It depends on the setting of gprs_cell_cgt_thr. It can be set from x=1 to 4, so a degree of TBF Interleaving of x MS per TS must take place before the PDTCH_CONGESTION stats are pegged. Frequent pegging (more than once per day) of one of these statistics indicates a required expansion of PDCHs. The more time the PDCHs are congested the more noticeable is the bandwidth reduction and consequently the throughput degradation.
Usage:The problem with these stats is that the grade of congestion is not known. Could be interleaving of 2 TBFs per TS or 4 TBFs per TS that caused a pegging of these stats (provided that gprs_cell_cgt_thr = 2). It is required to further check the grade of TBF_INTERLEAVING_ACTIVITY (see 3.4.3.13) and the PDTCH_UTILISATION key statistics (see 3.4.3.6, 3.4.3.7 and 3.4.3.8).
If NC2 is not enabled, the congestion relief is not working anyway, so the threshold gprs_cell_cgt_thr can be reduced to 1 to make the _CONGESTION stats more sensitive.
3.4.3.11 GPRS_CELL_CONGESTIONDescription:This cell statistic provides a distribution of cell congestion values (see Figure 27 for the calculation of congestion) in 6s intervals (pegs 600 times per 30min stats interval). The higher value of DL and UL congestion is pegged.
Name Bin # RangeGPRS_CELL_CONGESTION_25 0 >= 0%, < 25%GPRS_CELL_CONGESTION_30 1 >= 25%, < 30%GPRS_CELL_CONGESTION_35 2 >= 30%, < 35%GPRS_CELL_CONGESTION_40 3 >= 35%, < 40%GPRS_CELL_CONGESTION_45 4 >= 40%, < 45%GPRS_CELL_CONGESTION_50 5 >= 45%, < 50%GPRS_CELL_CONGESTION_55 6 >= 50%, < 55%GPRS_CELL_CONGESTION_60 7 >= 55%, < 60%GPRS_CELL_CONGESTION_65 8 >= 60%, < 65%GPRS_CELL_CONGESTION_70 9 >= 65%, < 70%GPRS_CELL_CONGESTION_75 10 >= 70%, < 75%GPRS_CELL_CONGESTION_80 11 >= 75%, < 80%GPRS_CELL_CONGESTION_85 12 >= 80%, < 85%GPRS_CELL_CONGESTION_90 13 >= 85%, < 90%GPRS_CELL_CONGESTION_95 14 >= 90%, < 95%GPRS_CELL_CONGESTION_100 15 >= 95%, <= 100%Figure 26 - Bin ranges for GPRS_CELL_CONGESTION
1 unit represents 1 time that the congestion rate falls in the specific range at the end of a given 6-second duration.
System Performance Group Vienna Page 90/137Motorola Confidential Proprietary

max availability in the cell=max available PDTCHs x 4 + max available PBCCH/PCCCHs x 2Figure 27 - Formula of GPRS_CELL_CONGESTION
Applicable release: 1800
Range:Most of the 600 calculations per interval should peg bin 0 (0 to 25%).
Usage:A congestion above 25% (bin 1 and above) already causes a performance degradation by reducing the max. possible throughput for affected users. If it happens frequently each day that the GPRS_CELL_CONGESTION exceeds 25% additional PDCHs should be equipped. A similar statistic, except that uses an assumption about the maximum possible number of RLC blocks during a stats interval, is the key statistic PDTCH_UTILISATION_BY_TRAFFIC (see 3.4.3.7)
3.4.3.12 CELL_CONGESTION_TIMEDescription:This key statistic uses the distribution statistic GPRS_CELL_CONGESTION (see 3.4.3.11) to calculate the time a cell was congested more than 25%, which is a TBF interleaving of 2TBFs per TS.
1 unit represents 1s.
Applicable release: 1800
Range:This statistic provides similar information to the GSR7 PDTCH_CONGESTION statistics (see 3.4.3.10), which are replaced by GPRS_CELL_CONGESTION in GSR8. The more time the PDCHs are congested the more noticeable is the bandwidth reduction and consequently the throughput degradation.
Usage:By leaving out bin 0 (0-25%) this key statistic indicates the amount of time a cell was congested more than 25%, which can be used to identify busy cells. To learn more about the congestion rate the counter array distribution needs to be analysed. This key statistic can be correlated with the following other key statistics: TBF_INTERLEAVING_ACTIVITY (see 3.4.3.13) and the PDTCH_UTILISATION key statistics (see 3.4.3.6, 3.4.3.7 and 3.4.3.8).
Formula:CELL_CONGESTION_TIME =(GPRS_CELL_CONGESTION_30 + GPRS_CELL_CONGESTION_35 + GPRS_CELL_CONGESTION_40 + GPRS_CELL_CONGESTION_45 +
System Performance Group Vienna Page 91/137Motorola Confidential Proprietary

GPRS_CELL_CONGESTION_50 + GPRS_CELL_CONGESTION_55 + GPRS_CELL_CONGESTION_60 + GPRS_CELL_CONGESTION_65 + GPRS_CELL_CONGESTION_70 + GPRS_CELL_CONGESTION_75 + GPRS_CELL_CONGESTION_80 + GPRS_CELL_CONGESTION_85 + GPRS_CELL_CONGESTION_90 + GPRS_CELL_CONGESTION_95 + GPRS_CELL_CONGESTION_100)*6
3.4.3.13 TBF_INTERLEAVING_ACTIVITYDescription:These key statistics provide information about interleaving TBFs (how many TBFs per timeslot?). Full utilisation of the available PDTCHs without TBF interleaving results in TBF Interleaving Activity = 1; as soon as interleaving takes place or mobiles could utilise more PDTCHs than equipped, the value exceeds 1.
1 unit represents the average number of TBFs per PDTCH.
Applicable release: 1740 onwards
Range:A typical value for these stats is <1. Due to the fact that the raw stats granularity is low (e.g. 30min), the peaks are not visible.
Usage:These key statistics can help to understand whether a low throughput is due to PDTCH congestion / lack of PDTCH - as opposed to bad quality. It provides information in addition to the key statistic PDTCH_UTILISATION_BY_ALLOCATION (see 3.4.3.6). PDTCH Utilisation merely shows the percentage of used resources, while TBF Interleaving Activity shows the “over-use” of resources. The problem with these statistics is the low granularity of the raw statistics (30min at best), as peak interleaving is not shown. For better information on interleaving the GSR8 statistic TBF_SESSIONS (see 3.4.3.14) can be checked.
Formulae:DL_TBF_INTERLEAVING_ACTIVITY =(DL_TBF_TIME_1_TS + DL_TBF_TIME_2_TS*2 + DL_TBF_TIME_3_TS*3 + DL_TBF_TIME_4_TS*4)*0.02/ (DL_BUSY_PDTCH_MEAN*INTERVAL)
UL_TBF_INTERLEAVING_ACTIVITY =(UL_TBF_TIME_8PSK_1_TS + UL_TBF_TIME_GMSK_1_TS + (UL_TBF_TIME_8PSK_2_TS + UL_TBF_TIME_GMSK_2_TS)*2)*0.02/ (UL_BUSY_PDTCH_MEAN*INTERVAL)
3.4.3.14 TBF_SESSIONSDescription:This PRP statistic indicates the average and maximum ongoing simultaneous TBFs at the end of each 6-second duration on a PRP board.
System Performance Group Vienna Page 92/137Motorola Confidential Proprietary

1 unit represents 1 TBF session. The range is 0 to 120. The capacity is measured by the number of mobiles a PRP board can support (120).
Applicable release: 1800
Range:The maximum possible number of parallel TBFs on a PRP is 120.
Usage:This statistic can be correlated with the PRP_LOAD statistic (see 3.4.2.1)
3.4.3.15 CONG_REL_DL_SCTSThis statistic tracks the total number of downlink TBF terminations under the delayed TBF release mode (super-coattail) in a cell as cell availability goes below the following thresholds:
25 block periods (500ms) old super-coattail will be terminated if the:o cell availability reached is ≤ 25%, in a cell with ≤ 3 TS.o cell availability reached is ≤ 20%, in a cell with ≤ 5 TS.o cell availability reached is ≤ 10%, in a cell with > 5 TS.
15 block periods (300ms) old super-coattail will be terminated if the:o cell availability reached is ≤ 35%, in a cell with ≤ 5 TS.o cell availability reached is ≤ 30%, in a cell with > 5 TS.
The minimum super-coattail duration is 15 block periods or 300ms. No super-coattail below 15 block periods is terminated.
Figure 28 - Formula of Cell Availability
The DL super coat-tail termination as a function of cell availability needs to be enabled with the BSS parameter ddtr_ctrl_enabled.
1 unit represents 1 terminated SCT.
Applicable release: 1740 onwards
Range:If the parameter ddtr_ctrl_enabled is disabled, the statistic CONG_REL_DL_SCTS should be 0 in all the BSC’s cells. If it is enabled, the higher the value of this statistic, the more often the cell availability decreases below the thresholds mentioned above. If it pegs frequently (several times a day, more PDCHs should be added.
Usage:This statistic can be used for resource planning (see above).
System Performance Group Vienna Page 93/137Motorola Confidential Proprietary

If this statistic pegs often it is possible to reduce the SCT duration (parameter delay_dl_rel_dur) if it is too long (> 25 block periods=500ms). This measure should reduce the number of times congestion relief takes place.
3.4.3.16 NO_PDTCH_AVAILDescription:This cell statistic counts the number of times neither switchable nor reserved PDTCHs are available. When the last PDTCH available is taken for a voice call, the count is incremented by 1.
1 unit represents one time the last available PDTCH has been reconfigured to TCH.
Applicable release: 1740 onwards
Range:When this statistic is pegged more often (as opposed to very rarely), more fixed PDTCHs should be configured. Caution: GSM resources should be expanded if GSM congestion occurs frequently.
Usage:This statistic indicates hard congestion, which should be prevented under all circumstances. It can be pegged due to:
GPRS outages. Alarms can be checked Stolen by CS. GSM statistics (like TCH_BLOCKING) can be consulted Stolen by SD-dynamic reconfiguration feature. GSM statistics (SD_BLOCKING) can
be consulted.If GSM congestion can be noticed, more carriers should be equipped.
3.4.3.17 NO_PDTCH_AVAIL_TIMEDescription:This cell statistic measures the amount of time in 20 millisecond periods during the stats interval, when neither switchable nor reserved PDTCHs are available.When the last PDTCH available is taken for a voice call, the timer is started and stopped when at least one PDTCH becomes available.
1 unit represents a 20ms block period.
Applicable release: 1740 onwards
Range:The time of hard congestion is an important measure. It should not be tolerated at all as it prevents GPRS service.
Usage:
System Performance Group Vienna Page 94/137Motorola Confidential Proprietary

This statistic indicates either a GSM resource problem or a sub-optimal planning of resources. More fixed PDTCHs should be configured. To ensure that GSM is not congested the TCH_BLOCKING statistics should be consulted. If GSM congestion can be noticed, more carriers should be equipped.
3.4.3.18 CHANNELS_SWITCHED
GPRS_CHANNELS_SWITCHEDGPRS_32K_CHANNELS_SWITCHEDEGPRS_64K_CHANNELS_SWITCHED
Description:These cell statistics counts the number of times that GPRS timeslots are used for CS or VGCS calls or reconfigured to SDCCH by the dynamic reconfiguration feature.
GPRS_CHANNELS_SWITCHED counts switches of 16k TRAU PDCHsGPRS_32K_CHANNELS_SWITCHED counts switches of 32k TRAU PDCHsEGPRS_64K_CHANNELS_SWITCHED counts switches of 64k TRAU PDCHs
1 unit represents one successfully switched timeslot.
Applicable release: 1740 onwards (the bin for VGCS calls is introduced in 1800)
Range:Timeslot stealing can reduce the available E/GPRS bandwidth. The duration of one reconfiguration lasts approx. 800ms in the worst case, so too many switches should be avoided.
Usage:The reconfiguration of PDCH resources to TCH is an indication of GSM congestion. GSM statistics (TCH_BLOCKING, SDCCH blocking) should be consulted.
The VGCS however, might also need more resources at once. This has to be investigated once the feature becomes available.
Measures against timeslot stealing: Reduce the parameter gprs_reconfig_thresh_idle_tch, to start reconfiguration at a
higher level of TCH usage. Equip more reserved PDCHs
3.4.3.19 GPRS_32K_NOT_AVAILGPRS_32K_DL_NOT_AVAILGPRS_32K_UL_NOT_AVAIL
Description:
System Performance Group Vienna Page 95/137Motorola Confidential Proprietary

These cell statistics track the number of times a 32k TRAU capable mobile is allocated 16k TRAU resources. A statistic exists for both, UL and DL.
Applicable release: 1740 onwards
Usage:Every time one of these statistics is pegged, a 32k TRAU could have been used instead of 16k TRAU, thus reducing the maximum possible bandwidth for affected users. Additional 32k TRAUs need to be configured in cells, where this stat is pegged more often.
3.4.3.20 EGPRS_64K_NOT_AVAILDescription:This cell statistic tracks the number of times an EGPRS capable mobile is allocated GPRS resources.
Applicable release: 1740 onwards
Usage:Every time this statistic is pegged, a 64k TRAU could have been used instead of a 16 or 32k TRAU, thus reducing the maximum possible bandwidth for affected users. Additional 64k TRAUs need to be configured in cells, where this stat is pegged more often.In areas without EDGE, this statistic can be used to assess how much demand is for EDGE.
3.4.3.21 TBF_DROP_RATE_ON_PACCH_LOSTDescription:This key statistic represents the percentage of TBFs that are released when its switchable PDCH is converted to TCH or SDCCH. Only those TBFs, whose PACCH are lost due to the switch to TCH are considered.The PACCH can be lost due to:
PDCH switch sync problems, PD not available
1 unit represents a percentage.
Applicable release: 1800
Range:Timeslot stealing is an indication of GSM congestion. It should happen only rarely – a value of < 2% should not be exceeded.
Usage:This key statistic shows the direct effect of timeslot stealing. An increased percentage of dropped TBFs due to switches indicates that more fixed PDCHs should be configured. Other key statistics providing information about load and congestion are:
System Performance Group Vienna Page 96/137Motorola Confidential Proprietary

PDTCH_UTILISATION_BY_ALLOCATION (see 3.4.3.6), PDTCH_UTILISATION_BY_TRAFFIC (see 3.4.3.7), TBF_INTERLEAVING_ACTIVITY (see 3.4.3.9) and CELL_CONGESTION_TIME (see 3.4.3.12).
Measures to avoid drops due to timeslot stealing: Reduce the parameter gprs_reconfig_thresh_idle_tch, to start reconfiguration at a
higher level of TCH usage. Equip more reserved PDCHs
Formula:TBF_DROP_RATE_ON_PACCH_LOST =(TBF_REL_PACCH_LOST *100) / (DL_PDTCH_SEIZURE + UL_PDTCH_SEIZURE +AIR_DL_FAILURES_EST+ AIR_UL_FAILURES_EST)
3.4.4 Coding Scheme UtilisationThis section contains coding scheme related statistics except the coding scheme utilisation key statistics. They are located in the Radio Quality section (see 3.5.2)
3.4.4.1 CS12_ON_32K_CHANDescription:This cell statistic tracks the percentage of time during which CS-1/2 blocks were transmitted on CS-3/4 capable 32k TRAU timeslots.
1 unit represents a percentage.
Applicable release: 1740 onwards
Usage:This statistic counts the time of CS-1/2 blocks on 32k TRAU no matter what direction. This is pretty bad as the UL direction with its usually very short TBFs uses CS-1/2 most of the time. Better statistics to check are the Coding Scheme Usage statistics (see 3.5.2).
3.4.4.2 CS1234_ON_64K_CHANDescription:This cell statistic represents the percentage of data blocks encoded with GPRS coding schemes over the total data blocks (GPRS/EGPRS) carried by 64k TRAUs.
1 unit represents a percentage.
Applicable release: 1800
System Performance Group Vienna Page 97/137Motorola Confidential Proprietary

Usage:This statistic can show how much the 64k TRAU timeslots are utilised by GPRS (CS-1234) traffic. Key statistics to check are the Coding Scheme Usage statistics (see 3.5.2).
3.4.4.3 CODING_SCHEME_CHANGEDescription:This cell statistic is obtained by measuring the number of coding scheme upgrades (from lower to higher coding scheme) and downgrades (from higher to lower coding scheme) for uplink and downlink in a stats interval. This statistic does NOT peg for controls blocks (always sent at CS-1) and for downlink dummy blocks (SCT blocks, also transmitted at CS-1).
Name Bin # RangeCODING_SCHEME_CHANGE Sum of all binsCODING_SCHEME_CHANGE_0 0 Total number of GPRS coding scheme upgrades
for uplink.CODING_SCHEME_CHANGE_1 1 Total number of GPRS coding scheme
downgrades for uplink.CODING_SCHEME_CHANGE_2 2 Total number of GPRS coding scheme upgrades
for downlink.CODING_SCHEME_CHANGE_3 3 Total number of GPRS coding scheme
downgrades for downlink.CODING_SCHEME_CHANGE_4 4 Total number of EGPRS coding scheme
upgrades for uplink.CODING_SCHEME_CHANGE_5 5 Total number of EGPRS coding scheme
downgrades for uplink.CODING_SCHEME_CHANGE_6 6 Total number of EGPRS coding scheme
upgrades for downlink.CODING_SCHEME_CHANGE_7 7 Total number of EGPRS coding scheme
downgrades for downlink.Figure 29 – CODING_SCHEME_CHANGE bins
1 unit represents a change of coding scheme
Applicable release: 1740 onwards
Range:As long as there are more CS upgrades then downgrades everything is fine. If:
CODING_SCHEME_CHANGE_0 < CODING_SCHEME_CHANGE_1 orCODING_SCHEME_CHANGE_2 < CODING_SCHEME_CHANGE_3 orCODING_SCHEME_CHANGE_4 < CODING_SCHEME_CHANGE_5 orCODING_SCHEME_CHANGE_6 < CODING_SCHEME_CHANGE_7,
an RF quality problem can be suspected.
Usage:
System Performance Group Vienna Page 98/137Motorola Confidential Proprietary

If the number of downgrades and upgrades are imbalanced towards more CS downgrades for a certain direction (DL or UL), an RF quality problem is likely. The Coding Scheme Usage key statistics (see 3.5.2) and BLER statistics (see 3.5.1) can be consulted to verify this suspicion.
3.4.5 RLC/MAC Efficiency
3.4.5.1 RLC_MAC_OVERHEADDescription:This key statistic provides the percentage of overhead RLC/MAC blocks (retransmissions due to NACK, pre-emptive retransmissions, super coattail blocks, control blocks) in relation to the total amount of RLC/MAC blocks, which describes the efficiency of the RLC/MAC layer.
1 unit represents a percentage.
Applicable release: 1740 onwards
Range:A typical overhead ranges from 50% (higher user traffic load) to >90% (low user traffic load).
Usage:The amount of overhead mostly relates to the amount of signalling (control blocks), except in the case of bad RF quality. Adverse RF environment leads to more retransmissions (thus increasing the amount of overhead) and impacts the following key statistics: Coding Scheme Usage Statistics (see 3.5.2), BLER Statistics (see 3.5.1) and MEAN_USER_THROUGHPUT_PER_TIMESLOT (see 3.2.1.1). Retransmissions however, are also application-dependent.
A relationship to the TBF duration is also apparent: A predomination of short TBFs leads to a basically ineffective use of RLC/MAC resources from a network perspective. The tendency: A lot of signalling, auto downlink blocks and SCT blocks – and in contrast a very low utilisation with real user data blocks can be observed. The amount of DL dummy blocks for SCT and auto DL can be seen with the corresponding statistic DL_RLC_DDTR_BLKS (see 3.3.1) and the amount of control blocks can be checked with the CONTROL_BLKS statistics (see 3.3.2). The key statistic RLC_MAC_OVERHEAD ties this information together and gives an impression of the relationship between RLC user data and “overhead”.
Formulae:DL_RLC_MAC_OVERHEAD =((DL_RLC_NACK_BLKS + DL_RLC_RETX_BLKS + DL_RLC_DDTR_BLKS)*100 + AIR_DL_CONTROL_BLKS)*100/ ((DL_RLC_ACK_NEW_BLKS + DL_RLC_UNACK_NEW_BLKS + DL_RLC_NACK_BLKS + DL_RLC_RETX_BLKS + DL_RLC_DDTR_BLKS)*100 + AIR_DL_CONTROL_BLKS)
System Performance Group Vienna Page 99/137Motorola Confidential Proprietary

UL_RLC_MAC_OVERHEAD =(UL_RLC_RETX_BLKS*100 + AIR_UL_CONTROL_BLKS)*100/ ((UL_RLC_ACK_NEW_BLKS + UL_RLC_UNACK_NEW_BLKS + UL_RLC_RETX_BLKS)*100 + AIR_UL_CONTROL_BLKS)
System Performance Group Vienna Page 100/137Motorola Confidential Proprietary

3.5 Radio Quality
3.5.1 BLER statisticsThe block error rate is a direct measure of RF quality. A high BLER (increased packet loss) causes air interface bandwidth reduction and consequently lower achievable throughput.
3.5.1.1 DL_BLERDescription:In GSR7 the DL BLER can be calculated from the ACK_NEW and NACK RLC blocks (see 3.3.1). No UL BLER can be calculated because NACK BLKS stats are only available for DL. This set of key statistics compares all retransmitted RLC blocks of a coding scheme to the sum of all blocks of the same coding scheme.
1 unit represents a percentage.
Applicable release: 1740 onwards
Range:
Usage:This set of key statistics can be used to identify cells of poor RF quality. Poor radio conditions will result in low throughput due to packet loss and bandwidth reduction. Higher BLER values indicate that throughput issues are related to the radio quality. The BLER statistics can as well be used to verify the Coding Scheme usage, which will change towards lower coding schemes, not only for bad RF quality but as well for short TBFs (see 3.3.7.2).
Formulae:DL_BLER_CS_1 =DL_RLC_NACK_BLKS_CS_1*100/(DL_RLC_ACK_NEW_BLKS_CS_1 + DL_RLC_NACK_BLKS_CS_1)
DL_BLER_CS_2 =DL_RLC_NACK_BLKS_CS_2*100/(DL_RLC_ACK_NEW_BLKS_CS_2 + DL_RLC_NACK_BLKS_CS_2)
DL_BLER_CS_3 =DL_RLC_NACK_BLKS_CS_3*100/(DL_RLC_ACK_NEW_BLKS_CS_3 + DL_RLC_NACK_BLKS_CS_3)
DL_BLER_CS_4 =DL_RLC_NACK_BLKS_CS_4*100/(DL_RLC_ACK_NEW_BLKS_CS_4 + DL_RLC_NACK_BLKS_CS_4)
System Performance Group Vienna Page 101/137Motorola Confidential Proprietary

DL_BLER_MCS_1 =DL_RLC_NACK_BLKS_MCS_1*100/(DL_RLC_ACK_NEW_BLKS_MCS_1 + DL_RLC_NACK_BLKS_MCS_1)
DL_BLER_MCS_2 =DL_RLC_NACK_BLKS_MCS_2*100/(DL_RLC_ACK_NEW_BLKS_MCS_2 + DL_RLC_NACK_BLKS_MCS_2)
DL_BLER_MCS_3 =DL_RLC_NACK_BLKS_MCS_3*100/(DL_RLC_ACK_NEW_BLKS_MCS_3 + DL_RLC_NACK_BLKS_MCS_3)
DL_BLER_MCS_4 =DL_RLC_NACK_BLKS_MCS_4*100/(DL_RLC_ACK_NEW_BLKS_MCS_4 + DL_RLC_NACK_BLKS_MCS_4)
DL_BLER_MCS_5 =DL_RLC_NACK_BLKS_MCS_5*100/(DL_RLC_ACK_NEW_BLKS_MCS_5 + DL_RLC_NACK_BLKS_MCS_5)
DL_BLER_MCS_6 =DL_RLC_NACK_BLKS_MCS_6*100/(DL_RLC_ACK_NEW_BLKS_MCS_6 + DL_RLC_NACK_BLKS_MCS_6)
DL_BLER_MCS_7 =DL_RLC_NACK_BLKS_MCS_7*100/(DL_RLC_ACK_NEW_BLKS_MCS_7 + DL_RLC_NACK_BLKS_MCS_7)
DL_BLER_MCS_8 =DL_RLC_NACK_BLKS_MCS_8*100/(DL_RLC_ACK_NEW_BLKS_MCS_8 + DL_RLC_NACK_BLKS_MCS_8)
DL_BLER_MCS_9 =DL_RLC_NACK_BLKS_MCS_9*100/(DL_RLC_ACK_NEW_BLKS_MCS_9 + DL_RLC_NACK_BLKS_MCS_9)
3.5.1.2 Per Carrier BLER statisticsIn GSR8 the carrier BLER statistics give detailed info about DL and UL BLER values.The following carrier raw counters are available in GSR8:
DL_BLER_CS1DL_BLER_CS2DL_BLER_CS3DL_BLER_CS4UL_BLER_CS1
System Performance Group Vienna Page 102/137Motorola Confidential Proprietary

UL_BLER_CS2UL_BLER_CS3UL_BLER_CS4DL_BLER_MCS1DL_BLER_MCS2DL_BLER_MCS3DL_BLER_MCS4DL_BLER_MCS5DL_BLER_MCS6DL_BLER_MCS7DL_BLER_MCS8DL_BLER_MCS9UL_BLER_MCS1UL_BLER_MCS2UL_BLER_MCS3UL_BLER_MCS4UL_BLER_MCS5UL_BLER_MCS6UL_BLER_MCS7UL_BLER_MCS8UL_BLER_MCS9
3.5.2 Coding Scheme UsageA consequence of increased BLER (see 3.5.1) can be the decreased usage of high coding schemes. The key stats CS Usage and Bandwidth Indicator described below can help to analyse this relationship. Another reason for the tendency towards lower coding schemes can be the predomination of very short TBFs (see 3.2.3.2).
3.5.2.1 CS_USAGEDescription:This set of key statistics provides usage figures of all UL and DL coding schemes for GPRS.
1 unit represents a percentage.
Applicable release: 1740 onwards
Range:Not applicable.
Usage:These key statistics can be used to assess the proportion of RLC blocks transmitted in a particular coding scheme. Provided that TBFs are sufficiently long to allow the possibility for coding scheme changes, these statistics provide an indication of the radio channel quality
System Performance Group Vienna Page 103/137Motorola Confidential Proprietary

conditions in a cell. Thus, a high percentage of the high bit rate coding schemes would generally indicate good channel conditions. For example, a high percentage of CS-4 would generally indicate good radio conditions. Conversely a high percentage of CS-1 usage would indicate poor radio conditions.Poor radio conditions will be highlighted by low values for the Mean User Throughput per Timeslot key statistics. If the throughput is low, a high percentage of CS1 indicates either that throughput issues could be related to the radio quality or that a high amount of short TBFs dominate the cell (this can be verified with the key statistic Mean TBF Duration (DL/UL)).
Note: GSR6 introduced one-phase access, which is the most applied access method. Until the first acknowledgement is received by the mobile with a “fresh” coding scheme (contention resolution phase), the initial coding scheme set by the parameters init_dl_cs and init_ul_cs is used. Short TBFs therefore use mostly CS-1 or CS-2 (MCS-1 or MCS-2 for EDGE).
Formulae:CS1_USE_DL =(DL_RADIO_BLKS_1_TS_CS_1 + DL_RADIO_BLKS_2_TS_CS_1 + DL_RADIO_BLKS_3_TS_CS_1 + DL_RADIO_BLKS_4_TS_CS_1)*100/ (DL_RADIO_BLKS_1_TS + DL_RADIO_BLKS_2_TS + DL_RADIO_BLKS_3_TS + DL_RADIO_BLKS_4_TS)
CS2_USE_DL =(DL_RADIO_BLKS_1_TS_CS_2 + DL_RADIO_BLKS_2_TS_CS_2 + DL_RADIO_BLKS_3_TS_CS_2 + DL_RADIO_BLKS_4_TS_CS_2)*100/ (DL_RADIO_BLKS_1_TS + DL_RADIO_BLKS_2_TS + DL_RADIO_BLKS_3_TS + DL_RADIO_BLKS_4_TS)
CS3_USE_DL =(DL_RADIO_BLKS_1_TS_CS_3 + DL_RADIO_BLKS_2_TS_CS_3 + DL_RADIO_BLKS_3_TS_CS_3 + DL_RADIO_BLKS_4_TS_CS_3)*100/ (DL_RADIO_BLKS_1_TS + DL_RADIO_BLKS_2_TS + DL_RADIO_BLKS_3_TS + DL_RADIO_BLKS_4_TS)
CS4_USE_DL =(DL_RADIO_BLKS_1_TS_CS_4 + DL_RADIO_BLKS_2_TS_CS_4 + DL_RADIO_BLKS_3_TS_CS_4 + DL_RADIO_BLKS_4_TS_CS_4)*100/ (DL_RADIO_BLKS_1_TS + DL_RADIO_BLKS_2_TS + DL_RADIO_BLKS_3_TS + DL_RADIO_BLKS_4_TS)
CS1_USE_UL =(UL_RADIO_BLKS_8PSK_1_TS_CS_1 + UL_RADIO_BLKS_8PSK_2_TS_CS_1 + UL_RADIO_BLKS_GMSK_1_TS_CS_1 + UL_RADIO_BLKS_GMSK_2_TS_CS_1)*100/ (UL_RADIO_BLKS_8PSK_1_TS + UL_RADIO_BLKS_8PSK_2_TS + UL_RADIO_BLKS_GMSK_1_TS + UL_RADIO_BLKS_GMSK_2_TS)
CS2_USE_UL =(UL_RADIO_BLKS_8PSK_1_TS_CS_2 + UL_RADIO_BLKS_8PSK_2_TS_CS_2 + UL_RADIO_BLKS_GMSK_1_TS_CS_2 + UL_RADIO_BLKS_GMSK_2_TS_CS_2)*100/
System Performance Group Vienna Page 104/137Motorola Confidential Proprietary

(UL_RADIO_BLKS_8PSK_1_TS + UL_RADIO_BLKS_8PSK_2_TS + UL_RADIO_BLKS_GMSK_1_TS + UL_RADIO_BLKS_GMSK_2_TS)
CS3_USE_UL =(UL_RADIO_BLKS_8PSK_1_TS_CS_3 + UL_RADIO_BLKS_8PSK_2_TS_CS_3 + UL_RADIO_BLKS_GMSK_1_TS_CS_3 + UL_RADIO_BLKS_GMSK_2_TS_CS_3)*100/ (UL_RADIO_BLKS_8PSK_1_TS + UL_RADIO_BLKS_8PSK_2_TS + UL_RADIO_BLKS_GMSK_1_TS + UL_RADIO_BLKS_GMSK_2_TS)
CS4_USE_UL =(UL_RADIO_BLKS_8PSK_1_TS_CS_4 + UL_RADIO_BLKS_8PSK_2_TS_CS_4 + UL_RADIO_BLKS_GMSK_1_TS_CS_4 + UL_RADIO_BLKS_GMSK_2_TS_CS_4)*100/ (UL_RADIO_BLKS_8PSK_1_TS + UL_RADIO_BLKS_8PSK_2_TS + UL_RADIO_BLKS_GMSK_1_TS + UL_RADIO_BLKS_GMSK_2_TS)
3.5.2.2 MCS_USAGEDescription:This set of key statistics provides usage figures of all UL and DL coding schemes for EGPRS.
1 unit represents a percentage.
Applicable release: 1740 onwards
Range:Not applicable.
Usage:See 3.5.2.1.
Formulae:MCS1_USE_DL =(DL_RADIO_BLKS_1_TS_MCS_1 + DL_RADIO_BLKS_2_TS_MCS_1 + DL_RADIO_BLKS_3_TS_MCS_1 + DL_RADIO_BLKS_4_TS_MCS_1)*100/ (DL_RADIO_BLKS_1_TS + DL_RADIO_BLKS_2_TS + DL_RADIO_BLKS_3_TS + DL_RADIO_BLKS_4_TS)
MCS2_USE_DL =(DL_RADIO_BLKS_1_TS_MCS_2 + DL_RADIO_BLKS_2_TS_MCS_2 + DL_RADIO_BLKS_3_TS_MCS_2 + DL_RADIO_BLKS_4_TS_MCS_2)*100/ (DL_RADIO_BLKS_1_TS + DL_RADIO_BLKS_2_TS + DL_RADIO_BLKS_3_TS + DL_RADIO_BLKS_4_TS)
MCS3_USE_DL =(DL_RADIO_BLKS_1_TS_MCS_3 + DL_RADIO_BLKS_2_TS_MCS_3 + DL_RADIO_BLKS_3_TS_MCS_3 + DL_RADIO_BLKS_4_TS_MCS_3)*100/
System Performance Group Vienna Page 105/137Motorola Confidential Proprietary

(DL_RADIO_BLKS_1_TS + DL_RADIO_BLKS_2_TS + DL_RADIO_BLKS_3_TS + DL_RADIO_BLKS_4_TS)
MCS4_USE_DL =(DL_RADIO_BLKS_1_TS_MCS_4 + DL_RADIO_BLKS_2_TS_MCS_4 + DL_RADIO_BLKS_3_TS_MCS_4 + DL_RADIO_BLKS_4_TS_MCS_4)*100/ (DL_RADIO_BLKS_1_TS + DL_RADIO_BLKS_2_TS + DL_RADIO_BLKS_3_TS + DL_RADIO_BLKS_4_TS)
MCS5_USE_DL =(DL_RADIO_BLKS_1_TS_MCS_5 + DL_RADIO_BLKS_2_TS_MCS_5 + DL_RADIO_BLKS_3_TS_MCS_5 + DL_RADIO_BLKS_4_TS_MCS_5)*100/ (DL_RADIO_BLKS_1_TS + DL_RADIO_BLKS_2_TS + DL_RADIO_BLKS_3_TS + DL_RADIO_BLKS_4_TS)
MCS6_USE_DL =(DL_RADIO_BLKS_1_TS_MCS_6 + DL_RADIO_BLKS_2_TS_MCS_6 + DL_RADIO_BLKS_3_TS_MCS_6 + DL_RADIO_BLKS_4_TS_MCS_6)*100/ (DL_RADIO_BLKS_1_TS + DL_RADIO_BLKS_2_TS + DL_RADIO_BLKS_3_TS + DL_RADIO_BLKS_4_TS)
MCS7_USE_DL =(DL_RADIO_BLKS_1_TS_MCS_7 + DL_RADIO_BLKS_2_TS_MCS_7 + DL_RADIO_BLKS_3_TS_MCS_7 + DL_RADIO_BLKS_4_TS_MCS_7)*100/ (DL_RADIO_BLKS_1_TS + DL_RADIO_BLKS_2_TS + DL_RADIO_BLKS_3_TS + DL_RADIO_BLKS_4_TS)
MCS8_USE_DL =(DL_RADIO_BLKS_1_TS_MCS_8 + DL_RADIO_BLKS_2_TS_MCS_8 + DL_RADIO_BLKS_3_TS_MCS_8 + DL_RADIO_BLKS_4_TS_MCS_8)*100/ (DL_RADIO_BLKS_1_TS + DL_RADIO_BLKS_2_TS + DL_RADIO_BLKS_3_TS + DL_RADIO_BLKS_4_TS)
MCS9_USE_DL =(DL_RADIO_BLKS_1_TS_MCS_9 + DL_RADIO_BLKS_2_TS_MCS_9 + DL_RADIO_BLKS_3_TS_MCS_9 + DL_RADIO_BLKS_4_TS_MCS_9)*100/ (DL_RADIO_BLKS_1_TS + DL_RADIO_BLKS_2_TS + DL_RADIO_BLKS_3_TS + DL_RADIO_BLKS_4_TS)
MCS1_USE_UL =(UL_RADIO_BLKS_8PSK_1_TS_MCS_1 + UL_RADIO_BLKS_8PSK_2_TS_MCS_1 + UL_RADIO_BLKS_GMSK_1_TS_MCS_1 + UL_RADIO_BLKS_GMSK_2_TS_MCS_1)*100/ (UL_RADIO_BLKS_8PSK_1_TS + UL_RADIO_BLKS_8PSK_2_TS + UL_RADIO_BLKS_GMSK_1_TS + UL_RADIO_BLKS_GMSK_2_TS)
MCS2_USE_UL =
System Performance Group Vienna Page 106/137Motorola Confidential Proprietary

(UL_RADIO_BLKS_8PSK_1_TS_MCS_2 + UL_RADIO_BLKS_8PSK_2_TS_MCS_2 + UL_RADIO_BLKS_GMSK_1_TS_MCS_2 + UL_RADIO_BLKS_GMSK_2_TS_MCS_2)*100/ (UL_RADIO_BLKS_8PSK_1_TS + UL_RADIO_BLKS_8PSK_2_TS + UL_RADIO_BLKS_GMSK_1_TS + UL_RADIO_BLKS_GMSK_2_TS)
MCS3_USE_UL =(UL_RADIO_BLKS_8PSK_1_TS_MCS_3 + UL_RADIO_BLKS_8PSK_2_TS_MCS_3 + UL_RADIO_BLKS_GMSK_1_TS_MCS_3 + UL_RADIO_BLKS_GMSK_2_TS_MCS_3)*100/ (UL_RADIO_BLKS_8PSK_1_TS + UL_RADIO_BLKS_8PSK_2_TS + UL_RADIO_BLKS_GMSK_1_TS + UL_RADIO_BLKS_GMSK_2_TS)
MCS4_USE_UL =(UL_RADIO_BLKS_8PSK_1_TS_MCS_4 + UL_RADIO_BLKS_8PSK_2_TS_MCS_4 + UL_RADIO_BLKS_GMSK_1_TS_MCS_4 + UL_RADIO_BLKS_GMSK_2_TS_MCS_4)*100/ (UL_RADIO_BLKS_8PSK_1_TS + UL_RADIO_BLKS_8PSK_2_TS + UL_RADIO_BLKS_GMSK_1_TS + UL_RADIO_BLKS_GMSK_2_TS)
MCS5_USE_UL =(UL_RADIO_BLKS_8PSK_1_TS_MCS_5 + UL_RADIO_BLKS_8PSK_2_TS_MCS_5)*100/ (UL_RADIO_BLKS_8PSK_1_TS + UL_RADIO_BLKS_8PSK_2_TS + UL_RADIO_BLKS_GMSK_1_TS + UL_RADIO_BLKS_GMSK_2_TS)
MCS6_USE_UL =(UL_RADIO_BLKS_8PSK_1_TS_MCS_6 + UL_RADIO_BLKS_8PSK_2_TS_MCS_6)*100/ (UL_RADIO_BLKS_8PSK_1_TS + UL_RADIO_BLKS_8PSK_2_TS + UL_RADIO_BLKS_GMSK_1_TS + UL_RADIO_BLKS_GMSK_2_TS)
MCS7_USE_UL =(UL_RADIO_BLKS_8PSK_1_TS_MCS_7 + UL_RADIO_BLKS_8PSK_2_TS_MCS_7)*100/ (UL_RADIO_BLKS_8PSK_1_TS + UL_RADIO_BLKS_8PSK_2_TS + UL_RADIO_BLKS_GMSK_1_TS + UL_RADIO_BLKS_GMSK_2_TS)
MCS8_USE_UL =(UL_RADIO_BLKS_8PSK_1_TS_MCS_8 + UL_RADIO_BLKS_8PSK_2_TS_MCS_8)*100/ (UL_RADIO_BLKS_8PSK_1_TS + UL_RADIO_BLKS_8PSK_2_TS + UL_RADIO_BLKS_GMSK_1_TS + UL_RADIO_BLKS_GMSK_2_TS)
MCS9_USE_UL =(UL_RADIO_BLKS_8PSK_1_TS_MCS_9 + UL_RADIO_BLKS_8PSK_2_TS_MCS_9)*100/ (UL_RADIO_BLKS_8PSK_1_TS +
System Performance Group Vienna Page 107/137Motorola Confidential Proprietary

UL_RADIO_BLKS_8PSK_2_TS + UL_RADIO_BLKS_GMSK_1_TS + UL_RADIO_BLKS_GMSK_2_TS)
3.5.2.3 BANDWIDTH_INDICATORDescription:These key statistics provides the average block size as a function of the average used coding scheme.
Coding Scheme Block size in bytesCS-1 22CS-2 33CS-3 39CS-4 53
MCS-1 22MCS-2 28MCS-3 37MCS-4 44MCS-5 56MCS-6 74MCS-7 112MCS-8 136MCS-9 148
Figure 30 - RLC block sizes in relation to coding schemeRange:
1 unit represents an average block size.
Applicable release: 1740 onwards
Range:It is not easily possible to provide typical values.
Usage:These key statistics provide a single figure for average coding scheme usage.
Formulae:DL_BANDWIDTH_INDICATOR_GPRS =DL_RLC_ACK_NEW_BLKS_CS_1*22 + DL_RLC_ACK_NEW_BLKS_CS_2*33 + DL_RLC_ACK_NEW_BLKS_CS_3*39 + DL_RLC_ACK_NEW_BLKS_CS_4*53 + DL_RLC_UNACK_NEW_BLKS_CS_1*22 + DL_RLC_UNACK_NEW_BLKS_CS_2*33 + DL_RLC_UNACK_NEW_BLKS_CS_3*39 + DL_RLC_UNACK_NEW_BLKS_CS_4*53 + DL_RLC_RETX_BLKS_CS_1*22 + DL_RLC_RETX_BLKS_CS_2*33 + DL_RLC_RETX_BLKS_CS_3*39 + DL_RLC_RETX_BLKS_CS_4*53 + DL_RLC_NACK_BLKS_CS_1*22 + DL_RLC_NACK_BLKS_CS_2*33 + DL_RLC_NACK_BLKS_CS_3*39 + DL_RLC_NACK_BLKS_CS_4*53)/
System Performance Group Vienna Page 108/137Motorola Confidential Proprietary

(DL_RLC_ACK_NEW_BLKS_CS_1 + DL_RLC_ACK_NEW_BLKS_CS_2 + DL_RLC_ACK_NEW_BLKS_CS_3 + DL_RLC_ACK_NEW_BLKS_CS_4 + DL_RLC_UNACK_NEW_BLKS_CS_1 + DL_RLC_UNACK_NEW_BLKS_CS_2 + DL_RLC_UNACK_NEW_BLKS_CS_3 + DL_RLC_UNACK_NEW_BLKS_CS_4 + DL_RLC_RETX_BLKS_CS_1 + DL_RLC_RETX_BLKS_CS_2 + DL_RLC_RETX_BLKS_CS_3 + DL_RLC_RETX_BLKS_CS_4 + DL_RLC_NACK_BLKS_CS_1 + DL_RLC_NACK_BLKS_CS_2 + DL_RLC_NACK_BLKS_CS_3 + DL_RLC_NACK_BLKS_CS_4)
UL_BANDWIDTH_INDICATOR_GPRS =(UL_RLC_ACK_NEW_BLKS_CS_1*22 + UL_RLC_ACK_NEW_BLKS_CS_2*33 + UL_RLC_ACK_NEW_BLKS_CS_3*39 + UL_RLC_ACK_NEW_BLKS_CS_4*53 + UL_RLC_UNACK_NEW_BLKS_CS_1*22 + UL_RLC_UNACK_NEW_BLKS_CS_2*33 + UL_RLC_UNACK_NEW_BLKS_CS_3*39 + UL_RLC_UNACK_NEW_BLKS_CS_4*53 + UL_RLC_RETX_BLKS_CS_1*22 + UL_RLC_RETX_BLKS_CS_2*33 + UL_RLC_RETX_BLKS_CS_3*39 + UL_RLC_RETX_BLKS_CS_4*53)/ (UL_RLC_ACK_NEW_BLKS_CS_1 + UL_RLC_ACK_NEW_BLKS_CS_2 + UL_RLC_ACK_NEW_BLKS_CS_3 + UL_RLC_ACK_NEW_BLKS_CS_4 + UL_RLC_UNACK_NEW_BLKS_CS_1 + UL_RLC_UNACK_NEW_BLKS_CS_2 + UL_RLC_UNACK_NEW_BLKS_CS_3 + UL_RLC_UNACK_NEW_BLKS_CS_4 + UL_RLC_RETX_BLKS_CS_1 + UL_RLC_RETX_BLKS_CS_2 + UL_RLC_RETX_BLKS_CS_3 + UL_RLC_RETX_BLKS_CS_4)
DL_BANDWIDTH_INDICATOR_EGPRS =(DL_RLC_ACK_NEW_BLKS_MCS_1*22 + DL_RLC_ACK_NEW_BLKS_MCS_2*28 + DL_RLC_ACK_NEW_BLKS_MCS_3*37 + DL_RLC_ACK_NEW_BLKS_MCS_4*44 +DL_RLC_ACK_NEW_BLKS_MCS_5*56 + DL_RLC_ACK_NEW_BLKS_MCS_6*74 + DL_RLC_ACK_NEW_BLKS_MCS_7*112 + DL_RLC_ACK_NEW_BLKS_MCS_8*136 +DL_RLC_ACK_NEW_BLKS_MCS_9*148 +DL_RLC_UNACK_NEW_BLKS_MCS_1*22 + DL_RLC_UNACK_NEW_BLKS_MCS_2*28 + DL_RLC_UNACK_NEW_BLKS_MCS_3*37 + DL_RLC_UNACK_NEW_BLKS_MCS_4*44 +DL_RLC_UNACK_NEW_BLKS_MCS_5*56 + DL_RLC_UNACK_NEW_BLKS_MCS_6*74 + DL_RLC_UNACK_NEW_BLKS_MCS_7*112 + DL_RLC_UNACK_NEW_BLKS_MCS_8*136 +DL_RLC_UNACK_NEW_BLKS_MCS_9*148 +DL_RLC_RETX_BLKS_MCS_1*22 + DL_RLC_RETX_BLKS_MCS_2*28 + DL_RLC_RETX_BLKS_MCS_3*37 + DL_RLC_RETX_BLKS_MCS_4*44 +DL_RLC_RETX_BLKS_MCS_5*56 + DL_RLC_RETX_BLKS_MCS_6*74 + DL_RLC_RETX_BLKS_MCS_7*112 + DL_RLC_RETX_BLKS_MCS_8*136 +DL_RLC_RETX_BLKS_MCS_9*148 +DL_RLC_NACK_BLKS_MCS_1*22 + DL_RLC_NACK_BLKS_MCS_2*28 + DL_RLC_NACK_BLKS_MCS_3*37 + DL_RLC_NACK_BLKS_MCS_4*44 +DL_RLC_NACK_BLKS_MCS_5*56 + DL_RLC_NACK_BLKS_MCS_6*74 + DL_RLC_NACK_BLKS_MCS_7*112 + DL_RLC_NACK_BLKS_MCS_8*136 +DL_RLC_NACK_BLKS_MCS_9*148)/(DL_RLC_ACK_NEW_BLKS_MCS_1 + DL_RLC_ACK_NEW_BLKS_MCS_2 + DL_RLC_ACK_NEW_BLKS_MCS_3 + DL_RLC_ACK_NEW_BLKS_MCS_4 +DL_RLC_ACK_NEW_BLKS_MCS_5 + DL_RLC_ACK_NEW_BLKS_MCS_6 + DL_RLC_ACK_NEW_BLKS_MCS_7 + DL_RLC_ACK_NEW_BLKS_MCS_8 +
System Performance Group Vienna Page 109/137Motorola Confidential Proprietary

DL_RLC_ACK_NEW_BLKS_MCS_9 +DL_RLC_UNACK_NEW_BLKS_MCS_1 + DL_RLC_UNACK_NEW_BLKS_MCS_2 + DL_RLC_UNACK_NEW_BLKS_MCS_3 + DL_RLC_UNACK_NEW_BLKS_MCS_4 +DL_RLC_UNACK_NEW_BLKS_MCS_5 + DL_RLC_UNACK_NEW_BLKS_MCS_6 + DL_RLC_UNACK_NEW_BLKS_MCS_7 + DL_RLC_UNACK_NEW_BLKS_MCS_8 +DL_RLC_UNACK_NEW_BLKS_MCS_9 +DL_RLC_RETX_BLKS_MCS_1 + DL_RLC_RETX_BLKS_MCS_2 + DL_RLC_RETX_BLKS_MCS_3 + DL_RLC_RETX_BLKS_MCS_4 +DL_RLC_RETX_BLKS_MCS_5 + DL_RLC_RETX_BLKS_MCS_6 + DL_RLC_RETX_BLKS_MCS_7 + DL_RLC_RETX_BLKS_MCS_8 +DL_RLC_RETX_BLKS_MCS_9 +DL_RLC_NACK_BLKS_MCS_1 + DL_RLC_NACK_BLKS_MCS_2 + DL_RLC_NACK_BLKS_MCS_3 + DL_RLC_NACK_BLKS_MCS_4 +DL_RLC_NACK_BLKS_MCS_5 + DL_RLC_NACK_BLKS_MCS_6 + DL_RLC_NACK_BLKS_MCS_7 + DL_RLC_NACK_BLKS_MCS_8 +DL_RLC_NACK_BLKS_MCS_9)
UL_BANDWIDTH_INDICATOR_EGPRS =(UL_RLC_ACK_NEW_BLKS_MCS_1*22 + UL_RLC_ACK_NEW_BLKS_MCS_2*28 + UL_RLC_ACK_NEW_BLKS_MCS_3*37 + UL_RLC_ACK_NEW_BLKS_MCS_4*44 +UL_RLC_ACK_NEW_BLKS_MCS_5*56 + UL_RLC_ACK_NEW_BLKS_MCS_6*74 + UL_RLC_ACK_NEW_BLKS_MCS_7*112 + UL_RLC_ACK_NEW_BLKS_MCS_8*136 +UL_RLC_ACK_NEW_BLKS_MCS_9*148 +UL_RLC_UNACK_NEW_BLKS_MCS_1*22 + UL_RLC_UNACK_NEW_BLKS_MCS_2*28 + UL_RLC_UNACK_NEW_BLKS_MCS_3*37 + UL_RLC_UNACK_NEW_BLKS_MCS_4*44 +UL_RLC_UNACK_NEW_BLKS_MCS_5*56 + UL_RLC_UNACK_NEW_BLKS_MCS_6*74 + UL_RLC_UNACK_NEW_BLKS_MCS_7*112 + UL_RLC_UNACK_NEW_BLKS_MCS_8*136 +UL_RLC_UNACK_NEW_BLKS_MCS_9*148 +UL_RLC_RETX_BLKS_MCS_1*22 + UL_RLC_RETX_BLKS_MCS_2*28 + UL_RLC_RETX_BLKS_MCS_3*37 + UL_RLC_RETX_BLKS_MCS_4*44 +UL_RLC_RETX_BLKS_MCS_5*56 + UL_RLC_RETX_BLKS_MCS_6*74 + UL_RLC_RETX_BLKS_MCS_7*112 + UL_RLC_RETX_BLKS_MCS_8*136 +UL_RLC_RETX_BLKS_MCS_9*148)/(UL_RLC_ACK_NEW_BLKS_MCS_1+ UL_RLC_ACK_NEW_BLKS_MCS_2 + UL_RLC_ACK_NEW_BLKS_MCS_3 + UL_RLC_ACK_NEW_BLKS_MCS_4 +UL_RLC_ACK_NEW_BLKS_MCS_5 + UL_RLC_ACK_NEW_BLKS_MCS_6 + UL_RLC_ACK_NEW_BLKS_MCS_7 + UL_RLC_ACK_NEW_BLKS_MCS_8 +UL_RLC_ACK_NEW_BLKS_MCS_9 +UL_RLC_UNACK_NEW_BLKS_MCS_1 + UL_RLC_UNACK_NEW_BLKS_MCS_2 + UL_RLC_UNACK_NEW_BLKS_MCS_3 + UL_RLC_UNACK_NEW_BLKS_MCS_4 +UL_RLC_UNACK_NEW_BLKS_MCS_5 + UL_RLC_UNACK_NEW_BLKS_MCS_6 + UL_RLC_UNACK_NEW_BLKS_MCS_7 + UL_RLC_UNACK_NEW_BLKS_MCS_8 +UL_RLC_UNACK_NEW_BLKS_MCS_9 +UL_RLC_RETX_BLKS_MCS_1 + UL_RLC_RETX_BLKS_MCS_2 + UL_RLC_RETX_BLKS_MCS_3 + UL_RLC_RETX_BLKS_MCS_4 +UL_RLC_RETX_BLKS_MCS_5 + UL_RLC_RETX_BLKS_MCS_6 + UL_RLC_RETX_BLKS_MCS_7 + UL_RLC_RETX_BLKS_MCS_8 +UL_RLC_RETX_BLKS_MCS_9)
System Performance Group Vienna Page 110/137Motorola Confidential Proprietary

System Performance Group Vienna Page 111/137Motorola Confidential Proprietary

3.6 MobilityThe event of standard mobile-controlled cell reselection always leads to packet loss and delay (during the reselection gap no data can be transmitted or received). In GSR7 the only statistics related to cell reselections are the NCCR stats (see 3.6.1), which peg only for NC2 capable mobiles (R99). In GSR8 there are statistics, which provide information about number of discarded frames: PDU_DISCARD_FR and PDU_DISCARD_LLC (see 3.3.4.1 and 3.3.4.2). PDU_DISCARD_LLC has bins for discarded frames due to cell reselections.
During normal cell reselection, without SCR (seamless cell reselection) or NACC (network assisted cell change) feature enabled, the loss of LLC frames and therefore the loss of RLC packets is unavoidable.
In case of performance problems due to excessive cell reselections drive testing is required to analyse the situation in more detail.
3.6.1 NCCRWhen the GSR7 NCCR (network controlled cell reselection) feature or the GSR8 NACC (network assisted cell change) feature is enabled the network control order mode NC2 is supported, where mobiles are required to send measurement reports and the network controls the reselections. Only Release99-compliant MS can use this feature. There are two NCCR related statistics, which peg only for R99-compliant mobiles, which actually use NCCR or NACC.
The available NCCR statistics, which peg only for NC2 capable (R99, R4) mobiles are: GPRS_CELL_RESELECT_ATTMPT GPRS_CELL_RESELECT_FAIL
3.6.1.1 NCC_CELL_RESELECTION_SUCCESS_RATEDescription:This key statistic can be used to identify problems associated with the Network Controlled cell reselection feature. It is important to note that the GPRS_CELL_RESELECT_ATTMPT raw statistic only counts reselection attempts in packet idle mode while a GPRS mobile is in READY state i.e. when there is no active TBF whilst the mobile is in READY state.
1 unit represents a percentage.
Applicable release: 1740 onwards
Range:
Usage:
System Performance Group Vienna Page 112/137Motorola Confidential Proprietary

This key statistic can be used to identify problems relating to network controlled cell re-selection. In general, a low can indicate problems with synchronising with the target cell specified in a cell re-selection command (See clause 10.1.4.2 in TS 05.08 V8.16.0).
Note: This key statistic measures only the success of cell reselection mode NC2 (network controlled cell reselection). No other mobile controlled cell reselection is considered.
Formula:NCC_CELL_RESELECTION_SUCCESS_RATE =GPRS_CELL_RESELECT_FAIL*100/GPRS_CELL_RESELECT_ATTMPT
3.6.2 SCRWhen the GSR7 feature SCR (Seamless Cell Reselection) is enabled there are hardly any lost packets. This can only be measured in GSR8 by the statistic PDU_DISCARD_LLC (see 3.3.4.2).
3.6.3 NACCWhen the GSR8 NACC (Network Assisted Cell Change) feature is enabled, there are a few new statistics to analyse cell reselections but only for mobiles which support NACC (Release 4). For non-R4-compliant mobiles, there is just PDU_DISCARD_LLC (see 3.3.4.2).
The available NACC statistics, which peg only for R4-compliant mobiles are: NUM_CELL_RESEL_CELL NUM_CELL_RESEL_CELL_PCCN NUM_CELL_RESEL_CELL_SUCC
This section will be more fleshed out when NACC lab results are available.
3.7 Performance of Higher LayersThere is no way to detect performance problems on higher layers than RLC/MAC by means of BSS statistics. Typical problems are related to TCP performance and are out of scope of this document.
Typical problems: Retransmissions on TCP layer due to
o Packet Losso Packets out of order (Jitter)o Retransmission timer expired (packet virtually lost)
System Performance Group Vienna Page 113/137Motorola Confidential Proprietary

4 Feature Related Statistics
4.1 Quality of Service statistics (R4)The following new statistics are available to check the QoS operation (QoS feature available in GSR8).
TIMER_EXP_PAP_CONV
A new statistic TIMER_EXP_PAP_CONV shall be added
Reference to Standards
None
Object Type Medium Counter ArrayTag Type CellAlarm Severity NoneDefault Threshold N/A Method of Collection
This statistic is pegged every time T5, T6, T8, PFT expires or there is PAP to Best Effort Conversion.The bins are:0. T5 Expiries1. T6 Expiries2. T8 Expiries3. PFT Expiry with Downlink TBF active4. PAP created on T3168 expiry5. PAP -> BE Conversion on final T6 Expiry
Description TIMER_EXP_PAP_CONV counts the number of times the T5 (RA_Capability_Update guard Timer), T6 (CREATE_BSS_PFC guard timer) or T8 (MODIFY_BSS_PFC guard timer) expires, PFT expiries or a PAP flow is converted to Best Effort due to final T6 expiry. Also it keeps track of the PAPs created due to the MS sending another channel request because of T3168 expiry. When QoS is disabled only bin 0 (T5 expiries) is pegged.
Default Mode DisabledFigure 31 – TIMER_EXP_PAP_CONV Statistic Specification
PFC_ADMISSION
A new statistic PFC_ADMISSION shall be added.
Reference to Standards
None
Object Type Extra Large Counter Array Tag Type CellAlarm Severity NoneDefault Threshold N/A
System Performance Group Vienna Page 114/137Motorola Confidential Proprietary

Method of Collection
This statistic is pegged every time an admission of a PFC is successful. One of the following bins will be pegged based on the traffic class / traffic handling priority and ARP value of the PFC.The bins are:0. Admission successful – THP1, ARP11. Admission successful – THP1, ARP22. Admission successful – THP1, ARP33. Admission successful – THP2, ARP14. Admission successful – THP2, ARP25. Admission successful – THP2, ARP36. Admission successful – THP3, ARP17. Admission successful – THP3, ARP28. Admission successful – THP3, ARP39. Admission successful – Background, ARP110. Admission successful – Background, ARP211. Admission successful – Background, ARP312. Admission successful – Best Effort , ARP113. Admission successful – Best Effort, ARP214. Admission successful – Best Effort, ARP3
Description PFC_ADMISSION is pegged upon successful admission of a PFC. The PFC may have to be self downgraded for admission. Based on the traffic class / traffic handling priority and the ARP value of the PFC after admission one of the above mentioned bins will be pegged. No bins are pegged when QoS is disabled. When ARP is disabled, all admissions will be pegged against ARP3.
Default Mode DisabledFigure 32 - PFC_ADMISSION Statistics Specification
PFC_ADMISSION_OTHER
A new statistic PFC_ADMISSION_OTHER shall be added
Reference to Standards
None
Object Type Small Counter ArrayTag Type CellAlarm Severity NoneDefault Threshold N/A Method of Collection
This statistic is pegged upon successful admission of an SMS, Signaling or PFC_unaware PFC. Based on the PFC type, one of the following bins will be pegged.The bins are:0. Admission successful – SMS1. Admission successful – Signaling2. Admission successful – PFC_unaware
Description PFC_ADMISSION_OTHER is pegged for every successful admission of a SMS, Signaling, or PFC_unaware PFC. No bins are pegged when QoS is disabled. If PFC_unaware mobile arrives in downlink first and its downlink data is tagged with PFI of 0, BSS cannot peg its admission under this statistics as PFC_unaware. PFC_ADMISSION will be pegged instead on successful admission of the PFC as Best Effort.
System Performance Group Vienna Page 115/137Motorola Confidential Proprietary

Default Mode DisabledFigure 33 - PFC_ADMISSION_OTHER Statistics Specification
PFC_REJECTION
A new statistic PFC_REJECTION shall be added.
Reference to Standards
None
Object Type Extra Large Counter ArrayTag Type CellAlarm Severity NoneDefault Threshold N/A Method of Collection
This statistic is pegged upon unsuccessful admission of a negotiable or Best Effort PFC is unsuccessful. One of the following bins will be pegged based on the the traffic class / traffic handling priority and the ARP value of PFC.The bins are:0. Admission unsuccessful – THP1, ARP11. Admission unsuccessful – THP1, ARP22. Admission unsuccessful – THP1, ARP33. Admission unsuccessful – THP2, ARP14. Admission unsuccessful – THP2, ARP25. Admission unsuccessful – THP2, ARP36. Admission unsuccessful – THP3, ARP17. Admission unsuccessful – THP3, ARP28. Admission unsuccessful – THP3, ARP39. Admission unsuccessful – Background, ARP110. Admission unsuccessful – Background, ARP211. Admission unsuccessful – Background, ARP312. Admission unsuccessful – Best Effort, ARP113. Admission unsuccessful – Best Effort, ARP214. Admission unsuccessful – Best Effort, ARP3
Description PFC_REJECTION is pegged for unsuccessful admissions of PFCs. One of the above mentioned bins will be pegged based on the the traffic class / traffic handling priority and the ARP value of PFC. No bins are pegged when QoS is disabled. When ARP is disabled, all unsuccessful admissions will be pegged against ARP3.
Default Mode DisabledFigure 34 – PFC_REJECTION Statistics Specification
PFC_REJECTION_OTHER
A new statistic PFC_REJECTION_OTHER shall be added.
Reference to Standards
None
Object Type Small Counter Array
System Performance Group Vienna Page 116/137Motorola Confidential Proprietary

Tag Type CellAlarm Severity NoneDefault Threshold N/A Method of Collection
This statistic is pegged every time an admission of an SMS, Signaling or PFC_unaware PFC is unsuccessful. Based on the PFC type, one of the following bins will be pegged.The bins are:0. Admission unsuccessful – SMS1. Admission unsuccessful – Signaling2. Admission unsuccessful – PFC_unaware
Description PFC_REJECTION_OTHER is pegged for every unsuccessful admission of a SMS, Signaling, or PFC_unaware PFC. No bins are pegged when QoS is disabled. If PFC_unaware mobile arrives in downlink first and its downlink data is tagged with PFI of 0, BSS cannot peg its rejection under this statistics as PFC_unaware. PFC_REJECTION will be pegged instead on rejection of the PFC as Best Effort.
Default Mode DisabledFigure 35 – PFC_REJECTION _OTHER Statistics .Specification
PFC_REJECT_CAUSES
A new statistic PFC_REJECT_CAUSES shall be added.
Reference to Standards
None
Object Type Large Counter ArrayTag Type CellAlarm Severity NoneDefault Threshold N/A Method of Collection
This statistic is pegged whenever PCU rejects a PFC request due to a lack of resources.The bins are:0. Maximum PFCs per MS exceeded.1. Out of TBF resources for THP1.2. Out of TBF resources for THP23. Out of TBF resources for THP34. Out of TBF resources for Background5. Out of TBF resources for Best Effort6. Out of TBF Resources for SMS7. Out of TBF Resources for Signaling8. Out of TBF Resources for PAP9. Out of TBF Resources for PFC-unaware10. Out of PFC storage.11. MS Capability.
Description PFC_REJECT_CAUSES counts the number of PFC requests rejected by the PCU due to a lack of resources. Below are definitions of each bin, and what action the operator can take to reduce the number of PFC rejections in the future.
Maximum PFCs per MS exceeded – Other than the pre-defined PFCs, the BSS
System Performance Group Vienna Page 117/137Motorola Confidential Proprietary

supports up to 4 negotiable PFCs simultaneously for each mobile. Any subsequent negotiable PFC requests from that mobile will be rejected under this limitation. Reducing the number of simultaneous negotiable PFCs a mobile is trying to activate will help reduce this bin count.
Out of TBF resources – The PCU does not have all TBF resources required to service the TBF for the requested THP/traffic class; this includes timeslot availability, USFs, TAIs, and TFIs.
Out of PFC storage – The PCU has exhausted storage for PFCs. Reducing the duration of Packet Flow Timer at the SGSN will reduce this problem.
MS Capability – The PCU cannot meet the MTBR for the requested PFC. Decreasing the MTBRs, or increasing mobile’s capability will reduce this problem.
No bins are pegged when QoS is disabled.
Default Mode DisabledFigure 36 – PFC_REJECT_CAUSES Statistics Specification
DL_LLC_DATA_VOLUME
A new statistic DL_LLC_DATA_VOLUME shall be added.
Reference to Standards
None
Object Type Extra large counter arrayTag Type CellAlarm Severity NoneDefault Threshold N/A Method of Collection
This statistic is obtained by measuring the volume of downlink LLC data sent on the air interface per traffic class.The bins are:0. Volume of data on the downlink for THP1 and ARP11. Volume of data on the downlink for THP1 and ARP22. Volume of data on the downlink for THP1 and ARP33. Volume of data on the downlink for THP2 and ARP14. Volume of data on the downlink for THP2 and ARP25. Volume of data on the downlink for THP2 and ARP36. Volume of data on the downlink for THP3 and ARP17. Volume of data on the downlink for THP3 and ARP28. Volume of data on the downlink for THP3 and ARP3 9. Volume of data on the downlink for background and ARP110. Volume of data on the downlink for background and ARP211. Volume of data on the downlink for background and ARP312. Volume of data on the downlink for Best Effort and ARP113. Volume of data on the downlink for Best Effort and ARP214. Volume of data on the downlink for Best Effort and ARP3
Description DL_LLC_DATA_VOLUME counts the volume of downlink LLC data sent on the
System Performance Group Vienna Page 118/137Motorola Confidential Proprietary

air interface per traffic class. One of the above mentioned bins would be pegged based on the class type and ARP Value. When ARP is disabled, all volume of LLC is pegged against ARP3. When QoS is disabled all volume of LLC is pegged against Best Effort, ARP3. PFC_unaware PFC data is pegged against the Best Effort Bins. Recommended statistical measurement interval is 30 minutes. Downlink PAP, SMS and Signaling LLC data will not pegged.
Unit: 1 = 10 kilobytesDefault Mode Disabled
Figure 37 – DL_LLC_DATA_VOLUME Statistics Specification
UL_LLC_DATA_VOLUME
A new statistic UL_LLC_DATA_VOLUME shall be added.
Reference to Standards
None
Object Type Extra large counter arrayTag Type CellAlarm Severity NoneDefault Threshold N/A Method of Collection
This statistic is obtained by measuring the volume of uplink LLC data sent by the MS on the air interface per traffic class. The bins are:0. Volume of data on the uplink for THP1 and ARP11. Volume of data on the uplink for THP1 and ARP22. Volume of data on the uplink for THP1 and ARP33. Volume of data on the uplink for THP2 and ARP14. Volume of data on the uplink for THP2 and ARP25. Volume of data on the uplink for THP2 and ARP36. Volume of data on the uplink for THP3 and ARP17. Volume of data on the uplink for THP3 and ARP28. Volume of data on the uplink for THP3 and ARP3 9. Volume of data on the uplink for background and ARP110. Volume of data on the uplink for background and ARP211. Volume of data on the uplink for background and ARP312. Volume of data on the uplink for Best Effort and ARP113. Volume of data on the uplink for Best Effort and ARP214. Volume of data on the uplink for Best Effort and ARP3
Description UL_LLC_DATA_VOLUME counts the volume of uplink LLC data sent by the MS on the air interface per traffic class. One of the above mentioned bins would be pegged based on the class type and ARP Value. When ARP is disabled, all volume of LLC is pegged against ARP3. When QoS is disabled all volume of LLC is pegged against Best Effort, ARP3. PFC_unaware PFC data is pegged against the Best Effort Bins. Uplink PAP, SMS and Signaling LLC data will not pegged. Recommended statistical measurement interval is 30 minutes.
Unit: 1 = 10 KilobytesDefault Mode Disabled
Figure 38 – UL_LLC_DATA_VOLUME Statistics Specification
System Performance Group Vienna Page 119/137Motorola Confidential Proprietary

PFC_UPGRADE
A new statistic PFC_UPGRADE shall be added
Reference to Standards
None
Object Type Large Counter ArrayTag Type CellAlarm Severity NoneDefault Threshold N/A Method of Collection
This statistic is pegged every time PFC is upgraded. One of the following bins will be pegged based on the traffic handling priority in ABQP and ARP value.The bins are:0. Upgrade from THP2 to THP1, ARP11. Upgrade from THP2 to THP1, ARP22. Upgrade from THP2 to THP1, ARP33. Upgrade from THP3 to THP1, ARP14. Upgrade from THP3 to THP1, ARP25. Upgrade from THP3 to THP1, ARP36. Upgrade from THP3 to THP2, ARP17. Upgrade from THP3 to THP2, ARP28. Upgrade from THP3 to THP2, ARP3
Description PFC_UPGRADE counts the number of upgraded PFCs in a given statistical measurement interval. It will be pegged in one of the above mentioned bins based on the traffic handling priority in the ABQP and ARP Value of the PFC. No bins are pegged when QoS is disabled. When ARP is disabled, all upgrades will be pegged against ARP3.
Default Mode DisabledFigure 39 - PFC_UPGRADE Statistics Specification
PFC_DOWNGRADE_SUCCESS
A new statistic PFC_DOWNGRADE_SUCCESS shall be added
Reference to Standards
None
Object Type Large Counter ArrayTag Type CellAlarm Severity NoneDefault Threshold N/A Method of Collection
This statistic is pegged every time a PFC is successfully downgraded. One of the following bins will be pegged based on the traffic handling priority in ABQP and ARP Value (1-3) of the PFC.The bins are:0. Downgrade success from THP1 to THP2, ARP1
System Performance Group Vienna Page 120/137Motorola Confidential Proprietary

1. Downgrade success from THP1 to THP3, ARP12. Downgrade success from THP2 to THP3, ARP 13. Downgrade success from THP1 to THP2, ARP24. Downgrade success from THP1 to THP3, ARP25. Downgrade success from THP2 to THP3, ARP26. Downgrade success from THP1 to THP2, ARP37. Downgrade success from THP1 to THP3, ARP38. Downgrade success from THP2 to THP3, ARP3
Description PFC_DOWNGRADE_SUCCESS counts the number of successfully downgraded PFCs in a given statistical measurement interval. It will be pegged in one of the above mentioned bins based on the traffic handling priority in the ABQP and the ARP Value of the PFC . No bins are pegged when QoS is disabled. When ARP is disabled, all downgrade successes will be pegged against ARP3.
Default Mode DisabledFigure 40 - PFC_DOWNGRADE_SUCCESS Statistic Specification
PFC_DOWNGRADE_FAILURE
A new statistic PFC_DOWNGRADE_FAILURE shall be added Reference to Standards
None
Object Type Large Counter ArrayTag Type CellAlarm Severity NoneDefault Threshold N/A Method of Collection
This statistic is pegged every time a PFC downgrade fails. One of the following bins will be pegged based on the traffic handling priority in ABQP and ARP Value (1-3) of the PFC.The bins are:0. Downgrade failure from THP1 to THP2, ARP11. Downgrade failure from THP1 to THP3, ARP12. Downgrade failure from THP2 to THP3, ARP13. Downgrade failure from THP1 to THP2, ARP24. Downgrade failure from THP1 to THP3, ARP25. Downgrade failure from THP2 to THP3, ARP26. Downgrade failure from THP1 to THP2, ARP37. Downgrade failure from THP1 to THP3, ARP38. Downgrade failure from THP2 to THP3, ARP3
Description PFC_DOWNGRADE_FAILURE counts the number of downgrade failures of PFCs in a given statistical measurement interval. It will be pegged in one of the above mentioned bins based on the traffic handling priority in the ABQP and the ARP Value of the PFC No bins are pegged when QoS is disabled. When ARP is disabled, all downgrade failures will be pegged against ARP3.
Default Mode DisabledFigure 41 - PFC_DOWNGRADE_FAILURE Statistic Specification
System Performance Group Vienna Page 121/137Motorola Confidential Proprietary

PFC_PREEMPTIONS
A new statistic PFC_PREEMPTIONS shall be added.
Reference to Standards
None
Object Type Extra Large counter array Tag Type CellAlarm Severity NoneDefault Threshold N/A Method of Collection
This statistic is pegged every time PFCs are preempted due to admission control or retention procedures. One of the following bins will be pegged based on the traffic class.The bins are:0. Preemption of THP1, ARP11. Preemption of THP1, ARP22. Preemption of THP1, ARP33. Preemption of THP2, ARP14. Preemption of THP2, ARP25. Preemption of THP2, ARP36. Preemption of THP3, ARP17. Preemption of THP3, ARP28. Preemption of THP3, ARP39. Preemption of Background, ARP110. Preemption of Background, ARP211. Preemption of Background, ARP312. Preemption of Best Effort, ARP113. Preemption of Best Effort, ARP214. Preemption of Best Effort, ARP3
Description PFC_PREEMPTIONS counts the number of PFCs preempted in each Traffic Class, for each ARP Value. Preemption of PFC_unaware PFCs is pegged against the bins for Best Effort PFCs. No bins are pegged when QoS is disabled. When ARP is disabled, all preemptions are pegged against ARP3. Since BSS will not preempt PFCs with ARP rank 6, bin 0, 3, 6, 12 are not pegged.
Default Mode DisabledFigure 42 - PFC_PREMEPTIONS Statistics Specification
PFC_REJ_DGRD_PRMPT_PRP
A new statistic PFC_REJ_DGRD_PRMPT_PRP shall be added.
Reference to Standards
None
Object Type Large Counter ArrayTag Type DPROCAlarm Severity NoneDefault Threshold N/A Method of Collection
This statistic is pegged whenever PCU preempts, rejects, or downgrades a PFC request due to a lack of cell or board resources or whenever a PFC is downgraded or preempted for cell or board retention purposes on a per board basis
System Performance Group Vienna Page 122/137Motorola Confidential Proprietary

The bins are:0. Rejection due to lack of cell resources1. Rejection due to lack of PRP resources2. Downgrade due to lack of cell resources3. Downgrade due to lack of PRP resources4. Preemption due to lack of cell resources5. Preemption due to lack of PRP resources6. Downgrade due to cell retention7. Downgrade due to PRP retention8. Preemption due to cell retention9. Preemption due to PRP retention
Description PFC_REJ_DGRD_PRMPT_PRP counts the number of PFC requests rejected, downgraded, or preempted by the PCU due to a lack of PRP or cell resources. It also keeps track of the number of PFC downgrades and preemptions due to cell or PRP retentions. Below are definitions of each bin, and what action the operator can take to reduce the number of PFC rejections in the future.
Rejection due to lack of cell resources – The PCU does not have enough MTBR in the cell to admit a PFC or BSS cannot admit the PFC due to mobile’s capability. Increasing the number of GPRS timeslots in the cell will reduce this bin count.
Rejection due to lack of PRP resources – The PCU does not have enough MTBR in the board to admit a PFC. One way to reduce this bin count is to adjust the MTBR commitments for different traffic classes.
Downgrade due to lack of cell resources – The PCU does not have enough MTBR in the cell to maintain a PFC’s current commitment and has reduced the PFC’s MTBR due to the admission of a higher priority PFC. One way to reduce this bin count is to adjust the MTBR commitments for different traffic classes.
Downgrade due to lack of PRP resources – The PCU does not have enough MTBR in the PRP to maintain a PFC’s current commitment and has reduced the PFC’s MTBR due to the admission of a higher priority PFC. One way to reduce this bin count is to adjust the MTBR commitments for different traffic classes.
Preemption due to lack of cell resources – The PCU does not have enough MTBR in the cell to maintain a PFC’s commitments due to a change in available resources or admission of a higher priority PFC and has preempted the PFC. One way to reduce this bin count is to adjust the MTBR commitments for different traffic classes
Preemption due to lack of PRP resources – The PCU does not have enough MTBR on the PRP to maintain a PFC’s commitments due to admission of a higher priority PFC and has preempted the PFC. One way to reduce this bin count is to adjust the MTBR commitments for different traffic classes
Downgrade due to cell retention – The PCU does not have enough MTBR in the cell to retain all the active PFCs’ commitments in the event of resource shrinkage and has reduced the PFC’s MTBR for cell retention purposes. Increasing the resources in the cell would help reduce this bin count.
Downgrade due to PRP retention –(Not pegged)
System Performance Group Vienna Page 123/137Motorola Confidential Proprietary

Preemption due to cell retention – The PCU does not have enough MTBR in the cell to maintain a PFC’s commitments in the event of resource shrinkage and has preempted the PFC for cell retention purposes. Increasing the resources in the cell would help reduce this bin count.
Preemption due to PRP retention –(Not pegged) Default Mode Disabled
Figure 43- PFC_REJ_DGRD_PRMPT_PRP Statistics Specification
PFC_REJ_DGRD_PRMPT_CELL
A new statistic PFC_REJ_DGRD_PRMPT_CELL shall be added.
Reference to Standards
None
Object Type Large Counter ArrayTag Type CELLAlarm Severity NoneDefault Threshold N/A Method of Collection
This statistic is pegged whenever PCU preempts, rejects, or downgrades a PFC request due to a lack of cell or board resources or whenever a PFC is downgraded or preempted for cell or board retention purposes on a per cell basis.The bins are:0. Rejection due to lack of cell resources1. Rejection due to lack of PRP resources2. Downgrade due to lack of cell resources3. Downgrade due to lack of PRP resources4. Preemption due to lack of cell resources5. Preemption due to lack of PRP resources6. Downgrade due to cell retention7. Downgrade due to PRP retention8. Preemption due to cell retention9. Preemption due to PRP retention
Description PFC_REJ_DGRD_PRMPT_CELL counts the number of PFC requests rejected, downgraded, or preempted by the PCU due to a lack of PRP or cell resources. It also keeps track of the number of PFC downgrades and preemptions due to cell or PRP retentions. Below are definitions of each bin, and what action the operator can take to reduce the number of PFC rejections in the future.
Rejection due to lack of cell resources – The PCU does not have enough MTBR in the cell to admit a PFC. Increasing the number of GPRS timeslots in the cell will reduce this bin count.
Rejection due to lack of PRP resources – The PCU does not have enough MTBR in the board to admit a PFC. .One way to reduce this bin count is to adjust the MTBR commitments for different traffic classes.
Downgrade due to lack of cell resources – The PCU does not have enough MTBR in the cell to maintain a PFC’s current commitment and has reduced the PFC’s MTBR due to the admission of a higher priority PFC. One way to reduce this bin
System Performance Group Vienna Page 124/137Motorola Confidential Proprietary

count is to adjust the MTBR commitments for different traffic classes
Downgrade due to lack of PRP resources – The PCU does not have enough MTBR on the PRP to maintain a PFC’s current commitment and has reduced the PFC’s MTBR due to the admission of a higher priority PFC. One way to reduce this bin count is to adjust the MTBR commitments for different traffic classes.
Preemption due to lack of cell resources – The PCU does not have enough MTBR in the cell to maintain a PFC’s commitments due to a change in available resources or admission of a higher priority PFC and has preempted the PFC. One way to reduce this bin count is to adjust the MTBR commitments for different traffic classes
Preemption due to lack of PRP resources – The PCU does not have enough MTBR on the PRP to maintain a PFC’s commitments due to admission of a higher priority PFC and has preempted the PFC. One way to reduce this bin count is to adjust the MTBR commitments for different traffic classes
Downgrade due to cell retention – The PCU does not have enough MTBR in the cell to retain all the active PFCs’ commitments in the event of resource shrinkage and has reduced the PFC’s MTBR for cell retention purposes. Increasing the resources in the cell would help reduce this bin count.
Downgrade due to PRP retention – Not peggedPreemption due to cell retention – The PCU does not have enough MTBR in the cell to maintain a PFC’s commitments in the event of resource shrinkage and has preempted the PFC for cell retention purposes. Increasing the resources in the cell would help reduce this bin count.
Preemption due to PRP retention – Not pegged.Default Mode Disabled
Figure 44 - PFC_REJ_DGRD_PRMPT_CELL Statistics Specification
PDU_DISCARD_LLC
The PDU_DISCARD_LLC stat shall be modified to add another bin “Discard data due to PFC rejection/deletion”.
4.2 VersaTRAU statistics
Since VersaTrau introduces the concept of statistical multiplexing of the air timeslot data onto a shared backhaul, it is important to provide feedback to the operator that reflects the current usage of the VersaTrau backhaul.
Average Width of the VersaChannel – EGPRS_64K_CHANNEL_WIDTH
System Performance Group Vienna Page 125/137Motorola Confidential Proprietary

Uplink backhaul requested (UL Demand) - UL_EGPRS_BACKHAUL_DEMAND
Downlink backhaul requested (DL demand) - DL_EGPRS_BACKHAUL_DEMAND
Actual uplink backhaul used - UL_EGPRS_BACKHAUL_USED
Actual downlink backhaul used - DL_EGPRS_BACKHAUL_USED
The format of the new statistics is gauge (mean and max). The unit is in bytes; it includes the RLC blocks as well as the VT header and the sample rate is RLC-block period.
UL_EGPRS_BACKHAUL_USEDThe system will support a per-carrier gauge statistic to measure the actual backhaul used to carry uplink data traffic for an EGPRS carrier.Type: GaugePegged:PerCarrierNew/Modified: New Statistic Name UL_EGPRS_BACKHAUL_USED Reference to Standards
None
Purpose This statistic measures the mean and max value for the actual amount of uplink backhaul used for an EGPRS RTF. This is the actual backhaul that the system used to service all the active data transfers on an EGPRS carrier, after accounting for any coding scheme downgrades and radio block omissions in the uplink.
Object Type Gauge Tag Type Carrier Alarm Severity No alarm is generated in relation to this measurement. Default Threshold N/A Statistic Maintainer
BSS
Method of Collection
The statistic pegs every block period based on the amount of the backhaul used (accounting for any substitutions or omissions due to backhaul restrictions) in uplink by PDCHs on an EGPRS carrier
Description This UL_EGPRS_BACKHAUL_USED statistic is obtained by maintaining the mean and max values for the backhaul usage for the uplink backhaul associated with an EGRS over the statistical period.
Default Mode Disabled.
Figure 45 - UL_EGPRS_BACKHAUL_USED
DL_EGPRS_BACKHAUL_ USEDThe system will support a per-carrier gauge statistic to measure the actual backhaul used to carry downlink traffic for an EGPRS carrier.Type: GaugePegged:PerCarrier
System Performance Group Vienna Page 126/137Motorola Confidential Proprietary

New/Modified: New Statistic Name DL_EGPRS_BACKHAUL_USED Reference to Standards
None
Purpose This statistic measures the mean and max value for the actual amount of downlink backhaul used for an EGPRS RTF. This is the actual backhaul that the system used to service all the active data transfers on an EGPRS carrier, after accounting for any coding scheme downgrades and radio block preemptions in the downlink.
Object Type Gauge Tag Type Carrier Alarm Severity No alarm is generated in relation to this measurement. Default Threshold N/A Statistic Maintainer
BSS
Method of Collection
The statistic pegs every block period based on the amount of the backhaul used (accounting for any downgrades or preemptions due to backhaul restrictions) in downlink by PDCHs on an EGPRS carrier
Description This DL_EGPRS_BACKHAUL_USED statistic is obtained by maintaining the mean and max values for the backhaul usage for the downlink backhaul associated with an EGRS over the statistical period.
Default Mode Disabled.
Figure 46 - DL_EGPRS_BACKHAUL_USED
UL_EGPRS_BACKHAUL_DEMANDThe system will support a per-carrier gauge statistic to measure the requested backhaul (backhaul demand) to carry the uplink data traffic for an EGPRS carrier.Type: GaugePegged: Per Carrier
System Performance Group Vienna Page 127/137Motorola Confidential Proprietary

New/Modified: New Statistic Name UL_EGPRS_BACKHAUL_DEMAND Reference to Standards
None
Purpose This statistic measures the mean and max value for the demand for the uplink backhaul associated with an EGPRS RTF. This is the maximum backhaul that the system could have used to service all the active data transfers if there were no limits on the uplink backhaul associated with the RTF.
Object Type Gauge Tag Type Carrier Alarm Severity No alarm is generated in relation to this measurement. Default Threshold N/A Statistic Maintainer
BSS
Method of Collection
The statistic pegs every block period based on the amount of the backhaul requested (before any backhaul related restriction) are applied in uplink by PDCHs on an EGPRS carrier
Description This UL_EGPRS_BACKHAUL_DEMAND statistic is obtained by maintaining the mean and max values for the backhaul demand for the uplink backhaul associated with an EGRS over the statistical period.
Default Mode Disabled.
Figure 47 - UL_EGPRS_BACKHAUL_DEMAND
DL_EGPRS_BACKHAUL_DEMANDThe system shall support a per-carrier gauge statistic to measure the requested backhaul (backhaul demand) to carry downlink traffic for an EGPRS carrier.Type: GaugePegged: Per Carrier
System Performance Group Vienna Page 128/137Motorola Confidential Proprietary

New/Modified: New Statistic Name DL_EGPRS_BACKHAUL_DEMAND Reference to Standards
None
Purpose This statistic measures the mean and max value for the demand for the downlink backhaul associated with an EGPRS RTF. This is the maximum backhaul that the system could have used to service all the active data transfers if there were no limits on the downlink backhaul associated with the RTF.
Object Type Gauge Tag Type Carrier Alarm Severity No alarm is generated in relation to this measurement. Default Threshold N/A Statistic Maintainer
BSS
Method of Collection
The statistic pegs every block period based on the amount of the backhaul requested (before any backhaul related restrictions are applied) in downlink by PDCHs on an EGPRS carrier
Description This DL_EGPRS_BACKHAUL_DEMAND statistic is obtained by maintaining the mean and max values for the backhaul demand for the downlink backhaul associated with an EGRS over the statistical period.
Default Mode Disabled.
Figure 48 - DL_EGPRS_BACKHAUL_USED
EGPRS_64K_CHANNEL_WIDTHThe system will support a per-carrier gauge statistic to measure the average number of DS0s in sync and being used as part of the VersaChannel associated with an EGPRS carrier. Type: GaugePegged: Per CarrierNew/Modified: New Statistic Name EGPRS_64K_CHANNEL_WIDTH Reference to Standards
None
Purpose This statistic measures the mean and max value for the VersaChannel width on a per-carrier basis for an EGPRS carrier
Object Type Gauge Tag Type Carrier Alarm Severity No alarm is generated in relation to this measurement. Default Threshold N/A Statistic Maintainer
BSS
Method of Collection
The statistic pegs whenever there is a change in the width of the VersaChannel associated with a carrier.
Description This EGPRS_64K_CHANNEL_WIDTH statistic is obtained by maintaining the current width of the VersaChannel and the amount of time the width is unchanged over the statistical period.
Default Mode Disabled.
Figure 49 - EGPRS_64K_CHANNEL_WIDTH
System Performance Group Vienna Page 129/137Motorola Confidential Proprietary

These statistics provide information to the operator to detect conditions where the carrier is under/over equipped as far as the RTF backhaul is concerned. The backhaul efficiency for a carrier can be measured using these statistics. These statistics can be used to plot a chart as shown in Figure 10. If the demand is constantly higher than the VersaChannel width, that indicates a clear case of under provisioned backhaul. Similarly, if the demand is constantly well below the VersaChannel width, it indicates that the RTF backhaul is over provisioned.
Figure 50 - Example usage of the VT carrier stats to measure backhaul efficiency
Note that; all the stats for a VersaTrau RTF will apply to all EGPRS capable carriers (pkt_radio_type = 64K) once VersaTrau feature is introduced. These stats will depend only on having EGPRS unrestricted and don’t require VersaTrau to be unrestricted.
The following EGPRS statistics that measures the Coding Schemes for radio blocks transferred will count the actual Coding Scheme used for transferring the VersaTrau radio block over the backhaul:
DL_RADIO_BLKS_1_TSDL_RADIO_BLKS_2_TSDL_RADIO_BLKS_3_TSDL_RADIO_BLKS_4_TSDL_TBF_TIME_1_TSDL_TBF_TIME_2_TSDL_TBF_TIME_3_TSDL_TBF_TIME_4_TS
UL_RADIO_BLKS_GMSK_1_TSUL_RADIO_BLKS_GMSK_2_TSUL_TBF_TIME_GMSK_1_TSUL_TBF_TIME_GMSK_2_TSUL_RLC_ACK_NEW_BLKSUL_RLC_UNACK_NEW_BLKSUL_RLC_RETX_BLKS
The following statistics can be used for VersaTrau planning:
System Performance Group Vienna Page 130/137Motorola Confidential Proprietary

DL_RLC_ACK_NEW_BLKSDL_RLC_UNACK_NEW_BLKSDL_RLC_RETX_BLKSDL_RLC_STALLED_BLKSDL_RLC_NACK_BLKSDL_RLC_DDTR_BLKSAIR_DL_CONTROL_BLKS
System Performance Group Vienna Page 131/137Motorola Confidential Proprietary

Appendix A – List of GPRS raw statistics
Note: Not all raw statistics listed here are covered in this document. Raw statistics, which are not used or explained in this document, are highlighted.
ACCESS_PER_PCHACCESS_PER_PPCHAIR_DL_CONTROL_BLKSAIR_DL_TBF_FAILURESAIR_UL_CONTROL_BLKSAIR_UL_TBF_FAILURESCH_REQ_UNSVCD_PCUCHANNEL_REQS_RECCHANNEL_REQS_REJECTCHANNEL_REQS_SUCCESSCODING_SCHEME_CHANGECONG_REL_DL_SCTSCS_PAGE_REQSCS12_ON_32K_CHANCS1234_ON_64K_CHANDL_BLER_CS1DL_BLER_CS2DL_BLER_CS3DL_BLER_CS4DL_BLER_MCS1DL_BLER_MCS2DL_BLER_MCS3DL_BLER_MCS4DL_BLER_MCS5DL_BLER_MCS6DL_BLER_MCS7DL_BLER_MCS8DL_BLER_MCS9DL_BUSY_PDTCHDL_EGPRS_BACKHAUL_DEMANDDL_EGPRS_BACKHAUL_USEDDL_LLC_DATA_VOLUME DL_LLC_FRAMES_GBDL_LLC_FRAMES_PCUDL_PDTCH_Q_LENGTHDL_PDTCH_SEIZUREDL_RADIO_BLKS_1_TSDL_RADIO_BLKS_2_TSDL_RADIO_BLKS_3_TSDL_RADIO_BLKS_4_TSDL_RLC_ACK_NEW_BLKSDL_RLC_DDTR_BLKSDL_RLC_NACK_BLKSDL_RLC_RETX_BLKSDL_RLC_STALLED_BLKSDL_RLC_UNACK_NEW_BLKSDL_TBF_TIME_1_TSDL_TBF_TIME_2_TSDL_TBF_TIME_3_TSDL_TBF_TIME_4_TS
EGPRS_64K_CHANNELS_SWITCHEDEGPRS_64K_CHANNEL_WIDTH EGPRS_64K_NOT_AVAILEGPRS_AVAIL_PDTCHEGPRS_DL_ASGN_PCCCHG_RACH_UNSVCD_BTSGBL_DL_DATA_THRPUTGBL_DL_DATA_THRPUT_HISTGBL_FLOW_CTRL_SENTGBL_PAGING_REQSGBL_UL_DATA_THRPUTGBL_UL_DATA_THRPUT_HISTGBL_UNAVAILABLEGPRS_32K_CHANNELS_SWITCHEDGPRS_32K_DL_NOT_AVAILGPRS_32K_UL_NOT_AVAILGPRS_ACCESS_PER_AGCHGPRS_ACCESS_PER_RACHGPRS_AVAIL_PDTCHGPRS_CELL_CONGESTIONGPRS_CELL_RESELECT_FAILGPRS_CHANNELS_SWITCHEDGPRS_DL_ASGN_PCCCHGPRS_PCH_AGCH_Q_LENGTHGPRS_PPCH_PAGCH_Q_LENGTHGPRS_PRR_BLK_USGGPRS_RACH_ARRIVALIDLE_PDTCH_INTF_BAND0IDLE_PDTCH_INTF_BAND1IDLE_PDTCH_INTF_BAND2IDLE_PDTCH_INTF_BAND3IDLE_PDTCH_INTF_BAND4IMM_ASSGN_CAUSELAPD_CONGESTIONNO_PDTCH_AVAILNO_PDTCH_AVAIL_TIMEPACCH_PAGE_REQSPDU_DISCARD_FRPDU_DISCARD_LLCPFC_ADMISSIONPFC_ADMISSION_OTHERPFC_DOWNGRADE_FAILUREPFC_DOWNGRADE_SUCCESSPFC_PREEMPTIONSPFC_REJECTIONPFC_REJECTION_OTHERPFC_REJECT_CAUSESPFC_REJ_DGRD_PRMPT_CELLPFC_UPGRADEPRP_LOAD
System Performance Group Vienna Page 132/137Motorola Confidential Proprietary

PS_PAGE_REQSTBF_DL_ASGN_PACCHTBF_REL_PACCH_LOSTTBF_SESSIONSTIMER_EXP_PAP_CONVUL_BLER_CS1UL_BLER_CS2UL_BLER_CS3UL_BLER_CS4UL_BLER_MCS1UL_BLER_MCS2UL_BLER_MCS3UL_BLER_MCS4UL_BLER_MCS5UL_BLER_MCS6UL_BLER_MCS7UL_BLER_MCS8UL_BLER_MCS9
UL_BUSY_PDTCHUL_EGPRS_BACKHAUL_DEMANDUL_EGPRS_BACKHAUL_USED UL_LLC_DATA_VOLUMEUL_LLC_FRAMESUL_PDTCH_Q_LENGTHUL_PDTCH_SEIZUREUL_RADIO_BLKS_8PSK_1_TSUL_RADIO_BLKS_8PSK_2_TSUL_RADIO_BLKS_GMSK_1_TSUL_RADIO_BLKS_GMSK_2_TSUL_RLC_ACK_NEW_BLKSUL_RLC_RETX_BLKSUL_RLC_UNACK_NEW_BLKSUL_TBF_TIME_8PSK_1_TSUL_TBF_TIME_8PSK_2_TSUL_TBF_TIME_GMSK_1_TSUL_TBF_TIME_GMSK_2_TS
System Performance Group Vienna Page 133/137Motorola Confidential Proprietary

Appendix B – List of GPRS Key StatisticsNote: Most of the key statistics used in this document are available in the OMC Performance Management. Key statistics, which are not in PM or whose formulae have been changed compared to the formulae in PM are highlighted.
CELL_CONGESTION_TIMECS1_USAGE_DLCS1_USAGE_ULCS2_USAGE_DLCS2_USAGE_ULCS3_USAGE_DLCS3_USAGE_ULCS4_USAGE_DLCS4_USAGE_ULDL_BANDWIDTH_INDICATOR_EGPRSDL_BANDWIDTH_INDICATOR_GPRSDL_BIAS_EGPRSDL_BIAS_GPRSDL_BLER_EGPRSDL_BLER_GPRSDL_LLC_BUFFER_OVERFLOW_RATEDL_LLC_TRAFFIC_VOLUME_INDICATORDL_MEAN_TBF_DURATIONDL_MEAN_USER_THROUGHPUT_PER_TIMESLOTDL_MEAN_USER_TRAFFIC_PER_TBFDL_PDTCH_UTILISATION_1_TSDL_PDTCH_UTILISATION_2_TSDL_PDTCH_UTILISATION_3_TSDL_PDTCH_UTILISATION_4_TSDL_PDTCH_UTILISATION_BY_ALLOCATIONDL_PDTCH_UTILISATION_BY_TRAFFICDL_RLC_MAC_OVERHEADDL_RLC_MAC_WINDOW_STALL_CS1DL_RLC_MAC_WINDOW_STALL_CS2DL_RLC_MAC_WINDOW_STALL_CS3DL_RLC_MAC_WINDOW_STALL_CS4DL_RLC_MAC_WINDOW_STALL_MCS1DL_RLC_MAC_WINDOW_STALL_MCS2DL_RLC_MAC_WINDOW_STALL_MCS3DL_RLC_MAC_WINDOW_STALL_MCS4DL_RLC_MAC_WINDOW_STALL_MCS5DL_RLC_MAC_WINDOW_STALL_MCS6DL_RLC_MAC_WINDOW_STALL_MCS7DL_RLC_MAC_WINDOW_STALL_MCS8DL_RLC_MAC_WINDOW_STALL_MCS9DL_TBF_FAILURE_RATEDL_TBF_INTERLEAVING_ACTIVITYDL_TBF_SUCCESS_RATEDL_TERMINAL_TYPE_ACTIVITY_1_TSDL_TERMINAL_TYPE_ACTIVITY_2_TSDL_TERMINAL_TYPE_ACTIVITY_3_TSDL_TERMINAL_TYPE_ACTIVITY_4_TSDL_THROUGHPUT_TERMINAL_1_TSDL_THROUGHPUT_TERMINAL_2_TSDL_THROUGHPUT_TERMINAL_3_TSDL_THROUGHPUT_TERMINAL_4_TS
DL_USER_TRAFFIC_EGPRSDL_USER_TRAFFIC_GPRSGPRS_PAGING_OVERFLOW_RATE_PCHGPRS_PAGING_OVERFLOW_RATE_PPCHLLC_ABNORMAL_TBF_RELEASE_RATELLC_DISCARDS_ON_CELL_RESELECTIONMCS1_USAGE_DLMCS1_USAGE_ULMCS2_USAGE_DLMCS2_USAGE_ULMCS3_USAGE_DLMCS3_USAGE_ULMCS4_USAGE_DLMCS4_USAGE_ULMCS5_USAGE_DLMCS5_USAGE_ULMCS6_USAGE_DLMCS6_USAGE_ULMCS7_USAGE_DLMCS7_USAGE_ULMCS8_USAGE_DLMCS8_USAGE_ULMCS9_USAGE_DLMCS9_USAGE_ULNCC_CELL_RESELECTION_SUCCESS_RATETBF_DROP_RATE_ON_PACCH_LOSTUL_BANDWIDTH_INDICATOR_EGPRSUL_BANDWIDTH_INDICATOR_GPRSUL_CHANNEL_REQUESTS_SUCCESS_RATEUL_CHANNEL_REQUESTS_UNSERVICED_RATEUL_LLC_TRAFFIC_VOLUME_INDICATORUL_MEAN_TBF_DURATIONUL_MEAN_USER_THROUGHPUT_PER_TIMESLOTUL_MEAN_USER_TRAFFIC_PER_TBFUL_PDTCH_UTILISATION_1_TSUL_PDTCH_UTILISATION_2_TSUL_PDTCH_UTILISATION_BY_ALLOCATIONUL_PDTCH_UTILISATION_BY_TRAFFICUL_RLC_MAC_OVERHEADUL_TBF_FAILURE_RATEUL_TBF_INTERLEAVING_ACTIVITYUL_TBF_REJECTION_RATEUL_TBF_SUCCESS_RATEUL_TERMINAL_TYPE_ACTIVITY_1_TSUL_TERMINAL_TYPE_ACTIVITY_2_TSUL_THROUGHPUT_TERMINAL_1_TSUL_THROUGHPUT_TERMINAL_2_TSUL_USER_TRAFFIC_EGPRSUL_USER_TRAFFIC_GPRS
System Performance Group Vienna Page 134/137Motorola Confidential Proprietary
Appendix C – References
Reference Description Document ID[1] 3GPP TS 44.060;
RLC/MAC protocol[2] 3GPP TS 23.060; GPRS
service description; Stage 2
[3] 3GPP TS 44.018; Mobile radio interface layer 3 specification; Radio resource control protocol
[4] 3GPP TS 05.02; Multiplexing and multiple access on the radio path
[5] Enhanced Scheduling Feature Requirements and Architecture Specification
GSM-BSS-4441-FRAS-001
[6] PBCCH/PCCCH Feature Requirements and Architecture Specification
GSM-BSS-3723-FRAS-001
[7] GPRS Interleaving TBFs Feature Requirements and Architecture Specification
GSM-BSS-4253-FRAS-001
[8] BSS Enhanced One Phase Access Feature Requirements and Architecture Specification
GSM-BSS-4386-FRAS-001
[9] Performance Enhancements Under Load Feature Requirements and Architecture Specification
GSM-BSS-4445-FRAS-001
[10] Step 1 - Benchmark a GPRS System - Measurement Standards v.4.3, Robert Stoiber
http://compass.mot.com/doc/123739392/Step_1_-_Benchmark_a_GPRS_System_-_Measurement_Standards.doc
System Performance Group Vienna Page 135/137Motorola Confidential Proprietary

[11] Step 2 - Performance Troubleshooting in a Nutshell 1.4, Robert Stoiber
http://compass.mot.com/doc/119146331/Step_2_-_Performance_Troubleshooting_in_a_Nutshell.doc
[12][13] Packet Loss Analysis in
GPRS Network v1.1, Tubagus Rizal
http://compass.mot.com/go/105058479
[14] GPRS latency: theory and practice v0.1, José Gil
NOP-GPRS-PERFORM-001
[15] Gbsnoop tool and documentation
http://compass.mot.com/go/104486362
[16] GSR8 QoS Feature Introduction Guide v0.8
http://compass.mot.com/doc/153878223/ GSR8_R4_QoS_Feature_Introduction_Guide.zip
[17] GSR8 VersaTrau Feature Introduction Guide v0.3
http://compass.mot.com/doc/154899952/ VersaTrau_Feature_Introduction_Guide.doc
System Performance Group Vienna Page 136/137Motorola Confidential Proprietary

Appendix D – AbbreviationsFor the purpose of the present document, the following abbreviations apply.3GPP 3rd Generation Partnership ProjectARP Allocation and Retention PriorityBCCH Broadcast Common Control ChannelBSS Base Station SubsystemCCCH Common Control ChannelCCN Cell Change NotificationCRC Cyclic Redundancy CheckCS Circuit SwitchedEDGE Enhanced Data for Global EvolutionEGPRS Enhanced General Packet Radio Service8-PSK 8-Phase Shift KeyingGGSN Gateway GPRS Support NodeGMSK Gaussian Minimum Shift KeyingGPRS General Packet Radio ServiceIP Internet Protocolkbps kilo bits per secondMCS Modulation and Coding SchemeMS Mobile StationMSC Mobile Switching CentreMTBR Minimum Throughput Budget RequirementNACC Network Assisted Cell ChangePACCH Packet Associated Control ChannelPBCCH Packet Broadcast Common Control ChannelPCCCH Packet Common Control ChannelPDN Packet Data NetworkPDP Packet Data ProtocolPDTCH Packet Data Traffic ChannelPFC Packet Flow ContextPRACH Packet Random Access ChannelPS Packet SwitchedQoS Quality of ServiceRACH Random Access ChannelSGSN Serving GPRS Support NodeTBF Temporary Block FlowTHP Traffic Handling Priority
System Performance Group Vienna Page 137/137Motorola Confidential Proprietary