how to use the 2013 pdms basic map viewer to use the 2013 pdms basic map viewer . map viewer...
TRANSCRIPT

How to Use the 2013 PDMS Basic Map Viewer
Map Viewer Versions The 2003 PDMS Map Viewer is a complete redesign of the Indiana Geological Survey’s Petroleum Database Management System Map Viewer. The new Map Viewer comes in two different versions:
• PDMS Map Viewer Basic The Basic Map Viewer offers a large number of online map features and options at no cost.
• PDMS Map Viewer Premium The Premium Viewer includes more options, and uses more sophisticated layers for processing PDMS data. Please note: The Premium Map Viewer is still being tested and is expected to be available in the near future.
Overview The Map Viewer opening screen shows three Screen Areas that interact based on the user’s input. The relative positions of the Screen Areas may vary depending on screen size and resolution. The Areas are:
1. Map Screen Area (the Map)—interactively displays data selected from the Layers Screen Area.
2. Layers Screen Area—user selects the information to be displayed on the Map. The functionality of each Section is described below.
3. Tools Screen Area—user selects search, navigation, measurements, legends, and printing features.
Conventions used throughout the Map Viewer Help:
• Unless otherwise stated, “click” or “clicking” means to click down on the user’s left mouse button. • “Drag” (also called “pan”) means to click the left mouse button and continue holding it down while dragging
the Map (or other specified object) around on the screen. • “Map” may be used as a shortened form of “Map Screen Area.” • “Area” may be used as a shortened form of “Screen Area.” • “IGS” refers to the Indiana Geological Survey. • “PDMS” refers to the IGS Petroleum Database Management System.
Indiana Geological Survey PDMS 2013 Map Viewer Instructions March 31, 2013 Page 1

Map Screen Area • When opened, the Map displays the State of Indiana and its
counties at a scale of 1:2,500,000 on a white basemap. Also shown are map layers that contain the known locations of all oil wells (green) and gas wells (red) ever drilled in the state.
• The layers displayed on the Map are selected from the available options in the Layers Screen Area.
• The Map can be zoomed or panned from within the Map itself (other methods of navigating and zooming are described later in the Layers Screen Area and in the Tools Screen Area).
• Zoom in or out using the mouse wheel Place the screen cursor anywhere on the Map. Roll the wheel back and forth to zoom in or zoom out. The map will zoom to the cursor location where the zoom started. Users who do not use a mouse with a wheel will need to zoom using one of the other methods in the
Layers Screen Area or the Tools Screen Area. • Move the Map by dragging it around the screen. This works anywhere on the Map. • Clicking on any well symbol will bring up a small information box that limited information about the selected
well. A link to the well’s full entry in the PDMS Well Record Tables is also found in the information box. If the Map is zoomed out so far that clicking an individual well actually selects several wells, a Search Results Window will pop up with similar data. To avoid the Search Results Window, zoom in close enough to allow a single well to be selected.
Layers Screen Area (Includes Basemap Layers) Information to be displayed on the Map is selected from available choices in the Layers Screen. Two tabs are located at the top of the Layers Screen Area:
The Select Layers Button brings up the default Layer Settings and user-available options. Each of the main Layer Groups contains multiple layers. In the example, the Petroleum Wells and Labels Layer Group is expanded and displays the available layers to view in that group. Each layer is explained later.
Indiana Geological Survey PDMS 2013 Map Viewer Instructions March 31, 2013 Page 2
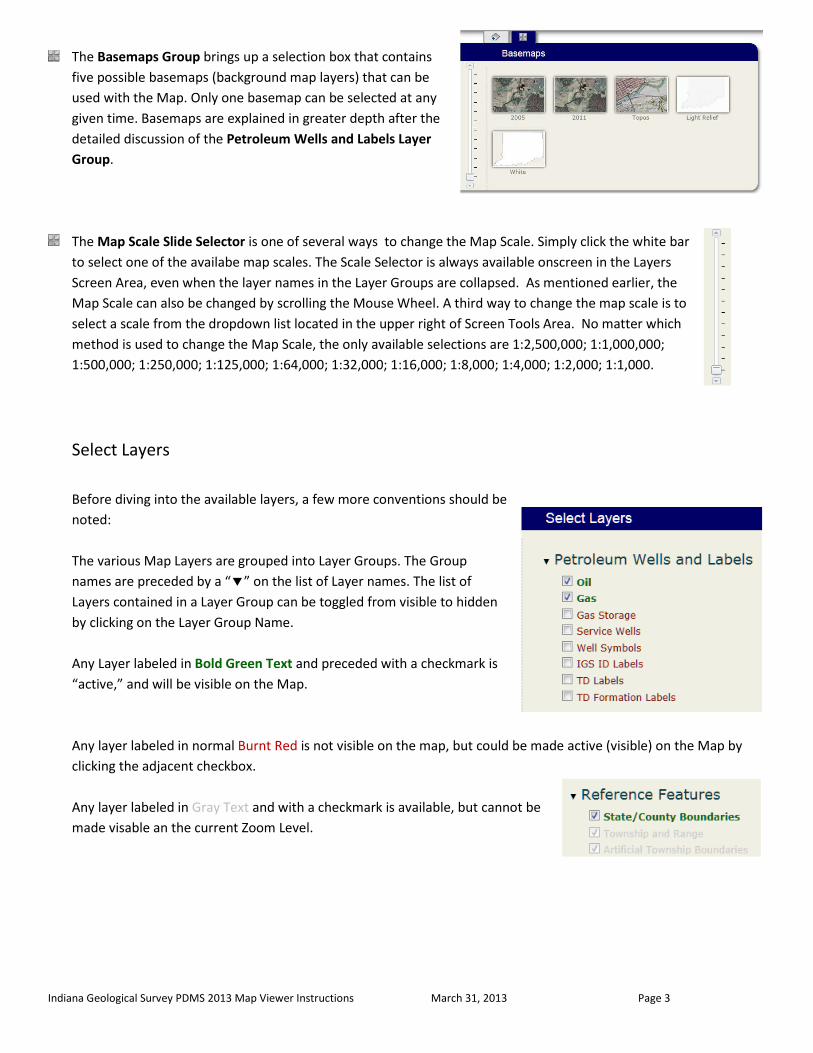
The Basemaps Group brings up a selection box that contains five possible basemaps (background map layers) that can be used with the Map. Only one basemap can be selected at any given time. Basemaps are explained in greater depth after the detailed discussion of the Petroleum Wells and Labels Layer Group.
The Map Scale Slide Selector is one of several ways to change the Map Scale. Simply click the white bar to select one of the availabe map scales. The Scale Selector is always available onscreen in the Layers Screen Area, even when the layer names in the Layer Groups are collapsed. As mentioned earlier, the Map Scale can also be changed by scrolling the Mouse Wheel. A third way to change the map scale is to select a scale from the dropdown list located in the upper right of Screen Tools Area. No matter which method is used to change the Map Scale, the only available selections are 1:2,500,000; 1:1,000,000; 1:500,000; 1:250,000; 1:125,000; 1:64,000; 1:32,000; 1:16,000; 1:8,000; 1:4,000; 1:2,000; 1:1,000.
Select Layers Before diving into the available layers, a few more conventions should be noted: The various Map Layers are grouped into Layer Groups. The Group names are preceded by a “” on the list of Layer names. The list of Layers contained in a Layer Group can be toggled from visible to hidden by clicking on the Layer Group Name.
Any Layer labeled in Bold Green Text and preceded with a checkmark is “active,” and will be visible on the Map. Any layer labeled in normal Burnt Red is not visible on the map, but could be made active (visible) on the Map by clicking the adjacent checkbox. Any layer labeled in Gray Text and with a checkmark is available, but cannot be made visable an the current Zoom Level.
Indiana Geological Survey PDMS 2013 Map Viewer Instructions March 31, 2013 Page 3

Petroleum Wells and Labels
Clicking on the Petroleum Wells and Labels layer:
Oil locations of all wells in Indiana that have ever been used to produce oil. The layer is displayed on the opening Map screen.
Gas locations of all wells in Indiana that have ever been used to produce natural gas. The layer is displayed on the opening Map screen.
Gas Storage locations of all wells in Indiana that have ever been used to store natural gas. The layer is not displayed on the opening Map screen, but may be turned active by checking the box.
Service Wells locations of all wells in Indiana that have ever been used petroleum service wells. The layer is not displayed on the opening Map screen, but may be turned active by checking the box.
The first four symbols are simple color dots meant to portray the regional distribution of oil, gas, gas storage, and service wells for general purposes. Only one symbol is shown for any single well, when more than one well type may be applicable to show on the Map, priorty is given to Oil over Gas, Gas over Gas Storage, and Gas Storage over Service. When zoomed in close enough to recognize individual well symbols, industry professionals and academicians are likely to prefer turning off the colored dots and turning on the “Well Symbols” Layer option because the symbols provide more specific well information:
Well Symbols
IGS Petroleum Wells Symbols are explained in the PDMS Help: http://igs.indiana.edu/PDMS/Help/IGS_Petroleum_Well_Symbols_Explanation.pdf A complete list of individual IGS Petroleum Well Symbols is available at this link in the PDMS Help: http://igs.indiana.edu/PDMS/Help/PDMS_Well_Symbols_Table.pdf
IGS ID
The IGS ID Number is posted on the map immediately above each well symbol.
TD Labels The posted total depth of each well is posted to the right of each well symbol. http://igs.indiana.edu/PDMS/Help/Posted_TD.htm
TD Formation Labels
The geologic unit (formation or stratigraphic unit) at the posted total depth of each well is posted to below each well symbol. http://igs.indiana.edu/PDMS/Help/Geologic_Unit.htm
Petroleum Fields
Petroleum fields are named areas of land that encompass one or more petroleum-related wells. The type of field and their names can be made visable on the Map by checking on the approriate checkboxes. The field outlines can be shown by clicking a different layer type from the Petroleum Fields list. The field names can independently be made visible by clicking on the layers that inculde the word “Labels.”
Indiana Geological Survey PDMS 2013 Map Viewer Instructions March 31, 2013 Page 4

Oil and Gas Fields have a dashed ouline as in the example of Rumble Field. New Albany Shale Fields have alternating dot-dash pattern as shown for Montgomery NAS Field. New Albany Shale Fields always have “NAS” as part of their name. The example field is based on a single horizontal gas well that follows the closely-spaced dots in the east part of Section 16. Gas Storage Fields have an outline pattern of continuous closely-spaced dots as shown for Linton GSP Field. Gas Storage Fields always have “GSP” (derived from Gas Storage Project) as part of their name.
Specific Well Data Specific Well Data layers show which wells have available data of a specified type, in the example, wells for which the IGS has sample cuttings in its collection. We recommend viewing the Specific Well Data layers separately to avoid hiding symbols from one layer behind another layer.
Indiana Geological Survey PDMS 2013 Map Viewer Instructions March 31, 2013 Page 5
The following layers are available in the Specific Well Data layers Group. Samples wells with sample cuttings in the IGS Sample Collection Cores wells with rock core in the IGS Core Collection
Scanned Logs
wells with well logs that have been digitally scanned and integrated with online well records. While all IGS well records have been scanned, many have not yet been integrated in the PDMS and are not shown on the map. Looking at the Scanned Logs layer, one cannot discern whether a well without a Scanned Logs symbol has not been integrated, or whether a well log is uavailable because one never exited or was never aquired.
Scanned Reports
wells with reports (and other paper documents) that have been digitally scanned and integrated with online well records. While all IGS well documents have been scanned, many have not yet been integrated in the PDMS and are not shown on the map. Looking at the Scanned Reports layer, one cannot discern whether a well without a Scanned Reports symbol has not been integrated, or whether a report is uavailable because one never exited or was never aquired.
Type Log Wells wells that have been singled out as particularly important for understanding Indiana’s geology. They tend to deeper wells. Link to more information on IGS Type Logs: http://igs.indiana.edu/PDMS/Help/Type_Log_Well.htm
Pay Zones Pay Zones by Formation
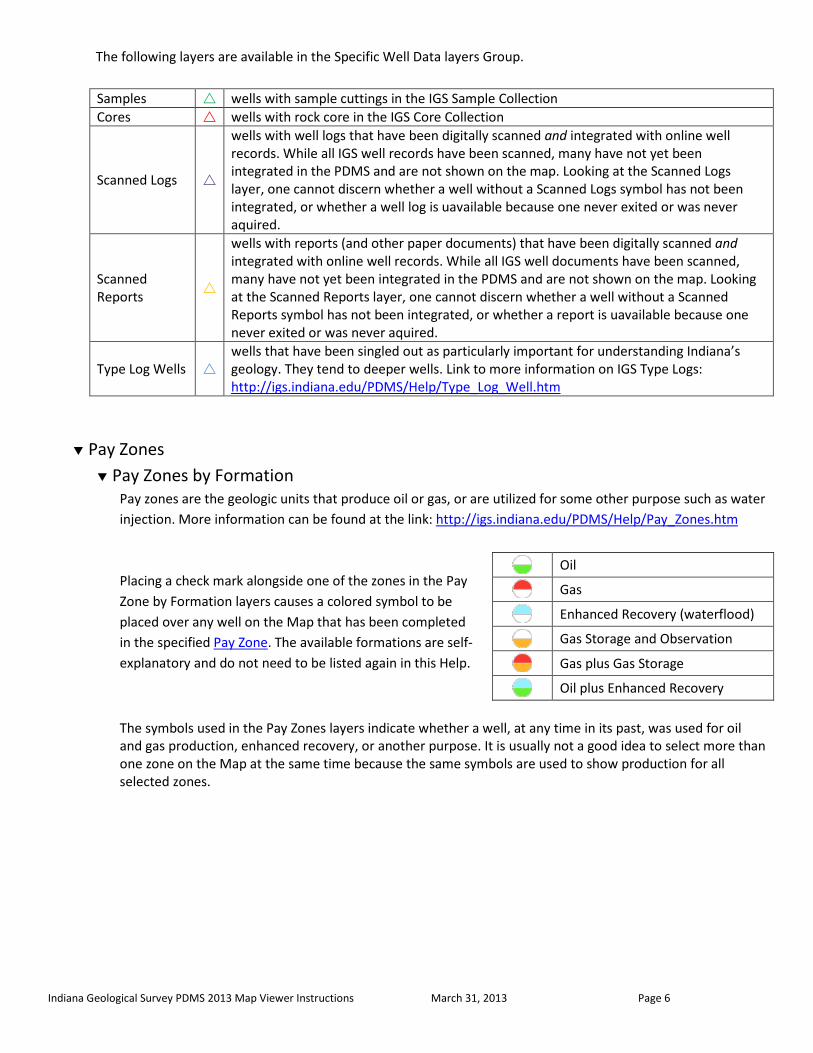
Pay zones are the geologic units that produce oil or gas, or are utilized for some other purpose such as water injection. More information can be found at the link: http://igs.indiana.edu/PDMS/Help/Pay_Zones.htm Placing a check mark alongside one of the zones in the Pay Zone by Formation layers causes a colored symbol to be placed over any well on the Map that has been completed in the specified Pay Zone. The available formations are self-explanatory and do not need to be listed again in this Help.
The symbols used in the Pay Zones layers indicate whether a well, at any time in its past, was used for oil and gas production, enhanced recovery, or another purpose. It is usually not a good idea to select more than one zone on the Map at the same time because the same symbols are used to show production for all selected zones.
Oil
Gas
Enhanced Recovery (waterflood)
Gas Storage and Observation
Gas plus Gas Storage
Oil plus Enhanced Recovery
Indiana Geological Survey PDMS 2013 Map Viewer Instructions March 31, 2013 Page 6

Reference Features
The Reference layers mostly show natural features and government boundries. The layers are listed below, some with comments, self-obvious layers are not commented. Marking the checkboxes next to the layer names adds the layer content to the Map. Grayed out labels are not available at the selected Map Scale. Links to Help Topics in the PDMS are provided where further information can be found. State/County Boundaries are visible by default at any map scale. They can be unchecked at any scale. County name labels automatically appear in the layer and cannot be turned off independently. Township and Range outlines and names are turned on when zoomed in to scales of 1:250,000 or closer. They can be turned off by unchecking the layer checkbox, but they will return when the Map is zoomed out beyond 1:250,000. Artificial Township Boundary outlines and names are shown on the Map in the same manner as those for true Township and Range features described above. Civil Townships are land divisions used locally in Indiana. They are not used in the petroleum community to describe drilling and production activity. They are included in the PDMS Map Viewer to facilitate communication with land owners who commonly describe their propety as located in a particular Civil Townships. Civil Township boundaries and names are contained on the same layer and cannot be searched for in the PDMS. The layer is not visible by default, but can be checked on at in map scale. Civil Township labels only appear on the Map when zoomed in to 1:250,000 or closer. Topo Quad Outlines (Topographic Quadrangles) shows the locations of US Geological Survey 7.5 Minute Topographic Quadrangle Maps. The layer is turned on checking the checkbox next to the layer name. It is visible at all map scales. The Topo Quad Labels are shown on a separate layer. Topo Quad Labels are the names of US Geological Survey 7.5 Minute Topographic Quadrangle Maps. They are visible at scales of 1:500,000 or closer. Although they appear on the Map automatically with the Outlines layer, they may be un-checkmarked and turned entirely. Sections and Land Units are the smaller units of the US Township and Range System and other locally exceptional units in Indiana. They only appear on the Map when zoomed to scales of 1:125,000 or closer. Major Rivers Streams Interstates
Indiana Geological Survey PDMS 2013 Map Viewer Instructions March 31, 2013 Page 7

Highways Roads Towns
Basemap Layers
As described earlier, a choice of one of five possible basemaps (background map layers) can be used with the Map. The Basemap is a single layer that appears behind all of the other layers selected to show on the map.
The White Basemap is the default option when opening the Map Viewer. It shows no objects and creates an uncluttered Map.
2005 Imagery
Orthophotography Basemap, (2005) - The orthophotography is natural color high-resolution (3-band) orthophotography for Indiana, collected during leaf-off conditions in March and April 2005. In 2005 the Indiana Geographic Information Council (IGIC) coordinated the 2005 IndianaMap Orthophotography Project, which facilitated the acquisition of statewide, high-resolution orthophotography and digital elevation data for Indiana. Standard resolution was established to be 1 foot pixels, while some participating counties agreed to buy-ups with 6 inch pixels. These data are hosted and maintained by our data partners at the Indiana Spatial Data Portal (ISDP), University Information Technology Services (UITS), Indiana University. Use the links below to access ISDP website for metadata and download information
Best Available Imagery
Best Available Imagery, (2005 - 2010) - Shows imagery that is considered the best available imagery for Indiana based on obtaining the most recent imagery that has a resolution of 1 foot (pixels are 1 ft x 1 ft) or better. These data are hosted and maintained by our data partners at the Indiana Spatial Data Portal (ISDP), University Information Technology Services (UITS), Indiana University. Use the links below to access the ISDP website for metadata and download information.
USGS Topographic Map
Indiana Geological Survey PDMS 2013 Map Viewer Instructions March 31, 2013 Page 8

US Geological Survey 7.5 Minute Topographic Maps, most recent vintages, have been georeferenced and stitched in a continuous layer.
Light Colored Shaded Relief
Tools Screen Area Tools Tabs
• Hover the mouse cover over each tool tab to see its tool purpose. • Click on a tab to open or close the tool.
Zoom To Tool
Zoom to County:
• Select “County” in the Search Criteria dropdown. • Select the desired county name in the Selection dropdown.
Zoom to Township/Range:
• Select “T/R” in the Search Criteria dropdown. • Type the number and direction of the desired Township and Range into the Selection box. • Press Enter to zoom to the location. • Note: there is a dropdown box under Selection that can be used to switch from the 2nd Prime Meridian
to the 1st Prime Meridian if needed.
Indiana Geological Survey PDMS 2013 Map Viewer Instructions March 31, 2013 Page 9

Zoom to IGS ID:
• Select “IGS ID” in the Search Criteria dropdown. • Type the IGS ID number into the Selection box. • Press Enter to zoom to the well. • Note: this process will automatically turn on the well symbols layer.
Zoom to Oil or Gas Field:
• Select “Oil or Gas Field” in the Search Criteria dropdown. • Select the desired oil or gas field name in the Selection dropdown. • Note: this process will automatically turn on all the petroleum fields and subsequent labels layers.
Measure Tool Use to measure areas, distances, or point locations in a variety of units.
Area Button
Measure Area: • Click the “Area” button. • Default units are given in acres. • Use the dropdown box to select other units. • Click the map to begin. • Move the pointer to the desired destination and click again – this process draws a line. • Continue clicking on the map to outline an area and double click to finish.
Distance Button
Measure Distance:
• Click the “Distance” button. • Default units are given in feet. • Use the dropdown box to select other units. • Click the map to begin. • Move the pointer to the desired destination and click again – this process draws a line. • Double click to finish, or continue the process of single clicks and drawing lines to get a series of
measurements with a cumulative result.
Indiana Geological Survey PDMS 2013 Map Viewer Instructions March 31, 2013 Page 10
Location Button
Determine a Location:
• Select the “Location” button. • Default units are given in degrees. • Use the dropdown box to select DMS (Degrees Minutes Seconds). • Click on the map to determine coordinates. • Results are returned in a variety of coordinate systems. • Note: UTM X and Y coordinates are always available in the upper right corner above the scale.
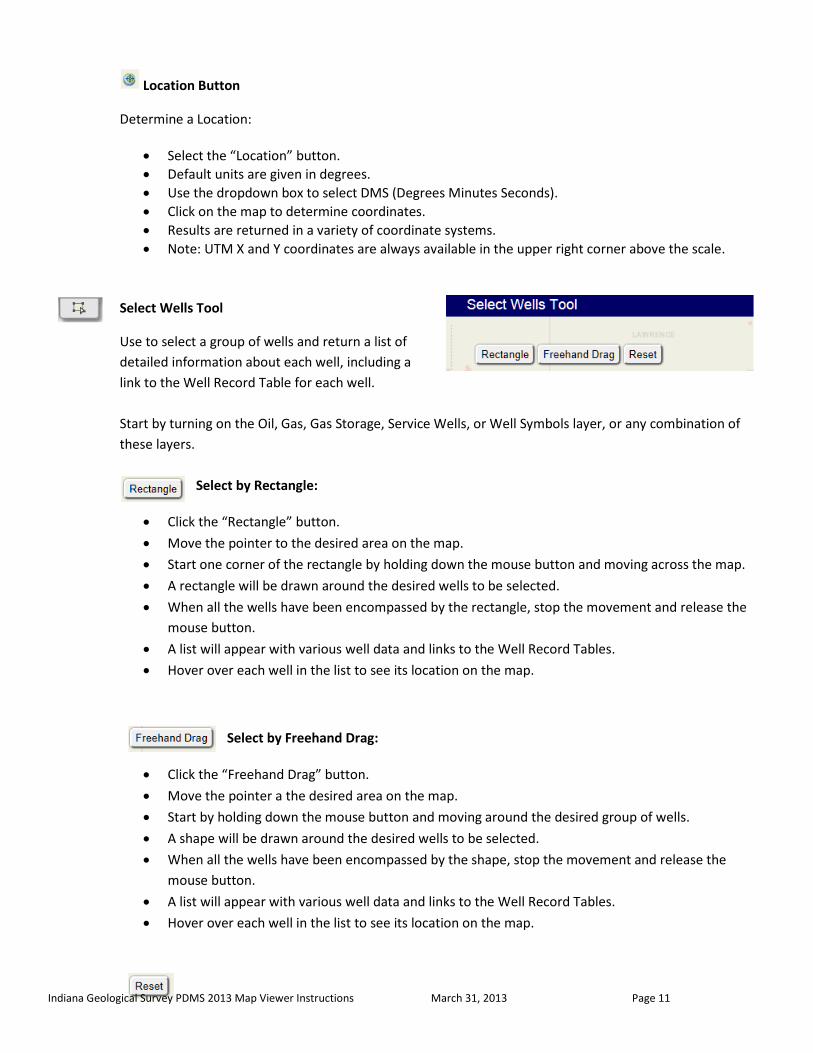
Select Wells Tool
Use to select a group of wells and return a list of detailed information about each well, including a link to the Well Record Table for each well. Start by turning on the Oil, Gas, Gas Storage, Service Wells, or Well Symbols layer, or any combination of these layers.
Select by Rectangle:
• Click the “Rectangle” button. • Move the pointer to the desired area on the map. • Start one corner of the rectangle by holding down the mouse button and moving across the map. • A rectangle will be drawn around the desired wells to be selected. • When all the wells have been encompassed by the rectangle, stop the movement and release the
mouse button. • A list will appear with various well data and links to the Well Record Tables. • Hover over each well in the list to see its location on the map.
Select by Freehand Drag:
• Click the “Freehand Drag” button. • Move the pointer a the desired area on the map. • Start by holding down the mouse button and moving around the desired group of wells. • A shape will be drawn around the desired wells to be selected. • When all the wells have been encompassed by the shape, stop the movement and release the
mouse button. • A list will appear with various well data and links to the Well Record Tables. • Hover over each well in the list to see its location on the map.
Indiana Geological Survey PDMS 2013 Map Viewer Instructions March 31, 2013 Page 11

Select “Reset” to remove all selected well data. Legend
Click the Legend tab to show a list of symbols with explanations for all active layers. The legend will change depending on what layers are turned on.
Print Menu Tool Click the Print tab to show print options and to preview or download the Map.
Indiana Geological Survey PDMS 2013 Map Viewer Instructions March 31, 2013 Page 12