how to validate that building a safe system road...
TRANSCRIPT

How to Validate that Building a Safe System Road Environment Can Save Lives
in Low & Middle Income Countries
Prof. Raphael GrzebietaTransport and Road Safety (TARS) Research Centre
University of New South Waleshttp://www.tars.unsw.edu.au/

World Health Organisation (WHO)Safe System Approach underpins WHO’s strategy
Safe System Approach underpins many country’s road safety strategy

World Health Organisation (WHO)Safe System Approach underpins WHO’s strategy
Safe System Approach underpins many country’s road safety strategy

Data capture and analysis is criticalIndonesia – Sumatra – Palm Oil Plantations

Data capture and analysis is criticalIndonesia – Sumatra – Palm Oil Plantations
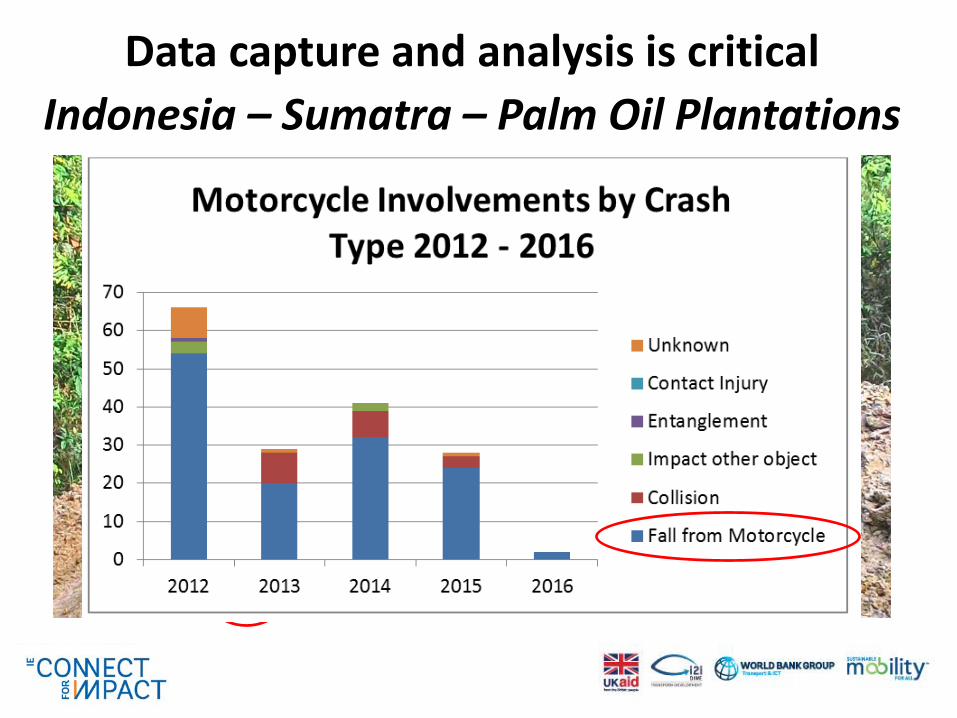
Data capture and analysis is criticalIndonesia – Sumatra – Palm Oil Plantations

Data capture and analysis is criticalIndonesia – Sumatra – Palm Oil Plantations
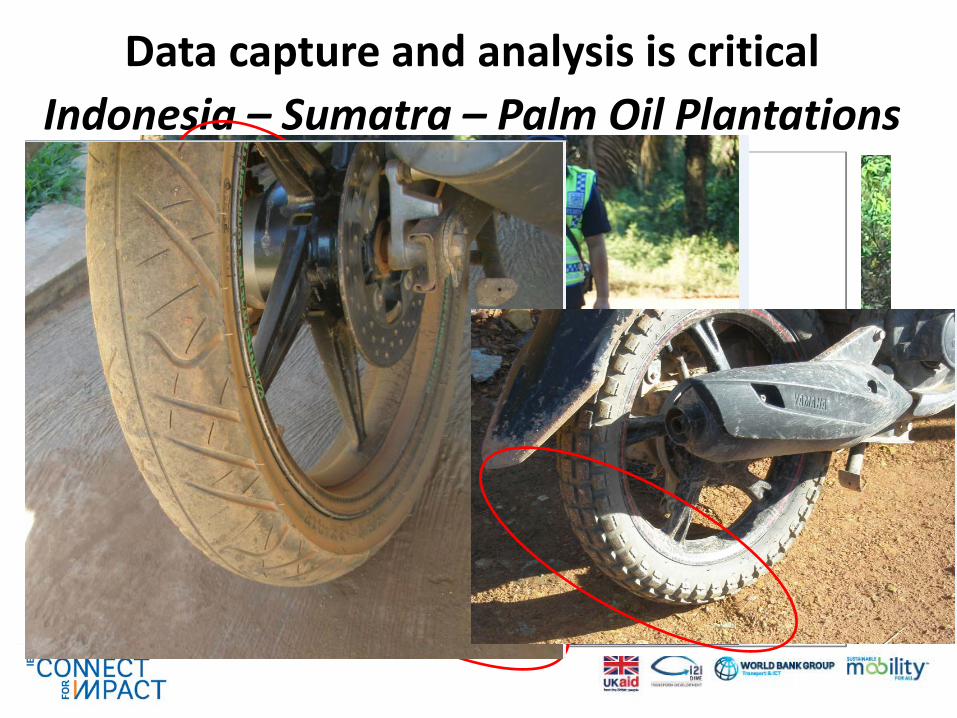
Data capture and analysis is criticalIndonesia – Sumatra – Palm Oil Plantations

Design impact speed limit for survival –recoverable injury
WORK ZONE LIMITS
This evolved from analysis of detailed forensic crash data Newtonian laws of physics the same everywhere
Safe System Principles
Pedestrian or cyclist impact

Make crashes survivable
?Real world with
inadequate speed enforcement
Any speed above 70 km/h is certain
deathPedestrian or cyclist impact

High Risk Crash Locations (potential Black Spots)

High Risk Crash Locations (potential Black Spots)

High Risk Crash Locations (potential Black Spots)

High Risk Crash Locations (potential Black Spots)

High Risk Crash Locations (potential Black Spots)
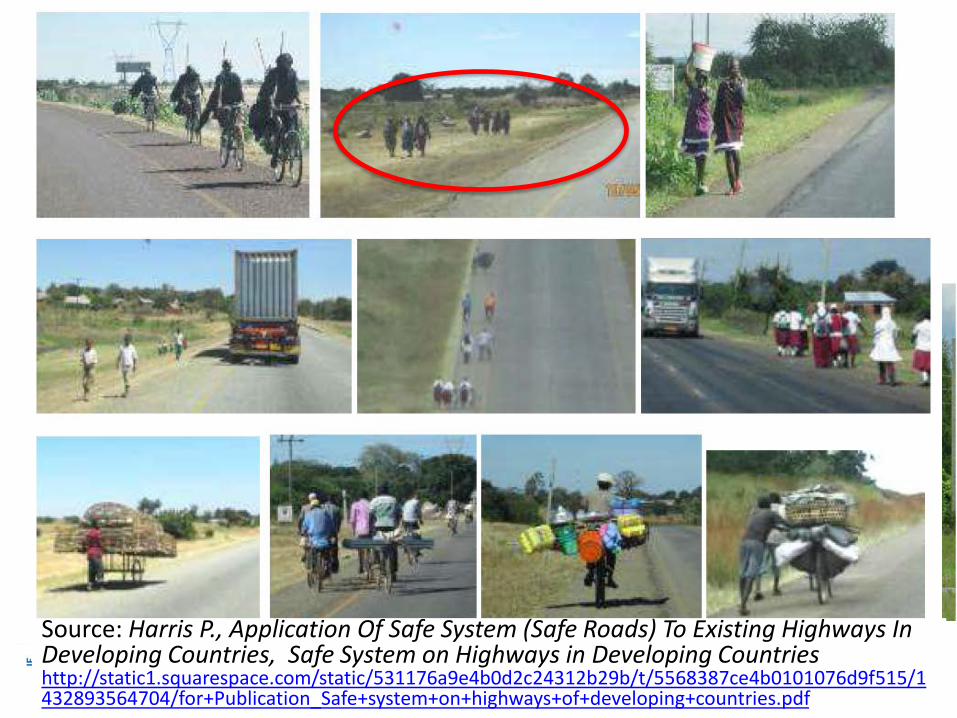
High Risk Crash Locations (potential Black Spots)
Source: Harris P., Application Of Safe System (Safe Roads) To Existing Highways In Developing Countries, Safe System on Highways in Developing Countries http://static1.squarespace.com/static/531176a9e4b0d2c24312b29b/t/5568387ce4b0101076d9f515/1432893564704/for+Publication_Safe+system+on+highways+of+developing+countries.pdf.

Romania – deadly intersections

Romania – deadly intersections
No lighting
At night car crossing will not be seen because it is side on.
Also if low beam on distance ≈ 20 m
19 m/sec x 1.5 sec ≈ 29 m
Side impact at 70 km/h!

Intersection crashes
Side collision
Real world with inadequate speed
enforcement

Head-on crashes
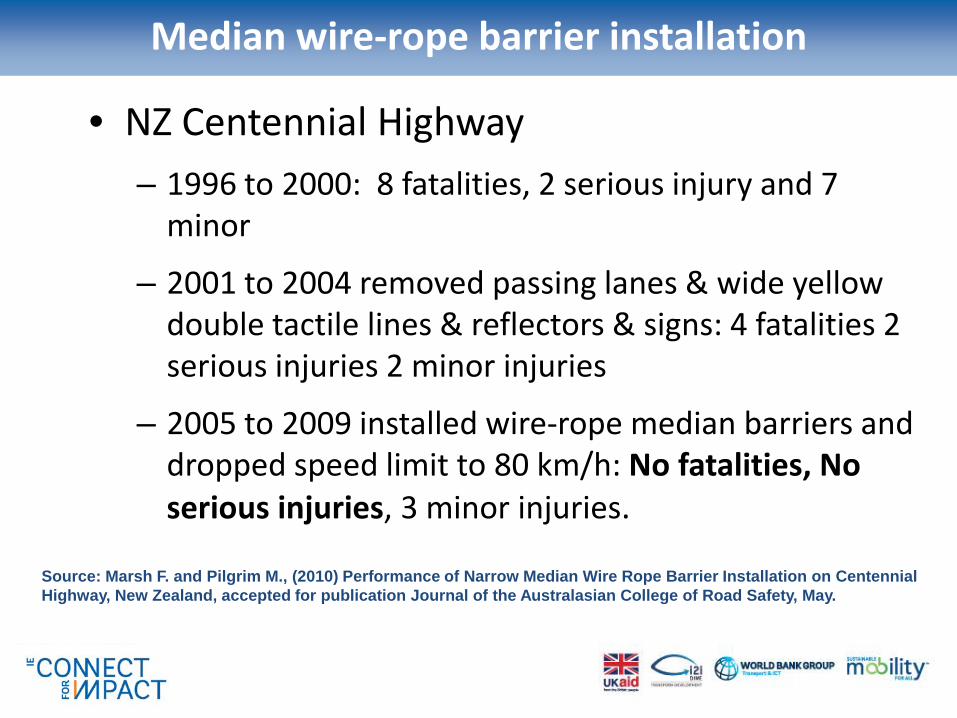
Median wire-rope barrier installation
• NZ Centennial Highway– 1996 to 2000: 8 fatalities, 2 serious injury and 7
minor
– 2001 to 2004 removed passing lanes & wide yellow double tactile lines & reflectors & signs: 4 fatalities 2 serious injuries 2 minor injuries
– 2005 to 2009 installed wire-rope median barriers and dropped speed limit to 80 km/h: No fatalities, No serious injuries, 3 minor injuries.
Source: Marsh F. and Pilgrim M., (2010) Performance of Narrow Median Wire Rope Barrier Installation on Centennial Highway, New Zealand, accepted for publication Journal of the Australasian College of Road Safety, May.

Source: New Zealand Transport Agency, Wellington
New Zealand - Centennial Highway

Sweden all road deaths – 2+1 started in 2000
0
100
200
300
400
500
600
1995 2000 2005 2010 2015Year
Deat
hsWire-rope barrier installation

Frontal Crashes – head on + run-off-the road into hard object (tree, pole, abutment)
24
Design speed impact limit for
survival –recoverable injury
(mph)
Frontal crashor hard object crash Real world with
inadequate enforcement
Frontal Crashes – head on + run-off-the road into hard object (tree, pole, abutment) ≈ 30-50% crashes

Princess Diana crashNo barrierImpact into column!
Around 85-90 km/h
31 August 1997
At the absolute limits of survivability!

What is a survivable impact?
Murray N.W., When it Comes to the Crunch, The mechanics of Car Collisions, World Scientific, Singapore, 1994
Km/h 80 60 40 20
0mph
28m24m
20m
16m
12m
8m
4m
Hitting a big tree or column 80 km/h is the same speed reached at ground level by a car driving off the roof of a 6 storey building
2030 104050

Nilsson’s Power model relationship between speed and casualty risk
50%

Validation – Australia
VictoriaSpeed limits were increased on a number ofVictorian regional highways in 1987 from 100km/h to 110 km/h. This resulted in a 20 per centannual increase in casualty crashes on thoseroads.
Two years later, the speed limits were returnedto 100 km/h, leading to a 20 per cent annualreduction in casualty crashes.Source: Australian Transport Council, National Road Safety Strategy 2011-2020
Validation – Australia
VictoriaSpeed limits were increased on a number ofVictorian regional highways in 1987 from 100km/h to 110 km/h. This resulted in a 20 per centannual increase in casualty crashes on thoseroads.
Two years later, the speed limits were returnedto 100 km/h, leading to a 20 per cent annualreduction in casualty crashes.
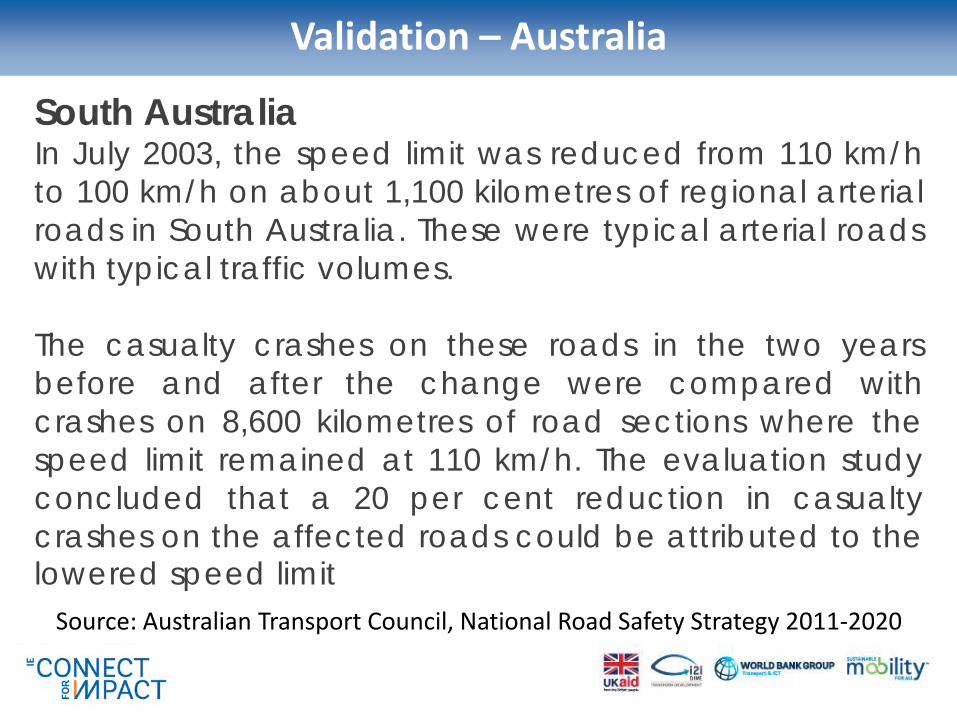
South AustraliaIn July 2003, the speed limit was reduced from 110 km/hto 100 km/h on about 1,100 kilometres of regional arterialroads in South Australia. These were typical arterial roadswith typical traffic volumes.
The casualty crashes on these roads in the two yearsbefore and after the change were compared withcrashes on 8,600 kilometres of road sections where thespeed limit remained at 110 km/h. The evaluation studyconcluded that a 20 per cent reduction in casualtycrashes on the affected roads could be attributed to thelowered speed limit
Source: Australian Transport Council, National Road Safety Strategy 2011-2020

Validation – Australia
VictoriaSpeed limits were increased on a number ofVictorian regional highways in 1987 from 100km/h to 110 km/h. This resulted in a 20 per centannual increase in casualty crashes on thoseroads.
Two years later, the speed limits were returnedto 100 km/h, leading to a 20 per cent annualreduction in casualty crashes.
South AustraliaIn July 2003, the speed limit was reduced from 110 km/hto 100 km/h on about 1,100 kilometres of regional arterialroads in South Australia. These were typical arterial roadswith typical traffic volumes.
The casualty crashes on these roads in the two yearsbefore and after the change were compared withcrashes on 8,600 kilometres of road sections where thespeed limit remained at 110 km/h. The evaluation studyconcluded that a 20 per cent reduction in casualtycrashes on the affected roads could be attributed to thelowered speed limit
Source: Australian Transport Council, National Road Safety Strategy 2011-2020
New South WalesIn early 2000, the speed limit on a 40 kilometre length of theGreat Western Highway between Bathurst and Lithgow wasreduced from 110 km/h to 100 km/h. This part of the GreatWestern Highway is a typical undivided regional highway andprovides an important freight function though central westNSW. The road passes through undulating countryside withadjacent farms, forests and bushland. There was substantialcommunity concern raised at the time; however, it wasdemonstrated that increases to travel time were minimal andthat the lower speed limit would create a safer travelenvironment for all road users. A comparison based on beforeand after the speed limit was lowered shows there has been a26 per cent reduction in casualty crashes.

31
Questions?