how you can use fibonacci - marscapitalpartners.com · how you can use fibonacci to improve your...
TRANSCRIPT

FibonacciHow You Can Use
Fibonaccito Improve Your Trading

How You Can Use Fibonacci to Improve Your TradingBy Wayne Gorman, Elliott Wave International
Chapter 1 - The Golden Ratio and the Golden Spiral A refresher on Fibonacci numbers
Chapter 2 - Fibonacci Ratios / Multiples and the Golden SectionHow the Golden Ratio is connected to the Wave Principle and how it figures in multiples and the Golden Section
Chapter 3 - Amplitude RelationshipsDetails about how to use Fibonacci ratios and multiples in forecasting and a look at amplitude relationships, or price relationships in terms of retracements made by corrective waves
About the Author Wayne Gorman has more than 25 years of experience in trading, forecast-ing and portfolio management. He began his career at Citibank, managing money market and derivative portfolios, and was later recruited for forex trading and various treasury management roles in London and New York. Wayne has been using the Wave Principle since 1986. He’s been with Elliott Wave International since 2002 performing Elliott Wave analysis, researching socionomics and teaching EWI courses as Senior Tutorial Instructor.
2
This free report was created from Wayne Gorman’s 90-page eBook How You Can Identify Turning Points Using Fibonacci. For a limited time, you can purchase the entire eBook and save over 30%. Go to: www.elliottwave.com/wave/FiboSpecial.To return to Club EWI for more free resources, go to: www.elliottwave.com/clublibrary.© 2012 Elliott Wave International — www.elliottwave.com

Chapter 1: The Golden Ratio and the Golden SpiralFibonacci Numbers and the Golden Ratio
Let’s start with a refresher on Fibonacci numbers. If we start at 0 and then go to the next whole integer num-ber, which is 1, and add 0 to 1, that gives us the second 1. If we then take that number 1 and add it again to the previous number, which is of course 1, we have 1 plus 1 equals 2. If we add 2 to its previous number of 1, then 1 plus 2 gives us 3, and so on. 2 plus 3 gives us 5, and we can do this all the way to infinity. This series of numbers, and the way we arrive at these numbers, is called the Fibonacci sequence. We refer to a series of numbers derived this way as Fibonacci numbers. We can go back to the beginning and divide one number by its adjacent number – so 1÷1 is 1.0, 1÷2 is .5, 2÷3 is .667, and so on. If we keep doing that all the way to infinity, that ratio approaches the number .618. This is called the Golden Ratio, represented by the Greek letter phi (pronounced “fie”). It is an irrational number, which means that it cannot be represented by a fraction of whole integers. The inverse of .618 is 1.618. So, in other words, if we carry the series forward and take the inverse of each of these numbers, that ratio also ap-proaches 1.618. The Golden Ratio, .618, is the only number that will also be equal to its inverse when added to 1. So, in other words, 1 plus .618 is 1.618, and the inverse of .618 is also 1.618.
3
This free report was created from Wayne Gorman’s 90-page eBook How You Can Identify Turning Points Using Fibonacci. For a limited time, you can purchase the entire eBook and save over 30%. Go to: www.elliottwave.com/wave/FiboSpecial.To return to Club EWI for more free resources, go to: www.elliottwave.com/clublibrary.© 2012 Elliott Wave International — www.elliottwave.com

This is a diagram of the Golden Spiral. The Golden Spiral is a type of logarithmic spiral that is made up of a number of Fibonacci relationships, or more specifically, a number of Golden Ratios. For example, if we take a specific arc and divide it by its diameter, that will also give us the Golden Ratio 1.618. We can take, for example, arc WY and divide it by its diameter of WY. That produces the multiple 1.618. Certain arcs are also related by the ratio of 1.618. If we take the arc XY and divide that by arc WX, we get 1.618. If we take radius 1 (r1), compare it with the next radius of an arc that’s at a 90° angle with r1, which is r2, and divide r2 by r1, we also get 1.618.
Chapter 1 — The Golden Ratio and the Golden Spiral
4
This free report was created from Wayne Gorman’s 90-page eBook How You Can Identify Turning Points Using Fibonacci. For a limited time, you can purchase the entire eBook and save over 30%. Go to: www.elliottwave.com/wave/FiboSpecial.To return to Club EWI for more free resources, go to: www.elliottwave.com/clublibrary.© 2012 Elliott Wave International — www.elliottwave.com

Fibonacci-Based Behavior in Financial Markets
We can visualize that the stock market or finan-cial markets are actually spiraling outward in a sense. This is a diagram of the stock market whereby the top of each successive wave of higher degree (in terms of the Wave Principle) becomes the touch point of an exponential ex-pansion or logarithmic spiral. We can actually visualize the market in this sense, and we will see later on, in terms of Fibonacci ratios and multiples, how this unfolds.
This is a diagram of the Elliott wave pattern. It is a typical diagram showing us the higher degree in Roman numerals with wave I up (mo-tive) and wave II down (corrective). One of the connections to Fibonacci ratios and numbers is that with Elliott wave, if we look at how many waves there are within each wave, we end up with Fibonacci numbers. If we count the motive waves by degree, we get 1, 5, 21 and 89 – 1 wave up overall in wave I; 5 waves for waves 1 through 5; 21 smaller waves within waves 1 through 5, labeled as (1), (2), (3), (4), and (5) and (A), (B), (C); and 89 still smaller waves if you count the five waves up and three waves down within wave (1) and (2), etc. If we look at the corrective waves and the waves within those waves, we get 1, 3, 13 and so on – 1 wave down as wave II, 3 waves as A, B and C; 13 waves as waves (1) through wave (5) and (A) through (C) within waves A through C, and so on.
Chapter 1 — The Golden Ratio and the Golden Spiral
5
This free report was created from Wayne Gorman’s 90-page eBook How You Can Identify Turning Points Using Fibonacci. For a limited time, you can purchase the entire eBook and save over 30%. Go to: www.elliottwave.com/wave/FiboSpecial.To return to Club EWI for more free resources, go to: www.elliottwave.com/clublibrary.© 2012 Elliott Wave International — www.elliottwave.com

As a matter of fact, if we look at the different types of waves within Elliott wave in this schematic drawing, we again see that they comprise these Fibonacci numbers. We have two modes – motive and corrective. Cardinal means waves that we label with numbers; consonant means waves that we label with letters. There are three groups, five orders, thirteen families, and thirteen simple patterns; these are all Fibonacci numbers.
Chapter 1 — The Golden Ratio and the Golden Spiral
6
This free report was created from Wayne Gorman’s 90-page eBook How You Can Identify Turning Points Using Fibonacci. For a limited time, you can purchase the entire eBook and save over 30%. Go to: www.elliottwave.com/wave/FiboSpecial.To return to Club EWI for more free resources, go to: www.elliottwave.com/clublibrary.© 2012 Elliott Wave International — www.elliottwave.com

Chapter 2: Fibonacci Ratios / Multiples and the Golden SectionFibonacci Ratios
Now, bear with me as I lay down some more necessary groundwork before we start looking at price charts in Chapter 3. I want to come back to this diagram of Fibonacci ratios again to point out another interesting Fibonacci relationship. Look at the series at the top. Instead of dividing adjacent numbers (1 by 2, 2 by 3, and 3 by 5 to infinity), if we divide alternate numbers (1÷3, 2÷5, and 5÷13 to infinity), we will get the ratio of .382. 1 minus .618 is also .382. The inverse of .382 is 2.618. If we look at the second alternate – meaning, if we divide 1 by 5 and 2 by 8, etc. – we will get .236 if we carry that to infinity. The inverse of .236 is 4.236. These are all different Fibonacci ratios. I also want to point out two important numbers. We are going to use the number .5 – or 50% — a lot, since we will see it demonstrated in patterns in financial markets. Remember .5. It is not the Golden Ratio, but it is related to Fibonacci numbers. Another number we want to keep in mind is .786, which represents the square root of .618. These are all numbers that we will use to analyze wave patterns in various markets.
7
This free report was created from Wayne Gorman’s 90-page eBook How You Can Identify Turning Points Using Fibonacci. For a limited time, you can purchase the entire eBook and save over 30%. Go to: www.elliottwave.com/wave/FiboSpecial.To return to Club EWI for more free resources, go to: www.elliottwave.com/clublibrary.© 2012 Elliott Wave International — www.elliottwave.com

Fibonacci Multiples
This table shows the ratios using alternate numbers, second alternate, third alternate and so on. These are all summarized in the table with the ratios and their inverses as they approach perfect Fibonacci ratios. In the row on the bottom, we see .618, .382 and .236. Along the column all the way to the right, we see the inverses of these ratios: 1.618, 2.618 and so on.
To make it a little easier for you to keep in mind some of the important ratios, I put together this table. Again, looking at the Fibonacci sequence here, if we divide adjacent numbers by one another and carry that to infin-ity, that gives us .618. The inverse is 1.618, and that can be expressed as phi raised to the power of 1. The next alternate’s ratio is .382. Its inverse is 2.618, which is the same as 1.618 squared. You will see in certain charts, especially if you take a look at the book Beautiful Pictures by Bob Prechter, examples of some of these higher multiples — phi or the inverse of phi, 1.618 raised to a power. Of course, we will be dealing a lot with some of these numbers, such as .618, .382, 1.618 and 2.618.
Chapter 2 — Fibonacci Ratios / Multiples and the Golden Section
8
This free report was created from Wayne Gorman’s 90-page eBook How You Can Identify Turning Points Using Fibonacci. For a limited time, you can purchase the entire eBook and save over 30%. Go to: www.elliottwave.com/wave/FiboSpecial.To return to Club EWI for more free resources, go to: www.elliottwave.com/clublibrary.© 2012 Elliott Wave International — www.elliottwave.com

The Golden Section
Before we actually start looking at some markets, I want to show you a diagram of the Golden Section and explain how it shows up in the pattern behavior of price movements. The way to think of the Golden Section is that if we take any length and divide it in such a way that the smaller portion is equal to .382 of the whole and the larger portion is equal to .618 of the whole, that results in the Golden Section. So, in other words, A over B is .618 and B over the entire length of C is also .618. Or, put another way, if the ratio of the smaller length to the larger length is equal to the ratio of the larger length to the whole length, that ratio will always be .618.
Chapter 2 — Fibonacci Ratios / Multiples and the Golden Section
9
This free report was created from Wayne Gorman’s 90-page eBook How You Can Identify Turning Points Using Fibonacci. For a limited time, you can purchase the entire eBook and save over 30%. Go to: www.elliottwave.com/wave/FiboSpecial.To return to Club EWI for more free resources, go to: www.elliottwave.com/clublibrary.© 2012 Elliott Wave International — www.elliottwave.com

Chapter 3: Amplitude RelationshipsNow, let’s look at how to use Fibonacci ratios and multiples in forecasting, We see Fibonacci relationships both in time and amplitude. First, we are going to discuss amplitude relationships, or price relationships in terms of retracements made by corrective waves and expansions made by impulse waves. There are retracements and multiples.
Retracements – Corrective Waves
If we look on the left side of this chart, we see a diagram of wave 1 followed by wave 2. It is common for second waves to retrace .618 of wave 1 – thereby making a deep retracement. We will also be looking for .786. We might often see .5, 50%, but .618 is common. On the right side, fourth waves will commonly retrace a smaller percentage or .382 of wave 3. We might also see something like .236.
10
This free report was created from Wayne Gorman’s 90-page eBook How You Can Identify Turning Points Using Fibonacci. For a limited time, you can purchase the entire eBook and save over 30%. Go to: www.elliottwave.com/wave/FiboSpecial.To return to Club EWI for more free resources, go to: www.elliottwave.com/clublibrary.© 2012 Elliott Wave International — www.elliottwave.com

Now, finally, we can turn to a price chart, in this case a chart of the S&P 500 Stock Index from August 2004 to April 2005. I have put the wave count on the chart. We have waves 1, 2, 3, 4 and 5. Wave 2 is an expanded flat. Wave 4 is a zigzag. (I’m assuming you have done enough Elliott wave analysis to know what those phrases mean.) Let’s look at the retracements that waves 2 and 4 make.
We see that wave 2 makes a deep retracement. It comes close to .618. Look at this Fibonacci table that I put up; notice that I put .382, .5, .618, and .786. .618 is 1087.75, and the S&P low is 1090.19.
Chapter 3 — Amplitude Relationships
11
This free report was created from Wayne Gorman’s 90-page eBook How You Can Identify Turning Points Using Fibonacci. For a limited time, you can purchase the entire eBook and save over 30%. Go to: www.elliottwave.com/wave/FiboSpecial.To return to Club EWI for more free resources, go to: www.elliottwave.com/clublibrary.© 2012 Elliott Wave International — www.elliottwave.com

We see that wave 4 makes a shallow retracement of wave 3. It goes just beyond the .382 retracement. .382 is 1169.1, and wave 4 actually bottoms at 1163.75. In a nutshell, this is what we mean when we say that Elliott waves often correct in terms of Fibonacci ratios.
This is a daily bar chart of the Shanghai Composite Stock Index. This chart to displays a number of Fibonacci relation-ships, and in some cases, exact Fibonacci relationships. I have already put the wave count on. The high was on October 16, 2007, and this chart goes up to February 28, 2008. We have wave 1 in red and then an ex-panded flat for 2, followed by 3, 4 and 5. There is an A-B-C flat correction for wave (2) in blue. Then we go another five waves down for wave 1 in red at lower degree.
Chapter 3 — Amplitude Relationships
12
This free report was created from Wayne Gorman’s 90-page eBook How You Can Identify Turning Points Using Fibonacci. For a limited time, you can purchase the entire eBook and save over 30%. Go to: www.elliottwave.com/wave/FiboSpecial.To return to Club EWI for more free resources, go to: www.elliottwave.com/clublibrary.© 2012 Elliott Wave International — www.elliottwave.com

In terms of retracements, we see in the Shanghai Composite Index that wave 2, an expanded flat, retraces .786 of wave 1 in red. The .786 retracement comes in at 6006.3. The actual end of wave 2 is 6005, so it is about one point shy of a .786 retracement.
Now, just for your information, the Intermediate wave (2) in blue goes slightly past the 50% retracement; it does not give us quite an exact Fibonacci retrace-ment. We are not always going to have exact numbers. It actu-ally comes in between the 50% and the .618.
Chapter 3 — Amplitude Relationships
13
This free report was created from Wayne Gorman’s 90-page eBook How You Can Identify Turning Points Using Fibonacci. For a limited time, you can purchase the entire eBook and save over 30%. Go to: www.elliottwave.com/wave/FiboSpecial.To return to Club EWI for more free resources, go to: www.elliottwave.com/clublibrary.© 2012 Elliott Wave International — www.elliottwave.com
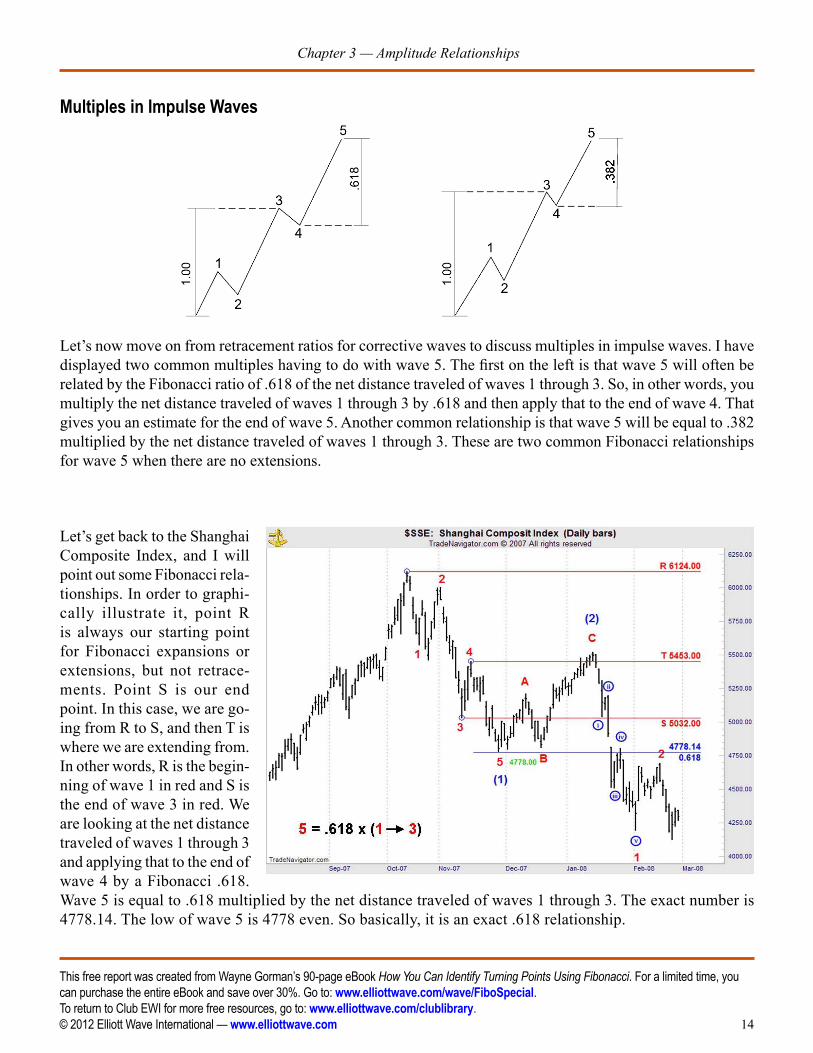
Multiples in Impulse Waves
Let’s now move on from retracement ratios for corrective waves to discuss multiples in impulse waves. I have displayed two common multiples having to do with wave 5. The first on the left is that wave 5 will often be related by the Fibonacci ratio of .618 of the net distance traveled of waves 1 through 3. So, in other words, you multiply the net distance traveled of waves 1 through 3 by .618 and then apply that to the end of wave 4. That gives you an estimate for the end of wave 5. Another common relationship is that wave 5 will be equal to .382 multiplied by the net distance traveled of waves 1 through 3. These are two common Fibonacci relationships for wave 5 when there are no extensions.
Let’s get back to the Shanghai Composite Index, and I will point out some Fibonacci rela-tionships. In order to graphi-cally illustrate it, point R is always our starting point for Fibonacci expansions or extensions, but not retrace-ments. Point S is our end point. In this case, we are go-ing from R to S, and then T is where we are extending from. In other words, R is the begin-ning of wave 1 in red and S is the end of wave 3 in red. We are looking at the net distance traveled of waves 1 through 3 and applying that to the end of wave 4 by a Fibonacci .618. Wave 5 is equal to .618 multiplied by the net distance traveled of waves 1 through 3. The exact number is 4778.14. The low of wave 5 is 4778 even. So basically, it is an exact .618 relationship.
Chapter 3 — Amplitude Relationships
14
This free report was created from Wayne Gorman’s 90-page eBook How You Can Identify Turning Points Using Fibonacci. For a limited time, you can purchase the entire eBook and save over 30%. Go to: www.elliottwave.com/wave/FiboSpecial.To return to Club EWI for more free resources, go to: www.elliottwave.com/clublibrary.© 2012 Elliott Wave International — www.elliottwave.com

Now, when we go to the next lower degree, we are looking at the internal subdivisions of wave 5 in red. The internal 0 is equal to .621 multiplied by the net distance traveled of waves 6 through 8. In other words, the actual exact .618 comes out at 4779.77. Wave 0 ends at 4778, which is in green. So, the green number is the actual. The blue number, 4779.77 is where the exact .618 would have come in. We are saying, in other words, that if this is the exact figure and here is where the actual is, then it is .621, which is close to .618.
Chapter 3 — Amplitude Relationships
15
This free report was created from Wayne Gorman’s 90-page eBook How You Can Identify Turning Points Using Fibonacci. For a limited time, you can purchase the entire eBook and save over 30%. Go to: www.elliottwave.com/wave/FiboSpecial.To return to Club EWI for more free resources, go to: www.elliottwave.com/clublibrary.© 2012 Elliott Wave International — www.elliottwave.com

Learn More About Using Fibonacci in the Markets You Trade
AND Save Over 30%
This free report was created from Wayne Gorman’s 90-page eBook, How You Can Identify Turning Points Using Fibonacci.
For a limited time, you can purchase the entire eBook and save over 30%.
You’ll learn the background of Fibonacci mathematics and see real-time market examples that show how you can apply Fibonacci to the markets you trade.
You’ll learn:
The X most important Fibonacci relationships to watch for
How to X establish Fibonacci “clusters” and leverage them in your trading decisions
How to formulate your own low-risk X entry strategy
Techniques to help you set and properly manage stops X
How to project moves so you can X evaluate risk-reward and exit strategies
How to put it all together and generate your own high-confidence Xtrading strategy
And MORE! X
Learn more about the full 90-page eBook and your special discount now.
Go to: www.elliottwave.com/wave/FiboSpecial
16
This free report was created from Wayne Gorman’s 90-page eBook How You Can Identify Turning Points Using Fibonacci. For a limited time, you can purchase the entire eBook and save over 30%. Go to: www.elliottwave.com/wave/FiboSpecial.To return to Club EWI for more free resources, go to: www.elliottwave.com/clublibrary.© 2012 Elliott Wave International — www.elliottwave.com