hp operations smart plug-in for ibm websphere application server websphere application server the hp...
TRANSCRIPT
HP Operations Smart Plug-in for IBM WebSphere Application Server
for HP Operations Manager for Windows®
Software Version: 7.04
Installation and Configuration Guide
Document Release Date: January 2011Software Release Date: January 2011

Legal Notices
Warranty
The only warranties for HP products and services are set forth in the express warranty statements accompanying such products and services. Nothing herein should be construed as constituting an additional warranty. HP shall not be liable for technical or editorial errors or omissions contained herein.
The information contained herein is subject to change without notice.
Restricted Rights Legend
Confidential computer software. Valid license from HP required for possession, use or copying. Consistent with FAR 12.211 and 12.212, Commercial Computer Software, Computer Software Documentation, and Technical Data for Commercial Items are licensed to the U.S. Government under vendor's standard commercial license.
Copyright Notice
© Copyright 2003-2011 Hewlett-Packard Development Company, L.P.
Trademark Notices
UNIX® is a registered trademark of The Open Group.
Windows® and Microsoft® are U.S. registered trademarks of Microsoft Corporation.
Oracle and Java are registered trademarks of Oracle and/or its affiliates.
2
Documentation Updates
The title page of this document contains the following identifying information:
• Software Version number, which indicates the software version.
• Document Release Date, which changes each time the document is updated.
• Software Release Date, which indicates the release date of this version of the software.
To check for recent updates or to verify that you are using the most recent edition of a document, go to:
http://h20230.www2.hp.com/selfsolve/manuals
This site requires that you register for an HP Passport and sign in. To register for an HP Passport ID, go to:
http://h20229.www2.hp.com/passport-registration.html
Or click the New users - please register link on the HP Passport login page.
You will also receive updated or new editions if you subscribe to the appropriate product support service. Contact your HP sales representative for details.
3
Support
Visit the HP Software Support Online web site at:
www.hp.com/go/hpsoftwaresupport
This web site provides contact information and details about the products, services, and support that HP Software offers.
HP Software online support provides customer self-solve capabilities. It provides a fast and efficient way to access interactive technical support tools needed to manage your business. As a valued support customer, you can benefit by using the support web site to:
• Search for knowledge documents of interest
• Submit and track support cases and enhancement requests
• Download software patches
• Manage support contracts
• Look up HP support contacts
• Review information about available services
• Enter into discussions with other software customers
• Research and register for software training
Most of the support areas require that you register as an HP Passport user and sign in. Many also require a support contract. To register for an HP Passport user ID, go to:
http://h20229.www2.hp.com/passport-registration.html
To find more information about access levels, go to:
http://h20230.www2.hp.com/new_access_levels.jsp
4
Contents
1 HP Operations Smart Plug-in for IBM WebSphere Application Server . . . . . . . . . . . . . . . . . . . . . . . 9
Components of WebSphere SPI . . . . . . . . . . . . . . . . . . . . . . . . . . . . . . . . . . . . . . . . . . . . . . . . . . . . . . . . . . . . 9Policies. . . . . . . . . . . . . . . . . . . . . . . . . . . . . . . . . . . . . . . . . . . . . . . . . . . . . . . . . . . . . . . . . . . . . . . . . . . . 10Tools. . . . . . . . . . . . . . . . . . . . . . . . . . . . . . . . . . . . . . . . . . . . . . . . . . . . . . . . . . . . . . . . . . . . . . . . . . . . . . 10Reports . . . . . . . . . . . . . . . . . . . . . . . . . . . . . . . . . . . . . . . . . . . . . . . . . . . . . . . . . . . . . . . . . . . . . . . . . . . 10Graphs . . . . . . . . . . . . . . . . . . . . . . . . . . . . . . . . . . . . . . . . . . . . . . . . . . . . . . . . . . . . . . . . . . . . . . . . . . . . 10
Functions of WebSphere SPI . . . . . . . . . . . . . . . . . . . . . . . . . . . . . . . . . . . . . . . . . . . . . . . . . . . . . . . . . . . . 11Collecting and Interpreting Server Performance and Availability Information . . . . . . . . . . . . . . . . . . 11Displaying Information . . . . . . . . . . . . . . . . . . . . . . . . . . . . . . . . . . . . . . . . . . . . . . . . . . . . . . . . . . . . . . 11Generating Reports Using HP Reporter . . . . . . . . . . . . . . . . . . . . . . . . . . . . . . . . . . . . . . . . . . . . . . . . . 12Graphing Data using HP Performance Manager . . . . . . . . . . . . . . . . . . . . . . . . . . . . . . . . . . . . . . . . . . 12Customizing Policies and Metrics . . . . . . . . . . . . . . . . . . . . . . . . . . . . . . . . . . . . . . . . . . . . . . . . . . . . . . 12
2 Installing WebSphere SPI . . . . . . . . . . . . . . . . . . . . . . . . . . . . . . . . . . . . . . . . . . . . . . . . . . . . . . . . . . . . . . 13
Installation Packages. . . . . . . . . . . . . . . . . . . . . . . . . . . . . . . . . . . . . . . . . . . . . . . . . . . . . . . . . . . . . . . . . . . 14SPI Package. . . . . . . . . . . . . . . . . . . . . . . . . . . . . . . . . . . . . . . . . . . . . . . . . . . . . . . . . . . . . . . . . . . . . . . . 14Reporting Package . . . . . . . . . . . . . . . . . . . . . . . . . . . . . . . . . . . . . . . . . . . . . . . . . . . . . . . . . . . . . . . . . . 14Graphing Package. . . . . . . . . . . . . . . . . . . . . . . . . . . . . . . . . . . . . . . . . . . . . . . . . . . . . . . . . . . . . . . . . . . 14
Installation Environments . . . . . . . . . . . . . . . . . . . . . . . . . . . . . . . . . . . . . . . . . . . . . . . . . . . . . . . . . . . . . . 15Standard Installation of SPI Components on the HPOM Server . . . . . . . . . . . . . . . . . . . . . . . . . . . . . 15Standalone HP Performance Manager . . . . . . . . . . . . . . . . . . . . . . . . . . . . . . . . . . . . . . . . . . . . . . . . . . 15Standard Installation in HPOM Cluster Environment . . . . . . . . . . . . . . . . . . . . . . . . . . . . . . . . . . . . . 15
Installation Prerequisites . . . . . . . . . . . . . . . . . . . . . . . . . . . . . . . . . . . . . . . . . . . . . . . . . . . . . . . . . . . . . . . 15Hardware Requirements . . . . . . . . . . . . . . . . . . . . . . . . . . . . . . . . . . . . . . . . . . . . . . . . . . . . . . . . . . . . . 15Software Requirements . . . . . . . . . . . . . . . . . . . . . . . . . . . . . . . . . . . . . . . . . . . . . . . . . . . . . . . . . . . . . . 15
Installing WebSphere SPI . . . . . . . . . . . . . . . . . . . . . . . . . . . . . . . . . . . . . . . . . . . . . . . . . . . . . . . . . . . . . . . 16Installing WebSphere SPI on a Local Management Server . . . . . . . . . . . . . . . . . . . . . . . . . . . . . . . . . . 16Installing WebSphere SPI in Cluster Environment . . . . . . . . . . . . . . . . . . . . . . . . . . . . . . . . . . . . . . . . 17
Select and Install the WebSphere SPI on the First Cluster-Aware Management Server . . . . . . . . 17Install WebSphere SPI on the Next Cluster-Aware Management Server . . . . . . . . . . . . . . . . . . . . 17
Verifying Installation. . . . . . . . . . . . . . . . . . . . . . . . . . . . . . . . . . . . . . . . . . . . . . . . . . . . . . . . . . . . . . . . . . . 18Migration of WebSphere SPI from Previous Versions . . . . . . . . . . . . . . . . . . . . . . . . . . . . . . . . . . . . . . . . . 18
3 Configuring WebSphere SPI . . . . . . . . . . . . . . . . . . . . . . . . . . . . . . . . . . . . . . . . . . . . . . . . . . . . . . . . . . . 19
Prerequisites . . . . . . . . . . . . . . . . . . . . . . . . . . . . . . . . . . . . . . . . . . . . . . . . . . . . . . . . . . . . . . . . . . . . . . . . . 19Adding Managed Nodes . . . . . . . . . . . . . . . . . . . . . . . . . . . . . . . . . . . . . . . . . . . . . . . . . . . . . . . . . . . . . . 19Verify Application Server Status . . . . . . . . . . . . . . . . . . . . . . . . . . . . . . . . . . . . . . . . . . . . . . . . . . . . . . . 19Collect WebSphere Login Information. . . . . . . . . . . . . . . . . . . . . . . . . . . . . . . . . . . . . . . . . . . . . . . . . . . 20Connect using JSR 160. . . . . . . . . . . . . . . . . . . . . . . . . . . . . . . . . . . . . . . . . . . . . . . . . . . . . . . . . . . . . . . 20Update WebSphere’s SDK . . . . . . . . . . . . . . . . . . . . . . . . . . . . . . . . . . . . . . . . . . . . . . . . . . . . . . . . . . . . 21
5
Configuring WebSphere SPI . . . . . . . . . . . . . . . . . . . . . . . . . . . . . . . . . . . . . . . . . . . . . . . . . . . . . . . . . . . . . 21Deploying Instrumentation . . . . . . . . . . . . . . . . . . . . . . . . . . . . . . . . . . . . . . . . . . . . . . . . . . . . . . . . . . . 21Starting Discover Tool . . . . . . . . . . . . . . . . . . . . . . . . . . . . . . . . . . . . . . . . . . . . . . . . . . . . . . . . . . . . . . . 21Verifying Discovery Process . . . . . . . . . . . . . . . . . . . . . . . . . . . . . . . . . . . . . . . . . . . . . . . . . . . . . . . . . . . 24Deploying Policies . . . . . . . . . . . . . . . . . . . . . . . . . . . . . . . . . . . . . . . . . . . . . . . . . . . . . . . . . . . . . . . . . . . 24Starting Configure Tool . . . . . . . . . . . . . . . . . . . . . . . . . . . . . . . . . . . . . . . . . . . . . . . . . . . . . . . . . . . . . . 24
Additional WebSphere SPI Configuration . . . . . . . . . . . . . . . . . . . . . . . . . . . . . . . . . . . . . . . . . . . . . . . . . . 26Deploying a Different Policy Group . . . . . . . . . . . . . . . . . . . . . . . . . . . . . . . . . . . . . . . . . . . . . . . . . . . . . . . 26WebSphere SPI in High Availability Environments . . . . . . . . . . . . . . . . . . . . . . . . . . . . . . . . . . . . . . . . . . 27
Prerequisites . . . . . . . . . . . . . . . . . . . . . . . . . . . . . . . . . . . . . . . . . . . . . . . . . . . . . . . . . . . . . . . . . . . . . . . 27Configuring WebSphere SPI for High Availability Environments. . . . . . . . . . . . . . . . . . . . . . . . . . . . . 27
Create WebSphere SPI monitoring configuration file . . . . . . . . . . . . . . . . . . . . . . . . . . . . . . . . . . . . 27Create the clustered application configuration file . . . . . . . . . . . . . . . . . . . . . . . . . . . . . . . . . . . . . . 28Configure WebSphere SPI for HTTPS or DCE Agent (Based on Requirement) . . . . . . . . . . . . . . . 29
WebSphere SPI Discovery in Cluster Environment. . . . . . . . . . . . . . . . . . . . . . . . . . . . . . . . . . . . . . . . . . . 30Deployment Manager . . . . . . . . . . . . . . . . . . . . . . . . . . . . . . . . . . . . . . . . . . . . . . . . . . . . . . . . . . . . . . . . 30WebSphere SPI Discovery in Network Deployer Scenario . . . . . . . . . . . . . . . . . . . . . . . . . . . . . . . . . . . 31
Use Cases . . . . . . . . . . . . . . . . . . . . . . . . . . . . . . . . . . . . . . . . . . . . . . . . . . . . . . . . . . . . . . . . . . . . . . . 31Limitations in a Network Deployer Scenario . . . . . . . . . . . . . . . . . . . . . . . . . . . . . . . . . . . . . . . . . . . . . 32
Discovery on Hypervisor Edition. . . . . . . . . . . . . . . . . . . . . . . . . . . . . . . . . . . . . . . . . . . . . . . . . . . . . . . . . . 32Discovery of WebSphere Portal Servers . . . . . . . . . . . . . . . . . . . . . . . . . . . . . . . . . . . . . . . . . . . . . . . . . . . . 33Integrating WebSphere SPI with HP Performance Agent. . . . . . . . . . . . . . . . . . . . . . . . . . . . . . . . . . . . . . 33
4 Using Tools . . . . . . . . . . . . . . . . . . . . . . . . . . . . . . . . . . . . . . . . . . . . . . . . . . . . . . . . . . . . . . . . . . . . . . . . . . 35
Overview. . . . . . . . . . . . . . . . . . . . . . . . . . . . . . . . . . . . . . . . . . . . . . . . . . . . . . . . . . . . . . . . . . . . . . . . . . . . . 35SPI Admin Tools Group . . . . . . . . . . . . . . . . . . . . . . . . . . . . . . . . . . . . . . . . . . . . . . . . . . . . . . . . . . . . . . 35WebSphere Admin Tools Group . . . . . . . . . . . . . . . . . . . . . . . . . . . . . . . . . . . . . . . . . . . . . . . . . . . . . . . . 36Metric Reports. . . . . . . . . . . . . . . . . . . . . . . . . . . . . . . . . . . . . . . . . . . . . . . . . . . . . . . . . . . . . . . . . . . . . . 36JMX Metric Builder Tools . . . . . . . . . . . . . . . . . . . . . . . . . . . . . . . . . . . . . . . . . . . . . . . . . . . . . . . . . . . . 36
Starting Tools . . . . . . . . . . . . . . . . . . . . . . . . . . . . . . . . . . . . . . . . . . . . . . . . . . . . . . . . . . . . . . . . . . . . . . . . . 37Starting Discover or Configure WBSSPI tool . . . . . . . . . . . . . . . . . . . . . . . . . . . . . . . . . . . . . . . . . . . . . 37Starting All Tools . . . . . . . . . . . . . . . . . . . . . . . . . . . . . . . . . . . . . . . . . . . . . . . . . . . . . . . . . . . . . . . . . . . 37
5 Customizing WebSphere SPI Policies . . . . . . . . . . . . . . . . . . . . . . . . . . . . . . . . . . . . . . . . . . . . . . . . . . . 39WebSphere SPI Policy Groups . . . . . . . . . . . . . . . . . . . . . . . . . . . . . . . . . . . . . . . . . . . . . . . . . . . . . . . . . 39WebSphere SPI Policy Types . . . . . . . . . . . . . . . . . . . . . . . . . . . . . . . . . . . . . . . . . . . . . . . . . . . . . . . . . . 40
Basic Policy Customizations . . . . . . . . . . . . . . . . . . . . . . . . . . . . . . . . . . . . . . . . . . . . . . . . . . . . . . . . . . . . . 41Modifying Metric Policies . . . . . . . . . . . . . . . . . . . . . . . . . . . . . . . . . . . . . . . . . . . . . . . . . . . . . . . . . . . . . 41
Threshold Level and Actions. . . . . . . . . . . . . . . . . . . . . . . . . . . . . . . . . . . . . . . . . . . . . . . . . . . . . . . . 42Message and Severity . . . . . . . . . . . . . . . . . . . . . . . . . . . . . . . . . . . . . . . . . . . . . . . . . . . . . . . . . . . . . 44
Advanced Policy Customizations. . . . . . . . . . . . . . . . . . . . . . . . . . . . . . . . . . . . . . . . . . . . . . . . . . . . . . . . . . 45Creating New Policy Group . . . . . . . . . . . . . . . . . . . . . . . . . . . . . . . . . . . . . . . . . . . . . . . . . . . . . . . . . . . 45WebSphere SPI Collector/Analyzer Command with Parameters. . . . . . . . . . . . . . . . . . . . . . . . . . . . . . 46
Basic Collector Command Parameters . . . . . . . . . . . . . . . . . . . . . . . . . . . . . . . . . . . . . . . . . . . . . . . . 46Using JMX Actions Command Parameters . . . . . . . . . . . . . . . . . . . . . . . . . . . . . . . . . . . . . . . . . . . . 47
Changing Collection Interval for Scheduled Metrics . . . . . . . . . . . . . . . . . . . . . . . . . . . . . . . . . . . . . . . 50Changing Collection Interval for Selected Metrics . . . . . . . . . . . . . . . . . . . . . . . . . . . . . . . . . . . . . . . . . 50
6
Customizing Threshold for Different Servers . . . . . . . . . . . . . . . . . . . . . . . . . . . . . . . . . . . . . . . . . . . . . 51Creating Custom Policies . . . . . . . . . . . . . . . . . . . . . . . . . . . . . . . . . . . . . . . . . . . . . . . . . . . . . . . . . . . . . 52
Restoring Default WebSphere SPI Policies . . . . . . . . . . . . . . . . . . . . . . . . . . . . . . . . . . . . . . . . . . . . . . . . . 53Viewing Text-Based Reports . . . . . . . . . . . . . . . . . . . . . . . . . . . . . . . . . . . . . . . . . . . . . . . . . . . . . . . . . . . . . 53
Automatic Command Reports . . . . . . . . . . . . . . . . . . . . . . . . . . . . . . . . . . . . . . . . . . . . . . . . . . . . . . . . . 53Manually Generated Reports . . . . . . . . . . . . . . . . . . . . . . . . . . . . . . . . . . . . . . . . . . . . . . . . . . . . . . . . . . 54WebSphere SPI Graphs . . . . . . . . . . . . . . . . . . . . . . . . . . . . . . . . . . . . . . . . . . . . . . . . . . . . . . . . . . . . . . 55
Monitoring WebSphere Application Server on Unsupported Platforms. . . . . . . . . . . . . . . . . . . . . . . . . . . 55Monitoring Remote Nodes (Running on Platforms Not Supported by the WebSphere SPI) . . . . . . . . 55Implementing Remote Monitoring. . . . . . . . . . . . . . . . . . . . . . . . . . . . . . . . . . . . . . . . . . . . . . . . . . . . . . 56Configuring Remote System Monitoring . . . . . . . . . . . . . . . . . . . . . . . . . . . . . . . . . . . . . . . . . . . . . . . . . 57
Prerequisite . . . . . . . . . . . . . . . . . . . . . . . . . . . . . . . . . . . . . . . . . . . . . . . . . . . . . . . . . . . . . . . . . . . . . 57Configuring Remote WebSphere System . . . . . . . . . . . . . . . . . . . . . . . . . . . . . . . . . . . . . . . . . . . . . . 57Integrate HP Performance agent (Optional) . . . . . . . . . . . . . . . . . . . . . . . . . . . . . . . . . . . . . . . . . . . 58Deploy Policies to the Local Node . . . . . . . . . . . . . . . . . . . . . . . . . . . . . . . . . . . . . . . . . . . . . . . . . . . . 58
Configuring Remote Monitoring for Logfile (Optional) . . . . . . . . . . . . . . . . . . . . . . . . . . . . . . . . . . . . . 58Configuring Logfile Policy for Remote Logfiles . . . . . . . . . . . . . . . . . . . . . . . . . . . . . . . . . . . . . . . . . 59Limitations in Remote Monitoring . . . . . . . . . . . . . . . . . . . . . . . . . . . . . . . . . . . . . . . . . . . . . . . . . . . 59
6 Integrating WebSphere SPI with HP Reporting and Graphing Solutions . . . . . . . . . . . . . . . . . . . . . 61
Integrating WebSphere SPI with HP Reporter . . . . . . . . . . . . . . . . . . . . . . . . . . . . . . . . . . . . . . . . . . . . . . 62Viewing Reports from the HPOM Management Console . . . . . . . . . . . . . . . . . . . . . . . . . . . . . . . . . . . . 64Removing WebSphere SPI Reporter Package . . . . . . . . . . . . . . . . . . . . . . . . . . . . . . . . . . . . . . . . . . . . . 65
Integrating WebSphere SPI with HP Performance Manager . . . . . . . . . . . . . . . . . . . . . . . . . . . . . . . . . . . 65Viewing Graphs Showing Alarm Conditions. . . . . . . . . . . . . . . . . . . . . . . . . . . . . . . . . . . . . . . . . . . . . . 66Viewing Graphs Showing Past or Current Conditions . . . . . . . . . . . . . . . . . . . . . . . . . . . . . . . . . . . . . . 66Viewing Graphs from HP Performance Manager Console . . . . . . . . . . . . . . . . . . . . . . . . . . . . . . . . . . . 66Removing WebSphere SPI Graphing Package . . . . . . . . . . . . . . . . . . . . . . . . . . . . . . . . . . . . . . . . . . . . 67
7 Troubleshooting . . . . . . . . . . . . . . . . . . . . . . . . . . . . . . . . . . . . . . . . . . . . . . . . . . . . . . . . . . . . . . . . . . . . . . 69
Self-Healing Info Tool . . . . . . . . . . . . . . . . . . . . . . . . . . . . . . . . . . . . . . . . . . . . . . . . . . . . . . . . . . . . . . . . . . 69Log File Monitoring . . . . . . . . . . . . . . . . . . . . . . . . . . . . . . . . . . . . . . . . . . . . . . . . . . . . . . . . . . . . . . . . . . . . 69
Logging . . . . . . . . . . . . . . . . . . . . . . . . . . . . . . . . . . . . . . . . . . . . . . . . . . . . . . . . . . . . . . . . . . . . . . . . . . . 70Managed Nodes . . . . . . . . . . . . . . . . . . . . . . . . . . . . . . . . . . . . . . . . . . . . . . . . . . . . . . . . . . . . . . . . . . 70
Collection . . . . . . . . . . . . . . . . . . . . . . . . . . . . . . . . . . . . . . . . . . . . . . . . . . . . . . . . . . . . . . . . . . . . . . . . . . . . 72Discovery Process. . . . . . . . . . . . . . . . . . . . . . . . . . . . . . . . . . . . . . . . . . . . . . . . . . . . . . . . . . . . . . . . . . . . . . 73
Manually Deploying the Discovery Policies . . . . . . . . . . . . . . . . . . . . . . . . . . . . . . . . . . . . . . . . . . . . . . 74Verifying Node Name . . . . . . . . . . . . . . . . . . . . . . . . . . . . . . . . . . . . . . . . . . . . . . . . . . . . . . . . . . . . . . . . 74
Tools . . . . . . . . . . . . . . . . . . . . . . . . . . . . . . . . . . . . . . . . . . . . . . . . . . . . . . . . . . . . . . . . . . . . . . . . . . . . . . . . 75
8 Removing WebSphere SPI . . . . . . . . . . . . . . . . . . . . . . . . . . . . . . . . . . . . . . . . . . . . . . . . . . . . . . . . . . . . . 77
Using DVD . . . . . . . . . . . . . . . . . . . . . . . . . . . . . . . . . . . . . . . . . . . . . . . . . . . . . . . . . . . . . . . . . . . . . . . . . . . 77Removing WebSphere SPI Components . . . . . . . . . . . . . . . . . . . . . . . . . . . . . . . . . . . . . . . . . . . . . . . . . 77
Remove All the WebSphere SPI Policies from the Managed Nodes . . . . . . . . . . . . . . . . . . . . . . . . . 77Remove WebSphere SPI Node Groups on the Management Server . . . . . . . . . . . . . . . . . . . . . . . . . 77
Removing WebSphere SPI from the Management Server . . . . . . . . . . . . . . . . . . . . . . . . . . . . . . . . . . . 78Using Windows Control Panel - Add or Remove Products. . . . . . . . . . . . . . . . . . . . . . . . . . . . . . . . . . . . . . 78Removing WebSphere SPI in a Cluster Environment . . . . . . . . . . . . . . . . . . . . . . . . . . . . . . . . . . . . . . . . . 79
7
Remove Smart Plug-in Components from Managed Nodes . . . . . . . . . . . . . . . . . . . . . . . . . . . . . . . . . . 79Remove WebSphere SPI from the Cluster-aware Management Servers . . . . . . . . . . . . . . . . . . . . . . . . 79
9 User Defined Metrics . . . . . . . . . . . . . . . . . . . . . . . . . . . . . . . . . . . . . . . . . . . . . . . . . . . . . . . . . . . . . . . . . . 81
Metric Definitions DTD . . . . . . . . . . . . . . . . . . . . . . . . . . . . . . . . . . . . . . . . . . . . . . . . . . . . . . . . . . . . . . . . . 81MetricDefinitions Element. . . . . . . . . . . . . . . . . . . . . . . . . . . . . . . . . . . . . . . . . . . . . . . . . . . . . . . . . . . . 82
Example . . . . . . . . . . . . . . . . . . . . . . . . . . . . . . . . . . . . . . . . . . . . . . . . . . . . . . . . . . . . . . . . . . . . . . . . 82 Metric Element . . . . . . . . . . . . . . . . . . . . . . . . . . . . . . . . . . . . . . . . . . . . . . . . . . . . . . . . . . . . . . . . . . . . 82
Example . . . . . . . . . . . . . . . . . . . . . . . . . . . . . . . . . . . . . . . . . . . . . . . . . . . . . . . . . . . . . . . . . . . . . . . . 83FromVersion and ToVersion Elements . . . . . . . . . . . . . . . . . . . . . . . . . . . . . . . . . . . . . . . . . . . . . . . . . . 83
Example . . . . . . . . . . . . . . . . . . . . . . . . . . . . . . . . . . . . . . . . . . . . . . . . . . . . . . . . . . . . . . . . . . . . . . . . 84Calculation and Formula Elements . . . . . . . . . . . . . . . . . . . . . . . . . . . . . . . . . . . . . . . . . . . . . . . . . . . . . 84
Syntax . . . . . . . . . . . . . . . . . . . . . . . . . . . . . . . . . . . . . . . . . . . . . . . . . . . . . . . . . . . . . . . . . . . . . . . . . 84Functions . . . . . . . . . . . . . . . . . . . . . . . . . . . . . . . . . . . . . . . . . . . . . . . . . . . . . . . . . . . . . . . . . . . . . . . 84Examples . . . . . . . . . . . . . . . . . . . . . . . . . . . . . . . . . . . . . . . . . . . . . . . . . . . . . . . . . . . . . . . . . . . . . . . 85
Sample 1 . . . . . . . . . . . . . . . . . . . . . . . . . . . . . . . . . . . . . . . . . . . . . . . . . . . . . . . . . . . . . . . . . . . . . . . . . . 85Sample 2 . . . . . . . . . . . . . . . . . . . . . . . . . . . . . . . . . . . . . . . . . . . . . . . . . . . . . . . . . . . . . . . . . . . . . . . . . . 85Sample 3: Metric Definitions File . . . . . . . . . . . . . . . . . . . . . . . . . . . . . . . . . . . . . . . . . . . . . . . . . . . . . . 85
Creating User-Defined Metrics . . . . . . . . . . . . . . . . . . . . . . . . . . . . . . . . . . . . . . . . . . . . . . . . . . . . . . . . . . . 86Disable Graphing (if enabled) . . . . . . . . . . . . . . . . . . . . . . . . . . . . . . . . . . . . . . . . . . . . . . . . . . . . . . . . . 86Create a Metric Definitions File . . . . . . . . . . . . . . . . . . . . . . . . . . . . . . . . . . . . . . . . . . . . . . . . . . . . . . . 86Configure Metric Definitions File Name and Location. . . . . . . . . . . . . . . . . . . . . . . . . . . . . . . . . . . . . . 86Create a UDM Policy Group and Policies . . . . . . . . . . . . . . . . . . . . . . . . . . . . . . . . . . . . . . . . . . . . . . . . 87Deploying policy group . . . . . . . . . . . . . . . . . . . . . . . . . . . . . . . . . . . . . . . . . . . . . . . . . . . . . . . . . . . . . . . 88Enabling graphing . . . . . . . . . . . . . . . . . . . . . . . . . . . . . . . . . . . . . . . . . . . . . . . . . . . . . . . . . . . . . . . . . . 88
Glossary . . . . . . . . . . . . . . . . . . . . . . . . . . . . . . . . . . . . . . . . . . . . . . . . . . . . . . . . . . . . . . . . . . . . . . . . . . . . . . . . 89
Index . . . . . . . . . . . . . . . . . . . . . . . . . . . . . . . . . . . . . . . . . . . . . . . . . . . . . . . . . . . . . . . . . . . . . . . . . . . . . . . . . . . 95
8
1 HP Operations Smart Plug-in for IBM WebSphere Application Server
The HP Operations Smart Plug-in for IBM WebSphere Application Server (WebSphere SPI) enables you to manage WebSphere servers from an HP Operations Manager for Windows (HPOM) console. The WebSphere SPI adds monitoring capabilities to HPOM. For more information about HPOM, see the HPOM Console Online Help.
From the HPOM console, you can monitor the availability, use, and performance of WebSphere Application Servers running on HPOM managed nodes. You can integrate the WebSphere SPI with other HP products like HP Reporter and HP Performance Manager to get consolidated reports and graphs, which help you to analyze trends in server usage, availability, and performance.
The HP Operations Smart Plug-in for IBM WebSphere Application Server Online Help provides information about the WebSphere SPI concepts and other topics that help you understand the product.
The WebSphere SPI has several server-related metrics that gather data about the following:
• Server availability
• Server performance
• Memory usage
• Transaction rates
• Servlet executing times, time-outs, and request rates
• JDBC connection status
• Web application processing
Components of WebSphere SPI
The WebSphere SPI has the following four main components:
• Policies
• Tools
• Reports
• Graphs
You can use the tools and policies to configure and receive data in the form of messages, annotations, and metric reports. These messages (available in the message browser), annotations (available through message properties), and metric reports (available through tools) provide information about the conditions present in the servers running on specific managed nodes.
9
The WebSphere SPI configuration tools enable you to configure the management server’s connection to selected server instances on specific managed nodes. After you configure the connection, you can assign policies to the nodes. With HP Operations agent software running on the managed nodes, you can use the WebSphere SPI reporting tools to create metric reports. In addition, you can create graphs that show the WebSphere SPI data (available through message properties).
Policies
The WebSphere SPI consists of policies that monitor the WebSphere Application Server. The policies contain settings that allow incoming data to be measured against predefined rules. These rules create useful information in the form of messages. The messages are coded with different colors to indicate the severity level. You can review these messages for analyzing the problem and provide resolution to them. There are several pre-defined corrective actions for specific events or threshold violations. These corrective actions can be automatically triggered or operator-initiated. When you double-click a message text, corrective actions appear within the Instructions tab and automatically created metric reports appear within the Annotations tab in the Message Properties window. Monitoring comprises of alarms related to critical events of the tool, and logging important performance metrics of the application server. The metrics logged can be used to create graphs.
Tools
In conjunction with HPOM, the WebSphere SPI offers centralized tools that help you monitor and manage systems using WebSphere Application Server (AS). The WebSphere SPI tools enable you to configure the management server’s connection to selected server instances on specific managed nodes. The WebSphere SPI tools include configuration, troubleshooting, and report-generating utilities. For more information about tools, see Chapter 4, Using Tools.
Reports
The SPI package contains the default reporting policies provided by the SPI. Reports are created by the Reporter using the WebSphere SPI data. The reports show consolidated historical data, created as web pages in management-ready presentation format. These reports helps you analyze the performance of the WebSphere Application Server over a period of time. For details on integrating the WebSphere SPI with HP Reporter to get consolidated reports, see Chapter 6, Integrating WebSphere SPI with HP Reporting and Graphing Solutions.
Graphs
The SPI package contains the default graphing policies provided by the SPI. Graphs are drawn from metrics that are collected in the data sources created by the SPI. The graphs help you analyze trends in server usage, availability, and performance. For details on integrating the WebSphere SPI with HP Performance Manager to get consolidated graphs, see Chapter 6, Integrating WebSphere SPI with HP Reporting and Graphing Solutions.
10 Chapter 1
Functions of WebSphere SPI
The WebSphere SPI messaging, reporting, and action-executing capabilities are based on the HPOM concept of policies. The settings within these policies define various conditions that might occur within the WebSphere Application Server and enable information to be sent back to the HPOM management server. This helps you to proactively address potential or existing problems and avoid serious disruptions to web transaction processing. The WebSphere SPI performs the following functions described in the following sections.
Collecting and Interpreting Server Performance and Availability Information
After you configure the WebSphere SPI, and the policies are deployed on the managed nodes, the SPI starts gathering server performance and availability data. This data is compared with the settings within the deployed policies. The policies define conditions that can occur within the WebSphere Server, such as queue throughput rates, cache use percentages, timeout rates, and average transaction times. The policies monitor these conditions against default thresholds (set within the policies) and trigger messages when a threshold is exceeded.
Displaying Information
The WebSphere SPI policies create messages when a threshold is exceeded. These messages can appear as:
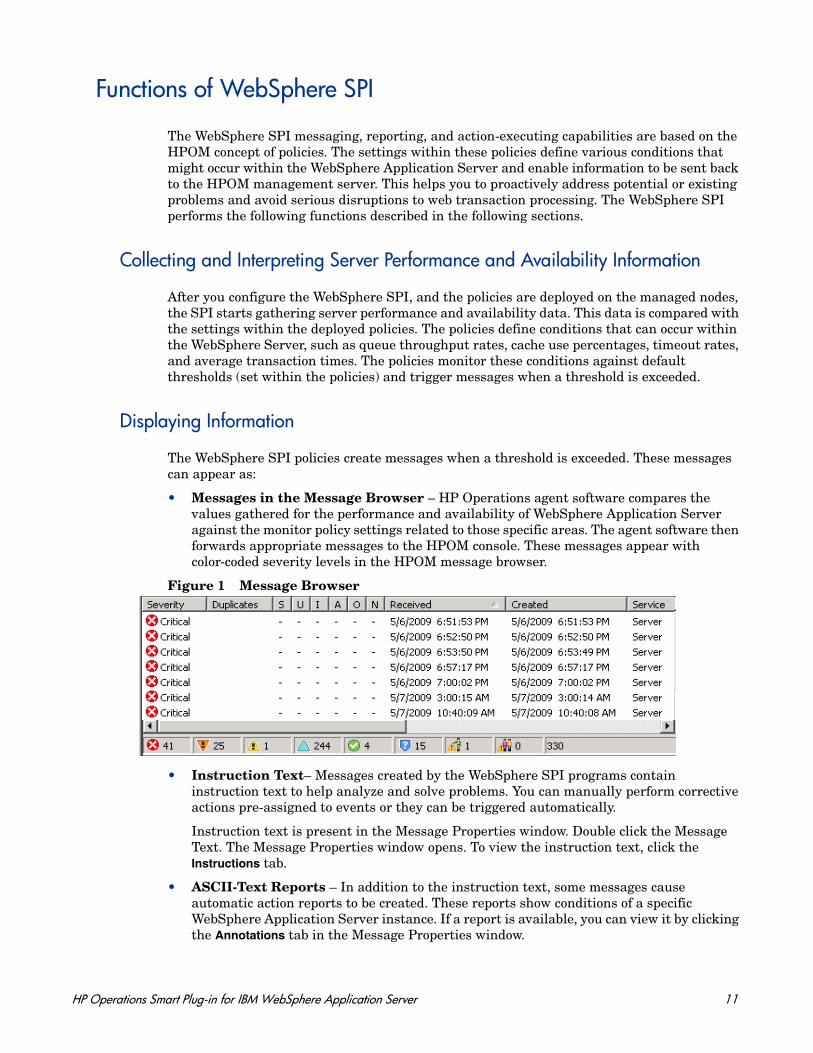
• Messages in the Message Browser – HP Operations agent software compares the values gathered for the performance and availability of WebSphere Application Server against the monitor policy settings related to those specific areas. The agent software then forwards appropriate messages to the HPOM console. These messages appear with color-coded severity levels in the HPOM message browser.
Figure 1 Message Browser
• Instruction Text– Messages created by the WebSphere SPI programs contain instruction text to help analyze and solve problems. You can manually perform corrective actions pre-assigned to events or they can be triggered automatically.
Instruction text is present in the Message Properties window. Double click the Message Text. The Message Properties window opens. To view the instruction text, click the Instructions tab.
• ASCII-Text Reports – In addition to the instruction text, some messages cause automatic action reports to be created. These reports show conditions of a specific WebSphere Application Server instance. If a report is available, you can view it by clicking the Annotations tab in the Message Properties window.
HP Operations Smart Plug-in for IBM WebSphere Application Server 11
Generating Reports Using HP Reporter
You can integrate the WebSphere SPI with HP Reporter to provide you with management-ready, web-based reports. The WebSphere SPI Report package includes the policies for generating these reports. You can install the Report package on the Reporter Windows system.
After you install the product and complete basic configuration, Reporter creates reports of summarized, consolidated data every night. With the help of these reports you can assess the performance of the WebSphere Application Server over a period of time.
Reporter uses the WebSphere SPI data to create reports that illustrate for example, servlet request rates, transaction throughput rates, and average transaction execution time.
Graphing Data using HP Performance Manager
Metrics collected by the WebSphere SPI can be graphed. The values can then be viewed for analyzing the trend.
You can integrate the WebSphere SPI with HP Performance Manager to create and view graphs. These graphs show the values of the metrics collected by the WebSphere SPI.
Customizing Policies and Metrics
You can use the WebSphere SPI policies without customization, or modify them to suit the needs of your environment. Some of the modifications and customizations that you can do as follows:
• Modify the default policies - Within a policy, you can change the default settings for:
— Collection interval
— Threshold
— Message text
— Duration
— Severity level of the condition
— Actions assigned to the condition (operator-initiated or automatic)
• Create custom policy groups – You can create custom policy groups using default policies as base. For more information, see Chapter 5, Customizing WebSphere SPI Policies.
• Create custom metrics – You can define your own metrics or User Defined Metrics (UDMs) to expand the monitoring capabilities of the WebSphere SPI.
12 Chapter 1
2 Installing WebSphere SPI
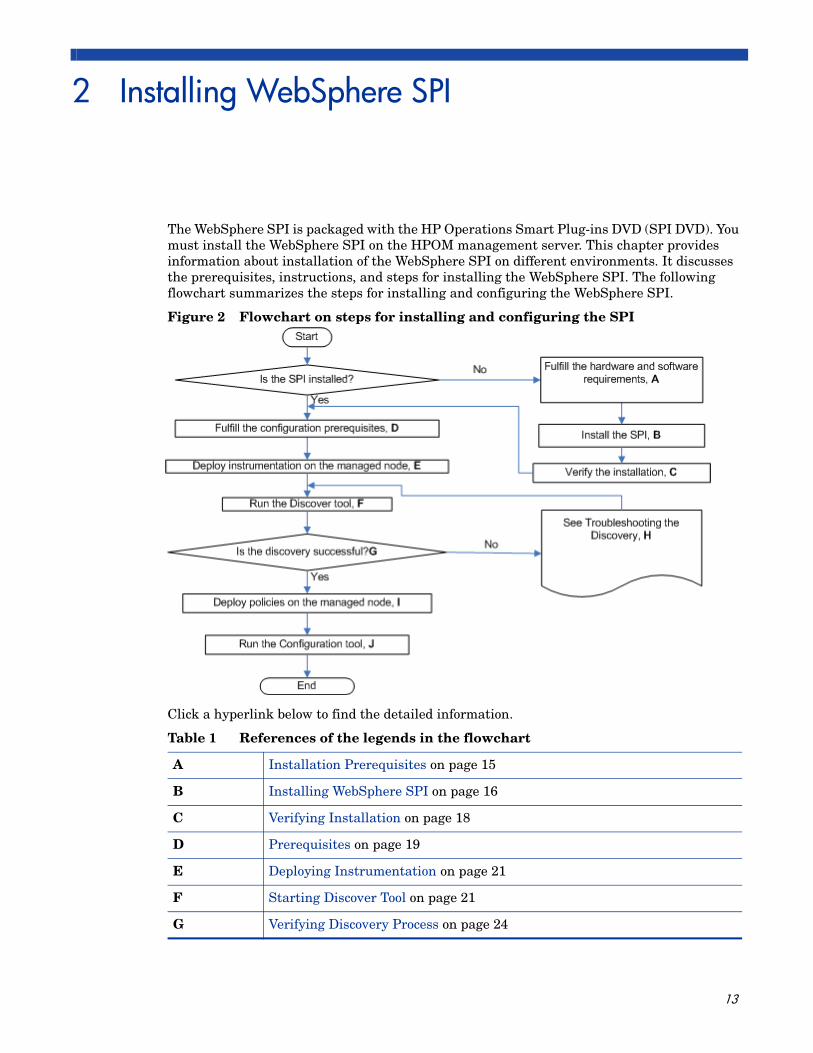
The WebSphere SPI is packaged with the HP Operations Smart Plug-ins DVD (SPI DVD). You must install the WebSphere SPI on the HPOM management server. This chapter provides information about installation of the WebSphere SPI on different environments. It discusses the prerequisites, instructions, and steps for installing the WebSphere SPI. The following flowchart summarizes the steps for installing and configuring the WebSphere SPI.
Figure 2 Flowchart on steps for installing and configuring the SPI
Click a hyperlink below to find the detailed information.
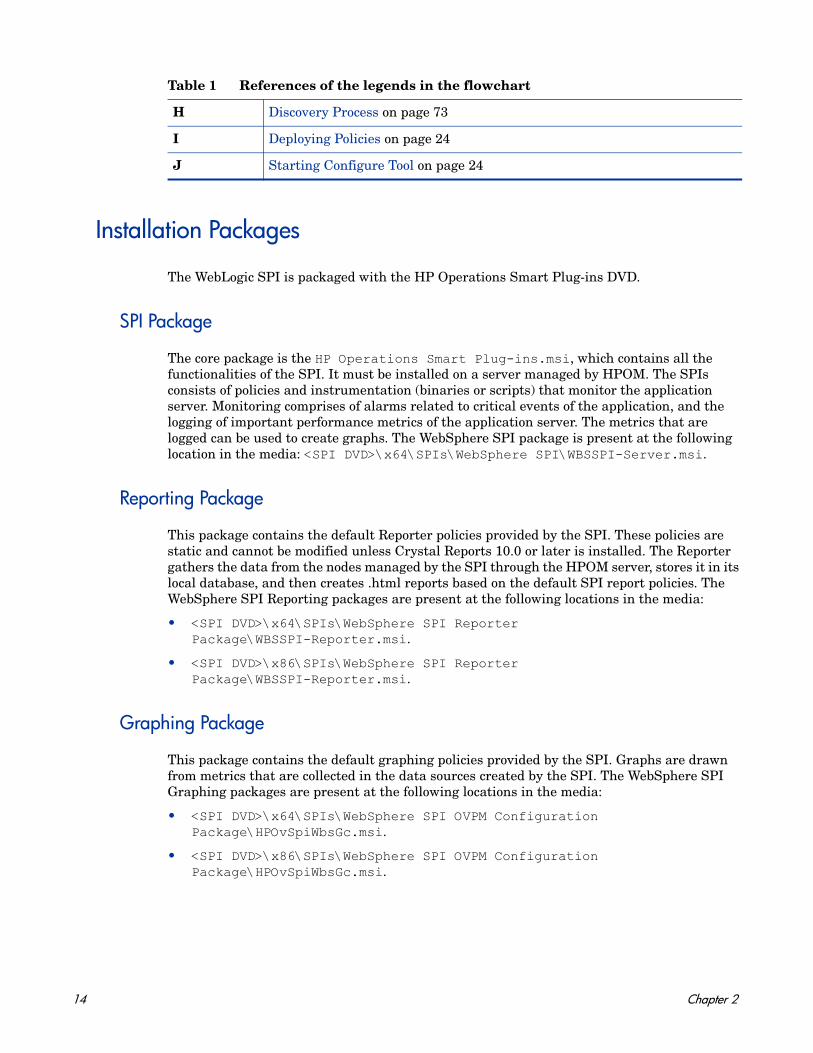
Table 1 References of the legends in the flowchart
A Installation Prerequisites on page 15
B Installing WebSphere SPI on page 16
C Verifying Installation on page 18
D Prerequisites on page 19
E Deploying Instrumentation on page 21
F Starting Discover Tool on page 21
G Verifying Discovery Process on page 24
13
Installation Packages
The WebLogic SPI is packaged with the HP Operations Smart Plug-ins DVD.
SPI Package
The core package is the HP Operations Smart Plug-ins.msi, which contains all the functionalities of the SPI. It must be installed on a server managed by HPOM. The SPIs consists of policies and instrumentation (binaries or scripts) that monitor the application server. Monitoring comprises of alarms related to critical events of the application, and the logging of important performance metrics of the application server. The metrics that are logged can be used to create graphs. The WebSphere SPI package is present at the following location in the media: <SPI DVD>\x64\SPIs\WebSphere SPI\WBSSPI-Server.msi.
Reporting Package
This package contains the default Reporter policies provided by the SPI. These policies are static and cannot be modified unless Crystal Reports 10.0 or later is installed. The Reporter gathers the data from the nodes managed by the SPI through the HPOM server, stores it in its local database, and then creates .html reports based on the default SPI report policies. The WebSphere SPI Reporting packages are present at the following locations in the media:
• <SPI DVD>\x64\SPIs\WebSphere SPI Reporter Package\WBSSPI-Reporter.msi.
• <SPI DVD>\x86\SPIs\WebSphere SPI Reporter Package\WBSSPI-Reporter.msi.
Graphing Package
This package contains the default graphing policies provided by the SPI. Graphs are drawn from metrics that are collected in the data sources created by the SPI. The WebSphere SPI Graphing packages are present at the following locations in the media:
• <SPI DVD>\x64\SPIs\WebSphere SPI OVPM Configuration Package\HPOvSpiWbsGc.msi.
• <SPI DVD>\x86\SPIs\WebSphere SPI OVPM Configuration Package\HPOvSpiWbsGc.msi.
H Discovery Process on page 73
I Deploying Policies on page 24
J Starting Configure Tool on page 24
Table 1 References of the legends in the flowchart
14 Chapter 2
Installation Environments
Standard Installation of SPI Components on the HPOM Server
You can install the full version of HP Performance Manager on the HPOM server. You can select to install only the SPI packages and not the graphing packages through the SPI DVD. However, if the full version of Performance Manager is installed on the same computer, the corresponding packages can be installed or uninstalled from the HPOM 9.00 server.
Standalone HP Performance Manager
For a standalone computer, only the corresponding package of any SPI is enabled and available for selection from the SPI DVD. For example, if a system has only HP Performance Manager installed, the graph package of the WebSphere SPI can be installed on it.
Standard Installation in HPOM Cluster Environment
In an HPOM cluster environment, you must install HPOM 9.00 server on each of the systems in the cluster. You can install the SPI on each of the nodes in the cluster environment.
Installation Prerequisites
Fulfill the hardware and software requirements before installing the SPI. Install the HPOM server and discovery package before installing the WebSphere SPI. It is not necessary to stop HPOM sessions before beginning the WebSphere SPI installation.
Hardware Requirements
See the HP Operations Manager for Windows documentation information about hardware requirements for the management server. See the Support Matrix (SUMA) link http://support.openview.hp.com/selfsolve/document/KM323488 for information about hardware requirements for the managed nodes.
Software Requirements
Make sure that the following software requirements are completed prior to the installation of the WebSphere SPI:
• In HPOM for Windows management environment, SPIs must be installed on all servers. Otherwise, SPI policy upload using the ovpmutil command results in errors. When you synchronize policy configuration between the management servers, install the SPIs downloaded using the ovpmutil commands ovpmutil cfg all dnl or ovpmutil cfg pol dnl, on the target server prior to uploading the policies.
• On the management server:
— WebSphere Application Server version: 6.x, 7.0
Installing WebSphere SPI 15
— HP Operations Manager for Windows: 9.00.
— HP Performance Manager for Windows: 9.00 (required if you want to create graphs)
— HP Reporter: 3.90
— HP Operations SPI Data Collector (DSI2DDF): 2.41
— HP SPI Self-Healing Services (SPI-SHS-OVO, automatically installed while installing the SPI using SPIDVD): 3.04
— JMX Component (automatically installed while installing the SPI using SPIDVD): 7.04
• On the managed node:
— HP Operations agent version 8.60 and above
— HP Performance Agent: 5.00 (required if you want to use HP Performance Agent for data logging)
Installing WebSphere SPI
Use the HP Operations Smart Plug-ins DVD to install the WebSphere SPI.
Installing WebSphere SPI on a Local Management Server
To install the WebSphere SPI on the management server, follow these steps:
1 Insert the HP Operations Smart Plug-ins DVD into the DVD drive of the management server system.
The HP Operations Manager InstallShield Wizard opens.
2 Click Next.
The Smart Plug-ins Release Notes and Other Documentation window opens.
3 Click Next.
The Program Maintenance window opens.
4 Select Install Products check box and click Next.
The Product Selection window opens.
5 From the options listed (there are three Product Selection windows), select the IBM WebSphere Application Server check box and click Next.
The Enable/Disable AutoDeployment window opens.
6 Select to disable or enable the Auto Deployment feature and click Next. HP Operations Manager deploys policies automatically only when required.
The License Agreement window opens.
7 Select I accept the terms in the license agreement check box and click Next.
The Ready to Modify the Program window opens.
If no SPI is installed on the management server, the Product Selection window opens instead of the Program Maintenance window.
16 Chapter 2
8 Select Back to edit previous selections; otherwise, click Install to begin installation.
You will see various status dialogs as the install program proceeds. Depending on the speed of your system and the components selected for installation, this process could take several minutes or more.
9 Click Finish to conclude the installation.
The WebSphere SPI is installed.
Installing WebSphere SPI in Cluster Environment
You must first install the HPOM management server on each system in the cluster. When the management server cluster installations are complete, the setup for the installation of the WebSphere SPI is ready. Make sure that each node in the cluster has sufficient disk space for the WebSphere SPI.
After installing the HPOM management server, proceed as follows:
• For the first installation (Node A) in the cluster — Follow the standard installation procedure, making product choices. Once you complete the installation on Node A, you will receive an instruction to proceed to the next system, Node B.
• For the Node B installation in the cluster — Follow the same procedure as for Node A. You no longer need to make product choices. The installation detects the cluster configuration and copies all the required product choices from Node A to Node B.
• For Node C and all remaining installations in the cluster — Follow the same procedure as for Node B, where you no longer choose products but enable the installation packages to be copied from Node B (the previously installed system within the cluster) to Node C (the current system within the cluster) until you finish the procedure.
Select and Install the WebSphere SPI on the First Cluster-Aware Management Server
Complete all the tasks in the section Installing WebSphere SPI on a Local Management Server on page 16 and then proceed to the next management server.
Install WebSphere SPI on the Next Cluster-Aware Management Server
Repeat the following steps on each management server in the cluster (as defined in the HP Operations Manager cluster installation) until you are finished.
1 Insert the HP Operations Smart Plug-ins DVD in the DVD drive of the management server and follow instructions as they appear.
Selecting Cancel after the installation has started does not stop the entire installation process, but only that of the product currently being installed (shown in the Status area). Installation of the next selected product begins.
Before beginning, make sure that sufficient disk space is available on each management server for the WebSphere SPI you plan to install. Cancelling the installation process before completion could result in partial installations and require manual removal of the partially installed components.
Installing WebSphere SPI 17
2 After the installation is complete, proceed as directed to the next management server until the installation on every management server in the cluster is complete.
Verifying Installation
Perform the following steps to verify the installation of the WebSphere SPI:
• Verify the version of the policies of the installed SPI. It must be 7.0450.
• Verify that all the instrumentation files are present in \<OvShareDir>\Instrumentation\Categories.
• Run the cscript List_Installed_SPI_Versions.vbs present in the <Ovinstalldir> to check the versions of the installed SPI.
Migration of WebSphere SPI from Previous Versions
For information about migrating the WebSphere SPI from the previous versions to the latest version, see HP Operations Smart Plug-ins DVD Release Notes.
The HPOM console will not function properly until installations are completed on all nodes in the cluster.
18 Chapter 2
3 Configuring WebSphere SPI
This chapter explains how to configure the WebSphere SPI for use with HP Operations Manager (HPOM). You must first complete all the configuration prerequisites. Then you must perform the basic configuration and complete additional configuration based on your environment.
Prerequisites
Complete the following tasks before configuring the WebSphere SPI.
Adding Managed Nodes
For each WebSphere Application server you want to manage from HPOM, make sure that all nodes on which the WebSphere Application servers are running are configured in HPOM as managed nodes.
To add a UNIX managed node, follow these steps:
1 Install the HPOM agent on the node.
2 Specify each WebSphere Server node on UNIX to be managed. For more information, see HPOM Console Online Help.
For a Windows managed node, do the following:
Specify each WebSphere node on Windows to be managed. For more information, see HPOM Console Online Help (the HP Operations agent is automatically installed when you complete this step).
Verify Application Server Status
Verify that your application servers are running. For WebSphere Application Server version 6.0 and above, check the status of the server from the WebSphere administrative console.
If you cannot verify the status of the server using the Administrative Console, run the following commands on the managed node:
• UNIX: <WebSphere_Install_Dir>/bin/serverStatus.sh -all
For example: /opt/WebSphere/AppServer/bin/serverStatus.sh -all
• Windows: <WebSphere_Install_Dir>\bin\serverStatus.bat -all
For example: C:\Program Files\WebSphere\AppServer\bin\serverStatus.bat -all
19
Collect WebSphere Login Information
If security is enabled on the WebSphere server, collect the username and password for each WebSphere Admin Server. The user must have the correct privileges assigned for the WebSphere Admin Server.
The WebSphere SPI discovery process uses the username (or Login) and password to gather basic configuration information and by the WebSphere SPI data collector to collect metrics.
Configuration of the WebSphere SPI is simplified if the username and password to access all WebSphere Admin Servers are the same.
If you are using WebSphere version 6.0 or later, you must be able to use the username and password for users or groups assigned to the administrator or operator role.
If you are using LDAP directory, then to access the WebSphere Console from LDAP, you must create a user account similar to the user account of LDAP in the local WebSphere instance. You must grant Administrator privileges to this user.
Connect using JSR 160
You can configure the WebSphere Application Server 6.1 or later to use JSR 160 connection to connect to the WebSphere Application Server. By default, the JSR 160 connection is disabled.
To enable JSR 160 connection set the JSR160 flag in the SPI Config file to true. By default, this flag is set to false. The SPIConfig file is present in the <OvAgentDir>/wasspi/wbs/conf directory.
If you are using WebSphere Application Server 6.1 or greater, before starting the collector you must set the following values for the attributes in the <WebSphere_HOME>/profiles/<profile_name>/properties/sas.client.props file. Set these values for all the profiles that you want to monitor.
• Set the value of loginSource attribute to properties (the default value of loginSource is prompt).
com.ibm.CORBA.loginSource=properties
• Set the value of loginUserid attribute to the WebSphere admin user id and loginPassword attribute to the WebSphere admin password:
com.ibm.CORBA.loginUserid=<admin_user>
com.ibm.CORBA.loginPassword=<admin_password>
If you do not update the sas.client.props file, the collector will fail.
If you use JSR 160 to connect to WebSphere Application Server 6.1 or later, the application server can run in “security enabled” or “security disabled” mode. In the “security disabled” mode the collector can run in both Transient and Persistent mode, but in the “security enabled” mode the collector can only run in the Transient mode. To set the collector in Transient mode, add a line– COLLECTOR_MODE=TRANSIENT at the end of the SPIConfig file. By default it is set to Persistent mode.
After updating the sas.client.props file, you must restart the WebSphere Application Server, if it is running.
20 Chapter 3
Update WebSphere’s SDK
For WebSphere Application Server 6.1 running on Windows nodes, you must update IBM Java SDK 1.5 to level SR4 or later (Java SDK 1.5 SR4 or later) or the collector may fail.
You can download Java SDK 1.5 SR4 or later from http://www-1.ibm.com.
Configuring WebSphere SPI
To complete basic WebSphere SPI configuration, perform the following tasks:
1 Deploying Instrumentation
2 Starting Discover Tool
3 Verifying Discovery Process
4 Deploying Policies
5 Starting Configure Tool
Deploying Instrumentation
To deploy instrumentation, follow these steps:
1 From the HPOM console select Operations Manager Nodes.
2 Right-click the managed node on which you want to run Discover or Configure WBSSPI tool.
3 Select All Tasks Deploy instrumentation.
The Deploy Instrumentation window opens.
4 Select JMX, SHS_Data_Collector, SPIDataCollector, and WebSphere from the list of instrumentation files and click OK.
To verify that these files deployed successfully, check Deployment Jobs under Policy management. There should be no error messages.
Starting Discover Tool
The Discover Tool sets basic configuration properties needed for discovery and deploys the WebSphere SPI discovery policies, and updates the service map.
To run Discovery, follow these steps:
1 From the HPOM console, select Operations Manager Tools SPI for WebSphere SPI Admin.
2 Double-click Discover or Configure WBSSPI.
3 Select the managed nodes on which WebSphere Application servers are running.
4 Click Launch.
Configuring WebSphere SPI 21
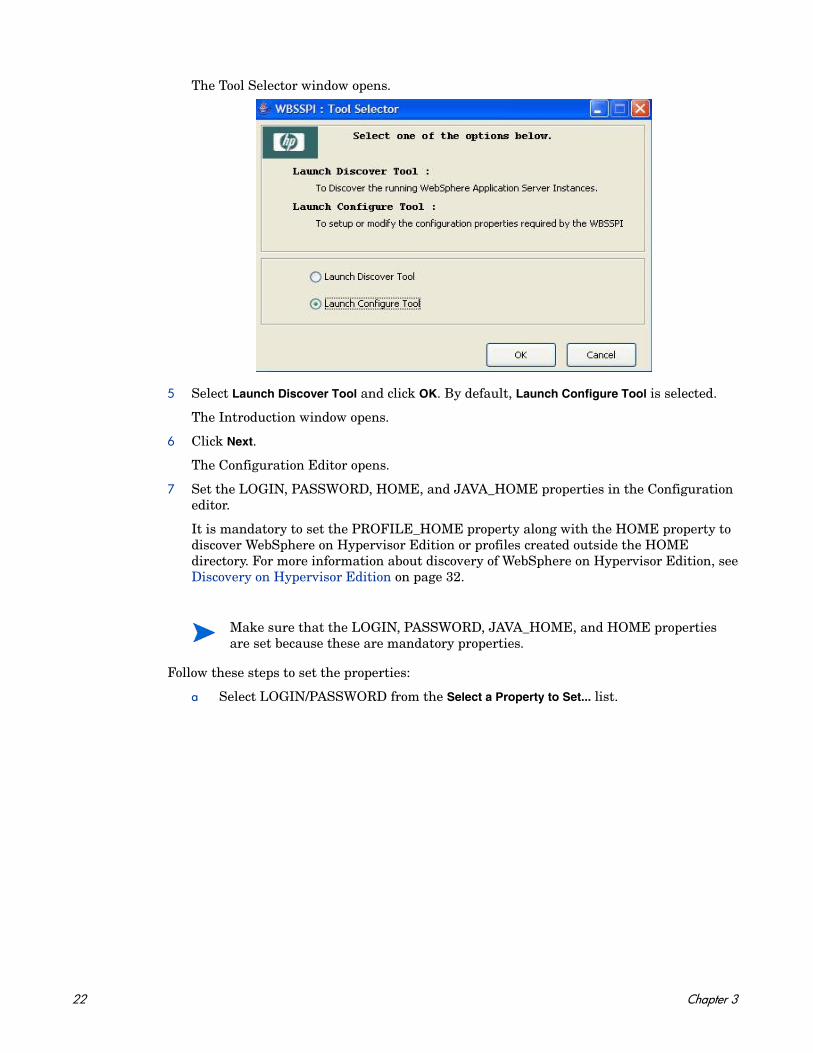
The Tool Selector window opens.
5 Select Launch Discover Tool and click OK. By default, Launch Configure Tool is selected.
The Introduction window opens.
6 Click Next.
The Configuration Editor opens.
7 Set the LOGIN, PASSWORD, HOME, and JAVA_HOME properties in the Configuration editor.
It is mandatory to set the PROFILE_HOME property along with the HOME property to discover WebSphere on Hypervisor Edition or profiles created outside the HOME directory. For more information about discovery of WebSphere on Hypervisor Edition, see Discovery on Hypervisor Edition on page 32.
Follow these steps to set the properties:
a Select LOGIN/PASSWORD from the Select a Property to Set... list.
Make sure that the LOGIN, PASSWORD, JAVA_HOME, and HOME properties are set because these are mandatory properties.
22 Chapter 3
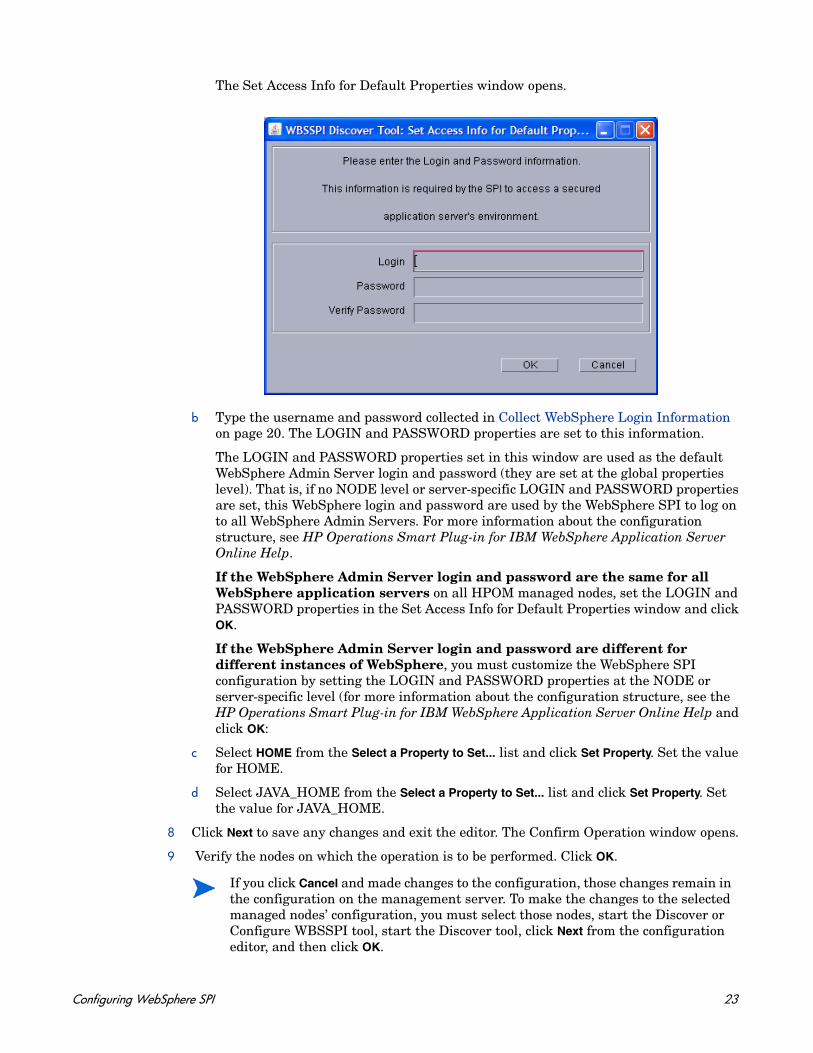
The Set Access Info for Default Properties window opens.
b Type the username and password collected in Collect WebSphere Login Information on page 20. The LOGIN and PASSWORD properties are set to this information.
The LOGIN and PASSWORD properties set in this window are used as the default WebSphere Admin Server login and password (they are set at the global properties level). That is, if no NODE level or server-specific LOGIN and PASSWORD properties are set, this WebSphere login and password are used by the WebSphere SPI to log on to all WebSphere Admin Servers. For more information about the configuration structure, see HP Operations Smart Plug-in for IBM WebSphere Application Server Online Help.
If the WebSphere Admin Server login and password are the same for all WebSphere application servers on all HPOM managed nodes, set the LOGIN and PASSWORD properties in the Set Access Info for Default Properties window and click OK.
If the WebSphere Admin Server login and password are different for different instances of WebSphere, you must customize the WebSphere SPI configuration by setting the LOGIN and PASSWORD properties at the NODE or server-specific level (for more information about the configuration structure, see the HP Operations Smart Plug-in for IBM WebSphere Application Server Online Help and click OK:
c Select HOME from the Select a Property to Set... list and click Set Property. Set the value for HOME.
d Select JAVA_HOME from the Select a Property to Set... list and click Set Property. Set the value for JAVA_HOME.
8 Click Next to save any changes and exit the editor. The Confirm Operation window opens.
9 Verify the nodes on which the operation is to be performed. Click OK.
If you click Cancel and made changes to the configuration, those changes remain in the configuration on the management server. To make the changes to the selected managed nodes’ configuration, you must select those nodes, start the Discover or Configure WBSSPI tool, start the Discover tool, click Next from the configuration editor, and then click OK.
Configuring WebSphere SPI 23
Wait for the discovery process to complete before going to the next task. The discovery process might take several minutes to complete.
If any error messages appear, see Discovery Process on page 73 to diagnose and troubleshoot.
Verifying Discovery Process
Depending on the number of managed nodes in your environment, verification may take several minutes to complete.
To verify if the discovery process is successfully completed, follow these steps:
1 Check if the following message appears in the message browser for each managed node:
WASSPI 502: INFO - WBSSPI Discovery is Successful
Depending on the number of managed nodes in your environment, it may take several minutes for these messages to appear for all managed nodes.
2 From the HPOM console, select Operations Manager Services Applications WebSphere. The service map appears. It may take some time for the service map to appear completely.
3 Verify that the WebSphere, WebSphere Admin Server, and application server instances are represented correctly.
Deploying Policies
To deploy policies, follow these steps:
1 From the HPOM console for Windows, select Operations Manager Policy management Policy groups.
2 Right-click SPI for WebSphere Application Server All Tasks Deploy on....
3 Select the managed node on which you want to deploy the policies.
4 Click OK.
The policies are deployed on the nodes.
Starting Configure Tool
To start Configure tool, follow these steps:
1 From the HPOM console for Windows, select Tools SPI for WebSphere Application Server SPI Admin.
2 Double-click Discover or Configure WBSSPI.
3 Select the managed nodes on which you want to run the tool.
4 Click Launch.
After the discovery process is complete, the appropriate WebSphere SPI group policies are deployed on the managed nodes. An automatic procedure to set up a managed node for the WebSphere SPI operations starts, 10 minutes after the policies are deployed,
24 Chapter 3
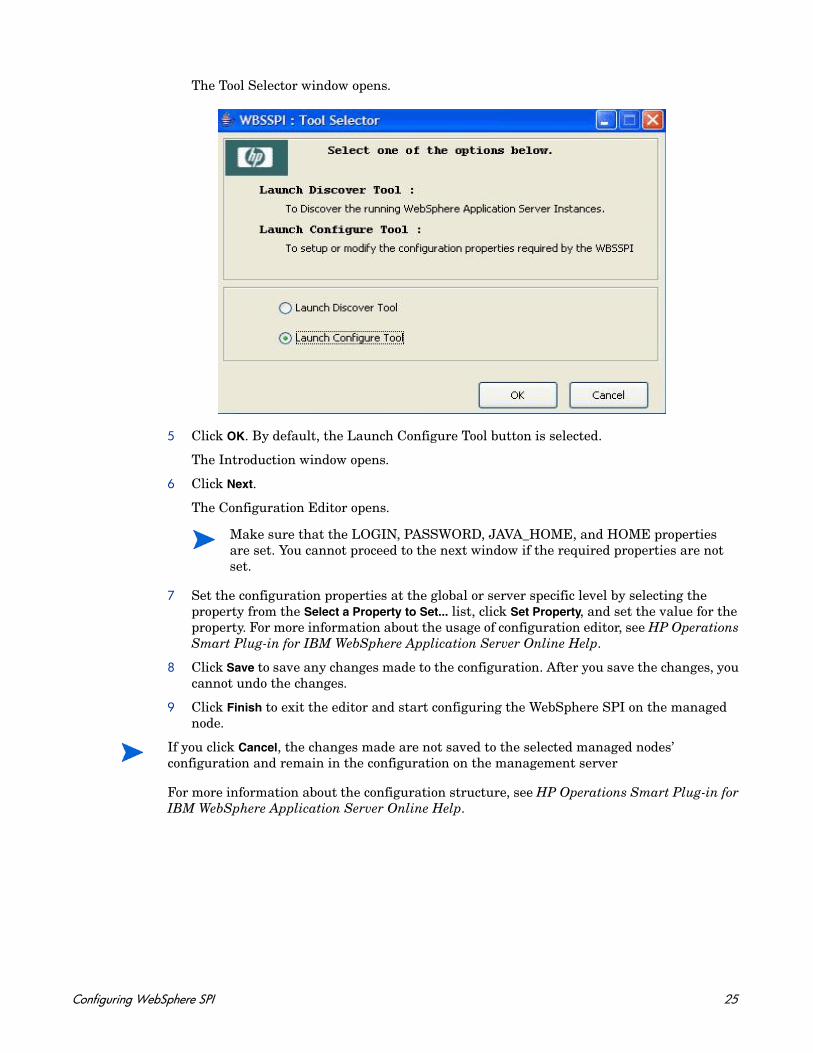
The Tool Selector window opens.
5 Click OK. By default, the Launch Configure Tool button is selected.
The Introduction window opens.
6 Click Next.
The Configuration Editor opens.
7 Set the configuration properties at the global or server specific level by selecting the property from the Select a Property to Set... list, click Set Property, and set the value for the property. For more information about the usage of configuration editor, see HP Operations Smart Plug-in for IBM WebSphere Application Server Online Help.
8 Click Save to save any changes made to the configuration. After you save the changes, you cannot undo the changes.
9 Click Finish to exit the editor and start configuring the WebSphere SPI on the managed node.
For more information about the configuration structure, see HP Operations Smart Plug-in for IBM WebSphere Application Server Online Help.
Make sure that the LOGIN, PASSWORD, JAVA_HOME, and HOME properties are set. You cannot proceed to the next window if the required properties are not set.
If you click Cancel, the changes made are not saved to the selected managed nodes’ configuration and remain in the configuration on the management server
Configuring WebSphere SPI 25
Additional WebSphere SPI Configuration
After you successfully complete the basic configuration of the WebSphere SPI, you must finish the WebSphere SPI configuration (by setting the properties that are not automatically discovered by the Discovery policies) and install and configure additional components. Setting some of these properties and configuring additional components depend on your environment.
See the HP Operations Smart Plug-in for IBM WebSphere Application Server Online Help for a complete definition of the properties.
• If you are configuring user-defined metrics, see the JMX Metric Builder Online Help for additional installation and configuration information.
• If HP Reporter is installed (must be purchased separately), see Integrating WebSphere SPI with HP Reporter on page 62 for installation and configuration information.
• If HP Performance Manager is installed (must be purchased separately) and you want to view graphs, set the GRAPH_URL property. See Integrating WebSphere SPI with HP Performance Agent on page 33 for additional installation and configuration information.
To update the configuration, follow the steps in Starting Configure Tool on page 24.
Deploying a Different Policy Group
The WBSSPI Discovery policy automatically deploys the Medium-Impact policy group to the managed node on which it discovers the presence of a WebSphere application server. To deploy a different set of policies (High-Impact, Low-Impact, or your own custom policies), follow these steps:
1 Remove the existing Medium-Impact policy group as follows:
a From the HPOM console, select Operations Manager Policy management Policy groups SPI for WebSphere.
b Right click Medium-Impact and select All Tasks Uninstall from.
c Select the nodes from which you want to remove the Medium-Impact policy group.
d Click OK.
2 Deploy the different policy group:
a From the HPOM console, select Operations Manager Policy management Policy groups SPI for WebSphere.
b Right click the policy group to deploy and select All Tasks Deploy on.
c Select the nodes from which you want to deploy the different policy group.
d Click OK.
The PMI level of a node is automatically adjusted to a higher level when a higher impact level policy group is deployed. For example, deploying the High-Impact policy group on a node would result in a PMI setting of high for the node. However, PMI levels do not automatically
Property When to Set
START_CMD and STOP_CMD To run the Start WebSphere and Stop WebSphere tools from the HPOM console.
26 Chapter 3
revert to lower impact levels, even after removing policies from a node and/or deploying a lower impact level policy group. To lower a PMI level for a node, you must manually reset the PMI level within WebSphere. Monitoring settings can be changed using the WebSphere Resource Analyzer tool.
WebSphere SPI in High Availability Environments
High availability is a general term used to characterize environments that are business critical and therefore are protected against downtime through redundant resources. Very often, cluster systems are used to reach high availability.
You can configure the WebSphere SPI to accommodate cluster environments where failovers enable uninterrupted WebSphere server availability. The WebSphere SPI monitoring, when synchronized with the cluster environment, can switch from the failed node to the active node.
Prerequisites
The prerequisites for using the WebSphere SPI in high availability environments are:
• Management Server: HPOM for Windows 9.00
• Node: HP-UX MCSG cluster
• HPOM 9.00 HTTPS and DCE Agent version (for details see Agent cluster support matrix)
Configuring WebSphere SPI for High Availability Environments
To configure the WebSphere SPI for use in high availability environment complete the following tasks:
1 Create WebSphere SPI monitoring configuration file
2 Create the clustered application configuration file
3 Configure WebSphere SPI for HTTPS or DCE Agent (Based on Requirement)
Create WebSphere SPI monitoring configuration file
The WebSphere SPI uses a monitoring configuration file <appl_name>.apm.xml that works in conjunction with the clustered application configuration file.
The <appl_name>.apm.xml file lists all the WebSphere SPI policies on the managed node so that you can disable or enable these policies as appropriate, for inactive and active managed nodes.
To create this clustered application configuration file for your WBS environment, follow these steps:
1 Use the following syntax to create the <appl_name>.apm.xml file:
<?xml version="1.0"?><APMApplicationConfiguration>
<Application>
<appl_name> is the namespace_name. For more information, see HP Operations Manager for UNIX HTTPS Agent Concepts and Configuration Guide.
Configuring WebSphere SPI 27
<Name> ... </Name><Template> ... </Template><StartCommand>wasspi_perl -S wasspi_clusterSvrApp -opt startMonitor $instance</StartCommand><StopCommand>wasspi_perl -S wasspi_clusterSvrApp -opt stopMonitor $instance</StopCommand>
</Application></APMApplicationConfiguration>
2 Type the namespace_name within the <Name></Name> tag.
3 After the file is created, save it in the <OvDataDir>/bin/instrumentation directory for DCE agent. For HTTPS agent save it in the <OvDataDir>/bin/instrumentation/conf directory.
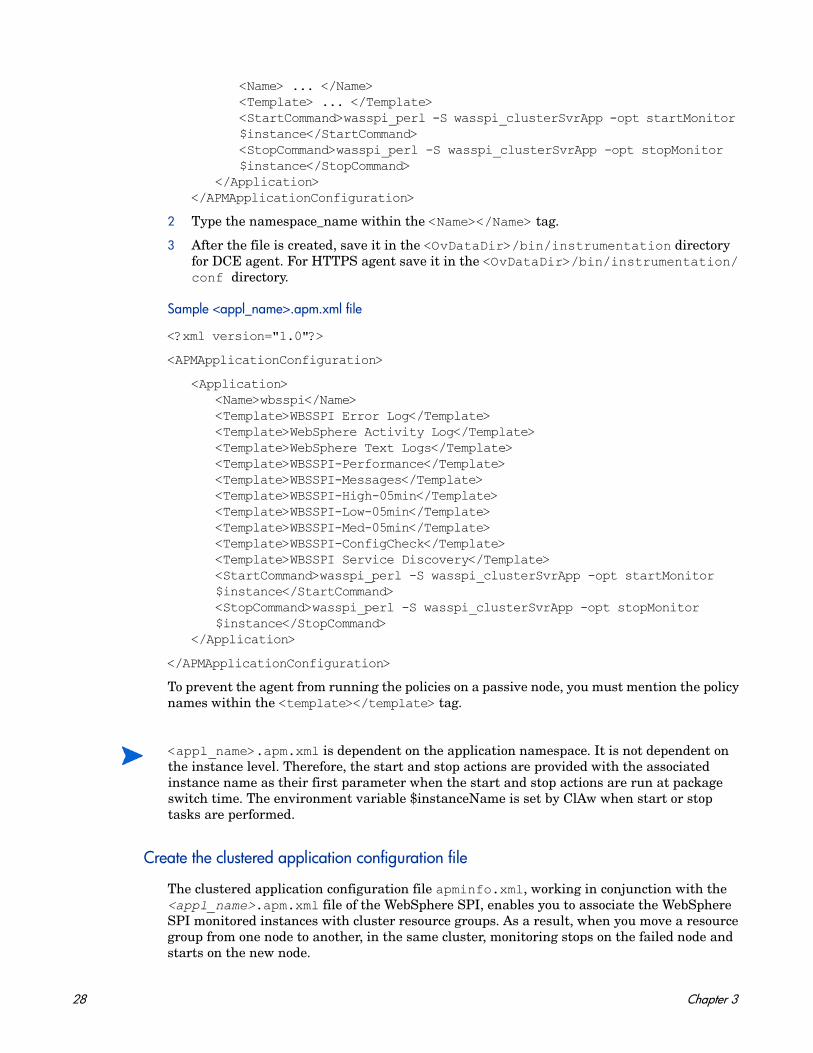
Sample <appl_name>.apm.xml file
<?xml version="1.0"?>
<APMApplicationConfiguration>
<Application><Name>wbsspi</Name><Template>WBSSPI Error Log</Template><Template>WebSphere Activity Log</Template><Template>WebSphere Text Logs</Template><Template>WBSSPI-Performance</Template><Template>WBSSPI-Messages</Template><Template>WBSSPI-High-05min</Template><Template>WBSSPI-Low-05min</Template><Template>WBSSPI-Med-05min</Template><Template>WBSSPI-ConfigCheck</Template><Template>WBSSPI Service Discovery</Template><StartCommand>wasspi_perl -S wasspi_clusterSvrApp -opt startMonitor $instance</StartCommand><StopCommand>wasspi_perl -S wasspi_clusterSvrApp -opt stopMonitor $instance</StopCommand>
</Application>
</APMApplicationConfiguration>
To prevent the agent from running the policies on a passive node, you must mention the policy names within the <template></template> tag.
Create the clustered application configuration file
The clustered application configuration file apminfo.xml, working in conjunction with the <appl_name>.apm.xml file of the WebSphere SPI, enables you to associate the WebSphere SPI monitored instances with cluster resource groups. As a result, when you move a resource group from one node to another, in the same cluster, monitoring stops on the failed node and starts on the new node.
<appl_name>.apm.xml is dependent on the application namespace. It is not dependent on the instance level. Therefore, the start and stop actions are provided with the associated instance name as their first parameter when the start and stop actions are run at package switch time. The environment variable $instanceName is set by ClAw when start or stop tasks are performed.
28 Chapter 3
To create the clustered application configuration file apminfo.xml follow these steps:
1 Use a text editor to create the file. The syntax is:
<?xml version="1.0" ?><APMClusterConfiguration>
<Application><Name>namespace_name</Name><Instance> <Name><Instance Name></Name> <Package><Package Name></Package></Instance>
<Application></APMClusterConfiguration>
2 Type namespace_name within the <Name></Name> tag.
3 Save the apminfo.xml file in the <OvDataDir>/conf/conf directory for HTTPS Agent. For DCE Agent, save the apminfo.xml file in the <OvDataDir>/conf/OpC directory.
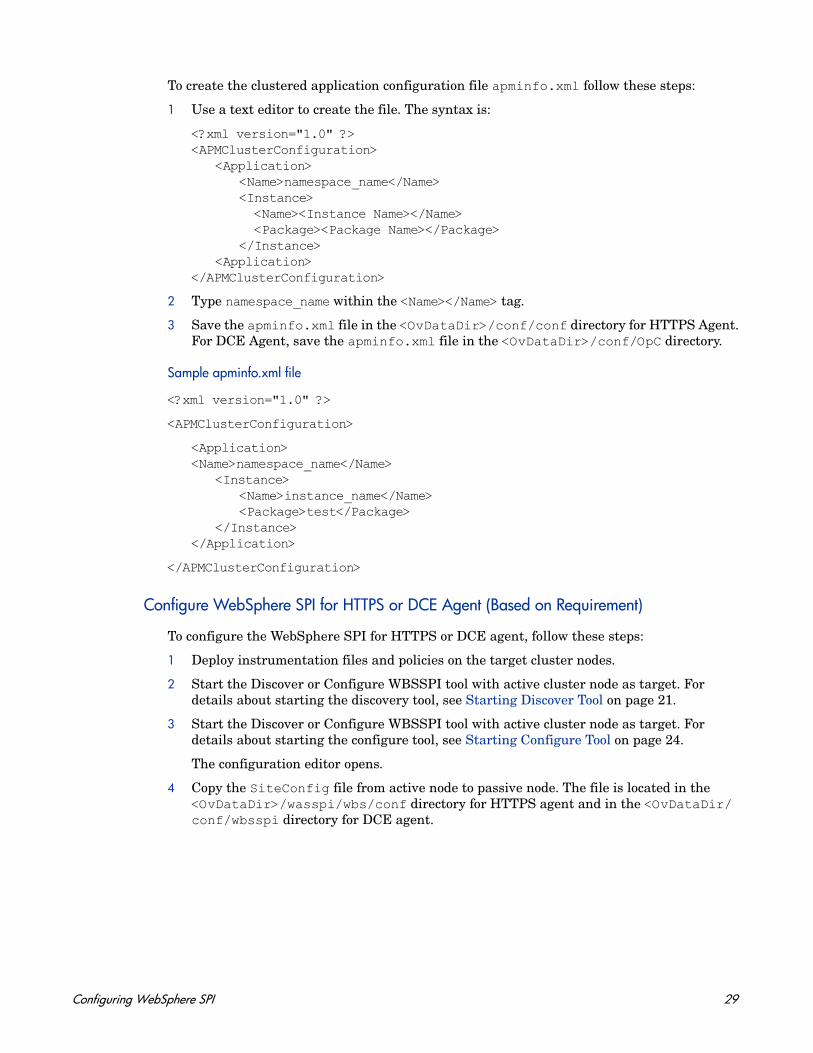
Sample apminfo.xml file
<?xml version="1.0" ?>
<APMClusterConfiguration>
<Application><Name>namespace_name</Name>
<Instance><Name>instance_name</Name><Package>test</Package>
</Instance></Application>
</APMClusterConfiguration>
Configure WebSphere SPI for HTTPS or DCE Agent (Based on Requirement)
To configure the WebSphere SPI for HTTPS or DCE agent, follow these steps:
1 Deploy instrumentation files and policies on the target cluster nodes.
2 Start the Discover or Configure WBSSPI tool with active cluster node as target. For details about starting the discovery tool, see Starting Discover Tool on page 21.
3 Start the Discover or Configure WBSSPI tool with active cluster node as target. For details about starting the configure tool, see Starting Configure Tool on page 24.
The configuration editor opens.
4 Copy the SiteConfig file from active node to passive node. The file is located in the <OvDataDir>/wasspi/wbs/conf directory for HTTPS agent and in the <OvDataDir/conf/wbsspi directory for DCE agent.
Configuring WebSphere SPI 29
WebSphere SPI Discovery in Cluster Environment
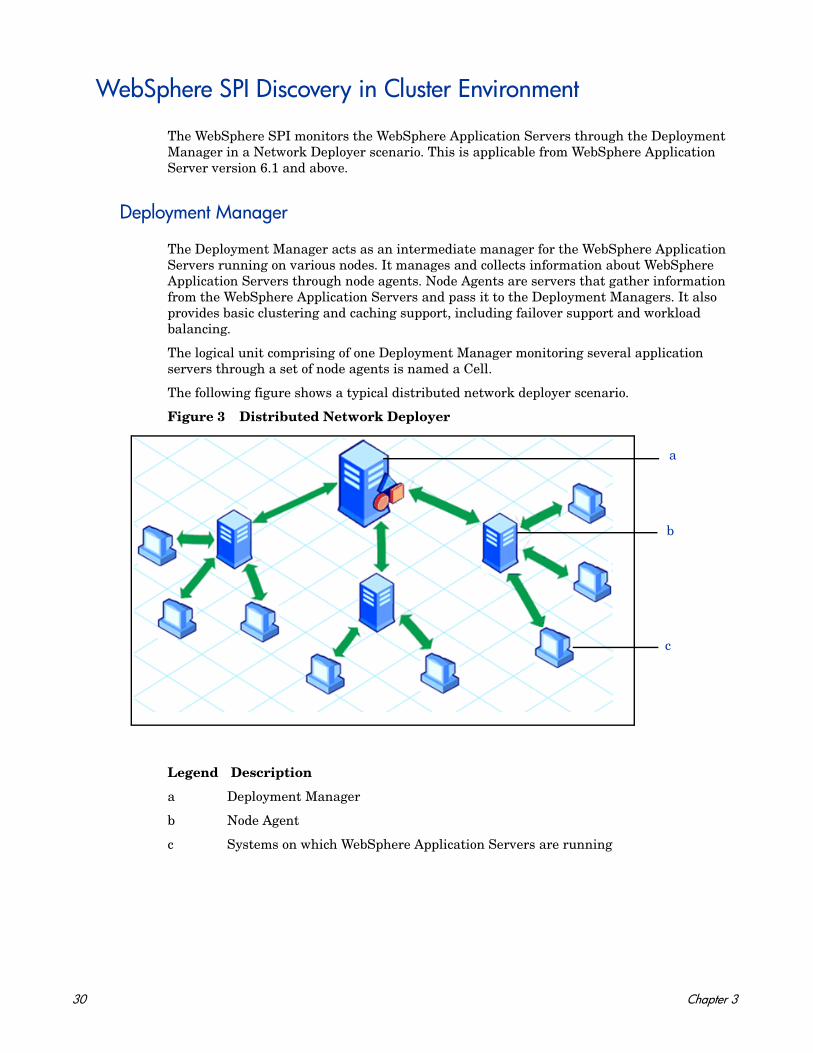
The WebSphere SPI monitors the WebSphere Application Servers through the Deployment Manager in a Network Deployer scenario. This is applicable from WebSphere Application Server version 6.1 and above.
Deployment Manager
The Deployment Manager acts as an intermediate manager for the WebSphere Application Servers running on various nodes. It manages and collects information about WebSphere Application Servers through node agents. Node Agents are servers that gather information from the WebSphere Application Servers and pass it to the Deployment Managers. It also provides basic clustering and caching support, including failover support and workload balancing.
The logical unit comprising of one Deployment Manager monitoring several application servers through a set of node agents is named a Cell.
The following figure shows a typical distributed network deployer scenario.
Figure 3 Distributed Network Deployer
a
b
c
Legend Description
a Deployment Manager
b Node Agent
c Systems on which WebSphere Application Servers are running
30 Chapter 3
WebSphere SPI Discovery in Network Deployer Scenario
In the classic scenario, the discovery process discovers all systems running WebSphere Application Server and populates the SiteConfig file with information about all discovered nodes.
However, in a distributed Network Deployer scenario, the WebSphere SPI discovery process performs the following functions:
• Discovers only the Deployment Managers and populates the SiteConfig file on the HPOM management server with information about the Deployment Managers. The WebSphere SPI instrumentation files and policies are deployed only on the Deployment Managers.
• The WebSphere SPI creates a DistributedServerConfig file on the Deployment Manager node and stores in it the information regarding the application servers managed by that Deployment Manager. The DistributedServerConfig file has information about every discovered application server along with the information about its deployment manager. This is helpful if there is more than one Deployment Manager installed on the same node.
Use Cases
The following are a few upgrade scenarios you may face when installing the WebSphere SPI 7.04 in a distributed network deployer environment. If you have a classic set-up in your environment, you can continue using the WebSphere SPI as usual.
Use Case 1: You are a new customer of the WebSphere SPI and want to monitor the distributed WebSphere Network Deployer scenario.
1 Install the WebSphere SPI on the HPOM management server.
2 Deploy the WebSphere SPI policies and instrumentation to all the nodes on which the Deployment Manager is running.
3 Run the Discover or Configure WBSSPI (Discover Tool) tool.
The master SiteConfig contains only the details of the Deployment Managers. The details of the application servers on individual nodes is available on the Deployment Manager’s Distributed SiteConfig. The Distributed SiteConfig is available in the <OvDataDir>/ wasspi/wbs/conf directory.
Use Case 2: You are an existing customer of the WebSphere SPI and want to monitor the distributed network deployer scenario in your environment.
1 Install the WebSphere SPI on the HPOM management server.
2 Deploy the instrumentation to all the nodes where Deployment Manager is running.
3 Manually remove all previous versions of the WebSphere SPI policies from all the individual nodes (where the WebSphere Application Server is running). You can do this through the HPOM console.
4 (Optional) Manually remove all instrumentation of previous version and the <OvDataDir>/ wasspi/wbs/ directory from all the individual nodes (where the WebSphere Application Server is running). You must perform this task from the managed node, it cannot be done through the HPOM console.
5 Run the Discover or Configure WBSSPI (Discover Tool) tool.
Configuring WebSphere SPI 31
Use Case 3: If you are an existing customer of the WebSphere SPI and have implemented the network deployer scenario but still want to use the SPI ignoring the network deployer scenario.
1 Install the WebSphere SPI on the HPOM management server.
2 Run the Discover or Configure WBSSPI (Discover Tool) tool in discovery mode.
3 Go to <OvDataDir>/wasspi/wbs/conf directory.
4 Open SPIConfig file.
5 Set OVERRIDE_DISTRIBUTED_MODE=True and DISTRIBUTED_MODE=False.
This action ignores the network deployer scenario.
6 Save the SPIConfig file.
7 Clean master SiteConfig to remove the servers listed in the SiteConfig for the corresponding node.
8 Run the Discover or Configure WBSSPI (Discover Tool) tool in discovery mode.
9 Run the Discover or Configure WBSSPI (Discover Tool) tool in configure mode.
10 Check the list of Application Servers in the config interface. Remove the Dmgr instance.
11 Click Save and Finish.
Limitations in a Network Deployer Scenario
• The two status related metrics — WBSSPI_0001 Server Status and WBSSPI_0002 Server Status Report are not collected in the network deployer scenario. However, if the WebSphere SPI is unable to connect to the deployment manager, an alert message indicating that the deployment manager is down appears in the message browser.
• When you run the View Server Status tool, it returns the status of deployment manager as unknown.
Discovery on Hypervisor Edition
The WebSphere SPI discovers and monitors WebSphere Application Server from version 7.0x on Hypervisor Edition.
To discover WebSphere on Hypervisor, set the mandatory property, PROFILE_HOME along with HOME in the Configuration Editor, while running discovery.
To set the PROFILE_HOME property in the Configuration Editor, follow these steps:
1 Select PROFILE_HOME from the Select a Property to Set... list.
2 Click Set Property.
3 Set the value to PROFILE_HOME.
Wait for the discovery process to complete before going to the next task. The discovery process might take several minutes to complete.
32 Chapter 3
Discovery of WebSphere Portal Servers
The WebSphere SPI discovers and monitors WebSphere Portal Servers. The WebSphere SPI directly discovers WebSphere Portal Servers along with the Application server, if the login credentials are same for Application server and Portal server instances.
The following sections describe the different cases involved in the discovery of WebSphere Portal Servers:
Case 1: If the Portal Server is federated with the Distribution Manager
Set the credentials for Distributed Managers during discovery and the WebSphere SPI will discover all the servers.
Case 2: If the Portal Server instances are not federated with the Distributed Manager and the Application Server is installed in the Network Deployment mode
Follow the steps in Use Case 3: If you are an existing customer of the WebSphere SPI and have implemented the network deployer scenario but still want to use the SPI ignoring the network deployer scenario. on page 32.
Case 3: If the Application Server is installed in a standalone mode (Non Distributed Mode) and the Portal Server is also installed on the same node.
The WebSphere SPI discovers all the servers in this case.
If the login credentials for Application server and Portal Server instances are different, follow these steps to run discovery:
1 Set the credentials for Application server instance, and run discovery.
2 Take a backup of the resulting SiteConfig. The file is located at <OvDataDir>/wasspi/wbs/conf/SiteConfig directory on the node.
3 Set the credentials for Portal Server instance, and run discovery.
4 Merge the contents of the backed up SiteConfig with the newly created SiteConfig.
Integrating WebSphere SPI with HP Performance Agent
If your IT environment requires you to create graphs and reports from historical data or to store large volumes of performance data, you may want to use the HP Performance Agent to collect and store performance data. HP Performance Agent is a product that must be purchased separately.
The data collected by HP Performance Agent is used by Reporter, HP Performance Insight, and HP Performance Manager. The reporting and graphing features integrated with HPOM for Windows cannot use data collected by HP Performance Agent and therefore can not work if you use Performance Agent.
If you are running HP Performance agent 4.x for Linux, you are not required to configure the WebSphere SPI data collector to use HP Performance Agent. By default, the WebSphere SPI detects and uses this version of HP Performance Agent to collect and store performance data.
Configuring WebSphere SPI 33
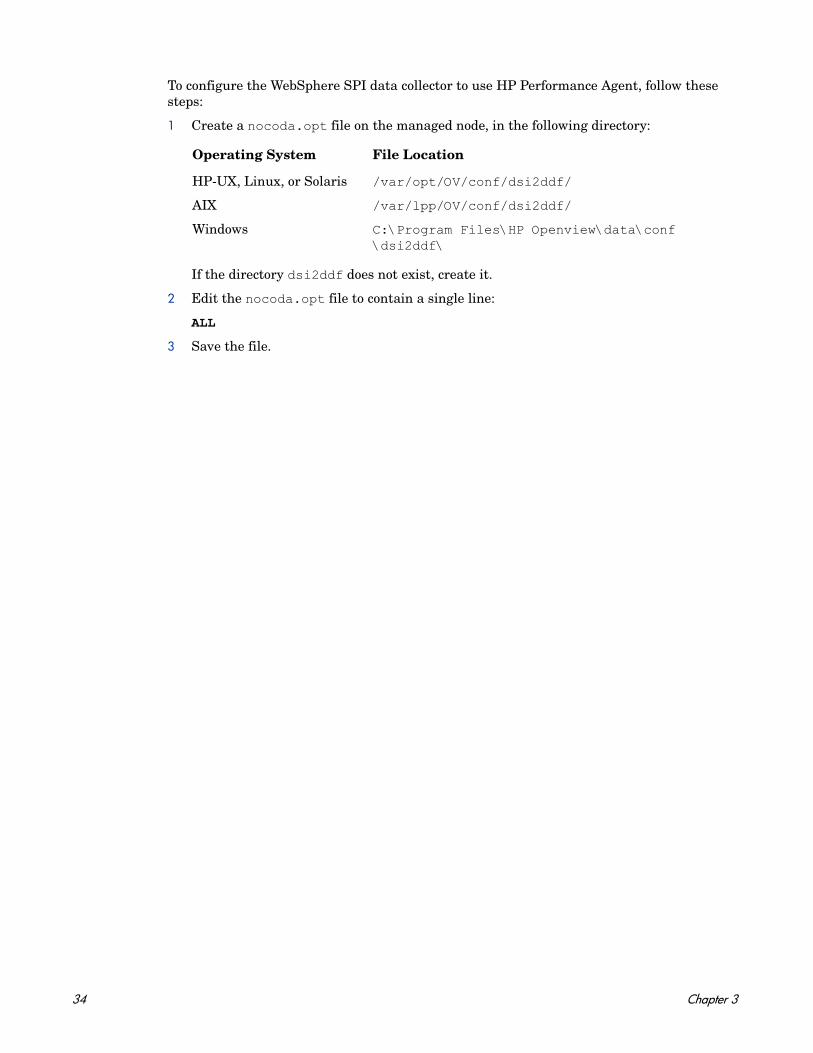
To configure the WebSphere SPI data collector to use HP Performance Agent, follow these steps:
1 Create a nocoda.opt file on the managed node, in the following directory:
If the directory dsi2ddf does not exist, create it.
2 Edit the nocoda.opt file to contain a single line:
ALL
3 Save the file.
Operating System File Location
HP-UX, Linux, or Solaris /var/opt/OV/conf/dsi2ddf/
AIX /var/lpp/OV/conf/dsi2ddf/
Windows C:\Program Files\HP Openview\data\conf \dsi2ddf\
34 Chapter 3
4 Using Tools
The WebSphere SPI offers centralized tools which help you monitor and manage systems using WebSphere Application Server (AS). The WebSphere SPI tools enable you to configure the management server’s connection to selected server instances on specific managed nodes. The WebSphere SPI tools include configuration, troubleshooting, and report-generating utilities.
Overview
The SPI for WebSphere tools are grouped into the following tool groups:
• WebSphere Admin
• Metric Reports
• SPI Admin
• JMX Metric Builder: This tool group is available only if you install the SPIJMB software bundle.
SPI Admin Tools Group
The SPI Admin tools group consists of tools that enable you to configure, control, and troubleshoot the WebSphere SPI. These tools require the root user permission, therefore it is recommended that this group is assigned to the HPOM administrator.
Additional SPI Admin tools for user defined metrics (UDMs) are available with the SPIJMB software bundle. For more information about how to install the software bundle and the additional tools, see the JMX Metric Builder Online Help.
The WebSphere SPI Admin tool group contains the following tools:
• Discover or Configure WBSSPI – Starts the configuration editor and sets basic configuration properties needed for discovery or maintains the WebSphere SPI configuration.
• Self-Healing Info – Collects data that you can send to your HP support representative.
• Start Monitoring – Starts the collection of metrics for one application server or all application servers on a managed node. Run the Verify tool to determine if monitoring is started or stopped. By default, monitoring is on.
• Stop Monitoring – Stops the collection of metrics for one application server or all application servers on a managed node.
• Start Tracing – Starts logging the information about each of the activity performed by the SPI. Run this tool only when instructed by your HP support representative.
35
• Stop Tracing– Stops logging the information about each of the activity performed by the SPI into a file. Run this tool only when instructed by your HP support representative.
• Verify– Verifies that the files required for the functioning of the SPI (instrumentation, library, configuration files, and so on) are deployed.
• View Error File– Enables you to view the contents of the WebSphere SPI error log file.
• Create WBSSPI Node Groups– Enables you to create the WebSphere SPI node groups that contains all the managed nodes running supported versions of WebSphere.
WebSphere Admin Tools Group
WebSphere Admin tools group enables the HPOM administrator to perform routine tasks related to WebSphere.
The WebSphere Admin tool group contains the following tools:
• Check WebSphere – Does an interactive status check of selected WebSphere Application Servers.
• Start WebSphere – Enables you to start one or all WebSphere Application Servers from the HPOM console (requires setup).
• Start WebSphere Console – Enables you to start WebSphere console.
• Stop WebSphere – Enables you to stop the WebSphere Application Servers from the HPOM console (requires setup).
• View WebSphere Logs – Enables you to view the WebSphere Application Server log files.
Metric Reports
The Metric Reports tool group contains reports that show information about WebSphere conditions in the server. You can create a report about all WebSphere Servers configured on a managed node. Each report shows the status of all the configured WebSphere Server instances on the managed node in relation to the metric for which the report is created.
For more information about the metric reports and tools, see HP Operations Smart Plug-in for IBM WebSphere Application Server Online Help.
JMX Metric Builder Tools
The JMX Metric Builder tools group contains the following tools:
• Deploy UDM – Deploys the UDM file.
• Gather MBean Data – Collects MBean information to be used with the JMX Metric Builder.
• JMX Metric Builder – Starts the JMX Metric Builder tool that is used to create UDMs and browse MBeans.
• UDM Graph Enable/Disable – Starts or stops data collection for UDM graphs. Also starts or stops the HPOM subagent.
36 Chapter 4
For more information about the JMX Metric Builder tools group and steps to install the SPIJMB software bundle, see the JMX Metric Builder Online Help.
Starting Tools
This section describes how you can run the tools for the WebSphere SPI. The steps in Starting Discover or Configure WBSSPI tool describes how you can run the Discover or Configure WBSSPI tool and Starting All Tools describes how you can run all the tools (excluding Discover or Configure WBSSPI) tool.
Starting Discover or Configure WBSSPI tool
See Starting Discover Tool on page 21 and Starting Configure Tool on page 24 to know how to run Discover or Configure WBSSPI tool.
Starting All Tools
To run all tools, follow these steps:
1 From the HPOM console, select Tools SPI for WebSphere <Tool Group>.
2 Double-click <Name of the Tool>.
3 Select the managed nodes on which you want to run the tool.
4 Click Launch.
The Tool Status window opens.
5 In the Launched Tools field, check the Status of the tool for each node:
— Started/Starting - The tool is running.
— Succeeded - A status report is available for each instance of the WebSphere server on the managed node. Select the node in the Launched Tools field and scroll through the Tool Output field.
— Failed - The tool did not succeed. Select the node in the Launched Tools field and scroll through the Tool Output field for more information about the problem.
6 Click Close to close the Tool Status window.
Using Tools 37

38 Chapter 4
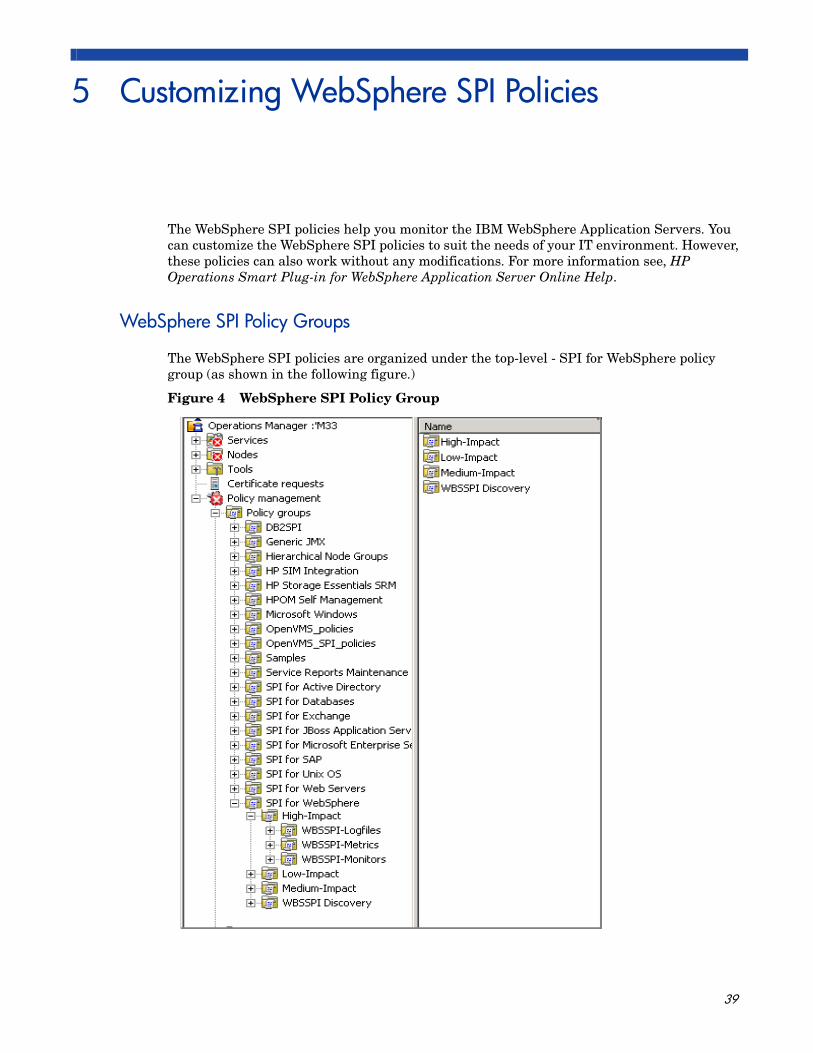
5 Customizing WebSphere SPI Policies
The WebSphere SPI policies help you monitor the IBM WebSphere Application Servers. You can customize the WebSphere SPI policies to suit the needs of your IT environment. However, these policies can also work without any modifications. For more information see, HP Operations Smart Plug-in for WebSphere Application Server Online Help.
WebSphere SPI Policy Groups
The WebSphere SPI policies are organized under the top-level - SPI for WebSphere policy group (as shown in the following figure.)
Figure 4 WebSphere SPI Policy Group
39
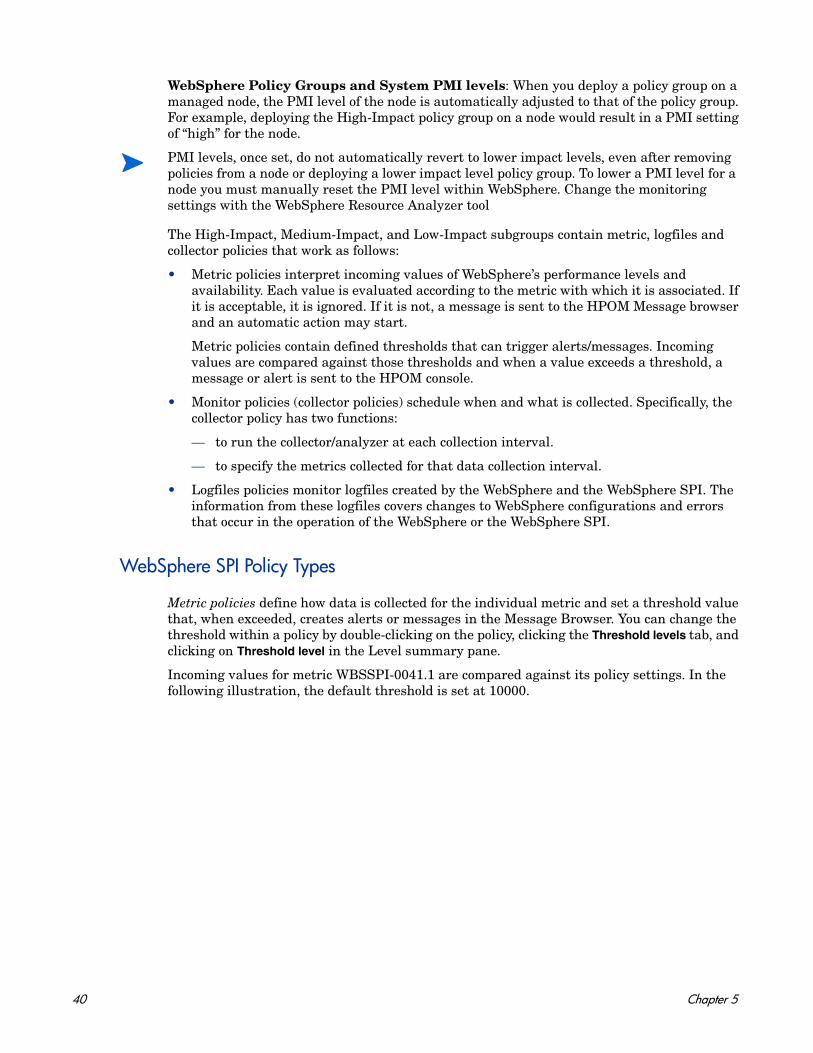
WebSphere Policy Groups and System PMI levels: When you deploy a policy group on a managed node, the PMI level of the node is automatically adjusted to that of the policy group. For example, deploying the High-Impact policy group on a node would result in a PMI setting of “high” for the node.
The High-Impact, Medium-Impact, and Low-Impact subgroups contain metric, logfiles and collector policies that work as follows:
• Metric policies interpret incoming values of WebSphere’s performance levels and availability. Each value is evaluated according to the metric with which it is associated. If it is acceptable, it is ignored. If it is not, a message is sent to the HPOM Message browser and an automatic action may start.
Metric policies contain defined thresholds that can trigger alerts/messages. Incoming values are compared against those thresholds and when a value exceeds a threshold, a message or alert is sent to the HPOM console.
• Monitor policies (collector policies) schedule when and what is collected. Specifically, the collector policy has two functions:
— to run the collector/analyzer at each collection interval.
— to specify the metrics collected for that data collection interval.
• Logfiles policies monitor logfiles created by the WebSphere and the WebSphere SPI. The information from these logfiles covers changes to WebSphere configurations and errors that occur in the operation of the WebSphere or the WebSphere SPI.
WebSphere SPI Policy Types
Metric policies define how data is collected for the individual metric and set a threshold value that, when exceeded, creates alerts or messages in the Message Browser. You can change the threshold within a policy by double-clicking on the policy, clicking the Threshold levels tab, and clicking on Threshold level in the Level summary pane.
Incoming values for metric WBSSPI-0041.1 are compared against its policy settings. In the following illustration, the default threshold is set at 10000.
PMI levels, once set, do not automatically revert to lower impact levels, even after removing policies from a node or deploying a lower impact level policy group. To lower a PMI level for a node you must manually reset the PMI level within WebSphere. Change the monitoring settings with the WebSphere Resource Analyzer tool
40 Chapter 5
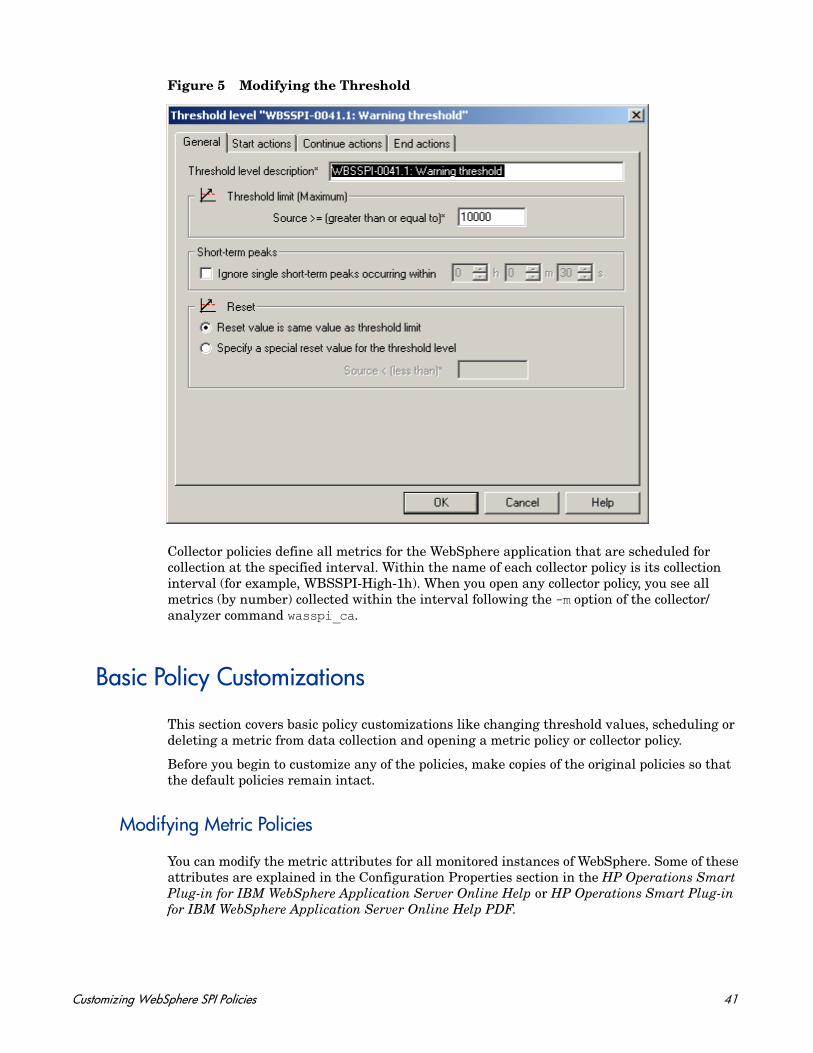
Figure 5 Modifying the Threshold
Collector policies define all metrics for the WebSphere application that are scheduled for collection at the specified interval. Within the name of each collector policy is its collection interval (for example, WBSSPI-High-1h). When you open any collector policy, you see all metrics (by number) collected within the interval following the -m option of the collector/analyzer command wasspi_ca.
Basic Policy Customizations
This section covers basic policy customizations like changing threshold values, scheduling or deleting a metric from data collection and opening a metric policy or collector policy.
Before you begin to customize any of the policies, make copies of the original policies so that the default policies remain intact.
Modifying Metric Policies
You can modify the metric attributes for all monitored instances of WebSphere. Some of these attributes are explained in the Configuration Properties section in the HP Operations Smart Plug-in for IBM WebSphere Application Server Online Help or HP Operations Smart Plug-in for IBM WebSphere Application Server Online Help PDF.
Customizing WebSphere SPI Policies 41
Threshold Level and Actions
To modify the threshold level and actions of a policy, follow these steps:
1 From the HPOM console, select Operations Manager Policy management Policy groups SPI for WebSphere <Impact>-Impact Metrics.
2 Double-click a policy. The policy for which you want to change the threshold value. The policy window opens.
3 Select the Threshold levels tab. From the Level summary pane, click Threshold level.
The Threshold level window opens.
In the figure preceding, the threshold limit is set to 1000 for WBSSPI-0026. The incoming values for this metric show the total number of times per minute clients must wait for an available Enterprise Java bean. If the number exceeds 1000 the server response time slows down. This creates a Warning message.
You can modify the following attributes from the Threshold Level window:
• Threshold limit: If the threshold limit is met or crossed the WebSphere SPI triggers an alarm or message.
• Short-term peaks: A minimum time period over which the monitored value must exceed the threshold before generating a message. For a message to be sent, the value must be greater than the threshold each time the value is measured during a duration that you select. If the duration is set to 0 or the box is left empty, an alarm is created as soon as HPOM detects that the threshold has been equaled or crossed.
42 Chapter 5
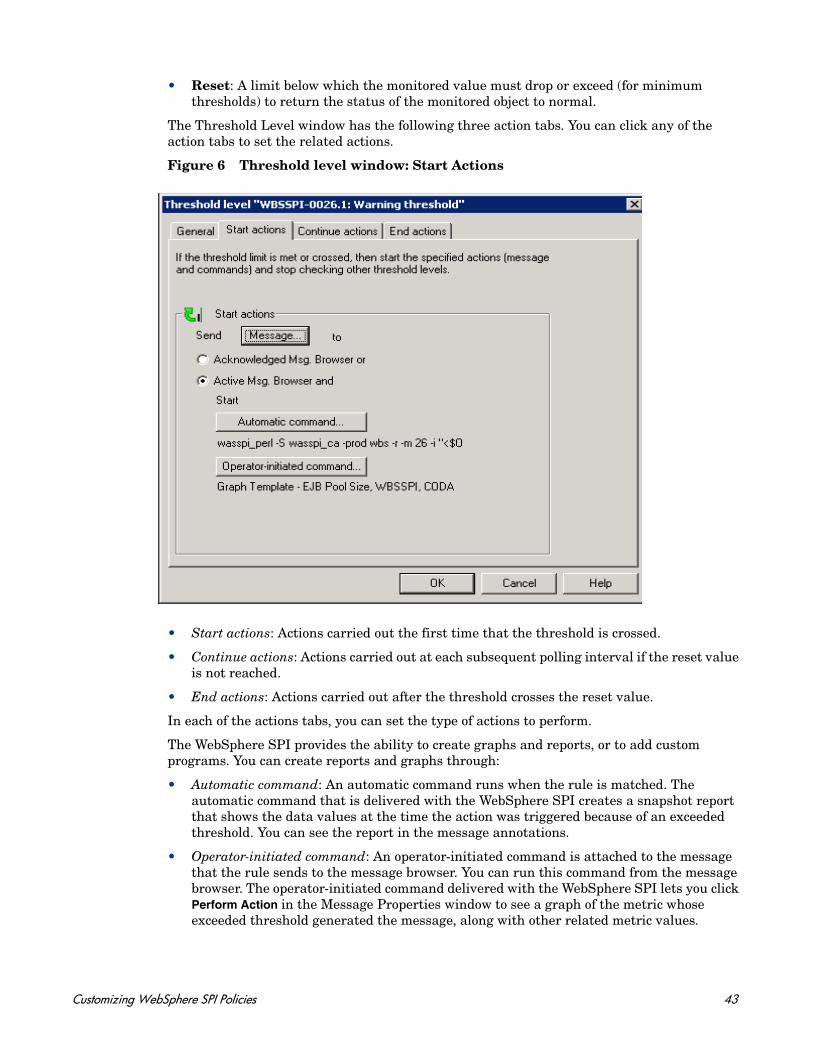
• Reset: A limit below which the monitored value must drop or exceed (for minimum thresholds) to return the status of the monitored object to normal.
The Threshold Level window has the following three action tabs. You can click any of the action tabs to set the related actions.
Figure 6 Threshold level window: Start Actions
• Start actions: Actions carried out the first time that the threshold is crossed.
• Continue actions: Actions carried out at each subsequent polling interval if the reset value is not reached.
• End actions: Actions carried out after the threshold crosses the reset value.
In each of the actions tabs, you can set the type of actions to perform.
The WebSphere SPI provides the ability to create graphs and reports, or to add custom programs. You can create reports and graphs through:
• Automatic command: An automatic command runs when the rule is matched. The automatic command that is delivered with the WebSphere SPI creates a snapshot report that shows the data values at the time the action was triggered because of an exceeded threshold. You can see the report in the message annotations.
• Operator-initiated command: An operator-initiated command is attached to the message that the rule sends to the message browser. You can run this command from the message browser. The operator-initiated command delivered with the WebSphere SPI lets you click Perform Action in the Message Properties window to see a graph of the metric whose exceeded threshold generated the message, along with other related metric values.
Customizing WebSphere SPI Policies 43
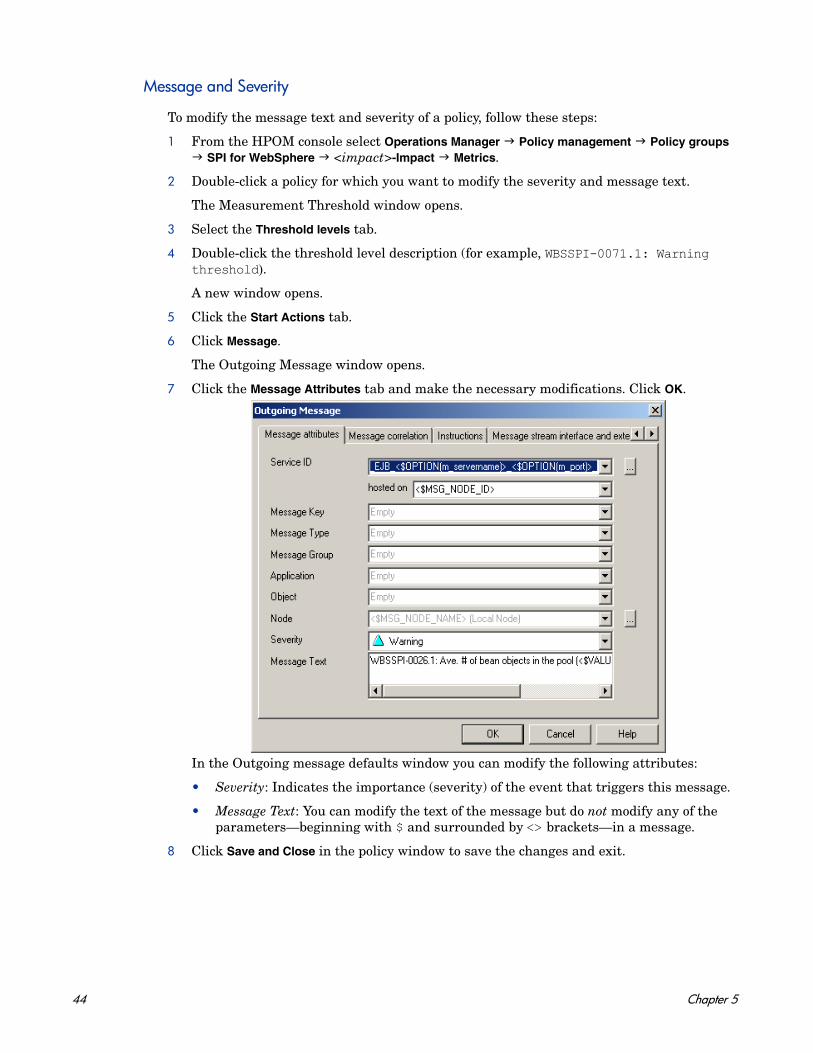
Message and Severity
To modify the message text and severity of a policy, follow these steps:
1 From the HPOM console select Operations Manager Policy management Policy groups SPI for WebSphere <impact>-Impact Metrics.
2 Double-click a policy for which you want to modify the severity and message text.
The Measurement Threshold window opens.
3 Select the Threshold levels tab.
4 Double-click the threshold level description (for example, WBSSPI-0071.1: Warning threshold).
A new window opens.
5 Click the Start Actions tab.
6 Click Message.
The Outgoing Message window opens.
7 Click the Message Attributes tab and make the necessary modifications. Click OK.
In the Outgoing message defaults window you can modify the following attributes:
• Severity: Indicates the importance (severity) of the event that triggers this message.
• Message Text: You can modify the text of the message but do not modify any of the parameters—beginning with $ and surrounded by <> brackets—in a message.
8 Click Save and Close in the policy window to save the changes and exit.
44 Chapter 5
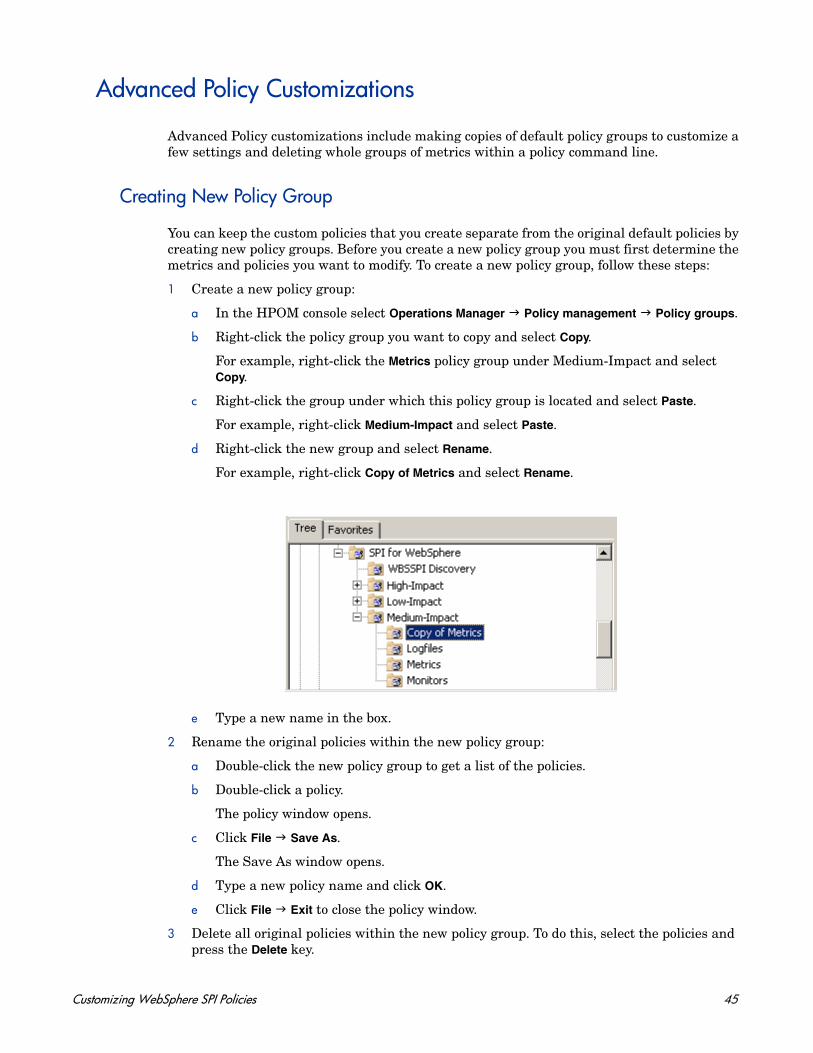
Advanced Policy Customizations
Advanced Policy customizations include making copies of default policy groups to customize a few settings and deleting whole groups of metrics within a policy command line.
Creating New Policy Group
You can keep the custom policies that you create separate from the original default policies by creating new policy groups. Before you create a new policy group you must first determine the metrics and policies you want to modify. To create a new policy group, follow these steps:
1 Create a new policy group:
a In the HPOM console select Operations Manager Policy management Policy groups.
b Right-click the policy group you want to copy and select Copy.
For example, right-click the Metrics policy group under Medium-Impact and select Copy.
c Right-click the group under which this policy group is located and select Paste.
For example, right-click Medium-Impact and select Paste.
d Right-click the new group and select Rename.
For example, right-click Copy of Metrics and select Rename.
e Type a new name in the box.
2 Rename the original policies within the new policy group:
a Double-click the new policy group to get a list of the policies.
b Double-click a policy.
The policy window opens.
c Click File Save As.
The Save As window opens.
d Type a new policy name and click OK.
e Click File Exit to close the policy window.
3 Delete all original policies within the new policy group. To do this, select the policies and press the Delete key.
Customizing WebSphere SPI Policies 45
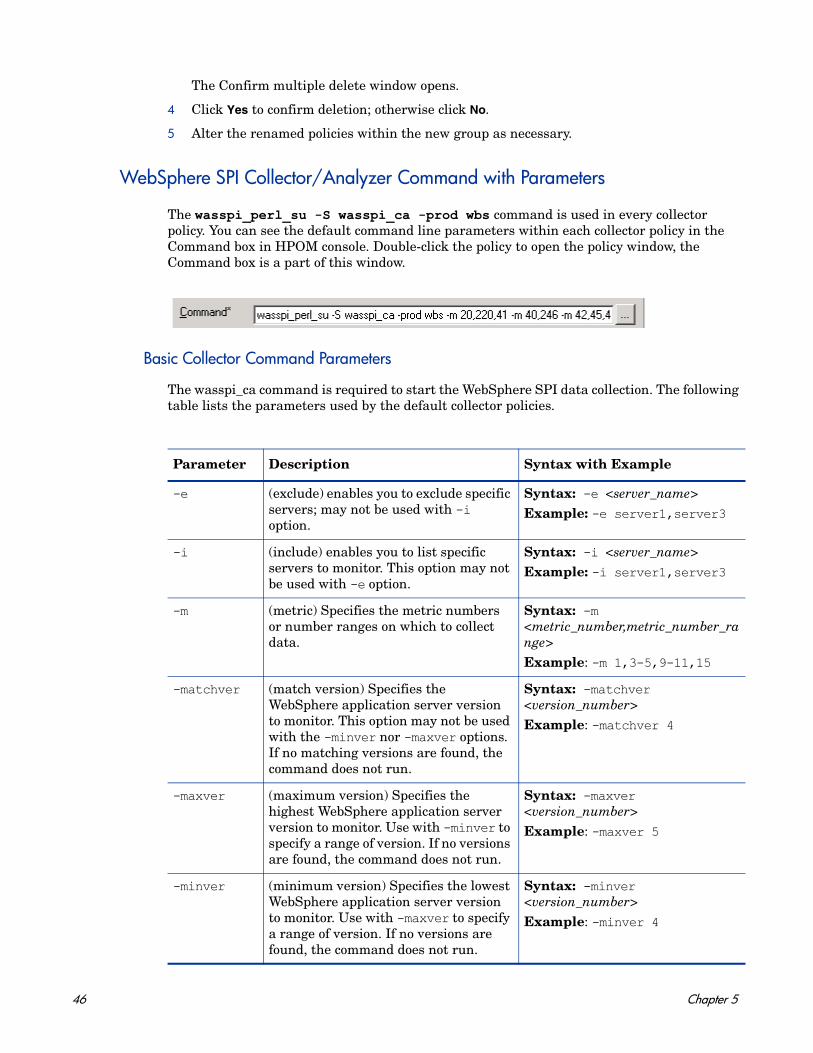
The Confirm multiple delete window opens.
4 Click Yes to confirm deletion; otherwise click No.
5 Alter the renamed policies within the new group as necessary.
WebSphere SPI Collector/Analyzer Command with Parameters
The wasspi_perl_su -S wasspi_ca -prod wbs command is used in every collector policy. You can see the default command line parameters within each collector policy in the Command box in HPOM console. Double-click the policy to open the policy window, the Command box is a part of this window.
Basic Collector Command Parameters
The wasspi_ca command is required to start the WebSphere SPI data collection. The following table lists the parameters used by the default collector policies.
Parameter Description Syntax with Example
-e (exclude) enables you to exclude specific servers; may not be used with -i option.
Syntax: -e <server_name>Example: -e server1,server3
-i (include) enables you to list specific servers to monitor. This option may not be used with -e option.
Syntax: -i <server_name>Example: -i server1,server3
-m (metric) Specifies the metric numbers or number ranges on which to collect data.
Syntax: -m <metric_number,metric_number_range>Example: -m 1,3-5,9-11,15
-matchver (match version) Specifies the WebSphere application server version to monitor. This option may not be used with the -minver nor -maxver options. If no matching versions are found, the command does not run.
Syntax: -matchver <version_number>Example: -matchver 4
-maxver (maximum version) Specifies the highest WebSphere application server version to monitor. Use with -minver to specify a range of version. If no versions are found, the command does not run.
Syntax: -maxver <version_number>Example: -maxver 5
-minver (minimum version) Specifies the lowest WebSphere application server version to monitor. Use with -maxver to specify a range of version. If no versions are found, the command does not run.
Syntax: -minver <version_number>Example: -minver 4
46 Chapter 5
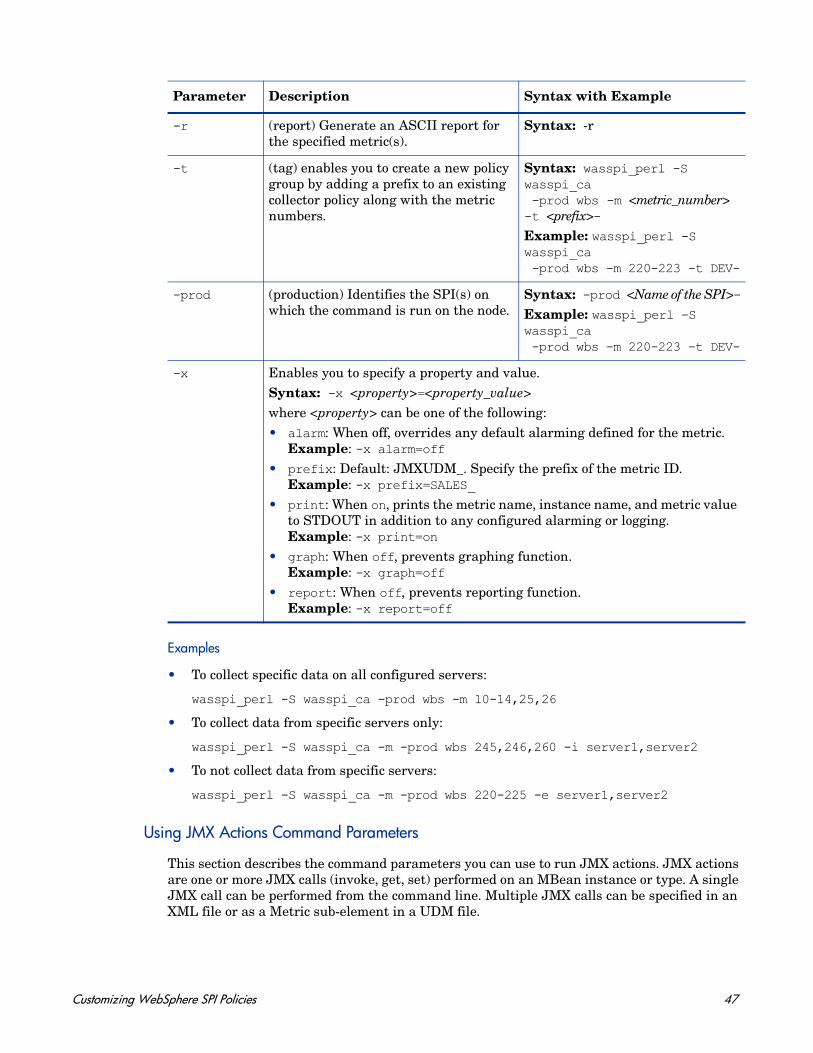
Examples
• To collect specific data on all configured servers:
wasspi_perl -S wasspi_ca -prod wbs -m 10-14,25,26
• To collect data from specific servers only:
wasspi_perl -S wasspi_ca -m -prod wbs 245,246,260 -i server1,server2
• To not collect data from specific servers:
wasspi_perl -S wasspi_ca -m -prod wbs 220-225 -e server1,server2
Using JMX Actions Command Parameters
This section describes the command parameters you can use to run JMX actions. JMX actions are one or more JMX calls (invoke, get, set) performed on an MBean instance or type. A single JMX call can be performed from the command line. Multiple JMX calls can be specified in an XML file or as a Metric sub-element in a UDM file.
-r (report) Generate an ASCII report for the specified metric(s).
Syntax: -r
-t (tag) enables you to create a new policy group by adding a prefix to an existing collector policy along with the metric numbers.
Syntax: wasspi_perl -S wasspi_ca -prod wbs -m <metric_number> -t <prefix>-Example: wasspi_perl -S wasspi_ca -prod wbs -m 220-223 -t DEV-
-prod (production) Identifies the SPI(s) on which the command is run on the node.
Syntax: -prod <Name of the SPI>-Example: wasspi_perl -S wasspi_ca -prod wbs -m 220-223 -t DEV-
-x Enables you to specify a property and value.Syntax: -x <property>=<property_value>where <property> can be one of the following:• alarm: When off, overrides any default alarming defined for the metric.
Example: -x alarm=off• prefix: Default: JMXUDM_. Specify the prefix of the metric ID.
Example: -x prefix=SALES_• print: When on, prints the metric name, instance name, and metric value
to STDOUT in addition to any configured alarming or logging.Example: -x print=on
• graph: When off, prevents graphing function.Example: -x graph=off
• report: When off, prevents reporting function.Example: -x report=off
Parameter Description Syntax with Example
Customizing WebSphere SPI Policies 47
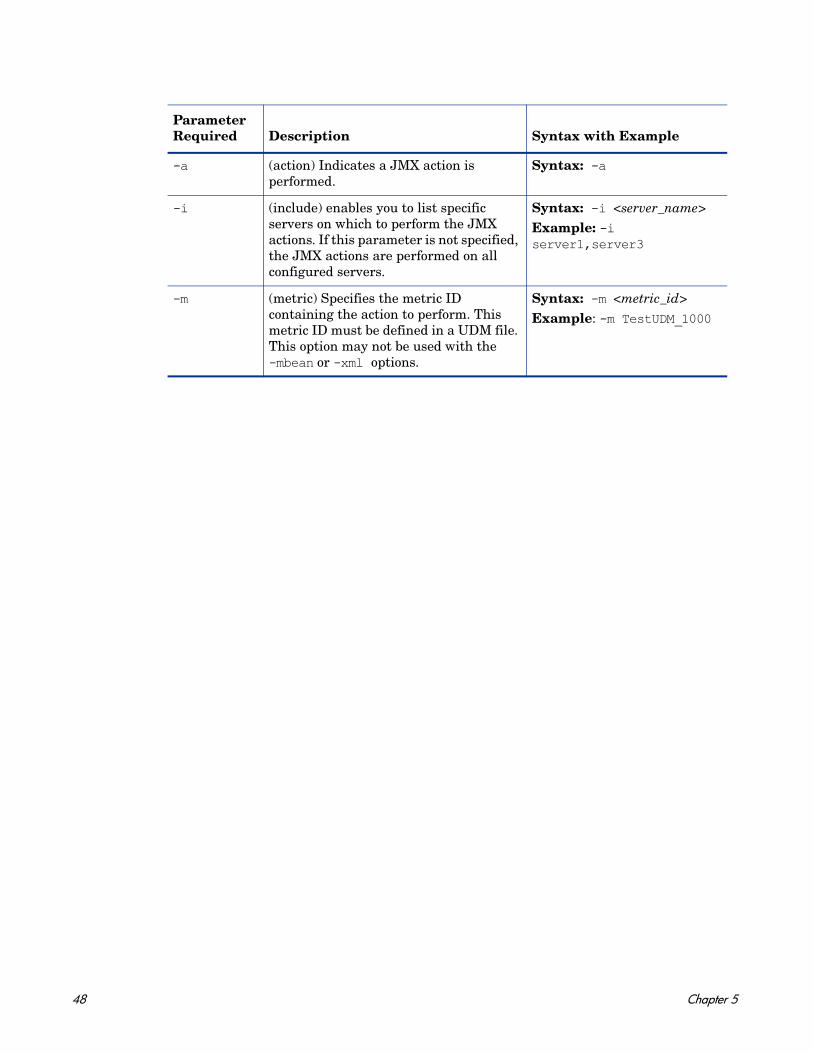
Parameter Required Description Syntax with Example
-a (action) Indicates a JMX action is performed.
Syntax: -a
-i (include) enables you to list specific servers on which to perform the JMX actions. If this parameter is not specified, the JMX actions are performed on all configured servers.
Syntax: -i <server_name>Example: -i server1,server3
-m (metric) Specifies the metric ID containing the action to perform. This metric ID must be defined in a UDM file. This option may not be used with the -mbean or -xml options.
Syntax: -m <metric_id>Example: -m TestUDM_1000
48 Chapter 5
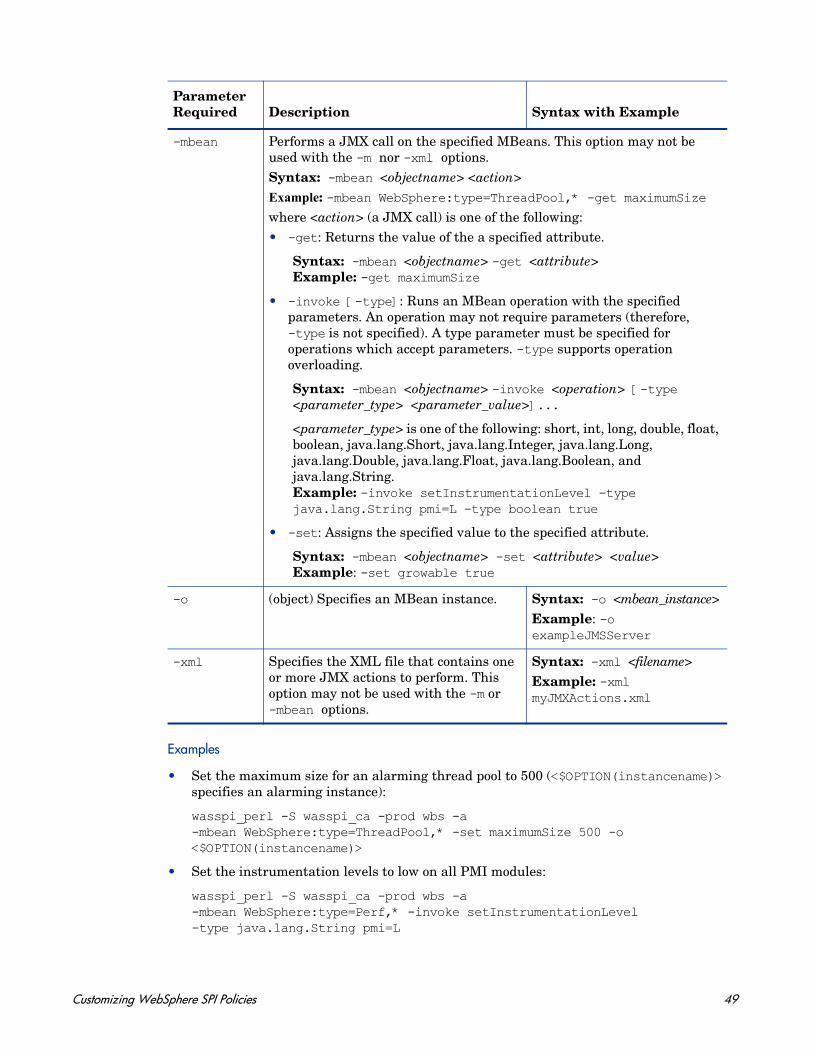
Examples
• Set the maximum size for an alarming thread pool to 500 (<$OPTION(instancename)> specifies an alarming instance):
wasspi_perl -S wasspi_ca -prod wbs -a -mbean WebSphere:type=ThreadPool,* -set maximumSize 500 -o <$OPTION(instancename)>
• Set the instrumentation levels to low on all PMI modules:
wasspi_perl -S wasspi_ca -prod wbs -a -mbean WebSphere:type=Perf,* -invoke setInstrumentationLevel -type java.lang.String pmi=L
-mbean Performs a JMX call on the specified MBeans. This option may not be used with the -m nor -xml options. Syntax: -mbean <objectname> <action>Example: -mbean WebSphere:type=ThreadPool,* -get maximumSizewhere <action> (a JMX call) is one of the following:• -get: Returns the value of the a specified attribute.
Syntax: -mbean <objectname> -get <attribute>Example: -get maximumSize
• -invoke [-type]: Runs an MBean operation with the specified parameters. An operation may not require parameters (therefore, -type is not specified). A type parameter must be specified for operations which accept parameters. -type supports operation overloading.
Syntax: -mbean <objectname> -invoke <operation> [-type <parameter_type> <parameter_value>]...
<parameter_type> is one of the following: short, int, long, double, float, boolean, java.lang.Short, java.lang.Integer, java.lang.Long, java.lang.Double, java.lang.Float, java.lang.Boolean, and java.lang.String.Example: -invoke setInstrumentationLevel -type java.lang.String pmi=L -type boolean true
• -set: Assigns the specified value to the specified attribute.
Syntax: -mbean <objectname> -set <attribute> <value>Example: -set growable true
-o (object) Specifies an MBean instance. Syntax: -o <mbean_instance>Example: -o exampleJMSServer
-xml Specifies the XML file that contains one or more JMX actions to perform. This option may not be used with the -m or -mbean options.
Syntax: -xml <filename>Example: -xml myJMXActions.xml
Parameter Required Description Syntax with Example
Customizing WebSphere SPI Policies 49

• Use the sample UDM TestUDM_1000 in the wasspi_wbs_UDMMetrics-sample.xml file:
wasspi_perl -S wasspi_ca -prod wbs -a -m TestUDM_1000 -i <Servername>
• Use the sample actions xml file:
wasspi_perl -S wasspi_ca -prod wbs -a -xml \<wasspi_wbs_conf_dir>\JMXActions-sample.xml -i <Servername>
Where, <wasspi_wbs_conf_dir> is \Documents and Settings\All Users\Application Data\HP\HP BTO Software\wasspi\wbs\conf.
Changing Collection Interval for Scheduled Metrics
You can change the collection interval for all scheduled metrics by changing the Polling Interval in the respective collector policy. For example, to change the collection interval of default metrics from 5 minutes to 10 minutes for the Medium-Impact policy WBSSPI-Med-05min, follow these steps:
1 From the HPOM console, select Operations Manager Policy management Policy groups SPI for WebSphere Medium-Impact Monitor.
2 Right-click the collector policy WBSSPI-Med-05min and select All Tasks Edit.
The Measurement Threshold window opens.
3 Click File Save As.
The Save As window opens.
4 Change the existing name in the Name box to WBSSPI-Med-10min. Click OK.
5 Set the new interval.
a Click the Schedule tab.
b From the Schedule Task list select “Once per interval”.
c Set the interval to 10 minutes.
6 Click Save and Close.
7 Deploy the new policies.
a Right-click WBSSPI-Med-10min and select All Tasks Deploy on....
b Select the nodes on which to deploy the policy.
c Click OK.
Changing Collection Interval for Selected Metrics
You can change the collection interval of metrics, according to the requirements of your environment. For example, you can change the collection interval from 5 minutes to 10 minutes for metrics 72-73 of the collector policy WBSSPI-Med-05min. You can change the collection interval of any metric using these steps.
To change the collection interval, follow these steps:
1 Rename the selected metrics to reflect the new interval.
50 Chapter 5
a From the HPOM console, select Operations Manager Policy management Policy groups SPI for WebSphere Medium-Impact WBSSPI-Monitors.
b Right-click the collector policy WBSSPI-Med-05min and select All Tasks Edit....
The policy window opens.
c Click File Save As.
The Save As window opens.
d In the Name box change the existing name to WBSSPI-Med-10min. Click OK to confirm save or click Cancel to discard changes.
2 In the Command box, delete all metrics after the -m except 72-73.
3 Set the new interval.
a Click the Schedule tab.
b From the Schedule Task list select “Once per interval”.
c Set the interval to 10 minutes.
d Click Save and Close to save the changes.
4 Edit the original policy to remove the modified metrics.
a Right-click the policy WBSSPI-Med-05min and select All Tasks Edit.
The policy window opens.
b In the Command text box, delete metrics 72-73 after -m.
c Click Save and Close to save the changes.
5 Deploy the modified policies.
a Right-click WBSSPI-Med-10min and select All Tasks Deploy on....
b Select the nodes on which you want to deploy the policy.
c Click OK.
d Right-click WBSSPI-Med-05min and repeat steps b-d.
Customizing Threshold for Different Servers
You can set different threshold values for the same metric (by modifying the related metric policy) on different servers according to your needs. For example, you may want to set the threshold for metric 0212 at 100 for SERVER_1 but let the threshold be 90 for all other servers. To do this you can copy the existing condition and modify it to serve as the exception. Follow these steps:
1 Double-click the metric policy (for example, double-click WBSSPI-0212).
The Measurement Threshold window opens.
2 Select the Threshold levels tab.
3 Select the required condition and click Copy to make a copy of the condition.
4 Name the condition– WBSSPI-0212.2.
5 Click Specify instance filters....
The New Rule window opens.
6 Select the Condition tab and in the Object Pattern field, type the following details:
Customizing WebSphere SPI Policies 51

<ServerName.var1>:<ServerPort.var2>:<NodeName.var3>:<*.var4>:<*.var5>:<*.var6>
For Example: If you want to set threshold for the application server SERVER_1, enter the following:
SERVER1:<*.var2>:<*.var3>:<*.var4>:<*.var5>:<*.var6>
var1, var2, var3, var4, var5, and var6 are user defined variables. These variables must be different from the HPOM policy variables.
7 Click OK.
8 Double-click the condition WBSSPI-0212.2.
The Threshold Level window opens.
9 Change the threshold limit to 100. Click OK.
10 In the Measurement Threshold window, click Save and Close to save the changes and exit.
Creating Custom Policies
You can customize a policy by using the tag option (-t on the command line) that enables the collector or analyzer to recognize customized policies that have a tag attached to the name. This option gives you the flexibility of using more than a single set of policies to define conditions related to specific installations of WebSphere Application Server. It also preserves policies from being overwritten when an upgraded version of the WebSphere SPI is installed.
When multiple nodes are managed by a number of groups, you can use this option to create specially tagged policies that are separate from your original setup. In such a case, make copies of the policies, rename them with the tag, rework the collector policy to pick up the tagged names, and then assign them to various groups.
For example, you may create a group of policies and change each policy name to include CLIENT01 in it. You may name a metric policy as CLIENT01-WBSSPI_0212 (retaining the name of the metric used). You may name the collector policy as FIRST_CLIENT-40_05min. Similarly, you may set up another group for SECOND_CLIENT and modify the policy names to include SECOND_CLIENT.
To create the new policy group, follow these steps:
1 Copy the original policy group.
a Right-click the policy group you want to copy and select Copy.
For example, right-click the Metrics policy group under High-Impact and select Copy.
b Right-click the group under which this policy group is located and select Paste. For example, right-click High-Impact and select Paste.
c Right-click Copy of Metrics and select Rename. Rename the new group to identify the new metric and collector policies. For example, rename the group to CLIENT01HighImpactMetrics.
2 Rename the original policies within the new policy group.The names of the metric policies in the new group must contain the new name followed by the original metric number. For example, you can rename a copy of WBSSPI_0001 as CLIENT01-WBSSPI_0001.
The name you give to the new collector policy must also contain the identifying name. You must also modify the scheduled collection to include the new group by inserting the -t property in the Command box. The Command box is in the policy window that appears when you double-click the collector policy.
For example: wasspi_ca -prod wbs -m 16 -t CLIENT01-
52 Chapter 5
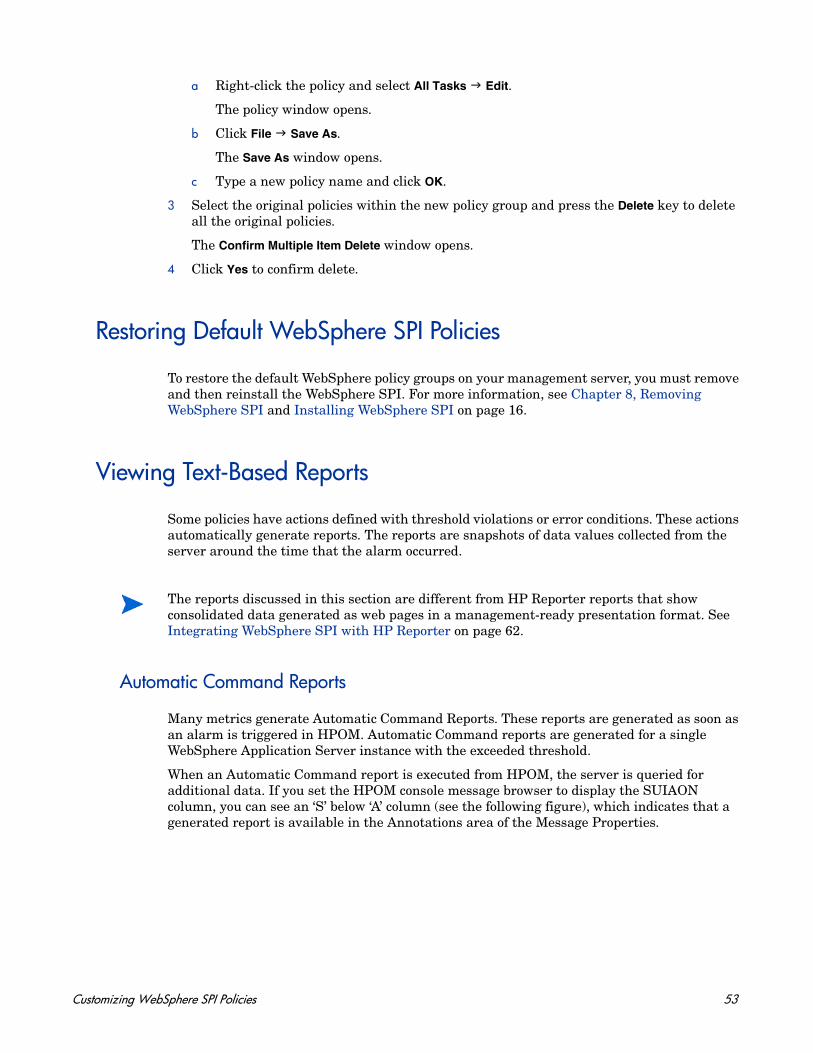
a Right-click the policy and select All Tasks Edit.
The policy window opens.
b Click File Save As.
The Save As window opens.
c Type a new policy name and click OK.
3 Select the original policies within the new policy group and press the Delete key to delete all the original policies.
The Confirm Multiple Item Delete window opens.
4 Click Yes to confirm delete.
Restoring Default WebSphere SPI Policies
To restore the default WebSphere policy groups on your management server, you must remove and then reinstall the WebSphere SPI. For more information, see Chapter 8, Removing WebSphere SPI and Installing WebSphere SPI on page 16.
Viewing Text-Based Reports
Some policies have actions defined with threshold violations or error conditions. These actions automatically generate reports. The reports are snapshots of data values collected from the server around the time that the alarm occurred.
Automatic Command Reports
Many metrics generate Automatic Command Reports. These reports are generated as soon as an alarm is triggered in HPOM. Automatic Command reports are generated for a single WebSphere Application Server instance with the exceeded threshold.
When an Automatic Command report is executed from HPOM, the server is queried for additional data. If you set the HPOM console message browser to display the SUIAON column, you can see an ‘S’ below ‘A’ column (see the following figure), which indicates that a generated report is available in the Annotations area of the Message Properties.
The reports discussed in this section are different from HP Reporter reports that show consolidated data generated as web pages in a management-ready presentation format. See Integrating WebSphere SPI with HP Reporter on page 62.
Customizing WebSphere SPI Policies 53
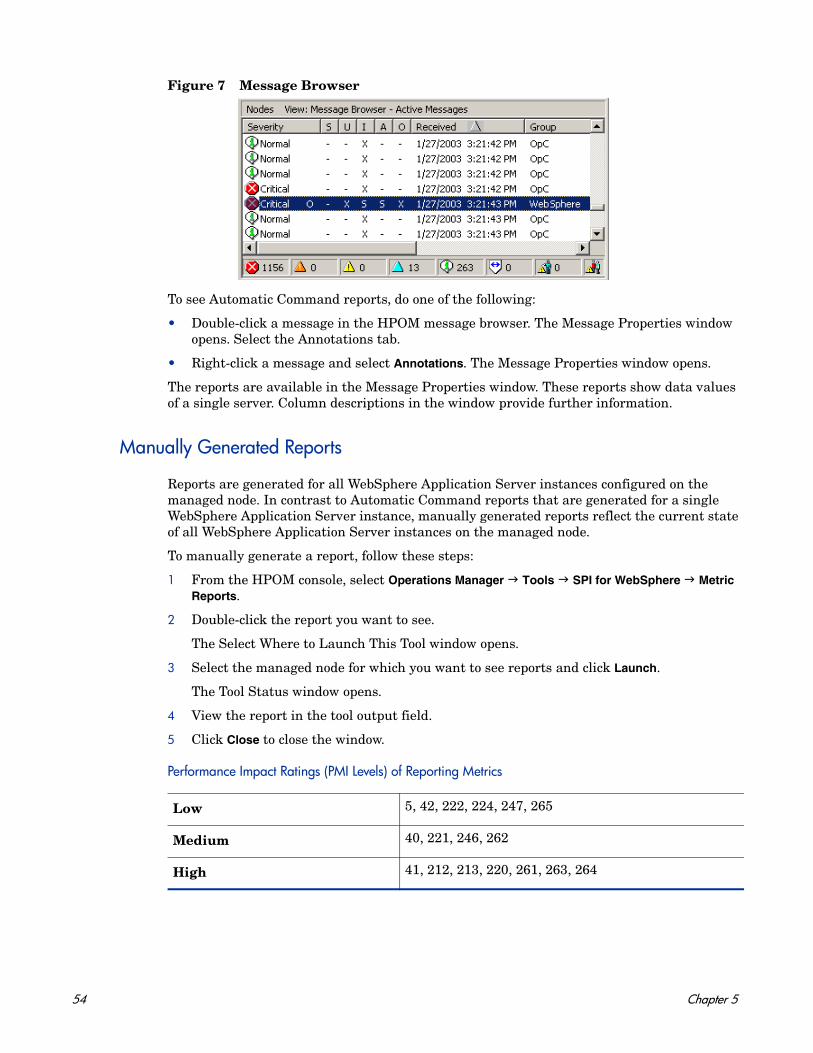
Figure 7 Message Browser
To see Automatic Command reports, do one of the following:
• Double-click a message in the HPOM message browser. The Message Properties window opens. Select the Annotations tab.
• Right-click a message and select Annotations. The Message Properties window opens.
The reports are available in the Message Properties window. These reports show data values of a single server. Column descriptions in the window provide further information.
Manually Generated Reports
Reports are generated for all WebSphere Application Server instances configured on the managed node. In contrast to Automatic Command reports that are generated for a single WebSphere Application Server instance, manually generated reports reflect the current state of all WebSphere Application Server instances on the managed node.
To manually generate a report, follow these steps:
1 From the HPOM console, select Operations Manager Tools SPI for WebSphere Metric Reports.
2 Double-click the report you want to see.
The Select Where to Launch This Tool window opens.
3 Select the managed node for which you want to see reports and click Launch.
The Tool Status window opens.
4 View the report in the tool output field.
5 Click Close to close the window.
Performance Impact Ratings (PMI Levels) of Reporting Metrics
Low 5, 42, 222, 224, 247, 265
Medium 40, 221, 246, 262
High 41, 212, 213, 220, 261, 263, 264
54 Chapter 5
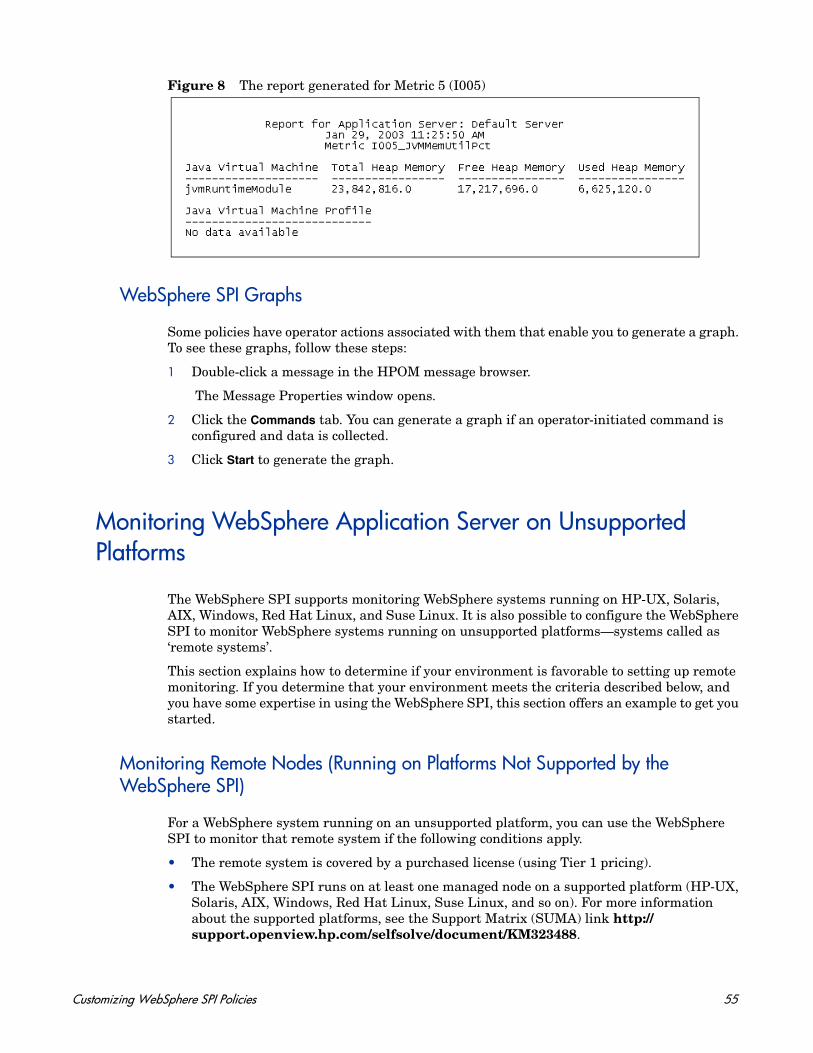
Figure 8 The report generated for Metric 5 (I005)
WebSphere SPI Graphs
Some policies have operator actions associated with them that enable you to generate a graph. To see these graphs, follow these steps:
1 Double-click a message in the HPOM message browser.
The Message Properties window opens.
2 Click the Commands tab. You can generate a graph if an operator-initiated command is configured and data is collected.
3 Click Start to generate the graph.
Monitoring WebSphere Application Server on Unsupported Platforms
The WebSphere SPI supports monitoring WebSphere systems running on HP-UX, Solaris, AIX, Windows, Red Hat Linux, and Suse Linux. It is also possible to configure the WebSphere SPI to monitor WebSphere systems running on unsupported platforms—systems called as ‘remote systems’.
This section explains how to determine if your environment is favorable to setting up remote monitoring. If you determine that your environment meets the criteria described below, and you have some expertise in using the WebSphere SPI, this section offers an example to get you started.
Monitoring Remote Nodes (Running on Platforms Not Supported by the WebSphere SPI)
For a WebSphere system running on an unsupported platform, you can use the WebSphere SPI to monitor that remote system if the following conditions apply.
• The remote system is covered by a purchased license (using Tier 1 pricing).
• The WebSphere SPI runs on at least one managed node on a supported platform (HP-UX, Solaris, AIX, Windows, Red Hat Linux, Suse Linux, and so on). For more information about the supported platforms, see the Support Matrix (SUMA) link http://support.openview.hp.com/selfsolve/document/KM323488.
Customizing WebSphere SPI Policies 55
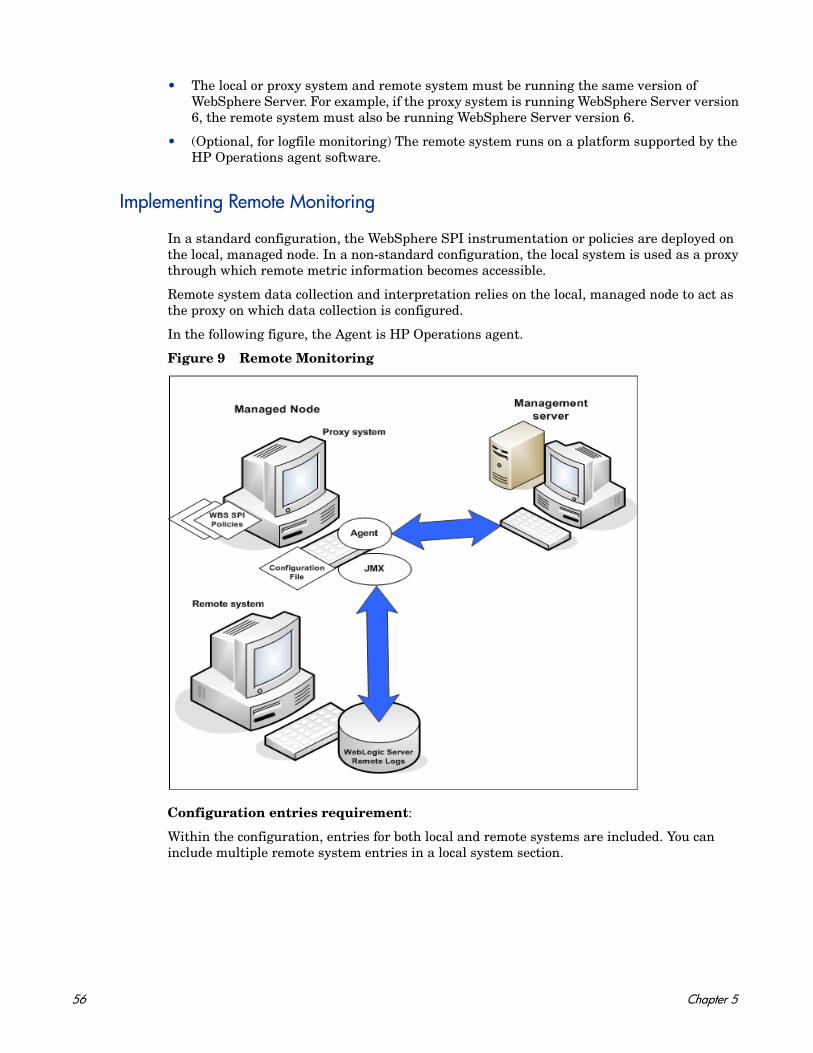
• The local or proxy system and remote system must be running the same version of WebSphere Server. For example, if the proxy system is running WebSphere Server version 6, the remote system must also be running WebSphere Server version 6.
• (Optional, for logfile monitoring) The remote system runs on a platform supported by the HP Operations agent software.
Implementing Remote Monitoring
In a standard configuration, the WebSphere SPI instrumentation or policies are deployed on the local, managed node. In a non-standard configuration, the local system is used as a proxy through which remote metric information becomes accessible.
Remote system data collection and interpretation relies on the local, managed node to act as the proxy on which data collection is configured.
In the following figure, the Agent is HP Operations agent.
Figure 9 Remote Monitoring
Configuration entries requirement:
Within the configuration, entries for both local and remote systems are included. You can include multiple remote system entries in a local system section.
56 Chapter 5
Policy deployment requirement:
Policies for the correct WebSphere PMI level must be deployed on the local node. If you need a separate policy group (for example, High-Impact or Medium-Impact) to cover a different level, you can copy and rename the existing policies and specify the WebSphere Server name on the command line using the -i or -e options.
HP Operations agent deployment requirement (optional logfile monitoring):
To access remote WebSphere logfiles, the HP Operations agent software must be installed on the remote system. Using standard HPOM processes, you can modify the standard logfile policies included with the WebSphere SPI to specify the correct logfile names, then deploy them to the remote system.
Configuring Remote System Monitoring
You can monitor WebSphere Application Servers on remote systems (running on operating systems other than HP-UX, Solaris, AIX, Windows, Red Hat Linux, or Suse Linux) by completing the following tasks.
Prerequisite
You must not enable administrative security on the remote systems. If you have enabled the administrative security on the remote systems, add the remote node signer to the local node's trust store to succeed the handshake.
Configuring Remote WebSphere System
Using the Discover or Configure WBSSPI tool of the SPI Admin tools group, configure each local managed node that communicates with a remote WebSphere server. In the configuration, add entries for remote WebSphere servers.
1 Start the Discover or Configure WBSSPI tool. For details, see Starting Configure Tool on page 24.
2 Select a WebSphere managed node from which to monitor the remote WebSphere server.
3 Right-click on the node and select Add Application Server.
The Configure WBSSPI tool: Add App Server window appears.
4 Type the Application Server Name. This is the name of the remote WebSphere Server.
5 Type the Server Port.
6 Set the configuration properties by selecting the property from the Select a Property to Set... list, click Set Property, and set the value for the property.
In the configuration that appears, include an entry for each remote WebSphere Server system: LOGIN, PASSWORD, ADDRESS, VERSION, HOME, JAVA_HOME, PROFILE_HOME. The values for LOGIN, PASSWORD, ADDRESS, and VERSION must be of the remote system and the values for HOME, JAVA_HOME, PROFILE_HOME must be of the local system. Type an user defined value to ALIAS.
For example:
SERVER1_ADDRESS=15.155.81.123
Monitoring remote systems using logfile versioning is not supported.
Customizing WebSphere SPI Policies 57
SERVER1_ALIAS=dmgr on server1 port 8809SERVER1_HOME=C:/Program Files/IBM/WebSphere/AppServerSERVER1_JAVA_HOME=C:/Program Files/IBM/WebSphere/AppServer/javaSERVER1_LOGIN=adminSERVER1_NAME=dmgrSERVER1_PASSWORD=adminSERVER1_PORT=8809SERVER1_PROFILE_HOME=C:/Program Files/IBM/WebSphere/AppServer/profiles/Dmgr01SERVER1_VERSION=7.0.0
7 Click Save to save any changes made to the configuration. After you save the changes, you cannot undo the changes automatically.
8 Click Next.
9 Select the local server and click OK.
10 Click Finish to exit the editor and start configuring the WebSphere SPI on the local server.
After the configuration is successful, run discovery on the local node (see Starting Discover Tool on page 21) and verify the discovery process (see Verifying Discovery Process on page 24).
Integrate HP Performance agent (Optional)
The HP Performance agent collection occurs on the managed node, not the remote system. Therefore, if you use HP Performance Manager and want to graph the remote system data, make sure that HP Performance agent integration is enabled on the local managed node.
Deploy Policies to the Local Node
Deploy a policy group to the local managed node. For example, deploy the High-Impact policy group on the local node if the local and remote managed nodes are to collect metrics that require the system be set at a high WebSphere PMI level.
1 From the HPOM console, select Operations Manager Policy management Policy groups SPI for WebSphere.
2 Right-click a policy group and select All Tasks Deploy on.
3 Select the local managed node.
4 Click OK.
Configuring Remote Monitoring for Logfile (Optional)
Monitoring remote system logfiles is supported if the following are true:
1 The HP Operations agent is running on the remote system.
2 The system does not re-version logfiles when they roll.
To set up logfile monitoring, in the HPOM console, copy the WebSphere SPI logfile policy and then configure, assign, and deploy the copied logfile policy to the remote system.
If you click Cancel, the changes made by you are not saved to the selected managed nodes’ configuration and remain in the configuration on the management server.
58 Chapter 5
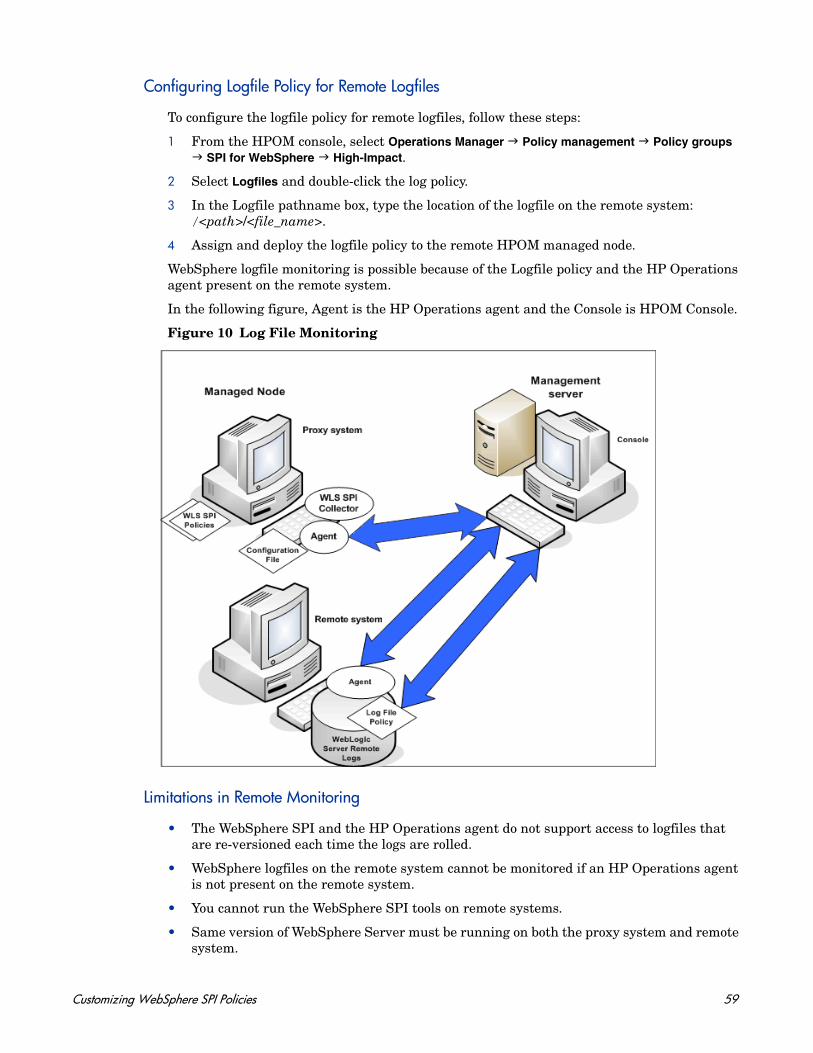
Configuring Logfile Policy for Remote Logfiles
To configure the logfile policy for remote logfiles, follow these steps:
1 From the HPOM console, select Operations Manager Policy management Policy groups SPI for WebSphere High-Impact.
2 Select Logfiles and double-click the log policy.
3 In the Logfile pathname box, type the location of the logfile on the remote system:/<path>/<file_name>.
4 Assign and deploy the logfile policy to the remote HPOM managed node.
WebSphere logfile monitoring is possible because of the Logfile policy and the HP Operations agent present on the remote system.
In the following figure, Agent is the HP Operations agent and the Console is HPOM Console.
Figure 10 Log File Monitoring
Limitations in Remote Monitoring
• The WebSphere SPI and the HP Operations agent do not support access to logfiles that are re-versioned each time the logs are rolled.
• WebSphere logfiles on the remote system cannot be monitored if an HP Operations agent is not present on the remote system.
• You cannot run the WebSphere SPI tools on remote systems.
• Same version of WebSphere Server must be running on both the proxy system and remote system.
Customizing WebSphere SPI Policies 59

60 Chapter 5
6 Integrating WebSphere SPI with HP Reporting and Graphing Solutions
The WebSphere SPI can be integrated with the following HP products. These products must be purchased separately.
• HP Reporter
HP Reporter produces management-ready, web page reports, showing historical and trends related information.
After you integrate HP Reporter with the WebSphere SPI, Reporter generates a variety of reports, every night, that show consolidated information about the performance and availability of WebSphere Application Servers on configured managed nodes. See Integrating WebSphere SPI with HP Reporter on page 62.
• Performance Insight
Performance Insight (PI) is a network management system that collects, processes, and reports data. This data is used to generate reports. For more information, see the HP Performance Insight Administration Guide.
For information about the WebSphere SPI reports and integrating WebSphere SPI with PI, see the Application Server Report Pack User Guide.
• HP Performance Manager
HP Performance Manager provides graphing capability.
After you integrate HP Performance Manager with the WebSphere SPI, you can view the graphs the following day. However, the graphs are available only if performance data is logged in the default performance subagent CODA or HP Performance agent. CODA is automatically deployed on all HPOM managed nodes.
See Integrating WebSphere SPI with HP Performance Manager on page 65.
61
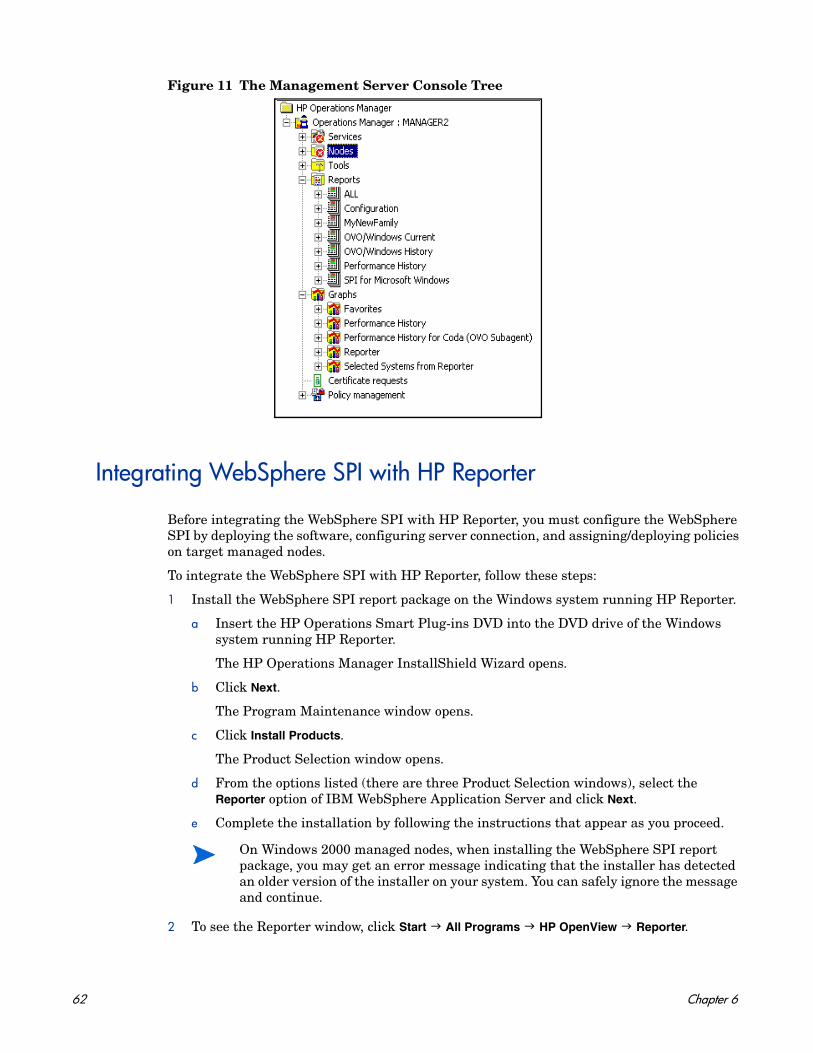
Figure 11 The Management Server Console Tree
Integrating WebSphere SPI with HP Reporter
Before integrating the WebSphere SPI with HP Reporter, you must configure the WebSphere SPI by deploying the software, configuring server connection, and assigning/deploying policies on target managed nodes.
To integrate the WebSphere SPI with HP Reporter, follow these steps:
1 Install the WebSphere SPI report package on the Windows system running HP Reporter.
a Insert the HP Operations Smart Plug-ins DVD into the DVD drive of the Windows system running HP Reporter.
The HP Operations Manager InstallShield Wizard opens.
b Click Next.
The Program Maintenance window opens.
c Click Install Products.
The Product Selection window opens.
d From the options listed (there are three Product Selection windows), select the Reporter option of IBM WebSphere Application Server and click Next.
e Complete the installation by following the instructions that appear as you proceed.
2 To see the Reporter window, click Start All Programs HP OpenView Reporter.
On Windows 2000 managed nodes, when installing the WebSphere SPI report package, you may get an error message indicating that the installer has detected an older version of the installer on your system. You can safely ignore the message and continue.
62 Chapter 6
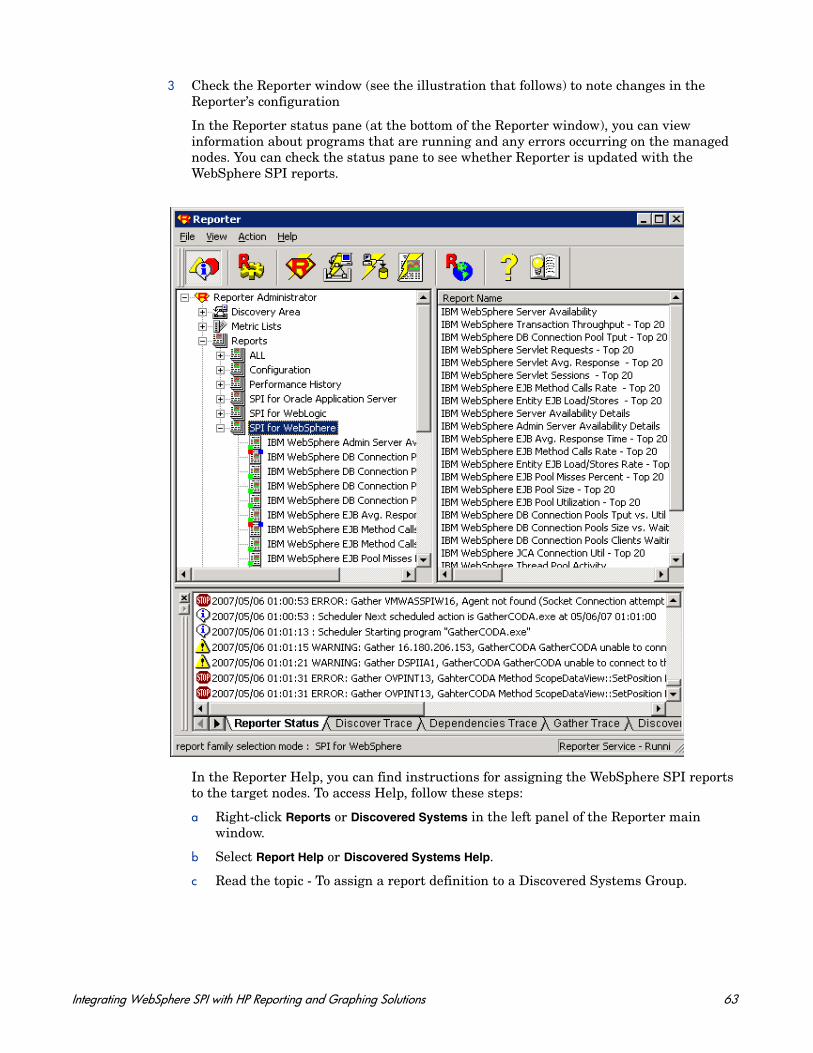
3 Check the Reporter window (see the illustration that follows) to note changes in the Reporter’s configuration
In the Reporter status pane (at the bottom of the Reporter window), you can view information about programs that are running and any errors occurring on the managed nodes. You can check the status pane to see whether Reporter is updated with the WebSphere SPI reports.
In the Reporter Help, you can find instructions for assigning the WebSphere SPI reports to the target nodes. To access Help, follow these steps:
a Right-click Reports or Discovered Systems in the left panel of the Reporter main window.
b Select Report Help or Discovered Systems Help.
c Read the topic - To assign a report definition to a Discovered Systems Group.
Integrating WebSphere SPI with HP Reporting and Graphing Solutions 63
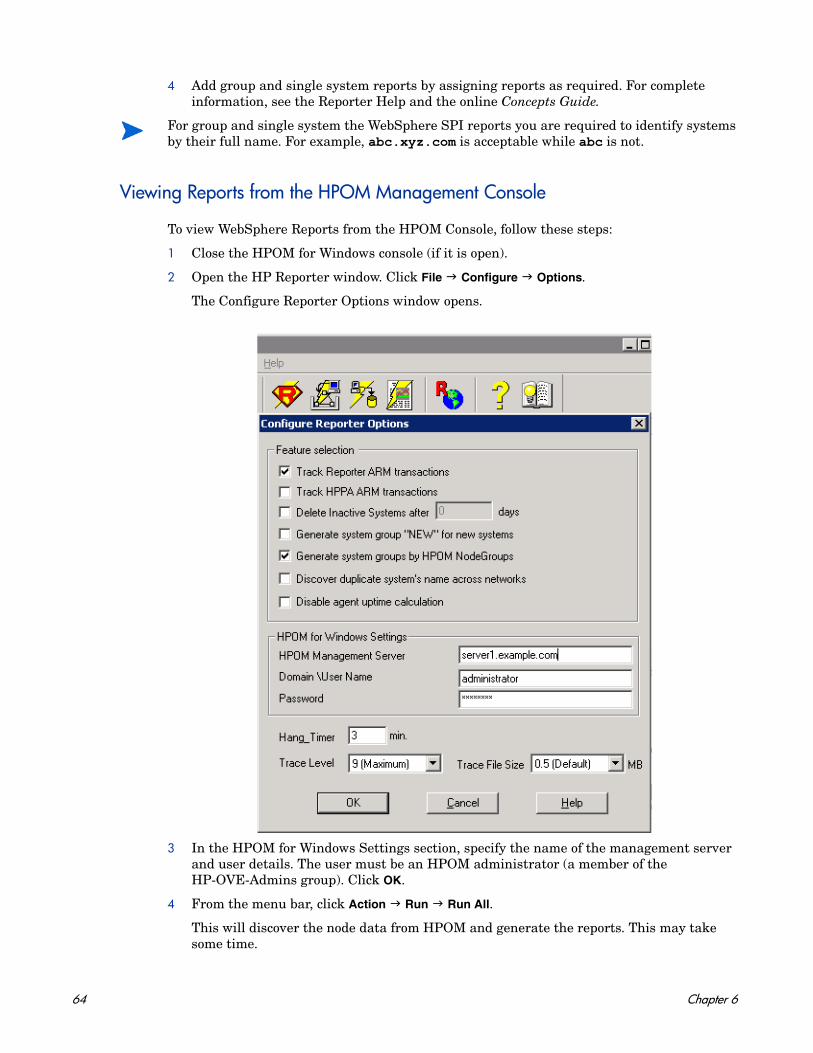
4 Add group and single system reports by assigning reports as required. For complete information, see the Reporter Help and the online Concepts Guide.
Viewing Reports from the HPOM Management Console
To view WebSphere Reports from the HPOM Console, follow these steps:
1 Close the HPOM for Windows console (if it is open).
2 Open the HP Reporter window. Click File Configure Options.
The Configure Reporter Options window opens.
3 In the HPOM for Windows Settings section, specify the name of the management server and user details. The user must be an HPOM administrator (a member of the HP-OVE-Admins group). Click OK.
4 From the menu bar, click Action Run Run All.
This will discover the node data from HPOM and generate the reports. This may take some time.
For group and single system the WebSphere SPI reports you are required to identify systems by their full name. For example, abc.xyz.com is acceptable while abc is not.
64 Chapter 6
5 After the HP Reporter tasks complete, open the HPOM console. Reports will be visible in the console tree.
Removing WebSphere SPI Reporter Package
To remove the WebSphere SPI Reporter Package, follow these step:
1 Insert the HP Operations Smart Plug-ins DVD into the DVD drive of the Windows system running Reporter.
The HP Operations Manager InstallShield Wizard opens.
2 Click Next.
The Program Maintenance window opens.
3 Click Remove Products.
The Product Selection window opens.
4 From the options listed (there are three Product Selection windows), select the Reports option of IBM WebSphere Application Server and click Next till the Remove the Selected Products window opens.
5 Click Remove.
Integrating WebSphere SPI with HP Performance Manager
You must purchase and install HP Performance Manager, separately. To integrate the WebSphere SPI with HP Performance Manager, follow these steps:
1 Install the WebSphere SPI graph package on the Windows system running HP Performance Manager:
a Insert the HP Operations Smart Plug-ins DVD into the DVD drive of the Windows system running Reporter.
The HP Operations Manager InstallShield Wizard opens.
b Click Next.
The Program Maintenance window opens.
c Click Install Products.
The Product Selection window opens.
d From the options listed (there are three Product Selection windows), select the Graph option of IBM WebSphere Application Server and click Next.
e Complete the installation by following the instructions as you proceed.
2 To graph any WebSphere metric, use the data source name: WBSSPI_METRICS.
The browser fails when the report is huge and the user hence is unable to view the report (in HTML). The workaround is the reports should be viewed in pdf.
Integrating WebSphere SPI with HP Reporting and Graphing Solutions 65
Viewing Graphs Showing Alarm Conditions
For graphing purposes, the WebSphere SPI organizes metrics according to type. When a message is generated for any metric (listed in the tables in the following section), you can view a chart of that metric along with other metric values.
To view a graph associated with an alarm condition (operator-initiated action has been defined with the WebSphere SPI policy), follow these steps:
1 In the HPOM message browser, double-click the message for which you want to view the graph.
The Message Properties window opens.
2 Click the Commands tab.
3 Click Start in the section Operator Initiated to start the operator-initiated command.
The operator action starts your web browser, where you can view the graph.
Viewing Graphs Showing Past or Current Conditions
To generate an available graph manually, follow these steps:
1 From the HPOM console, select Operations Manager Graphs SPI for WebSphere.
2 Double-click the graph you want to generate.
A new window opens.
3 Select the nodes from which you want to retrieve data. Select the date range and the granularity for the graph.
4 Click Finish.
Viewing Graphs from HP Performance Manager Console
If you have not installed HP performance Manager on the same system as HPOM management server, you can view the WebSphere SPI Graphs from the HP Performance Manager console. Follow these steps:
1 Click Start All Programs HP HP BTO Software Performance Manager Performance Manager.
The Performance Manager console opens.
2 From the Select Nodes pane, select the node for which you want to see graph. If the node is not listed in the list, add the node:
a Click Admin in the menu bar.
The Manage Nodes window opens.
b Click the Add a Node icon.
The Add a Node Window opens.
Graphs appears in the HPOM console tree only if you install HP Performance Manager on the same system as the HPOM management server.
66 Chapter 6
c Type the node name and click Add.
d Click Home on the menu bar.
3 From the Select a Graph pane, select SPI for WebSphere.
4 Select the graph you want to see and click Draw.
Removing WebSphere SPI Graphing Package
To remove the WebSphere SPI Graphing package, follow these steps:
1 Insert the HP Operations Smart Plug-ins DVD into the DVD drive of the Windows system running Performance Manager.
The HP Operations Manager InstallShield Wizard opens.
2 Click Next.
The Program Maintenance window opens.
3 Click Remove Products.
The Product Selection window opens.
4 From the options listed (there are three Product Selection windows), select the Graphs option of IBM WebSphere Application Server and click Next.
The Remove Selected Products window opens.
5 Click Remove.
If you have installed HP Performance Agent to collect performance data, you must select the SPI for WebSphere - OVPA <version> from the list in the Select a Graph pane.
Integrating WebSphere SPI with HP Reporting and Graphing Solutions 67

68 Chapter 6
7 Troubleshooting
This chapter covers basic troubleshooting for the WebSphere SPI. The topic Error Messages in the HP Operations Smart Plug-in for IBM WebSphere Application Server Online Help and HP Operations Smart Plug-in for IBM WebSphere Application Server Online Help PDF lists error messages by number.
Self-Healing Info Tool
The Self-Healing Info tool gathers troubleshooting information about the SPI and stores it in a file that you can submit to HP support for assistance. For more information about this tool, see the HP Operations Smart Plug-in for IBM WebSphere Application Server Online Help and HP Operations Smart Plug-in for IBM WebSphere Application Server Online Help PDF.
Log File Monitoring
Log file monitoring for WebSphere Application Server is now done through JMX event notification. Log file monitoring is supported on both federated servers as well as standalone installations.
When the collector is run for the first time, the WebSphere SPI is registered to receive the notifications directly from the WebSphere Application Server. The notification messages are written into log files which are monitored by the WBSSPI LogFile Policies, depending on the configuration of the WebSphere SPI. The following use cases explain the different scenarios:
Use Case 1: You have implemented the network deployer scenario (DISTRIBUTED_MODE=TRUE in SPIConfig file).
All the notification messages received from all the servers (including deployment manager, node agents, and federated servers) configured to the Distributed Managers are written in the wbs.log file. The file is located at <OvAgentDir>/wasspi/wbs/log/ (by default, <OvAgentDir> is /var/opt/OV/ for UNIX and \Documents and Settings\All Users\Application Data\HP\HP BTO Software\ for Windows). WebSphere SPI maintains one archived file (wbs.log.1) of size 10MB.
The file created by the Self-Healing Info tool may be hidden on some Windows managed nodes. If you do not see the file, open Windows Explorer and from the Tools menu, select Folder Options. Click the View tab. Under Hidden files and folders, select Show hidden files and folders.
Log files are monitored when the collector is running in PERSISTANT mode. By default, the collector runs in PERSISTANT mode.
69
Use Case 2: You have not implemented the network deployer scenario (DISTRIBUTED_MODE=FALSE in SPIConfig file).
All the notification messages received from the servers (that are discovered and listed in the SiteConfig file) are written in the wbs_<servername>.log file. <servername> is the name of the server corresponding to the entry in the SiteConfig file. One log file is maintained per server.
For example: If there are three discovered servers (S1, S2, S3) in your environment, the notification messages will be written in wbs_S1.log, wbs_S2.log, and wbs_S3.log.
The file is located at <OvAgentDir>/wasspi/wbs/log/wbs_<servername>.log (by default. WebSphere SPI maintains an archived file (wbs_<servername>.log.1) of 10MB for each discovered server.
Use Case 3: You have implemented the network deployer scenario, but want to use the WebSphere SPI discarding the network deployer scenario (OVERRIDE_DISTRIBUTED_MODE=TRUE in SPIConfig file).
All the notification messages from all the servers (which are discovered and listed in the SiteConfig or SPIConfig file) are written in the wbs_<servername>.log file. <servername> is the name of the server corresponding to the entry in SiteConfig. WebSphere SPI maintains one log file for each of the servers.
For example: If there are four discovered servers (S1, S2, S3,S4) in your environment, the notification messages are written into wbs_S1.log, wbs_S2.log, wbs_S3.log, and wbs_S4.log.
The file is located at <OvAgentDir>/wasspi/wbs/log/. WebSphere SPI maintains an archived file (wbs_<servername>.log.1) of 10MB for each discovered server.
Logging
The files for logging are maintained on the managed nodes. You can gather troubleshooting information about the WebSphere SPI from the data logged in these files.
Managed Nodes
The following files are found on the managed nodes running on UNIX and Windows (typically, <OvAgentDir>/ is /var/opt/OV/ for Unix and \Documents and Settings\All Users\Application Data\HP\HP BTO Software\ for Windows):
JMX Notification does not monitor SystemOut.log and SystemErr.log files. These files are still monitored through the WebSphere Text Logs policy. Therefore, the WebSphere SPI monitors SystemOut.log and SystemErr.log files for deployment managers and the configured servers (excluding node agents) only if the files reside on the same node (physical computer) where the SPI is deployed.
70 Chapter 7
Directory <OvAgentDir>/wasspi/wbs/log/wasspi_perl.log (archived files have a one digit number appended to the filename)
Description File used by your HP support representative for debugging. This file gives you information about the Perl logging (configuration, discovery, and collection). By default, you can only view the error messages. To view all types of messages (info, warn, and error), run the Start Tracing tool. To stop the tracing, run the Stop Tracing tool. For more information about how to run these tools, see the Online Help or Online Help PDF. By default, the size of the log file is 10MB and three archived versions are kept.
Directory <OvAgentDir>/wasspi/wbs/log/Discovery.log (archived files have a one digit number appended to the filename).
Description File used by your HP support representative for debugging. This file gives you information about the Java discovery logging. By default, you can only view the error messages. To view all types of messages (info, warn, and error), run the Start Tracing tool. To stop the tracing, run the Stop Tracing tool. For more information about how to run these tools, see the Online Help or Online Help PDF. By default, the size of the log file is 10MB and three archived versions are kept.
Directory <OvAgentDir>/wasspi/wbs/log/Collector.log (archived files have a one digit number appended to the filename).
Description File used by your HP support representative for debugging. This file gives you information about the Java Collector logging for the CollectorServer. By default, you can only view the error messages. To view all types of messages (info, warn, and error), run the Start Tracing tool. To stop the tracing, run the Stop Tracing tool. For more information about how to run these tools, see the Online Help or Online Help PDF. By default, the size of the log file is 10MB and three archived versions are kept.
Directory <OvAgentDir>/wasspi/wbs/log/CollectorClient.log (archived files have a one digit number appended to the filename).
Description File used by your HP support representative for debugging. This file gives you information about the Java Collector logging for the CollectorClient. By default, you can only view the error messages. To view all types of messages (info, warn, and error), run the Start Tracing tool. To stop the tracing, run the Stop Tracing tool. For more information about how to run these tools, see the Online Help or Online Help PDF. By default, the size of the log file is 10MB and three archived versions are kept.
Troubleshooting 71
Collection
Problem In a Network Deployment configuration, the collector fails if all the node agents or all the application servers connected to the corresponding node agent stops running. The following error message is displayed when the collection fails: Unable to collect from server ’dmgr’ : Empty objectname set returned from queryNames call for objectname'WebSphere:processType=ManagedProcess,type=Server,*'.
Solution To ensure that the SPI collector works, atleast one node agent and one of the corresponding application servers connected to the node agent must be running.
Problem No alarms are received for a metric.
Solution • Verify that the monitor policy corresponding to the metric is deployed on the node.
• Verify that alarm=yes is specified in the <OvAgentDir>/wasspi/wbs/conf/MetricDefinitions.xml file for the metric.
Problem On manually running the collector command on the managed node, the value of the metric is printed as No instance,No data on STDOUT.
Solution Check the Admin Console for the presence of corresponding MBeans.
Problem Data is not getting logged.
Solution • Verify that the SPIDataCollector instrumentation category is deployed on the managed node. This is required to create the datasource WBSSPI_METRICS.
• Verify that the WBSSPI-Performance policy is deployed on the node.• Check if the <servername>.dat file is created in <OvAgentDir>/
wasspi/wbs/datalog.• Check if the datasource WBSSPI_METRICS is created.• Verify that graph=yes is specified in the <OvAgentDir>/wasspi/
wbs/conf/MetricDefinitions.xml for the metrics which are being monitored. Only the metrics which are specified as graph=yes in the MetricDefinitions.xml get logged. The default value is no.
72 Chapter 7
Discovery Process
Problem
The WBSSPI Discovery policies do not automatically discover and update the WebSphere SPI configuration.
Solutions
To troubleshoot the discovery process, do one or more of the following (as applicable):
• Check if the WBSSPI Discovery policies are still being deployed:
From the HPOM console, select Operations Manager Policy management Deployment jobs.
• If the state of a WBSSPI Discovery policy is Active, then the policy is still being deployed. Wait for the deployment of the policy to complete.
• If the state of a WBSSPI Discovery policy is Suspended or Error, then check for any error messages in the message browser and continue to troubleshoot the problem by reading the rest of this section.
• If the WBSSPI Discovery policies are not listed, check the message browser for the following message:
WASSPI-502: INFO - Updating the WBSSPI configuration data with discovered information
If this message is present and the letter “S” (for successful) appears in the A column, the WBSSPI Discovery policies are successfully deployed. If this message is not present or the letter “F” appears in the A column, the WBSSPI Discovery policies are not successfully deployed.
Continue to troubleshoot the problem by reading the rest of this section.
• Verify the WebSphere Application Server status. The application server must be working. For more information, see Verify Application Server Status on page 19.
• Verify that the Discover or Configure WBSSPI tool is not running or a configuration is not open in an editor. Only one process can access a configuration at a time. If a configuration is open, other processes that must access that file (like the discovery policy) hang until the file becomes available.
• If the service map is not updated and the Medium-Impact policy group is not deployed, do the following:
Problem Reporting data is not getting logged and you receive the following error message: ’WBSSPI-139: WASSPI-8: Error saving graphing or reporting data to file ’<OvAgentDir>/wasspi/wbs/datalog/reporter.log’.[Policy: WBSSPI Java Collector Error Log]’
Solution Update the SPIConfig file located at <OvDataDir>/wasspi/wbs/conf with the following value: DATA_LOGGING_EXECUTABLE_NAME=<OvDataDir>/bin/instrumentation/ddflog
Troubleshooting 73
— Verify the WebSphere application server status. The application server must be running. See Verify Application Server Status on page 19 for more information.
— Verify that the WebSphere Admin Server is running on the managed node. If you can start the WebSphere Admin Console, the WebSphere Admin Server is running.
Problem
In the SiteConfig file for Windows managed nodes, the value for HOME and JAVA_HOME appears as: HOME=CProgram FilesIBMWebSphereAppServer and JAVA_HOME=CProgram FilesIBMWebSphereAppServerjava. The ’\’ character is removed from the path.
Solution
Replace the character ’\’ with ’/’ or ’\\’ in the path for HOME and JAVA_HOME. For example, HOME=C:/Program Files/IBM/WebSphere/AppServer or HOME=C:\\Program Files\\IBM\\WebSphere\\AppServer.
Manually Deploying the Discovery Policies
If the WebSphere SPI Discovery policies are not deployed successfully when you run the Discover or Configure WBSSPI tool, you can manually deploy the policies on the managed nodes on which the WebSphere Admin Servers are running (you must deploy the policies in the given order only):
1 From the HPOM console, select Operations Manager Policy management Policy groups SPI for WebSphere WBSSPI Discovery.
2 Right-click WBSSPI-Messages and select All Tasks Deploy on.
The Deploy Policies on... window opens.
3 Select the nodes on which to deploy the auto-discovery policies and click OK.
4 Right-click WBSSPI Service Discovery and select All Tasks Deploy on.
The Deploy Policies On... window opens.
5 Select the nodes on which you want to deploy the auto-discovery policies and click OK.
Verifying Node Name
Verify that the node name specified in a node or group block matches the primary node name configured in HPOM. To display the primary node name, follow these steps:
a From the HPOM console, select Operations Manager Nodes.
b Right-click the node and select Properties.
c Select the Network tab.
74 Chapter 7
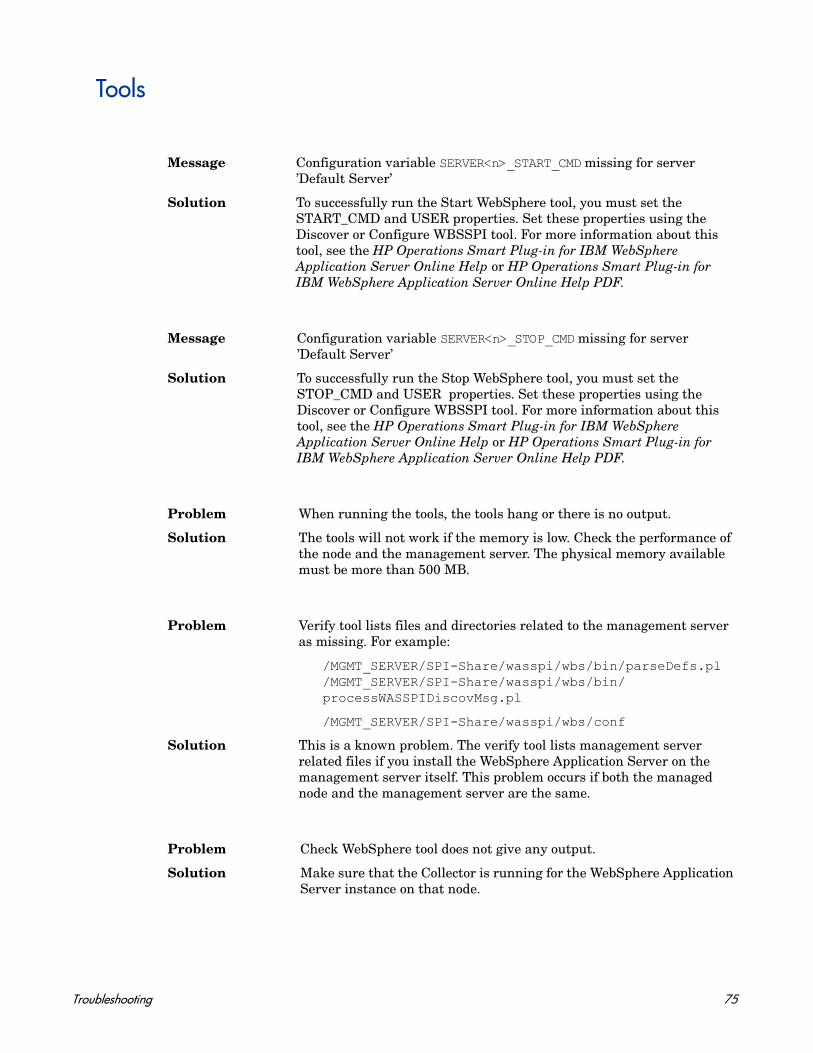
Tools
Message Configuration variable SERVER<n>_START_CMD missing for server ’Default Server’
Solution To successfully run the Start WebSphere tool, you must set the START_CMD and USER properties. Set these properties using the Discover or Configure WBSSPI tool. For more information about this tool, see the HP Operations Smart Plug-in for IBM WebSphere Application Server Online Help or HP Operations Smart Plug-in for IBM WebSphere Application Server Online Help PDF.
Message Configuration variable SERVER<n>_STOP_CMD missing for server ’Default Server’
Solution To successfully run the Stop WebSphere tool, you must set the STOP_CMD and USER properties. Set these properties using the Discover or Configure WBSSPI tool. For more information about this tool, see the HP Operations Smart Plug-in for IBM WebSphere Application Server Online Help or HP Operations Smart Plug-in for IBM WebSphere Application Server Online Help PDF.
Problem When running the tools, the tools hang or there is no output.
Solution The tools will not work if the memory is low. Check the performance of the node and the management server. The physical memory available must be more than 500 MB.
Problem Verify tool lists files and directories related to the management server as missing. For example:
/MGMT_SERVER/SPI-Share/wasspi/wbs/bin/parseDefs.pl/MGMT_SERVER/SPI-Share/wasspi/wbs/bin/processWASSPIDiscovMsg.pl
/MGMT_SERVER/SPI-Share/wasspi/wbs/conf
Solution This is a known problem. The verify tool lists management server related files if you install the WebSphere Application Server on the management server itself. This problem occurs if both the managed node and the management server are the same.
Problem Check WebSphere tool does not give any output.
Solution Make sure that the Collector is running for the WebSphere Application Server instance on that node.
Troubleshooting 75

Problem When started, the Verify tool gives improper output.
Solution Before you launch the Verify tool make sure that you installed the latest version of Self-Healing Service (SHS) component from the SPI DVD.
Problem When started, the Self-Healing Info tool gives improper output.
Solution Make sure that you installed the latest version of Self-Healing Service (SHS) component from the SPI DVD.
76 Chapter 7
8 Removing WebSphere SPI
This chapter provides instructions on how to remove the WebSphere SPI and its components from different environments.
Using DVD
You must remove the SPI components manually before removing the SPI from the management server using a SPI DVD.
Removing WebSphere SPI Components
Remove All the WebSphere SPI Policies from the Managed Nodes
1 In the console tree, select Policy management Policy groups.
2 Right-click SPI for WebSphere and select All Tasks Uninstall from.
A node selection window appears.
3 Select the nodes on which the policies are installed.
4 Click OK.
5 Verify the policies are uninstalled. Check the status of the job in Deployment jobs under Policy groups. All the WebSphere SPI policies must be uninstalled before you start the next task.
If you customized policies (copies of the WebSphere SPI default policies) residing in other HPOM policy groups, you must remove them.
Remove WebSphere SPI Node Groups on the Management Server
If you created the SPI for WebSphere node group (by running the Create WBSSPI Node Groups tool or manually), you must remove the group.
1 In the console tree, select Nodes SPI for WebSphere.
2 Open the Node Configuration editor.
a Select the Nodes folder in the console tree.
b Click the node icon on the Configuration toolbar to open the editor. A node list appears.
3 Select the name of the node group you want to delete and press the Delete key. You can also right-click the node group and select Delete.
The Confirm Delete window opens.
77
4 Click Yes.
5 Click OK to close Configure managed nodes window.
Removing WebSphere SPI from the Management Server
To uninstall the WebSphere SPI, follow these steps:
1 Insert the HP Operations Smart Plug-ins DVD into the DVD drive of the management server.
The HP Operations Smart Plug-ins - InstallShield Wizard starts.
2 From the first screen, select Next.
The Program Maintenance window opens.
3 Select Remove products.
The Product Selection window opens.
4 Select the IBM WebSphere Application Server check box and click Next.
5 Complete the removal by following the instructions that appear as you proceed.
The WebSphere SPI is removed.
Using Windows Control Panel - Add or Remove Products
Remove the SPI components before uninstalling the SPI from the management server. To manually remove the SPI components, perform the tasks in Removing WebSphere SPI Components on page 77.
To remove the SPI from the management server, perform the following steps:
1 From the Start menu, select Settings Control Panel and open Add/Remove Programs.
2 Select HP Operations Smart Plug-ins and click Change.
3 On the Welcome screen click Next.
4 Select Remove Products and select IBM WebSphere Application Server.
5 Complete the removal by following the instructions that appear as you proceed.
The WebSphere SPI is uninstalled.
Note that when you use the Windows Control Panel to uninstall any SPI, you have two uninstall options: (1) to remove selected SPIs or (2) to remove HPOM for Windows altogether. If you want to remove both HPOM and the SPIs, you must first remove all Smart Plug-ins from managed nodes then from the management server. You can then remove HPOM.
78 Chapter 8
Removing WebSphere SPI in a Cluster Environment
Remove Smart Plug-in Components from Managed Nodes
Follow the steps in the section Remove All the WebSphere SPI Policies from the Managed Nodes on page 77.
Remove WebSphere SPI from the Cluster-aware Management Servers
Remove the product from each system in the cluster as follows.
1 At the management console, select Start Settings Add or Remove Programs and select HP Operations Smart Plug-ins and select Change.
orInsert the HP Operations Smart Plug-ins DVD in the DVD drive.
2 Whether using the Smart Plug-ins DVD or the Control Panel, proceed to product selection and select IBM WebSphere Application Server installed on the cluster-aware management server.
3 Click Next.
4 Click Remove.
5 When you have finished the uninstallation on one management server, proceed to the next management server in the cluster. (You can choose any management server in the cluster to begin the uninstallation; when the first uninstallation completes, you are prompted to proceed to each subsequent management server until you reach the last.)
6 After selecting IBM WebSphere Application server to remove from the first node in the cluster and completing the uninstallation on that node, you are prompted to proceed to the next node. Your initial selections on the first node are used for removing the identical Smart Plug-ins from the second.
You are notified that the removal is complete.
Be certain you want to follow through an uninstallation before beginning. To cancel an uninstallation in a cluster after it has begun could result in the need to manually remove program components later.
Removing WebSphere SPI 79

80 Chapter 8
9 User Defined Metrics
The WebSphere SPI can collect data on roughly 50 metrics. However, you can expand that number by adding your own. The advantage to defining your own metrics is that you can monitor your own applications.
You must understand the metric definitions DTD before creating UDMs. The sections that follow assume you are familiar with XML (extensible markup language) and DTDs (Document Type Definitions).
Metric Definitions DTD
The MetricDefinitions.dtd file provides the structure and syntax for the XML file that you create. The WebSphere SPI uses this DTD file to parse and validate the XML file you create. Following sections describe the MetricDefinitions.dtd file and provide an example XML file.
On a managed node, the MetricDefinitions.dtd file is located in the following directory:
For HPOM for Windows 9.00, <OvAgentDir> is typically is:
On Windows: \Documents and Settings\All Users\Application Data\HP\HP BTO Software\
On UNIX: /var/opt/OV/
MetricDefinitions.dtd consists of the following elements:
• MetricDefinitions
• Metric
• FromVersion/ToVersion
• Calculation/Formula
Operating System Directory
AIX /var/lpp/OV/wasspi/wbs/conf/
HP-UX and Solaris /var/opt/OV/wasspi/wbs/conf/
Windows <OvAgentDir>\wasspi\wbs\conf\
Because the MetricDefinitions.dtd file is used at runtime, you should not edit, rename, or move it.
81
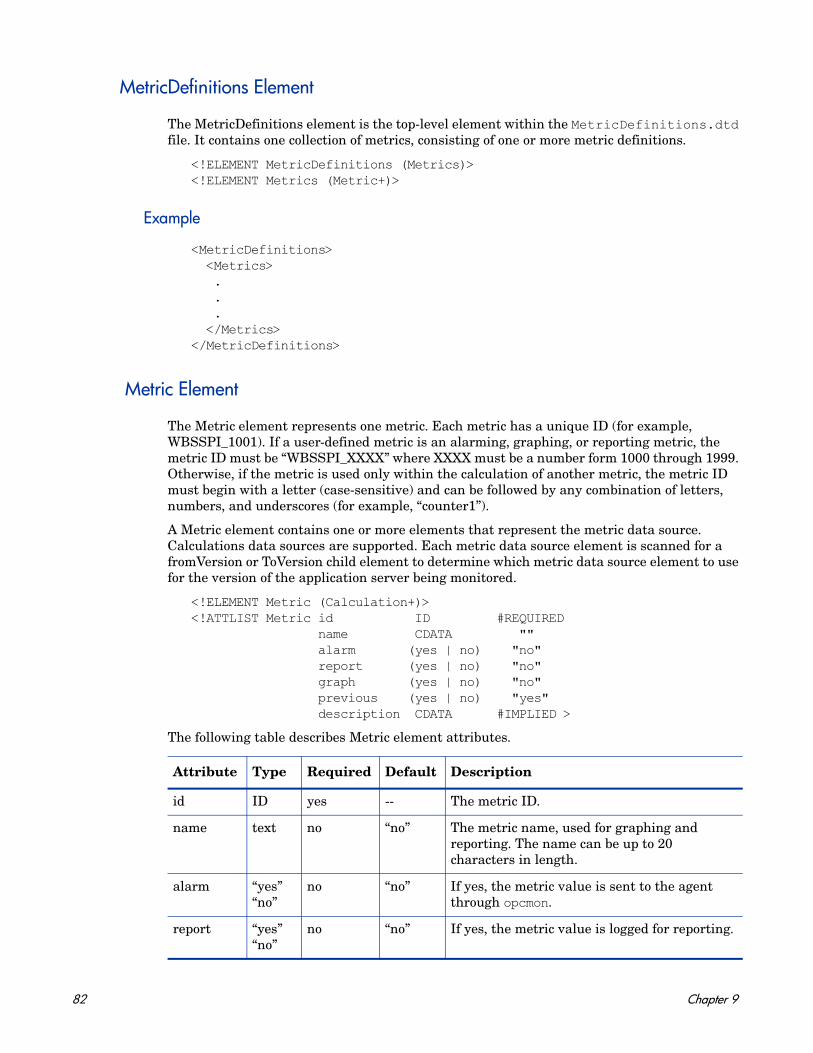
MetricDefinitions Element
The MetricDefinitions element is the top-level element within the MetricDefinitions.dtd file. It contains one collection of metrics, consisting of one or more metric definitions.
<!ELEMENT MetricDefinitions (Metrics)><!ELEMENT Metrics (Metric+)>
Example
<MetricDefinitions><Metrics>...</Metrics>
</MetricDefinitions>
Metric Element
The Metric element represents one metric. Each metric has a unique ID (for example, WBSSPI_1001). If a user-defined metric is an alarming, graphing, or reporting metric, the metric ID must be “WBSSPI_XXXX” where XXXX must be a number form 1000 through 1999. Otherwise, if the metric is used only within the calculation of another metric, the metric ID must begin with a letter (case-sensitive) and can be followed by any combination of letters, numbers, and underscores (for example, “counter1”).
A Metric element contains one or more elements that represent the metric data source. Calculations data sources are supported. Each metric data source element is scanned for a fromVersion or ToVersion child element to determine which metric data source element to use for the version of the application server being monitored.
<!ELEMENT Metric (Calculation+)><!ATTLIST Metric id ID #REQUIRED name CDATA "" alarm (yes | no) "no" report (yes | no) "no" graph (yes | no) "no" previous (yes | no) "yes" description CDATA #IMPLIED >
The following table describes Metric element attributes.
Attribute Type Required Default Description
id ID yes -- The metric ID.
name text no “no” The metric name, used for graphing and reporting. The name can be up to 20 characters in length.
alarm “yes” “no”
no “no” If yes, the metric value is sent to the agent through opcmon.
report “yes” “no”
no “no” If yes, the metric value is logged for reporting.
82 Chapter 9
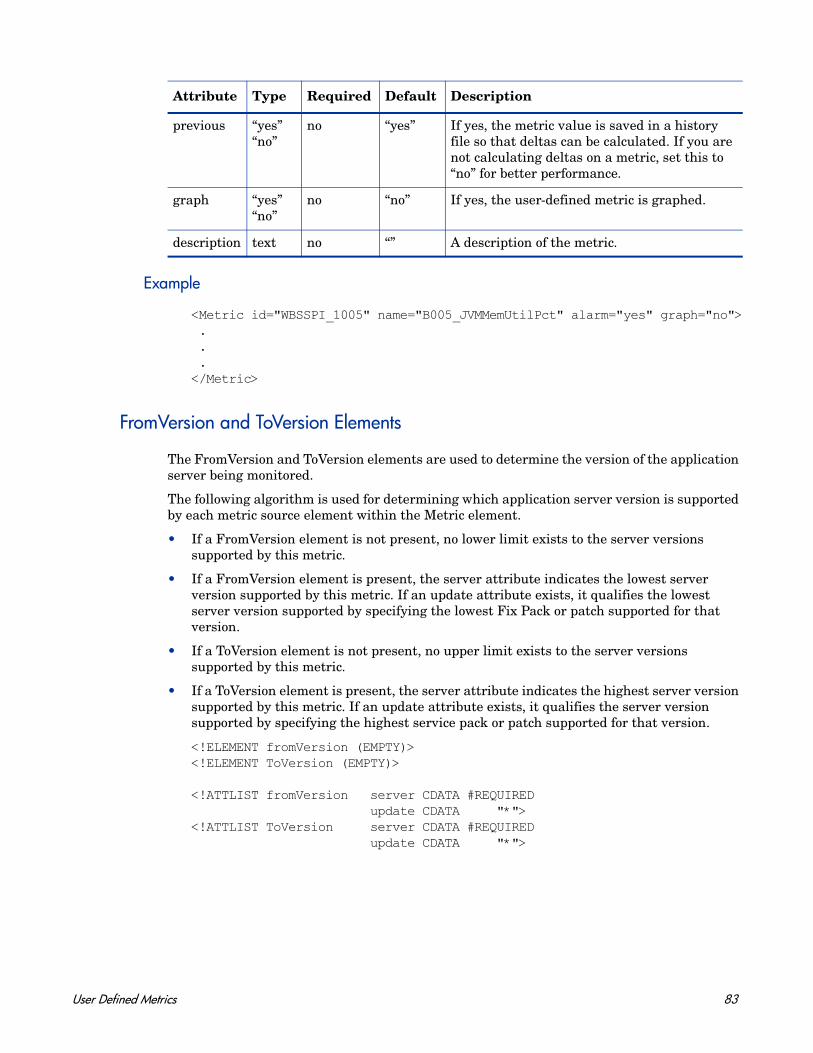
Example
<Metric id="WBSSPI_1005" name="B005_JVMMemUtilPct" alarm="yes" graph="no">...</Metric>
FromVersion and ToVersion Elements
The FromVersion and ToVersion elements are used to determine the version of the application server being monitored.
The following algorithm is used for determining which application server version is supported by each metric source element within the Metric element.
• If a FromVersion element is not present, no lower limit exists to the server versions supported by this metric.
• If a FromVersion element is present, the server attribute indicates the lowest server version supported by this metric. If an update attribute exists, it qualifies the lowest server version supported by specifying the lowest Fix Pack or patch supported for that version.
• If a ToVersion element is not present, no upper limit exists to the server versions supported by this metric.
• If a ToVersion element is present, the server attribute indicates the highest server version supported by this metric. If an update attribute exists, it qualifies the server version supported by specifying the highest service pack or patch supported for that version.
<!ELEMENT fromVersion (EMPTY)><!ELEMENT ToVersion (EMPTY)>
<!ATTLIST fromVersion server CDATA #REQUIRED update CDATA "*"><!ATTLIST ToVersion server CDATA #REQUIRED update CDATA "*">
previous “yes” “no”
no “yes” If yes, the metric value is saved in a history file so that deltas can be calculated. If you are not calculating deltas on a metric, set this to “no” for better performance.
graph “yes” “no”
no “no” If yes, the user-defined metric is graphed.
description text no “” A description of the metric.
Attribute Type Required Default Description
User Defined Metrics 83
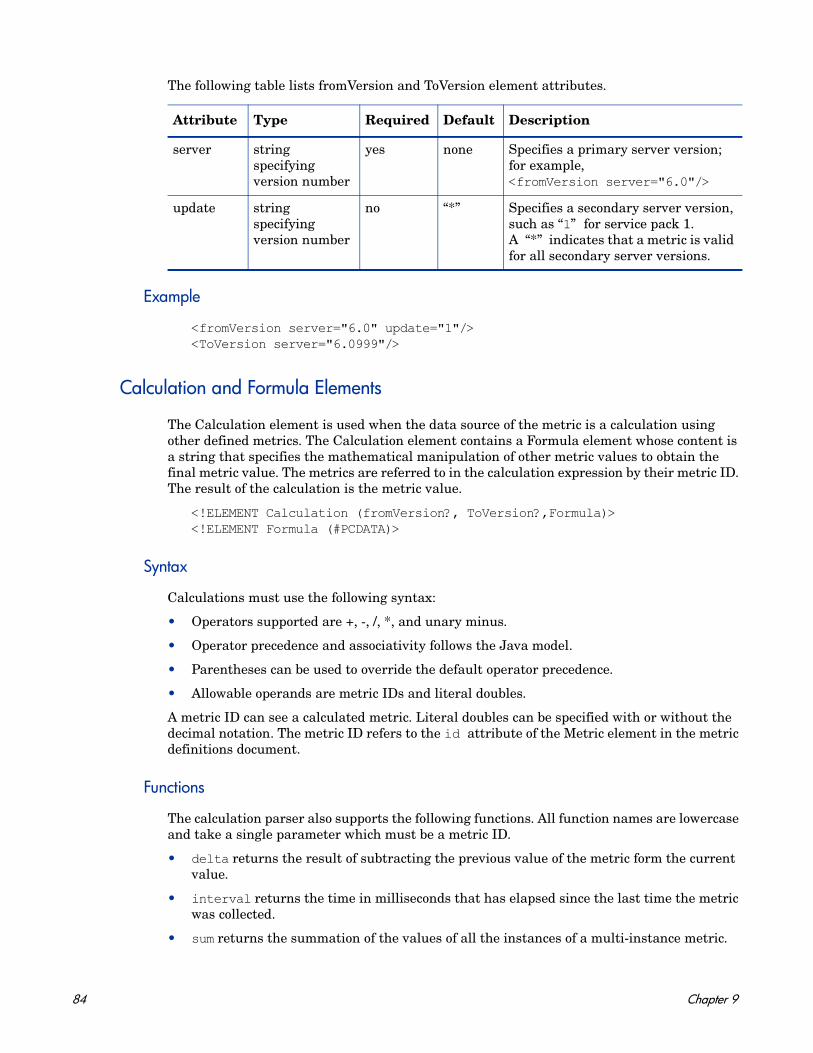
The following table lists fromVersion and ToVersion element attributes.
Example
<fromVersion server="6.0" update="1"/><ToVersion server="6.0999"/>
Calculation and Formula Elements
The Calculation element is used when the data source of the metric is a calculation using other defined metrics. The Calculation element contains a Formula element whose content is a string that specifies the mathematical manipulation of other metric values to obtain the final metric value. The metrics are referred to in the calculation expression by their metric ID. The result of the calculation is the metric value.
<!ELEMENT Calculation (fromVersion?, ToVersion?,Formula)><!ELEMENT Formula (#PCDATA)>
Syntax
Calculations must use the following syntax:
• Operators supported are +, -, /, *, and unary minus.
• Operator precedence and associativity follows the Java model.
• Parentheses can be used to override the default operator precedence.
• Allowable operands are metric IDs and literal doubles.
A metric ID can see a calculated metric. Literal doubles can be specified with or without the decimal notation. The metric ID refers to the id attribute of the Metric element in the metric definitions document.
Functions
The calculation parser also supports the following functions. All function names are lowercase and take a single parameter which must be a metric ID.
• delta returns the result of subtracting the previous value of the metric form the current value.
• interval returns the time in milliseconds that has elapsed since the last time the metric was collected.
• sum returns the summation of the values of all the instances of a multi-instance metric.
Attribute Type Required Default Description
server string specifying version number
yes none Specifies a primary server version; for example, <fromVersion server="6.0"/>
update string specifying version number
no “*” Specifies a secondary server version, such as “1” for service pack 1.A “*” indicates that a metric is valid for all secondary server versions.
84 Chapter 9
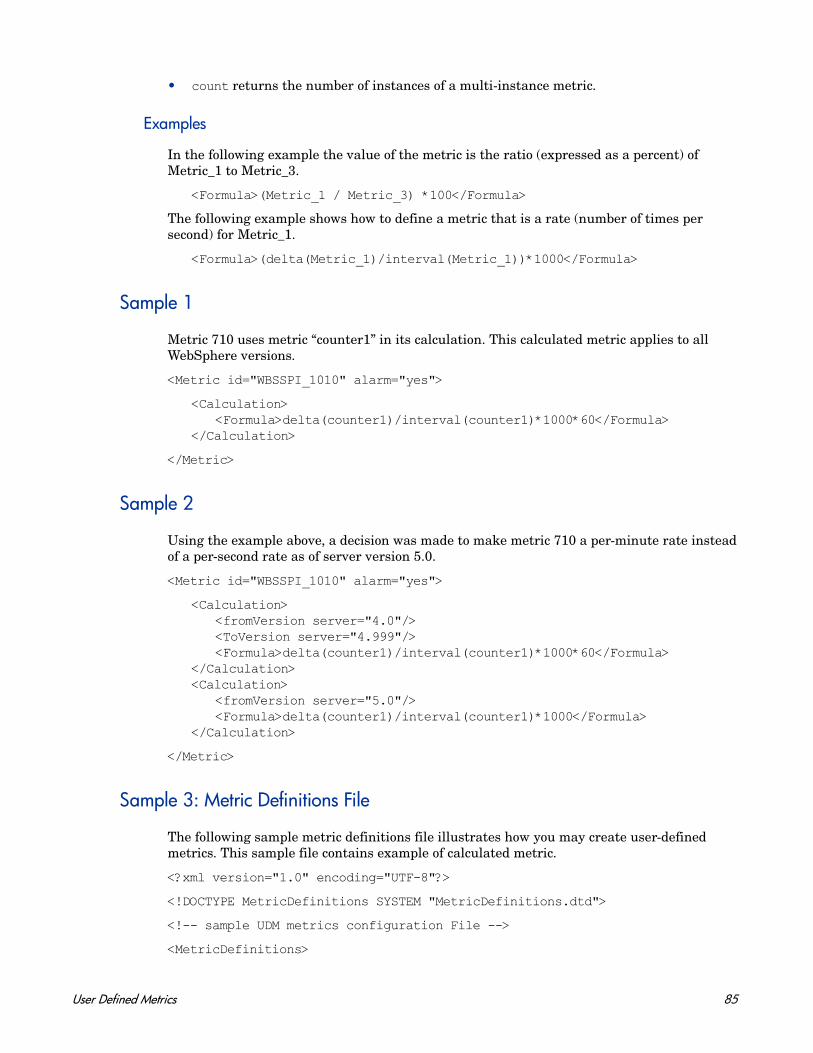
• count returns the number of instances of a multi-instance metric.
Examples
In the following example the value of the metric is the ratio (expressed as a percent) of Metric_1 to Metric_3.
<Formula>(Metric_1 / Metric_3) *100</Formula>
The following example shows how to define a metric that is a rate (number of times per second) for Metric_1.
<Formula>(delta(Metric_1)/interval(Metric_1))*1000</Formula>
Sample 1
Metric 710 uses metric “counter1” in its calculation. This calculated metric applies to all WebSphere versions.
<Metric id="WBSSPI_1010" alarm="yes">
<Calculation><Formula>delta(counter1)/interval(counter1)*1000*60</Formula>
</Calculation>
</Metric>
Sample 2
Using the example above, a decision was made to make metric 710 a per-minute rate instead of a per-second rate as of server version 5.0.
<Metric id="WBSSPI_1010" alarm="yes">
<Calculation><fromVersion server="4.0"/><ToVersion server="4.999"/><Formula>delta(counter1)/interval(counter1)*1000*60</Formula>
</Calculation><Calculation>
<fromVersion server="5.0"/><Formula>delta(counter1)/interval(counter1)*1000</Formula>
</Calculation>
</Metric>
Sample 3: Metric Definitions File
The following sample metric definitions file illustrates how you may create user-defined metrics. This sample file contains example of calculated metric.
<?xml version="1.0" encoding="UTF-8"?>
<!DOCTYPE MetricDefinitions SYSTEM "MetricDefinitions.dtd">
<!-- sample UDM metrics configuration File -->
<MetricDefinitions>
User Defined Metrics 85
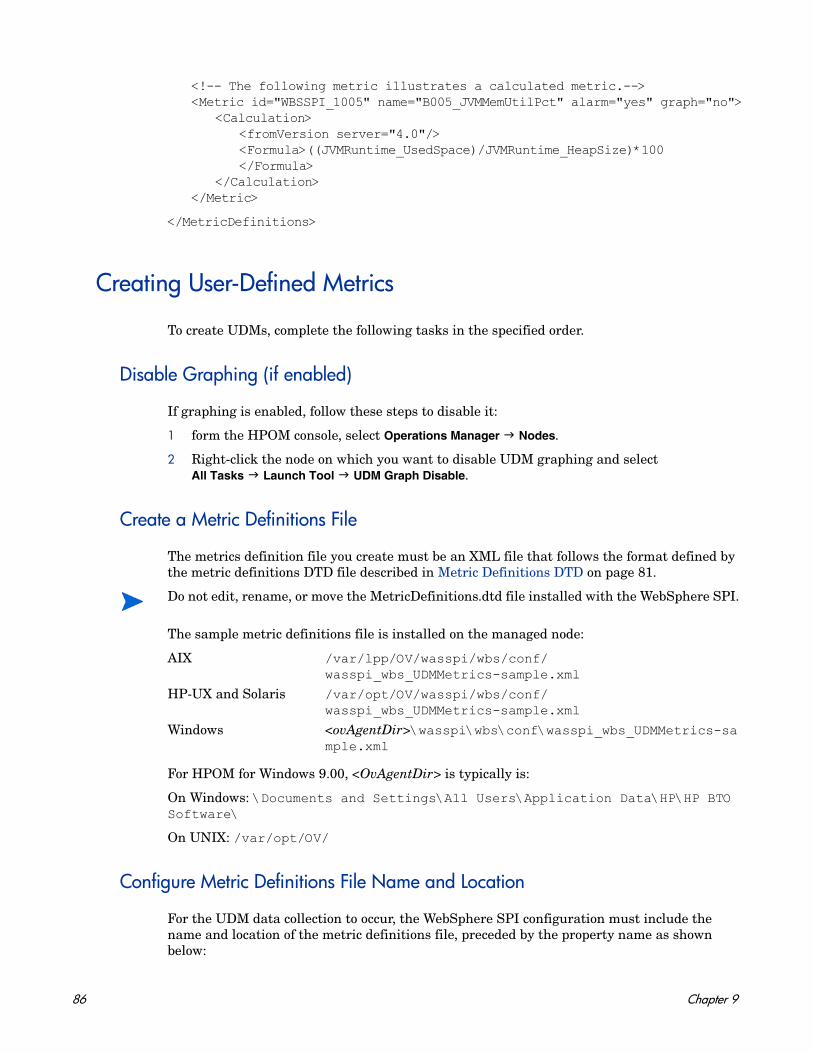
<!-- The following metric illustrates a calculated metric.--><Metric id="WBSSPI_1005" name="B005_JVMMemUtilPct" alarm="yes" graph="no">
<Calculation><fromVersion server="4.0"/><Formula>((JVMRuntime_UsedSpace)/JVMRuntime_HeapSize)*100</Formula>
</Calculation></Metric>
</MetricDefinitions>
Creating User-Defined Metrics
To create UDMs, complete the following tasks in the specified order.
Disable Graphing (if enabled)
If graphing is enabled, follow these steps to disable it:
1 form the HPOM console, select Operations Manager Nodes.
2 Right-click the node on which you want to disable UDM graphing and selectAll Tasks Launch Tool UDM Graph Disable.
Create a Metric Definitions File
The metrics definition file you create must be an XML file that follows the format defined by the metric definitions DTD file described in Metric Definitions DTD on page 81.
The sample metric definitions file is installed on the managed node:
For HPOM for Windows 9.00, <OvAgentDir> is typically is:
On Windows: \Documents and Settings\All Users\Application Data\HP\HP BTO Software\
On UNIX: /var/opt/OV/
Configure Metric Definitions File Name and Location
For the UDM data collection to occur, the WebSphere SPI configuration must include the name and location of the metric definitions file, preceded by the property name as shown below:
Do not edit, rename, or move the MetricDefinitions.dtd file installed with the WebSphere SPI.
AIX /var/lpp/OV/wasspi/wbs/conf/wasspi_wbs_UDMMetrics-sample.xml
HP-UX and Solaris /var/opt/OV/wasspi/wbs/conf/wasspi_wbs_UDMMetrics-sample.xml
Windows <ovAgentDir>\wasspi\wbs\conf\wasspi_wbs_UDMMetrics-sample.xml
86 Chapter 9
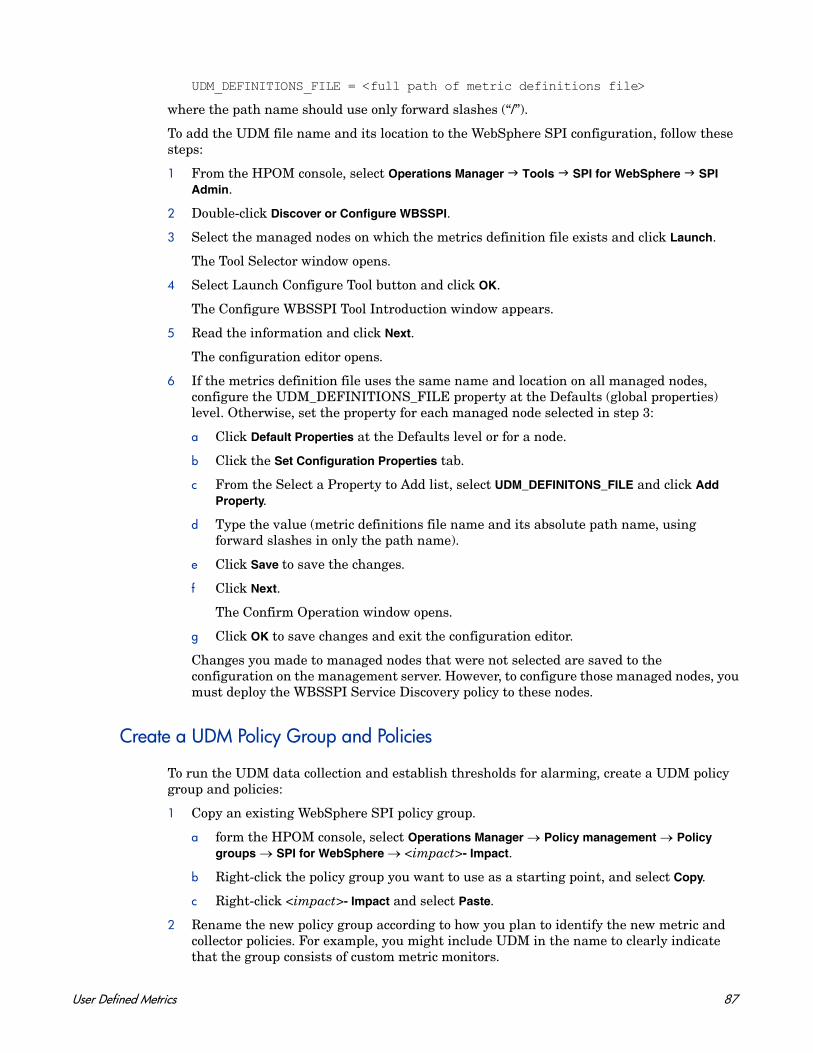
UDM_DEFINITIONS_FILE = <full path of metric definitions file>
where the path name should use only forward slashes (“/”).
To add the UDM file name and its location to the WebSphere SPI configuration, follow these steps:
1 From the HPOM console, select Operations Manager Tools SPI for WebSphere SPI Admin.
2 Double-click Discover or Configure WBSSPI.
3 Select the managed nodes on which the metrics definition file exists and click Launch.
The Tool Selector window opens.
4 Select Launch Configure Tool button and click OK.
The Configure WBSSPI Tool Introduction window appears.
5 Read the information and click Next.
The configuration editor opens.
6 If the metrics definition file uses the same name and location on all managed nodes, configure the UDM_DEFINITIONS_FILE property at the Defaults (global properties) level. Otherwise, set the property for each managed node selected in step 3:
a Click Default Properties at the Defaults level or for a node.
b Click the Set Configuration Properties tab.
c From the Select a Property to Add list, select UDM_DEFINITONS_FILE and click Add Property.
d Type the value (metric definitions file name and its absolute path name, using forward slashes in only the path name).
e Click Save to save the changes.
f Click Next.
The Confirm Operation window opens.
g Click OK to save changes and exit the configuration editor.
Changes you made to managed nodes that were not selected are saved to the configuration on the management server. However, to configure those managed nodes, you must deploy the WBSSPI Service Discovery policy to these nodes.
Create a UDM Policy Group and Policies
To run the UDM data collection and establish thresholds for alarming, create a UDM policy group and policies:
1 Copy an existing WebSphere SPI policy group.
a form the HPOM console, select Operations Manager → Policy management → Policy groups → SPI for WebSphere → <impact>- Impact.
b Right-click the policy group you want to use as a starting point, and select Copy.
c Right-click <impact>- Impact and select Paste.
2 Rename the new policy group according to how you plan to identify the new metric and collector policies. For example, you might include UDM in the name to clearly indicate that the group consists of custom metric monitors.
User Defined Metrics 87
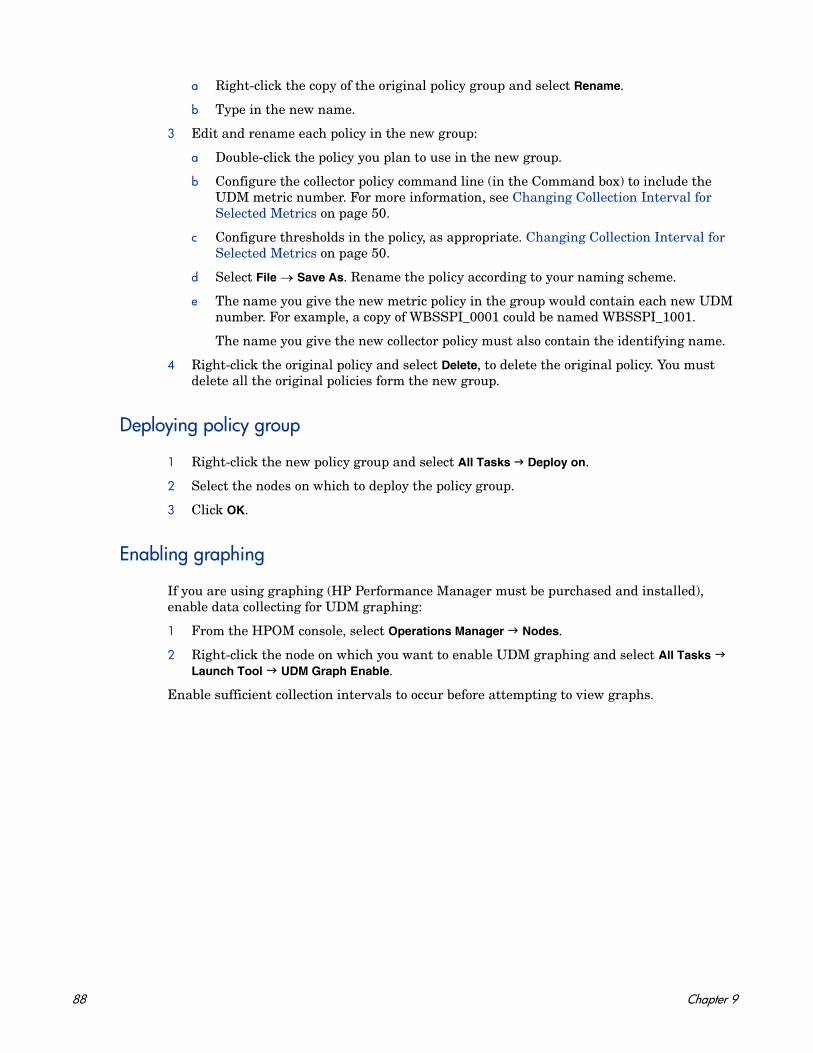
a Right-click the copy of the original policy group and select Rename.
b Type in the new name.
3 Edit and rename each policy in the new group:
a Double-click the policy you plan to use in the new group.
b Configure the collector policy command line (in the Command box) to include the UDM metric number. For more information, see Changing Collection Interval for Selected Metrics on page 50.
c Configure thresholds in the policy, as appropriate. Changing Collection Interval for Selected Metrics on page 50.
d Select File → Save As. Rename the policy according to your naming scheme.
e The name you give the new metric policy in the group would contain each new UDM number. For example, a copy of WBSSPI_0001 could be named WBSSPI_1001.
The name you give the new collector policy must also contain the identifying name.
4 Right-click the original policy and select Delete, to delete the original policy. You must delete all the original policies form the new group.
Deploying policy group
1 Right-click the new policy group and select All Tasks Deploy on.
2 Select the nodes on which to deploy the policy group.
3 Click OK.
Enabling graphing
If you are using graphing (HP Performance Manager must be purchased and installed), enable data collecting for UDM graphing:
1 From the HPOM console, select Operations Manager Nodes.
2 Right-click the node on which you want to enable UDM graphing and select All Tasks Launch Tool UDM Graph Enable.
Enable sufficient collection intervals to occur before attempting to view graphs.
88 Chapter 9
Glossary
agent
A program or process running on a remote device or computer system that responds to management requests, performs management operations, or sends performance and event notification. An agent can provide access to managed objects and MIB variables, interpret policy for resources and configure resources.
application
Packaged software that provides functionality designed to accomplish a set of related tasks. An application is generally more complex than a tool.
ASCII
American Standard Code for Information Interchange.
assigned policy
A policy assigned to one or more resources in the computing environment but not yet deployed or installed on those resources.
automatic action
A pre-configured program or script executed in response to an event, message, or a change in information in the management database. without operator intervention.
client
When the context is network systems, a computer system on a network that accesses a service from another computer (server). When the context is software, a program or executable process that requests a service from a server.
client console
An instance of the user interface that appears on the client system while the application runs on a server.
command
An instruction to a computer program that causes a specified operation to be carried out. Commands are typically typed by users on a command line.
configuration
In a network context, the complete set of inter-related systems, devices and programs that make up the network. For example the components of a network may include computer systems, routers, switches, hubs, operating systems and network software. The configuration of the network determines the way that it works and the way that it is used. In a software context, the combination of settings of software parameters and attributes that determine the way the software works, the way it is used, and how it appears.
89
configuration file
A file that contains specifications or information that can be used for determining how a software program should look and operate.
connection
A representation of a logical or physical relationship between objects.
console
An instance of the user interface from which the user can control an application or set of applications.
customization
The process of designing, constructing or modifying software to meet the needs and preferences of a particular customer or user.
data type
A particular kind of data; for example database A repository of data that is electronically stored. Typically databases are organized so that data can be retrieved and updated.
deploy
To install and start software, hardware, capabilities, or services so that they work in the business environment.
deployed application
An application and its components that have been installed and started to work in the business environment.
deployed policy
A policy that is deployed on one or more resources in the computing environment.
deployment
The process of installing and activating software, hardware, capabilities or services so that they work in the business environment.
deployment package
A software package that can be deployed automatically and installed on a managed node.
error log
An output file containing error messages.
event
An unsolicited notification such as an SNMP trap or WMI notification generated by an agent or process in a managed object or by a user action. An event usually indicates a change in the state of a managed object or cause an action to occur.
Hypertext Transfer Protocol (HTTP).
The protocol that World Wide Web clients and servers use to communicate.
90
HTTPS
Hypertext Transfer Protocol Secure.
icon
An on-screen image that represents objects that can be monitored or manipulated by the user or actions that can be executed by the user.
managed object
A network, system, software or service object that is both monitored for performance, status and messages and is manipulated by means of actions in the management software.
management console
An instance of the user interface from which the user can control the management application or set of management applications. The console may be on the system that contains the management software or it may be on another system in the management domain.
management server
A server that provides management services, processes, or a management user interface to clients. A management server is a type of management station.
message
A structured, readable notification that is generated as a result of an event, the evaluation of one or more events relative to specified conditions, or a change in application, system, network, or service status.
message browser
A graphical user interface that presents notifications that are generated as a result of an event, the evaluation of one or more events relative to specified conditions or a change in application, system, network, or service status.
message description
Detailed information about an event or message.
message key
A message attribute that is a string used to identify messages that were triggered from particular events.The string summarizes the important characteristics of the event. Message keys can be used to enable messages to acknowledge other messages, and enables for the identification of duplicate messages.
message severity level
A property of a message indicating the level of impact of the event or notification that initiated the message. See also severity level.
metadata
Data that defines data.
metric
A measurement that defines a specific operational or performance characteristic.
91
module
A self-contained software component that performs a specific type of task or provides for the presentation of a specific type of data. Modules can interact with one another and with other software.
node
When the context is network, a computer system or device (for example, printer, router, bridge) in a network. When the context is a graphical point to point layout, a graphical element in a drawing that acts as a junction or connection point for other graphical elements.
parameter
A variable or attribute that may be given an arbitrary value for use during an execution of either a computer program or a procedure within a program.
parameter type
An abstraction or categorization of a parameter that determines the particular kind of data that is valid for the parameter. For example a parameter type could be IP Address which indicates that parameter values must have four numbers separated by decimals with the value for each number being in the range of 0 to 255.
parameter value
A value given to a variable.
policy
A set of one or more specifications rules and other information that help automate network, system, service, and process management. Policies can be deployed to various targets (for example, managed systems, devices, network interfaces) providing consistent, automated administration across the network.
policy management
The process of controlling policies (for example, creating, editing, tracking, deploying, deleting) for the purposes of network, system or service management.
policy type
An abstraction or categorization of policies based on the function of the policy or the services that the policy supports.
port
If the context is hardware, a location for passing information into and out of a network device. If the context is ECS, a location for passing information into and out of a correlation node.
server
If the context is hardware plus software, a computer system that provides a service (for example, management capabilities, file storage capabilities) to other computer systems (clients) on the network. If the context is a software component, a program or executable process that responds to and services requests issued by clients.
92
severity level
A property of an object indicating the status of the object. Severity level is based on the impact of events or messages associated with the object.
Smart Plug-in (SPI)
Prepackaged software that installs into a management console and provides management capabilities specific to a given type of business application, database, operating system, or service.
trace log
An output file containing records of the execution of application software.
93

94
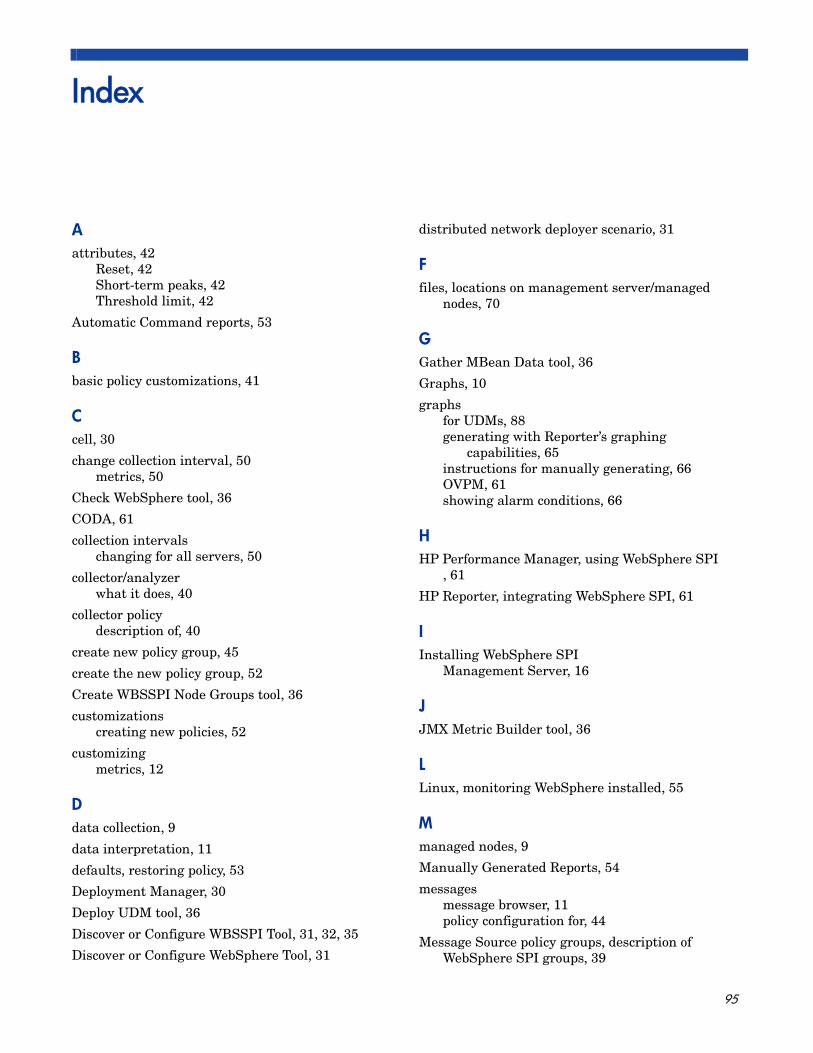
Index
Aattributes, 42
Reset, 42Short-term peaks, 42Threshold limit, 42
Automatic Command reports, 53
Bbasic policy customizations, 41
Ccell, 30
change collection interval, 50metrics, 50
Check WebSphere tool, 36
CODA, 61
collection intervalschanging for all servers, 50
collector/analyzerwhat it does, 40
collector policydescription of, 40
create new policy group, 45
create the new policy group, 52
Create WBSSPI Node Groups tool, 36
customizationscreating new policies, 52
customizingmetrics, 12
Ddata collection, 9
data interpretation, 11
defaults, restoring policy, 53
Deployment Manager, 30
Deploy UDM tool, 36
Discover or Configure WBSSPI Tool, 31, 32, 35
Discover or Configure WebSphere Tool, 31
distributed network deployer scenario, 31
Ffiles, locations on management server/managed
nodes, 70
GGather MBean Data tool, 36
Graphs, 10
graphsfor UDMs, 88generating with Reporter’s graphing
capabilities, 65instructions for manually generating, 66OVPM, 61showing alarm conditions, 66
HHP Performance Manager, using WebSphere SPI
, 61
HP Reporter, integrating WebSphere SPI, 61
IInstalling WebSphere SPI
Management Server, 16
JJMX Metric Builder tool, 36
LLinux, monitoring WebSphere installed, 55
Mmanaged nodes, 9
Manually Generated Reports, 54
messagesmessage browser, 11policy configuration for, 44
Message Source policy groups, description of WebSphere SPI groups, 39
95
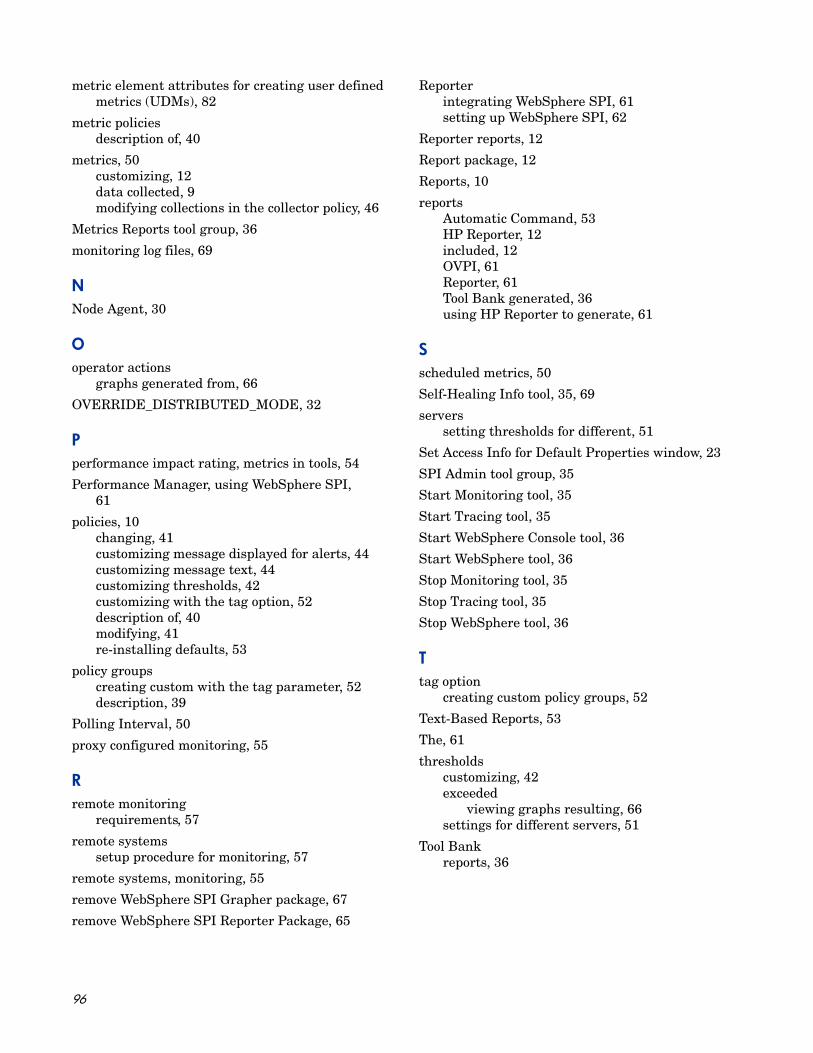
metric element attributes for creating user defined metrics (UDMs), 82
metric policiesdescription of, 40
metrics, 50customizing, 12data collected, 9modifying collections in the collector policy, 46
Metrics Reports tool group, 36
monitoring log files, 69
NNode Agent, 30
Ooperator actions
graphs generated from, 66
OVERRIDE_DISTRIBUTED_MODE, 32
Pperformance impact rating, metrics in tools, 54
Performance Manager, using WebSphere SPI, 61
policies, 10changing, 41customizing message displayed for alerts, 44customizing message text, 44customizing thresholds, 42customizing with the tag option, 52description of, 40modifying, 41re-installing defaults, 53
policy groupscreating custom with the tag parameter, 52description, 39
Polling Interval, 50
proxy configured monitoring, 55
Rremote monitoring
requirements, 57
remote systemssetup procedure for monitoring, 57
remote systems, monitoring, 55
remove WebSphere SPI Grapher package, 67
remove WebSphere SPI Reporter Package, 65
Reporterintegrating WebSphere SPI, 61setting up WebSphere SPI, 62
Reporter reports, 12
Report package, 12
Reports, 10
reportsAutomatic Command, 53HP Reporter, 12included, 12OVPI, 61Reporter, 61Tool Bank generated, 36using HP Reporter to generate, 61
Sscheduled metrics, 50
Self-Healing Info tool, 35, 69
serverssetting thresholds for different, 51
Set Access Info for Default Properties window, 23
SPI Admin tool group, 35
Start Monitoring tool, 35
Start Tracing tool, 35
Start WebSphere Console tool, 36
Start WebSphere tool, 36
Stop Monitoring tool, 35
Stop Tracing tool, 35
Stop WebSphere tool, 36
Ttag option
creating custom policy groups, 52
Text-Based Reports, 53
The, 61
thresholdscustomizing, 42exceeded
viewing graphs resulting, 66settings for different servers, 51
Tool Bankreports, 36
96
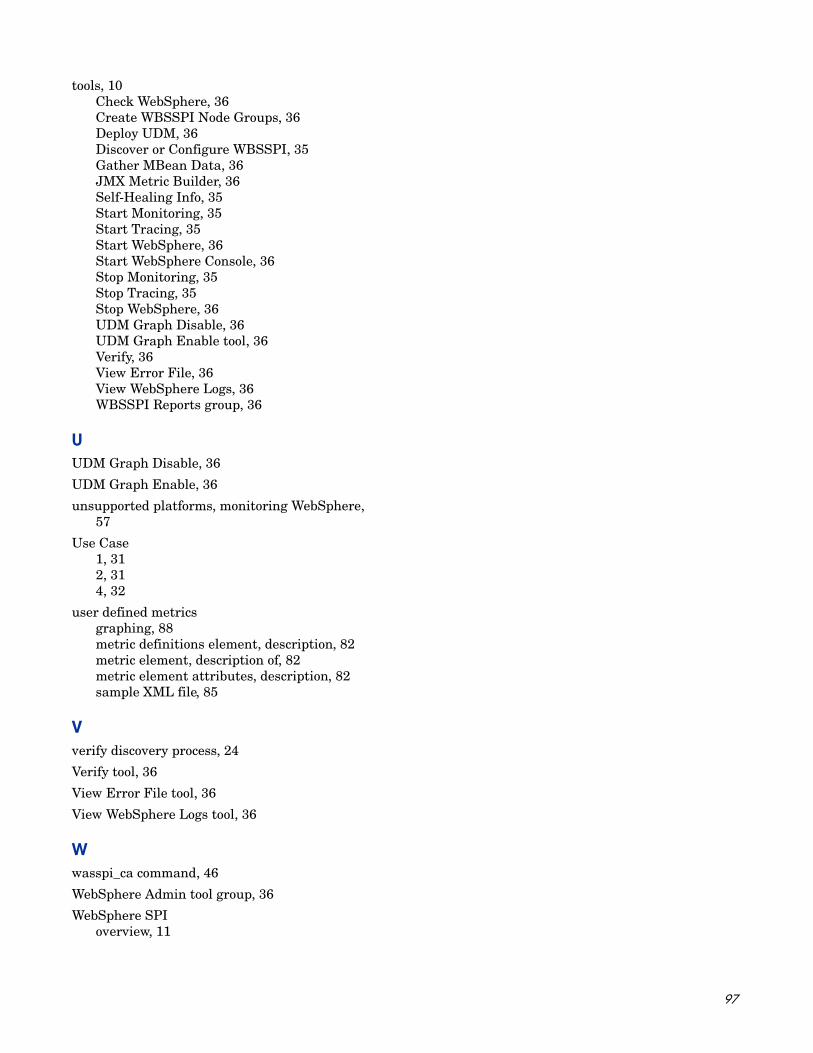
tools, 10Check WebSphere, 36Create WBSSPI Node Groups, 36Deploy UDM, 36Discover or Configure WBSSPI, 35Gather MBean Data, 36JMX Metric Builder, 36Self-Healing Info, 35Start Monitoring, 35Start Tracing, 35Start WebSphere, 36Start WebSphere Console, 36Stop Monitoring, 35Stop Tracing, 35Stop WebSphere, 36UDM Graph Disable, 36UDM Graph Enable tool, 36Verify, 36View Error File, 36View WebSphere Logs, 36WBSSPI Reports group, 36
UUDM Graph Disable, 36
UDM Graph Enable, 36
unsupported platforms, monitoring WebSphere, 57
Use Case1, 312, 314, 32
user defined metricsgraphing, 88metric definitions element, description, 82metric element, description of, 82metric element attributes, description, 82sample XML file, 85
Vverify discovery process, 24
Verify tool, 36
View Error File tool, 36
View WebSphere Logs tool, 36
Wwasspi_ca command, 46
WebSphere Admin tool group, 36
WebSphere SPIoverview, 11
97

98

We appreciate your feedback!
If an email client is configured on this system, by default an email window opens when you click on the bookmark “Comments”.
In case you do not have the email client configured, copy the information below to a web mail client, and send this email to [email protected]
Product name:
Document title:
Version number:
Feedback:
