hplc analysis of biomolecules technical...
TRANSCRIPT
Successful Separations of Peptides, Proteins and Other Biomolecules
HPLC Analysis of BiomoleculesTechnical Guide
c h r o m a t o g r a p h y
Part of Thermo Fisher Scientific
HPLC A
nalysis of Biom
olecules
2
Resources forChromatographersAvailable now, the Thermo Scientific ChromatographyColumns and Consumables 2010/2011 catalog. Beyond this catalog, our Chromatography team shares its extensive expertise through our web-basedChromatography Resource Center and the Separatedby Experience enewsletter.
The Chromatography Resource Center, accessedat www.thermoscientific.com/chromatography provides technical support, applications, technicaltips and literature to help you move your separationsforward, quickly and easily.
The bi-monthly Separated by Experienceenewsletter keeps you up-to-date on the latest technical and product information of interest to chromatographers. Valuable information developed bychromatographers for chromatographers. Subscribetoday at www.thermoscientific.com/chromatography
Dedication to Life ScienceMajor advances in proteomics, biochemistry, andmolecular biology will enable new therapeutic treatments and increase our understanding of fundamental life processes. Thermo Scientific HPLC and LC/MS systems, software, HPLC modularcomponents, HPLC particles, columns, and other consumables provide life science researchers thetools, technologies, and integrated solutions neededto tackle the formidable analytical challenges theyface daily.
3
HPLC Modes for Biomolecule Separations
Introduction 5
Reversed Phase Chromatography
Reversed Phase HPLC of Biomolecules 6Mechanism of RP-HPLC Separation 6Particle Size 6Pore Size 7Column Length 8Flow Rate 8Bonded Phase Functionality and Alkyl Chain Length 9Porous Graphitic Carbon (PGC) 10Guidelines for Choosing an RP-HPLC Column 12Mobile Phases for RP-HPLC 12
Effect of pH on RP-HPLC Analyses 13Effect of Ionic Modifier on RP-HPLC Analyses 13Effect of Organic Modifier Type and Concentration on RP-HPLC Retention 14Effect of Temperature on RP-HPLC Retention 15Gradient vs. Isocratic Elution 15
RP-LC/MS of Biomolecules 16Column Selection for RP-LC/MS: Column ID 16Maintaining Constant Linear Velocity with Changing Column ID 17Electrospray Ionization (ESI) 17Column Packing Materials for RP-LC/MS 18Column Stability 19Mobile Phase for RP-LC/MS 20Ionic Additives for RP-LC/MS 20Organic/Aqueous Solvent Ratio for RP-LC/MS 21Effect of Connecting Tubing on LC/MS Efficiency 21
Ion Exchange Chromatography
Basic Principles of Ion Exchange Chromatography 23Particles for Ion Exchange 24Particle Size, Pore Size, and Column Length 24Flow Rate 24Temperature 24Ion Exchange Bonded Phases 25Measuring Ion Exchange Capacity 25Mobile Phases for Ion Exchange HPLC 26
Mobile Phase pH 26Ionic Strength (Salt Concentration) 26
Controlling Retention with Salt and pH Gradients 27Ion Exchange for LC/MS of Biomolecules 27
Table of Contents
HPLC A
nalysis of Biom
olecules
4
Size Exclusion Chromatography
Basic Principles of Size Exclusion Chromatography 28Particles for Size Exclusion 28Pore Size and Vi/Vo Ratio 29Molecular Weight Calibration Curves 29Choosing a Size Exclusion Column Based on Molecular Weight 29Particle Size and Column Length 30Mobile Phases for Size Exclusion Chromatography 30
Effect of Mobile Phase pH 30Effect of Mobile Phase Ionic Strength (Salt Concentration) 30
Flow Rate and Temperature 30Size Exclusion Chromatography for LC/MS of Biomolecules 31SEC and Sample Preparation or Fractionation 31
Direct Serum Injection 31Two-Dimensional (2-D) Sample Clean-Up 32
Proteomics
Proteomics and LC/MSn 33Top-Down vs Bottom-Up Approaches 33HPLC in Proteomics 33Capillary LC/MS 33Online 2-D HPLC 34Microscale Solid Phase Extraction 35
Column Care and Maintenance
General Recommendations for Usage 36Column Protection 36Column Cleaning 37Column Storage 37
AppendicesAppendix 1: Quick Look-Up Tables
Protein Structure Defined 38Molecular Weight of Some Common Biomolecules 38Common Amino Acids, Abbreviations, MW and pKa 38Properties of Common HPLC Solvents 38Common Buffer Systems Used in HPLC 39Typical Flow Rates and Injection Volumes Versus HPLC Column ID 39Preparative Scale-Up Calculations 39Tubing Internal Diameters and Volumes 39
Appendix 2: Columns for HPLC of Biomolecules 40Appendix 3: Sample Preparation Products for Biomolecules 44Appendix 4: Index 46Appendix 5: References 47
Table of Contents
5
Introduction
Proteins, peptides, carbohydrates, lipids, amino acids, vitamins,coenzymes, and nucleic acids are a few of the members of thediverse collection of compounds involved in biochemical processes,or biomolecules. The structural and chemical diversity of this groupalong with the need to consider biological activity and complexmatrices demands an arsenal of sample preparation, separationmodes, column chemistries, column configurations, and detectiontechniques to effectively characterize the biomolecule under study.There are dozens of techniques or separation modes bioanalyticalchemists use to analyze biomolecules. Typically, in any given separation multiple modes exist; it is rare for a separation to bepurely ion exchange or purely size exclusion, for example. This isespecially true for large biomolecules that may possess many different functional groups and exist in multiple conformations. Thefocus of this guide is on three of the most commonly encounteredseparation modes: reversed phase, ion exchange, and size exclusion.
Reversed Phase (page 6)
• separation is based on hydrophobicity
Ion Exchange (page 23)
• separation is based on molecular charge
Size Exclusion (page 28)
• separation is based on molecular weight and molecular shape
Regardless of the separation mode, consistent particle chemistry and efficient column packing are the keys to achievingreliable, reproducible separations of biomolecules. Table 1 presentsseveral Thermo Scientific HPLC products for biomolecular separations.
Separation Modes Thermo Scientific HPLC Columns
Reversed phase BetaBasic™ C18, C8, C4, CN, PhenylBioBasic™ C18, C8, C4, CN, PhenylHypercarb™
Ion exchange BioBasic AX and SCXSize exclusion BioBasic SEC 60, 120, 300, and 1000
Table 1: Overview of Thermo Scientific columns for biomolecule separation
BioBasic Columns:300Å silica-based particles with superb efficiency, reproducibility,and stability for HPLC and LC/MS separations of proteins, peptides,and nucleic acids.
BetaBasic Columns:150Å silica-based particles in a wide array of reversed phase bonded phase chemistry with superb efficiency, reproducibility, andstability for separations of small molecules, nucleotides, nucleosides,peptides, and protein digests.
Hypercarb Columns:pH-stable carbon particles provide separations based on bothhydrophobicity and molecular geometry. Truly unique selectivitycompared to silica-based reversed phases with enhanced retentionof polar compounds.
HPLC Modes for Biomolecule Separations
HPLC A
nalysis of Biom
olecules
6
Reversed Phase HPLC of Biomolecules
Reversed phase HPLC (RP-HPLC) is a very powerful and widely-usedtechnique for separating biomolecules, both large and small. Its primary advantages over other separation modes are high efficiencyand the ability to distinguish between compounds that are chemicallyvery similar. For example, RP-HPLC can separate large peptides whoseprimary sequences differ by only one amino acid residue. For analystsusing LC/MS in proteomics applications, it is an indispensable tech-nique for separating the peptides in enzymatic digests of proteins.
Mechanism of RP-HPLC Separation
The term “reversed phase” is applied because the first HPLC separa-tions employed a polar support particle and a non-polar eluent. In atypical RP-HPLC separation, these are reversed. The support particleis non-polar; either a resin or carbon particle or a silica particlewhich has been bonded with a non-polar molecule such as alkylchains or phenyl rings. Common RP-HPLC eluents are polar solventssuch as water, methanol, or acetonitrile.
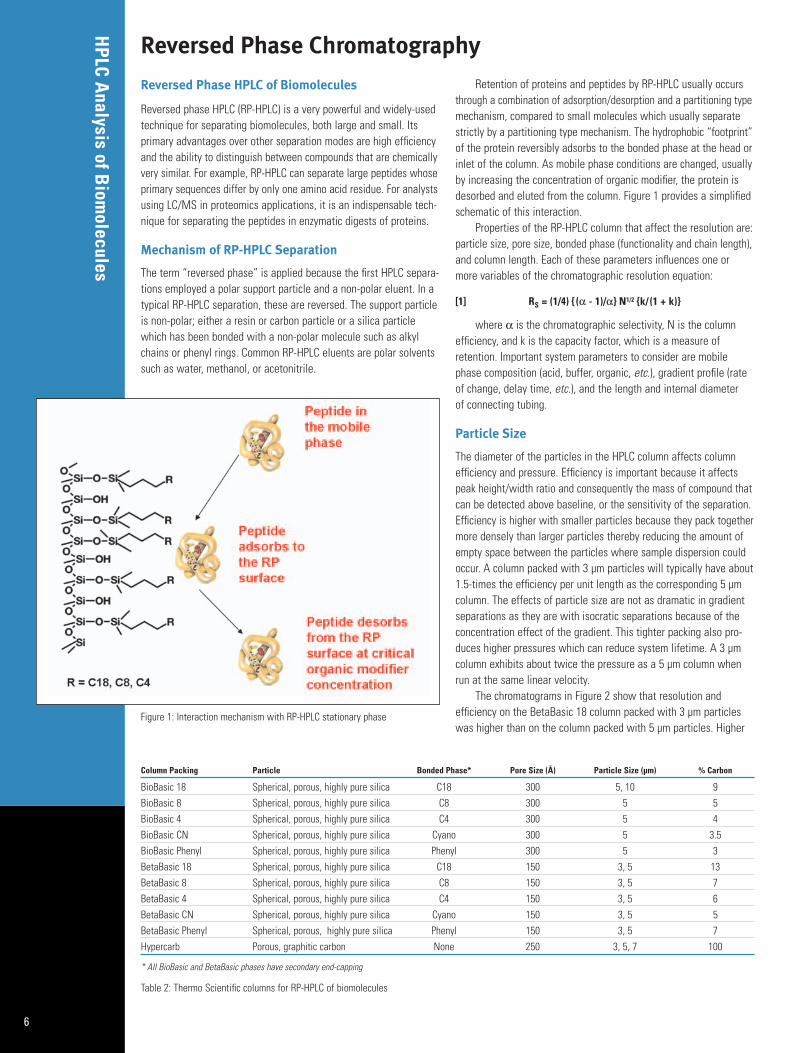
Retention of proteins and peptides by RP-HPLC usually occursthrough a combination of adsorption/desorption and a partitioning typemechanism, compared to small molecules which usually separatestrictly by a partitioning type mechanism. The hydrophobic “footprint”of the protein reversibly adsorbs to the bonded phase at the head orinlet of the column. As mobile phase conditions are changed, usuallyby increasing the concentration of organic modifier, the protein isdesorbed and eluted from the column. Figure 1 provides a simplifiedschematic of this interaction.
Properties of the RP-HPLC column that affect the resolution are:particle size, pore size, bonded phase (functionality and chain length),and column length. Each of these parameters influences one ormore variables of the chromatographic resolution equation:
[1] RS = (1/4) { (α - 1)/α} N1/2 {k/ (1 + k)}
where α is the chromatographic selectivity, N is the columnefficiency, and k is the capacity factor, which is a measure of retention. Important system parameters to consider are mobilephase composition (acid, buffer, organic, etc.), gradient profile (rateof change, delay time, etc.), and the length and internal diameter of connecting tubing.
Particle Size
The diameter of the particles in the HPLC column affects columnefficiency and pressure. Efficiency is important because it affectspeak height/width ratio and consequently the mass of compound thatcan be detected above baseline, or the sensitivity of the separation.Efficiency is higher with smaller particles because they pack togethermore densely than larger particles thereby reducing the amount ofempty space between the particles where sample dispersion couldoccur. A column packed with 3 µm particles will typically have about1.5-times the efficiency per unit length as the corresponding 5 µmcolumn. The effects of particle size are not as dramatic in gradientseparations as they are with isocratic separations because of theconcentration effect of the gradient. This tighter packing also pro-duces higher pressures which can reduce system lifetime. A 3 µmcolumn exhibits about twice the pressure as a 5 µm column whenrun at the same linear velocity.
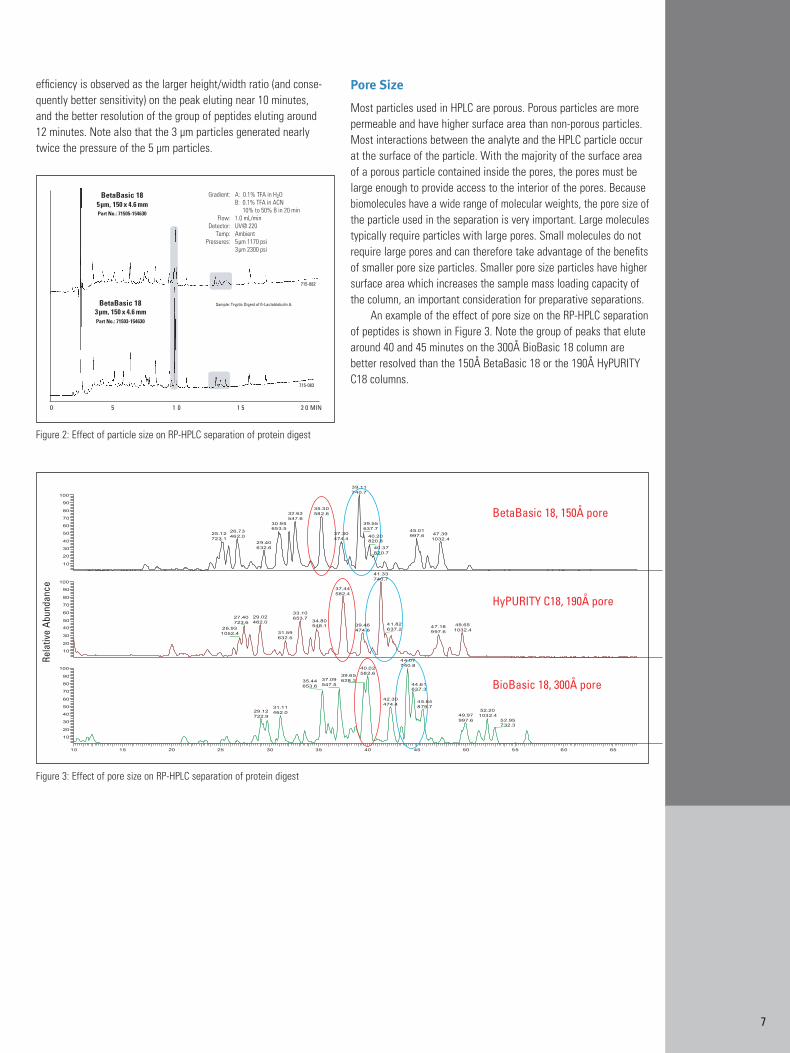
The chromatograms in Figure 2 show that resolution and efficiency on the BetaBasic 18 column packed with 3 µm particleswas higher than on the column packed with 5 µm particles. Higher
Figure 1: Interaction mechanism with RP-HPLC stationary phase
Reversed Phase Chromatography
Column Packing Particle Bonded Phase* Pore Size (Å) Particle Size (µm) % Carbon
BioBasic 18 Spherical, porous, highly pure silica C18 300 5, 10 9BioBasic 8 Spherical, porous, highly pure silica C8 300 5 5BioBasic 4 Spherical, porous, highly pure silica C4 300 5 4BioBasic CN Spherical, porous, highly pure silica Cyano 300 5 3.5BioBasic Phenyl Spherical, porous, highly pure silica Phenyl 300 5 3BetaBasic 18 Spherical, porous, highly pure silica C18 150 3, 5 13BetaBasic 8 Spherical, porous, highly pure silica C8 150 3, 5 7BetaBasic 4 Spherical, porous, highly pure silica C4 150 3, 5 6BetaBasic CN Spherical, porous, highly pure silica Cyano 150 3, 5 5BetaBasic Phenyl Spherical, porous, highly pure silica Phenyl 150 3, 5 7Hypercarb Porous, graphitic carbon None 250 3, 5, 7 100
* All BioBasic and BetaBasic phases have secondary end-capping
Table 2: Thermo Scientific columns for RP-HPLC of biomolecules
7
efficiency is observed as the larger height/width ratio (and conse-quently better sensitivity) on the peak eluting near 10 minutes, and the better resolution of the group of peptides eluting around 12 minutes. Note also that the 3 µm particles generated nearly twice the pressure of the 5 µm particles.
Pore Size
Most particles used in HPLC are porous. Porous particles are morepermeable and have higher surface area than non-porous particles.Most interactions between the analyte and the HPLC particle occurat the surface of the particle. With the majority of the surface areaof a porous particle contained inside the pores, the pores must belarge enough to provide access to the interior of the pores. Becausebiomolecules have a wide range of molecular weights, the pore size ofthe particle used in the separation is very important. Large moleculestypically require particles with large pores. Small molecules do notrequire large pores and can therefore take advantage of the benefitsof smaller pore size particles. Smaller pore size particles have highersurface area which increases the sample mass loading capacity ofthe column, an important consideration for preparative separations.
An example of the effect of pore size on the RP-HPLC separationof peptides is shown in Figure 3. Note the group of peaks that elutearound 40 and 45 minutes on the 300Å BioBasic 18 column are better resolved than the 150Å BetaBasic 18 or the 190Å HyPURITYC18 columns.
Figure 2: Effect of particle size on RP-HPLC separation of protein digest
Figure 3: Effect of pore size on RP-HPLC separation of protein digest
HPLC A
nalysis of Biom
olecules
8
Column Length
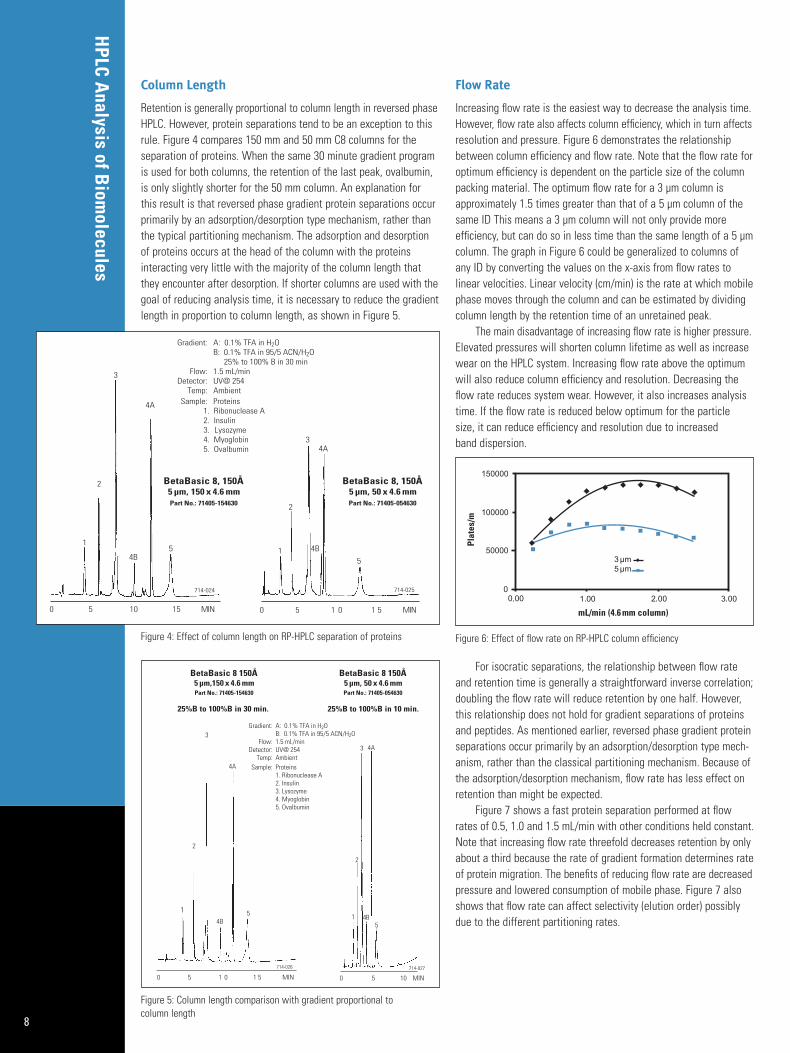
Retention is generally proportional to column length in reversed phaseHPLC. However, protein separations tend to be an exception to thisrule. Figure 4 compares 150 mm and 50 mm C8 columns for the separation of proteins. When the same 30 minute gradient programis used for both columns, the retention of the last peak, ovalbumin,is only slightly shorter for the 50 mm column. An explanation forthis result is that reversed phase gradient protein separations occurprimarily by an adsorption/desorption type mechanism, rather thanthe typical partitioning mechanism. The adsorption and desorptionof proteins occurs at the head of the column with the proteins interacting very little with the majority of the column length thatthey encounter after desorption. If shorter columns are used with thegoal of reducing analysis time, it is necessary to reduce the gradientlength in proportion to column length, as shown in Figure 5.
Flow Rate
Increasing flow rate is the easiest way to decrease the analysis time.However, flow rate also affects column efficiency, which in turn affectsresolution and pressure. Figure 6 demonstrates the relationshipbetween column efficiency and flow rate. Note that the flow rate foroptimum efficiency is dependent on the particle size of the columnpacking material. The optimum flow rate for a 3 µm column isapproximately 1.5 times greater than that of a 5 µm column of thesame ID This means a 3 µm column will not only provide more efficiency, but can do so in less time than the same length of a 5 µmcolumn. The graph in Figure 6 could be generalized to columns ofany ID by converting the values on the x-axis from flow rates to linear velocities. Linear velocity (cm/min) is the rate at which mobilephase moves through the column and can be estimated by dividingcolumn length by the retention time of an unretained peak.
The main disadvantage of increasing flow rate is higher pressure.Elevated pressures will shorten column lifetime as well as increasewear on the HPLC system. Increasing flow rate above the optimumwill also reduce column efficiency and resolution. Decreasing theflow rate reduces system wear. However, it also increases analysistime. If the flow rate is reduced below optimum for the particle size, it can reduce efficiency and resolution due to increased band dispersion.
For isocratic separations, the relationship between flow rateand retention time is generally a straightforward inverse correlation;doubling the flow rate will reduce retention by one half. However,this relationship does not hold for gradient separations of proteinsand peptides. As mentioned earlier, reversed phase gradient proteinseparations occur primarily by an adsorption/desorption type mech-anism, rather than the classical partitioning mechanism. Because ofthe adsorption/desorption mechanism, flow rate has less effect onretention than might be expected.
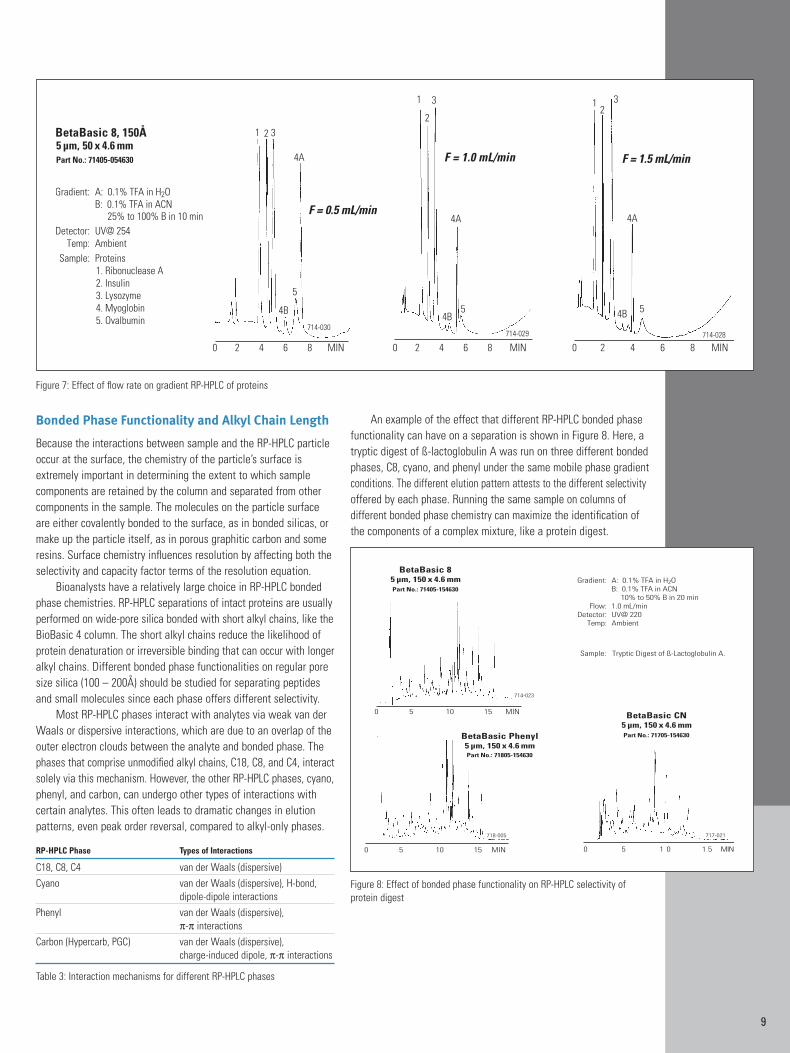
Figure 7 shows a fast protein separation performed at flowrates of 0.5, 1.0 and 1.5 mL/min with other conditions held constant.Note that increasing flow rate threefold decreases retention by onlyabout a third because the rate of gradient formation determines rateof protein migration. The benefits of reducing flow rate are decreasedpressure and lowered consumption of mobile phase. Figure 7 alsoshows that flow rate can affect selectivity (elution order) possiblydue to the different partitioning rates.
Figure 4: Effect of column length on RP-HPLC separation of proteins
Figure 5: Column length comparison with gradient proportional to column length
Figure 6: Effect of flow rate on RP-HPLC column efficiency
9
Bonded Phase Functionality and Alkyl Chain Length
Because the interactions between sample and the RP-HPLC particleoccur at the surface, the chemistry of the particle’s surface isextremely important in determining the extent to which samplecomponents are retained by the column and separated from othercomponents in the sample. The molecules on the particle surfaceare either covalently bonded to the surface, as in bonded silicas, ormake up the particle itself, as in porous graphitic carbon and someresins. Surface chemistry influences resolution by affecting both theselectivity and capacity factor terms of the resolution equation.
Bioanalysts have a relatively large choice in RP-HPLC bondedphase chemistries. RP-HPLC separations of intact proteins are usuallyperformed on wide-pore silica bonded with short alkyl chains, like theBioBasic 4 column. The short alkyl chains reduce the likelihood ofprotein denaturation or irreversible binding that can occur with longeralkyl chains. Different bonded phase functionalities on regular poresize silica (100 – 200Å) should be studied for separating peptidesand small molecules since each phase offers different selectivity.
Most RP-HPLC phases interact with analytes via weak van derWaals or dispersive interactions, which are due to an overlap of theouter electron clouds between the analyte and bonded phase. Thephases that comprise unmodified alkyl chains, C18, C8, and C4, interactsolely via this mechanism. However, the other RP-HPLC phases, cyano,phenyl, and carbon, can undergo other types of interactions withcertain analytes. This often leads to dramatic changes in elutionpatterns, even peak order reversal, compared to alkyl-only phases.
RP-HPLC Phase Types of Interactions
C18, C8, C4 van der Waals (dispersive)Cyano van der Waals (dispersive), H-bond,
dipole-dipole interactionsPhenyl van der Waals (dispersive),
π-π interactionsCarbon (Hypercarb, PGC) van der Waals (dispersive),
charge-induced dipole, π-π interactions
Table 3: Interaction mechanisms for different RP-HPLC phases
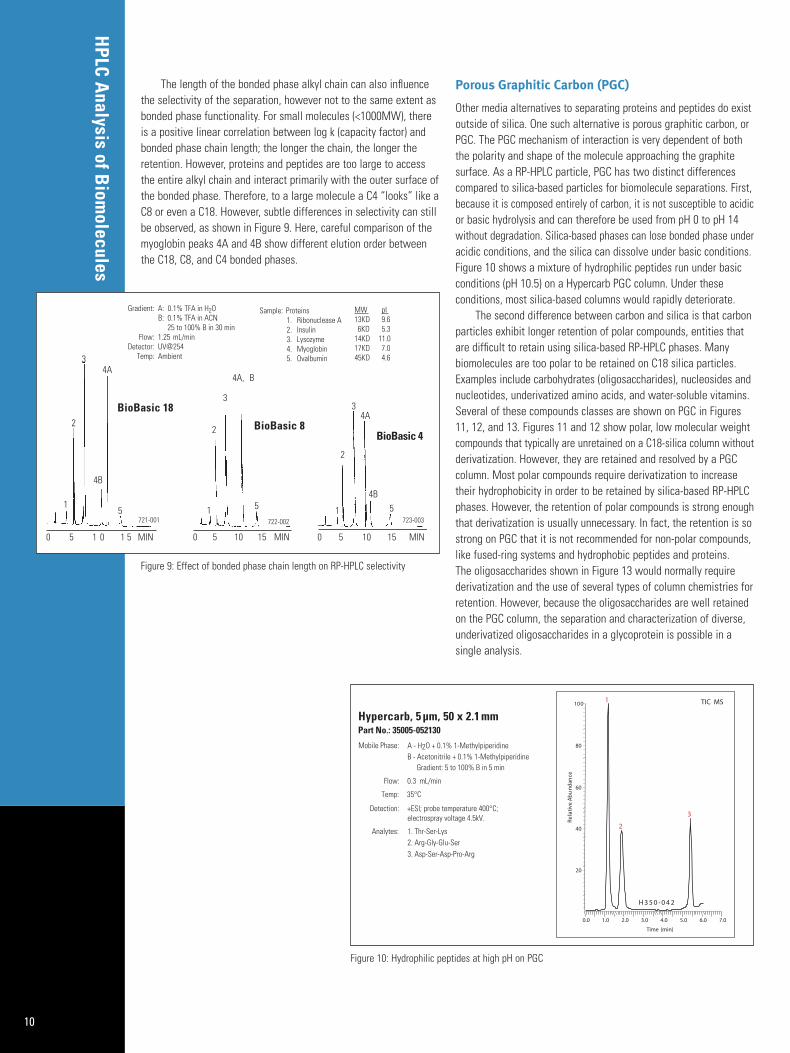
An example of the effect that different RP-HPLC bonded phasefunctionality can have on a separation is shown in Figure 8. Here, atryptic digest of ß-lactoglobulin A was run on three different bondedphases, C8, cyano, and phenyl under the same mobile phase gradientconditions. The different elution pattern attests to the different selectivityoffered by each phase. Running the same sample on columns of different bonded phase chemistry can maximize the identification ofthe components of a complex mixture, like a protein digest.
Figure 7: Effect of flow rate on gradient RP-HPLC of proteins
Figure 8: Effect of bonded phase functionality on RP-HPLC selectivity of protein digest
HPLC A
nalysis of Biom
olecules
10
The length of the bonded phase alkyl chain can also influencethe selectivity of the separation, however not to the same extent asbonded phase functionality. For small molecules (<1000MW), thereis a positive linear correlation between log k (capacity factor) andbonded phase chain length; the longer the chain, the longer theretention. However, proteins and peptides are too large to accessthe entire alkyl chain and interact primarily with the outer surface ofthe bonded phase. Therefore, to a large molecule a C4 “looks” like aC8 or even a C18. However, subtle differences in selectivity can stillbe observed, as shown in Figure 9. Here, careful comparison of themyoglobin peaks 4A and 4B show different elution order betweenthe C18, C8, and C4 bonded phases.
Porous Graphitic Carbon (PGC)
Other media alternatives to separating proteins and peptides do existoutside of silica. One such alternative is porous graphitic carbon, orPGC. The PGC mechanism of interaction is very dependent of boththe polarity and shape of the molecule approaching the graphitesurface. As a RP-HPLC particle, PGC has two distinct differencescompared to silica-based particles for biomolecule separations. First,because it is composed entirely of carbon, it is not susceptible to acidicor basic hydrolysis and can therefore be used from pH 0 to pH 14without degradation. Silica-based phases can lose bonded phase underacidic conditions, and the silica can dissolve under basic conditions.Figure 10 shows a mixture of hydrophilic peptides run under basicconditions (pH 10.5) on a Hypercarb PGC column. Under these conditions, most silica-based columns would rapidly deteriorate.
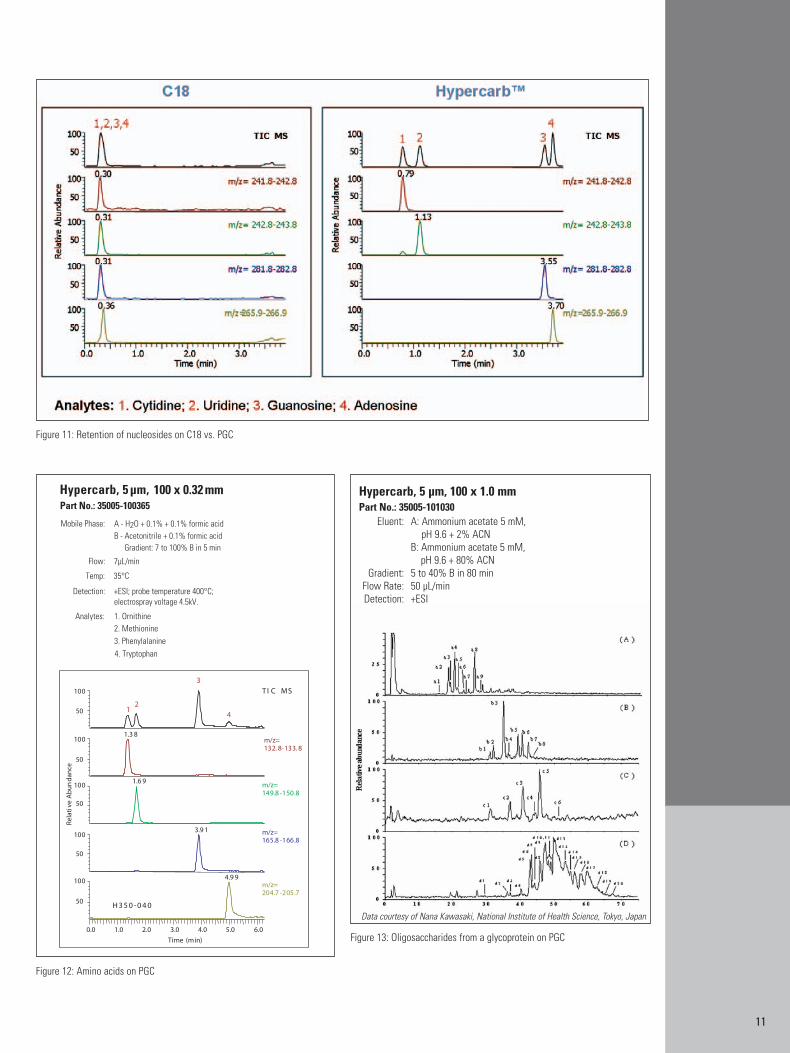
The second difference between carbon and silica is that carbonparticles exhibit longer retention of polar compounds, entities thatare difficult to retain using silica-based RP-HPLC phases. Many biomolecules are too polar to be retained on C18 silica particles.Examples include carbohydrates (oligosaccharides), nucleosides andnucleotides, underivatized amino acids, and water-soluble vitamins.Several of these compounds classes are shown on PGC in Figures11, 12, and 13. Figures 11 and 12 show polar, low molecular weightcompounds that typically are unretained on a C18-silica column withoutderivatization. However, they are retained and resolved by a PGCcolumn. Most polar compounds require derivatization to increasetheir hydrophobicity in order to be retained by silica-based RP-HPLCphases. However, the retention of polar compounds is strong enoughthat derivatization is usually unnecessary. In fact, the retention is sostrong on PGC that it is not recommended for non-polar compounds,like fused-ring systems and hydrophobic peptides and proteins. The oligosaccharides shown in Figure 13 would normally requirederivatization and the use of several types of column chemistries forretention. However, because the oligosaccharides are well retainedon the PGC column, the separation and characterization of diverse,underivatized oligosaccharides in a glycoprotein is possible in a single analysis.
Figure 9: Effect of bonded phase chain length on RP-HPLC selectivity
Figure 10: Hydrophilic peptides at high pH on PGC
11
Hypercarb, 5 µm, 100 x 1.0 mmPart No.: 35005-101030
Eluent: A: Ammonium acetate 5 mM, pH 9.6 + 2% ACN
B: Ammonium acetate 5 mM, pH 9.6 + 80% ACN
Gradient: 5 to 40% B in 80 minFlow Rate: 50 µL/minDetection: +ESI
Data courtesy of Nana Kawasaki, National Institute of Health Science, Tokyo, Japan
Figure 11: Retention of nucleosides on C18 vs. PGC
Figure 12: Amino acids on PGC
Figure 13: Oligosaccharides from a glycoprotein on PGC
HPLC A
nalysis of Biom
olecules
12
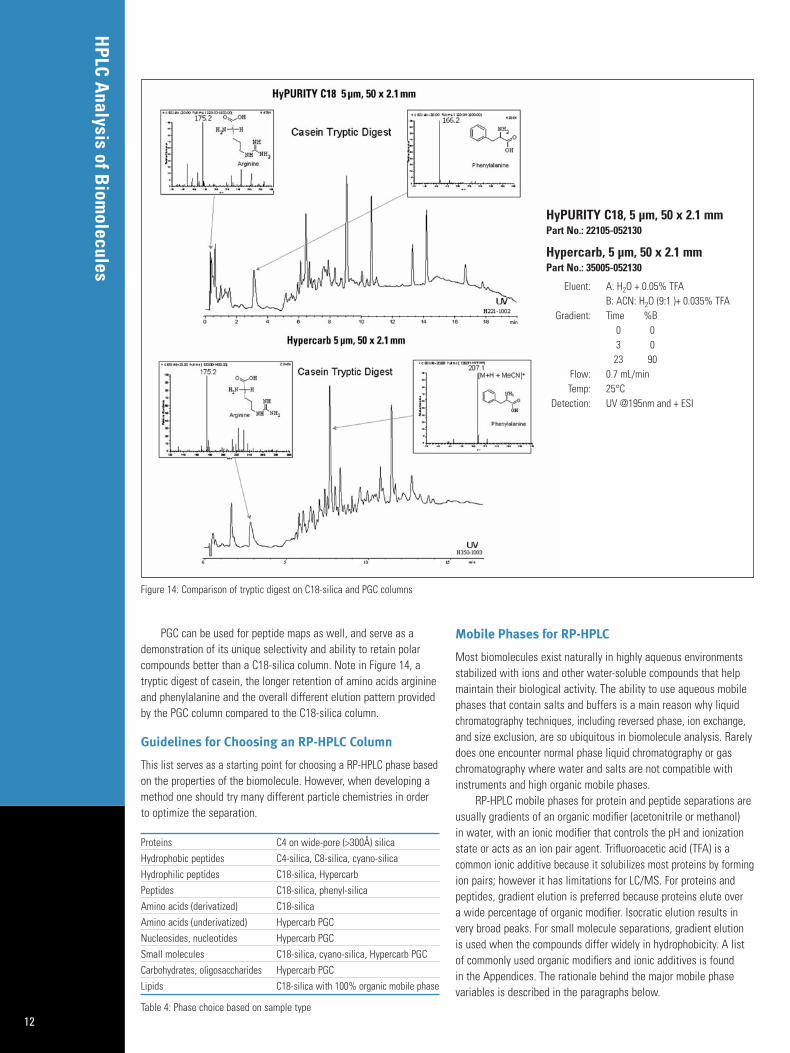
PGC can be used for peptide maps as well, and serve as ademonstration of its unique selectivity and ability to retain polarcompounds better than a C18-silica column. Note in Figure 14, atryptic digest of casein, the longer retention of amino acids arginineand phenylalanine and the overall different elution pattern providedby the PGC column compared to the C18-silica column.
Guidelines for Choosing an RP-HPLC Column
This list serves as a starting point for choosing a RP-HPLC phase basedon the properties of the biomolecule. However, when developing amethod one should try many different particle chemistries in orderto optimize the separation.
Proteins C4 on wide-pore (>300Å) silicaHydrophobic peptides C4-silica, C8-silica, cyano-silicaHydrophilic peptides C18-silica, Hypercarb Peptides C18-silica, phenyl-silicaAmino acids (derivatized) C18-silicaAmino acids (underivatized) Hypercarb PGCNucleosides, nucleotides Hypercarb PGCSmall molecules C18-silica, cyano-silica, Hypercarb PGCCarbohydrates, oligosaccharides Hypercarb PGCLipids C18-silica with 100% organic mobile phase
Table 4: Phase choice based on sample type
Mobile Phases for RP-HPLC
Most biomolecules exist naturally in highly aqueous environmentsstabilized with ions and other water-soluble compounds that helpmaintain their biological activity. The ability to use aqueous mobilephases that contain salts and buffers is a main reason why liquidchromatography techniques, including reversed phase, ion exchange,and size exclusion, are so ubiquitous in biomolecule analysis. Rarelydoes one encounter normal phase liquid chromatography or gaschromatography where water and salts are not compatible withinstruments and high organic mobile phases.
RP-HPLC mobile phases for protein and peptide separations areusually gradients of an organic modifier (acetonitrile or methanol) in water, with an ionic modifier that controls the pH and ionizationstate or acts as an ion pair agent. Trifluoroacetic acid (TFA) is a common ionic additive because it solubilizes most proteins by formingion pairs; however it has limitations for LC/MS. For proteins andpeptides, gradient elution is preferred because proteins elute over a wide percentage of organic modifier. Isocratic elution results invery broad peaks. For small molecule separations, gradient elutionis used when the compounds differ widely in hydrophobicity. A listof commonly used organic modifiers and ionic additives is found in the Appendices. The rationale behind the major mobile phasevariables is described in the paragraphs below.
HyPURITY C18, 5 µm, 50 x 2.1 mmPart No.: 22105-052130
Hypercarb, 5 µm, 50 x 2.1 mmPart No.: 35005-052130
Eluent: A: H2O + 0.05% TFAB: ACN: H2O (9:1 )+ 0.035% TFA
Gradient: Time %B0 03 023 90
Flow: 0.7 mL/minTemp: 25°C
Detection: UV @195nm and + ESI
Figure 14: Comparison of tryptic digest on C18-silica and PGC columns
13
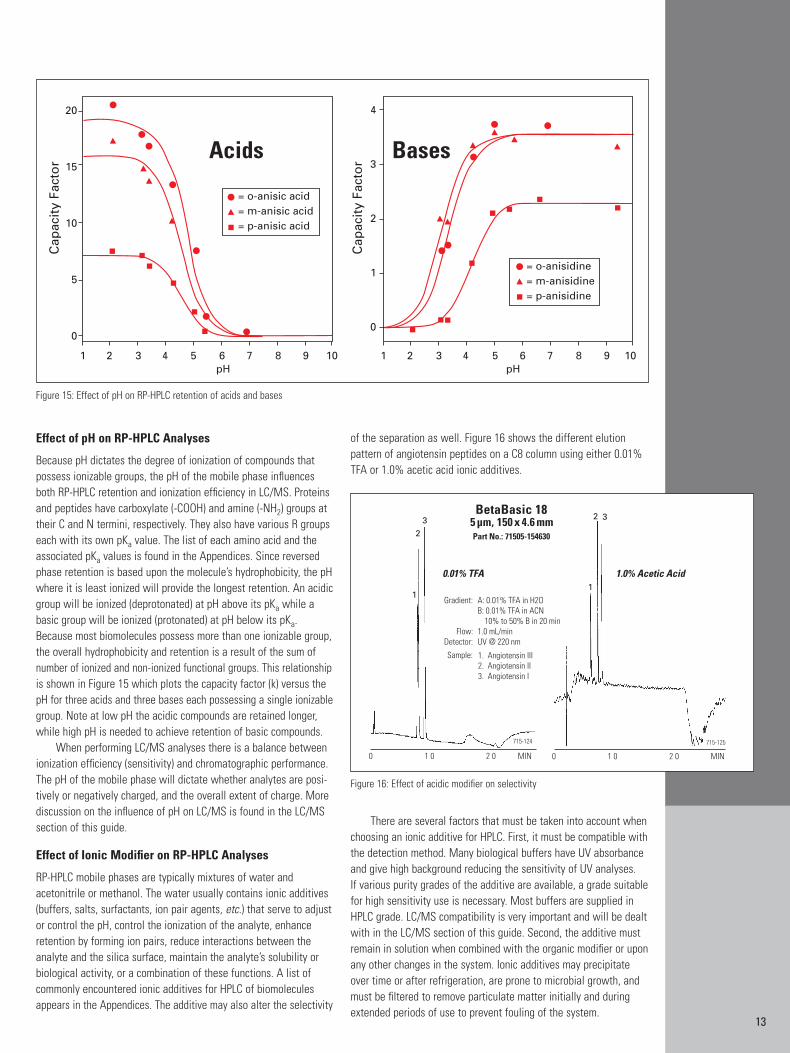
Effect of pH on RP-HPLC Analyses
Because pH dictates the degree of ionization of compounds thatpossess ionizable groups, the pH of the mobile phase influencesboth RP-HPLC retention and ionization efficiency in LC/MS. Proteinsand peptides have carboxylate (-COOH) and amine (-NH2) groups attheir C and N termini, respectively. They also have various R groupseach with its own pKa value. The list of each amino acid and theassociated pKa values is found in the Appendices. Since reversedphase retention is based upon the molecule’s hydrophobicity, the pHwhere it is least ionized will provide the longest retention. An acidicgroup will be ionized (deprotonated) at pH above its pKa while abasic group will be ionized (protonated) at pH below its pKa.Because most biomolecules possess more than one ionizable group,the overall hydrophobicity and retention is a result of the sum ofnumber of ionized and non-ionized functional groups. This relationshipis shown in Figure 15 which plots the capacity factor (k) versus thepH for three acids and three bases each possessing a single ionizablegroup. Note at low pH the acidic compounds are retained longer,while high pH is needed to achieve retention of basic compounds.
When performing LC/MS analyses there is a balance betweenionization efficiency (sensitivity) and chromatographic performance.The pH of the mobile phase will dictate whether analytes are posi-tively or negatively charged, and the overall extent of charge. Morediscussion on the influence of pH on LC/MS is found in the LC/MSsection of this guide.
Effect of Ionic Modifier on RP-HPLC Analyses
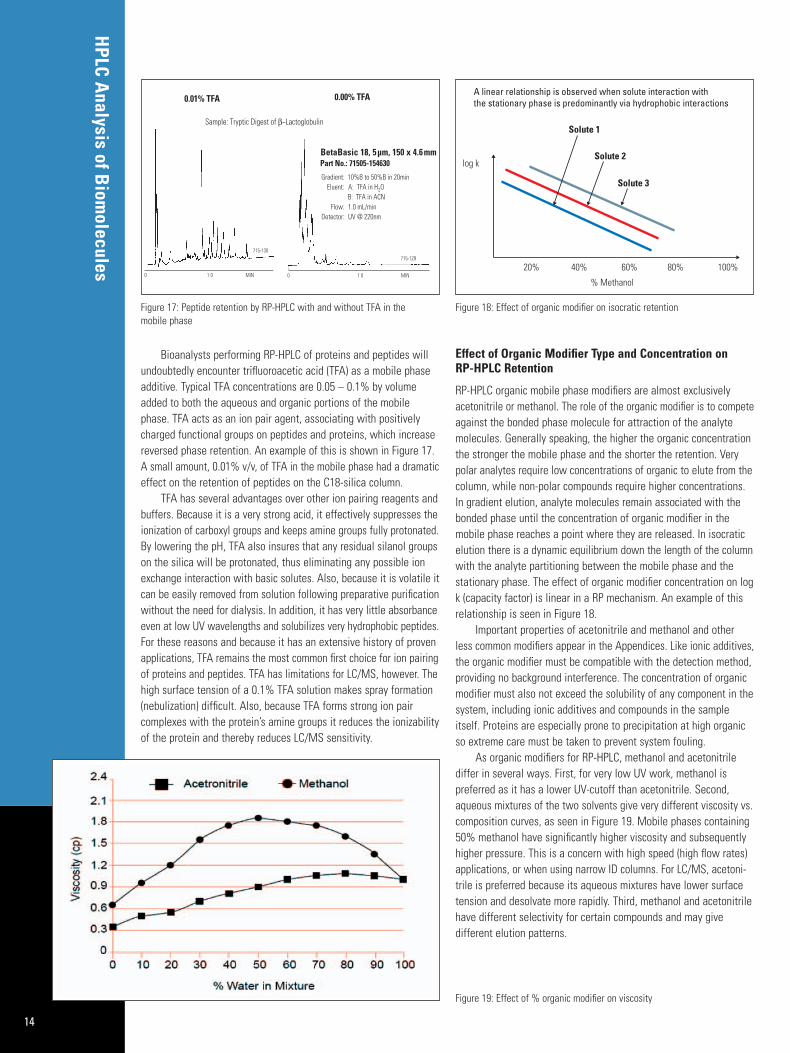
RP-HPLC mobile phases are typically mixtures of water and acetonitrile or methanol. The water usually contains ionic additives(buffers, salts, surfactants, ion pair agents, etc.) that serve to adjustor control the pH, control the ionization of the analyte, enhanceretention by forming ion pairs, reduce interactions between the analyte and the silica surface, maintain the analyte’s solubility orbiological activity, or a combination of these functions. A list ofcommonly encountered ionic additives for HPLC of biomoleculesappears in the Appendices. The additive may also alter the selectivity
of the separation as well. Figure 16 shows the different elution pattern of angiotensin peptides on a C8 column using either 0.01%TFA or 1.0% acetic acid ionic additives.
There are several factors that must be taken into account whenchoosing an ionic additive for HPLC. First, it must be compatible withthe detection method. Many biological buffers have UV absorbanceand give high background reducing the sensitivity of UV analyses. If various purity grades of the additive are available, a grade suitablefor high sensitivity use is necessary. Most buffers are supplied inHPLC grade. LC/MS compatibility is very important and will be dealtwith in the LC/MS section of this guide. Second, the additive mustremain in solution when combined with the organic modifier or uponany other changes in the system. Ionic additives may precipitateover time or after refrigeration, are prone to microbial growth, andmust be filtered to remove particulate matter initially and duringextended periods of use to prevent fouling of the system.
Figure 16: Effect of acidic modifier on selectivity
Figure 15: Effect of pH on RP-HPLC retention of acids and bases
HPLC A
nalysis of Biom
olecules
14
Bioanalysts performing RP-HPLC of proteins and peptides willundoubtedly encounter trifluoroacetic acid (TFA) as a mobile phaseadditive. Typical TFA concentrations are 0.05 – 0.1% by volumeadded to both the aqueous and organic portions of the mobilephase. TFA acts as an ion pair agent, associating with positivelycharged functional groups on peptides and proteins, which increasereversed phase retention. An example of this is shown in Figure 17.A small amount, 0.01% v/v, of TFA in the mobile phase had a dramaticeffect on the retention of peptides on the C18-silica column.
TFA has several advantages over other ion pairing reagents andbuffers. Because it is a very strong acid, it effectively suppresses theionization of carboxyl groups and keeps amine groups fully protonated.By lowering the pH, TFA also insures that any residual silanol groupson the silica will be protonated, thus eliminating any possible ionexchange interaction with basic solutes. Also, because it is volatile itcan be easily removed from solution following preparative purificationwithout the need for dialysis. In addition, it has very little absorbanceeven at low UV wavelengths and solubilizes very hydrophobic peptides.For these reasons and because it has an extensive history of provenapplications, TFA remains the most common first choice for ion pairingof proteins and peptides. TFA has limitations for LC/MS, however. Thehigh surface tension of a 0.1% TFA solution makes spray formation(nebulization) difficult. Also, because TFA forms strong ion pair complexes with the protein’s amine groups it reduces the ionizabilityof the protein and thereby reduces LC/MS sensitivity.
Effect of Organic Modifier Type and Concentration on RP-HPLC Retention
RP-HPLC organic mobile phase modifiers are almost exclusively acetonitrile or methanol. The role of the organic modifier is to competeagainst the bonded phase molecule for attraction of the analytemolecules. Generally speaking, the higher the organic concentrationthe stronger the mobile phase and the shorter the retention. Verypolar analytes require low concentrations of organic to elute from thecolumn, while non-polar compounds require higher concentrations.In gradient elution, analyte molecules remain associated with thebonded phase until the concentration of organic modifier in themobile phase reaches a point where they are released. In isocraticelution there is a dynamic equilibrium down the length of the columnwith the analyte partitioning between the mobile phase and the stationary phase. The effect of organic modifier concentration on logk (capacity factor) is linear in a RP mechanism. An example of thisrelationship is seen in Figure 18.
Important properties of acetonitrile and methanol and otherless common modifiers appear in the Appendices. Like ionic additives,the organic modifier must be compatible with the detection method,providing no background interference. The concentration of organicmodifier must also not exceed the solubility of any component in thesystem, including ionic additives and compounds in the sampleitself. Proteins are especially prone to precipitation at high organicso extreme care must be taken to prevent system fouling.
As organic modifiers for RP-HPLC, methanol and acetonitrile differ in several ways. First, for very low UV work, methanol is preferred as it has a lower UV-cutoff than acetonitrile. Second,aqueous mixtures of the two solvents give very different viscosity vs.composition curves, as seen in Figure 19. Mobile phases containing50% methanol have significantly higher viscosity and subsequentlyhigher pressure. This is a concern with high speed (high flow rates)applications, or when using narrow ID columns. For LC/MS, acetoni-trile is preferred because its aqueous mixtures have lower surfacetension and desolvate more rapidly. Third, methanol and acetonitrilehave different selectivity for certain compounds and may give different elution patterns.
Figure 19: Effect of % organic modifier on viscosity
Figure 17: Peptide retention by RP-HPLC with and without TFA in the mobile phase
Figure 18: Effect of organic modifier on isocratic retention
15
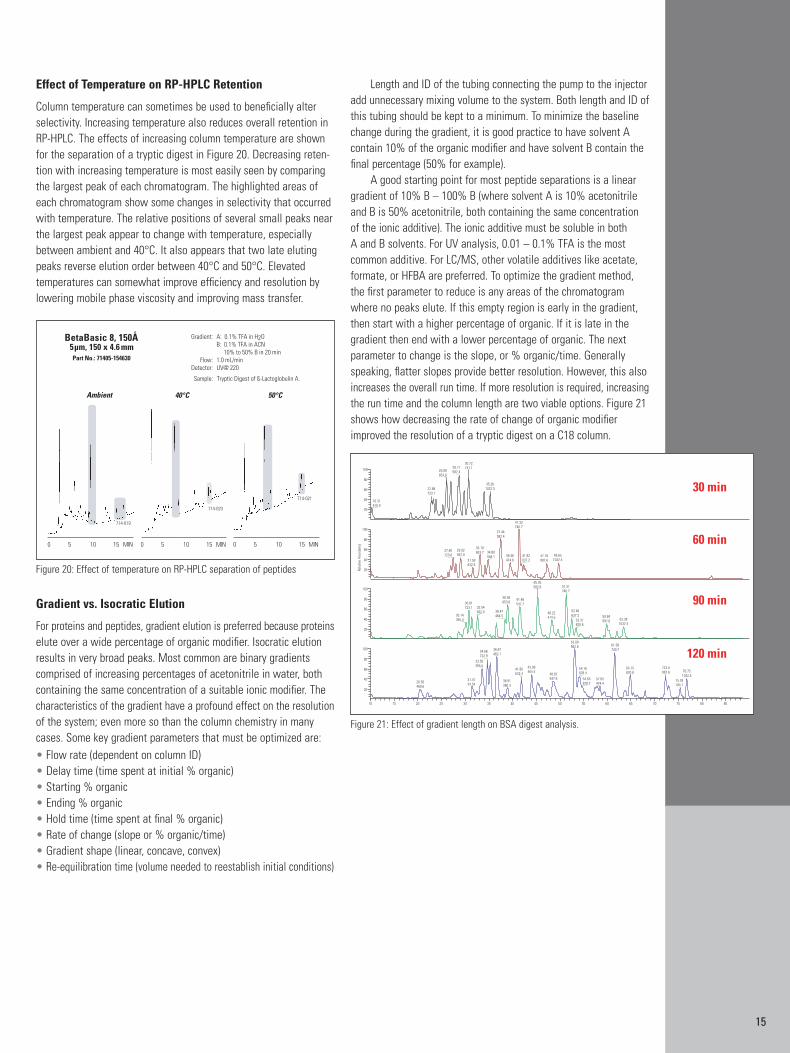
Effect of Temperature on RP-HPLC Retention
Column temperature can sometimes be used to beneficially alterselectivity. Increasing temperature also reduces overall retention inRP-HPLC. The effects of increasing column temperature are shownfor the separation of a tryptic digest in Figure 20. Decreasing reten-tion with increasing temperature is most easily seen by comparingthe largest peak of each chromatogram. The highlighted areas ofeach chromatogram show some changes in selectivity that occurredwith temperature. The relative positions of several small peaks nearthe largest peak appear to change with temperature, especiallybetween ambient and 40°C. It also appears that two late elutingpeaks reverse elution order between 40°C and 50°C. Elevated temperatures can somewhat improve efficiency and resolution bylowering mobile phase viscosity and improving mass transfer.
Gradient vs. Isocratic Elution
For proteins and peptides, gradient elution is preferred because proteinselute over a wide percentage of organic modifier. Isocratic elutionresults in very broad peaks. Most common are binary gradients comprised of increasing percentages of acetonitrile in water, bothcontaining the same concentration of a suitable ionic modifier. Thecharacteristics of the gradient have a profound effect on the resolutionof the system; even more so than the column chemistry in manycases. Some key gradient parameters that must be optimized are:• Flow rate (dependent on column ID)• Delay time (time spent at initial % organic)• Starting % organic• Ending % organic• Hold time (time spent at final % organic)• Rate of change (slope or % organic/time)• Gradient shape (linear, concave, convex)• Re-equilibration time (volume needed to reestablish initial conditions)
Length and ID of the tubing connecting the pump to the injectoradd unnecessary mixing volume to the system. Both length and ID ofthis tubing should be kept to a minimum. To minimize the baselinechange during the gradient, it is good practice to have solvent Acontain 10% of the organic modifier and have solvent B contain thefinal percentage (50% for example).
A good starting point for most peptide separations is a lineargradient of 10% B – 100% B (where solvent A is 10% acetonitrileand B is 50% acetonitrile, both containing the same concentrationof the ionic additive). The ionic additive must be soluble in both A and B solvents. For UV analysis, 0.01 – 0.1% TFA is the mostcommon additive. For LC/MS, other volatile additives like acetate,formate, or HFBA are preferred. To optimize the gradient method,the first parameter to reduce is any areas of the chromatogramwhere no peaks elute. If this empty region is early in the gradient,then start with a higher percentage of organic. If it is late in thegradient then end with a lower percentage of organic. The nextparameter to change is the slope, or % organic/time. Generallyspeaking, flatter slopes provide better resolution. However, this alsoincreases the overall run time. If more resolution is required, increasingthe run time and the column length are two viable options. Figure 21shows how decreasing the rate of change of organic modifierimproved the resolution of a tryptic digest on a C18 column.
Figure 20: Effect of temperature on RP-HPLC separation of peptides
Figure 21: Effect of gradient length on BSA digest analysis.
HPLC A
nalysis of Biom
olecules
16
RP-LC/MS of Biomolecules
HPLC with mass spectrometric detection (LC/MS) is fast becomingthe method of choice for many biomolecule analyses. A full discussionof LC/MS, the instruments, ionization techniques, and interfaces, isbeyond the scope of this guide. However, the focus of this guide, theHPLC column, is more than a MS filter. The chemistry of the particleand the configuration of the hardware significantly affect the relevanceand reliability of the data that is obtained from the LC/MS instrument.In addition to the column, the mobile phase conditions have a profoundinfluence on the quality of LC/MS data. Mass spectrometric detectionhas high compound specificity and selectivity which lessens the require -ments for high selectivity separations; however, it brings limitationsto the method development process. For instance, the choice of mobilephase composition is restricted since mobile phase needs to balancethe chromatographic requirements with the ionization efficiency.
Column Selection for RP-LC/MS: Column ID
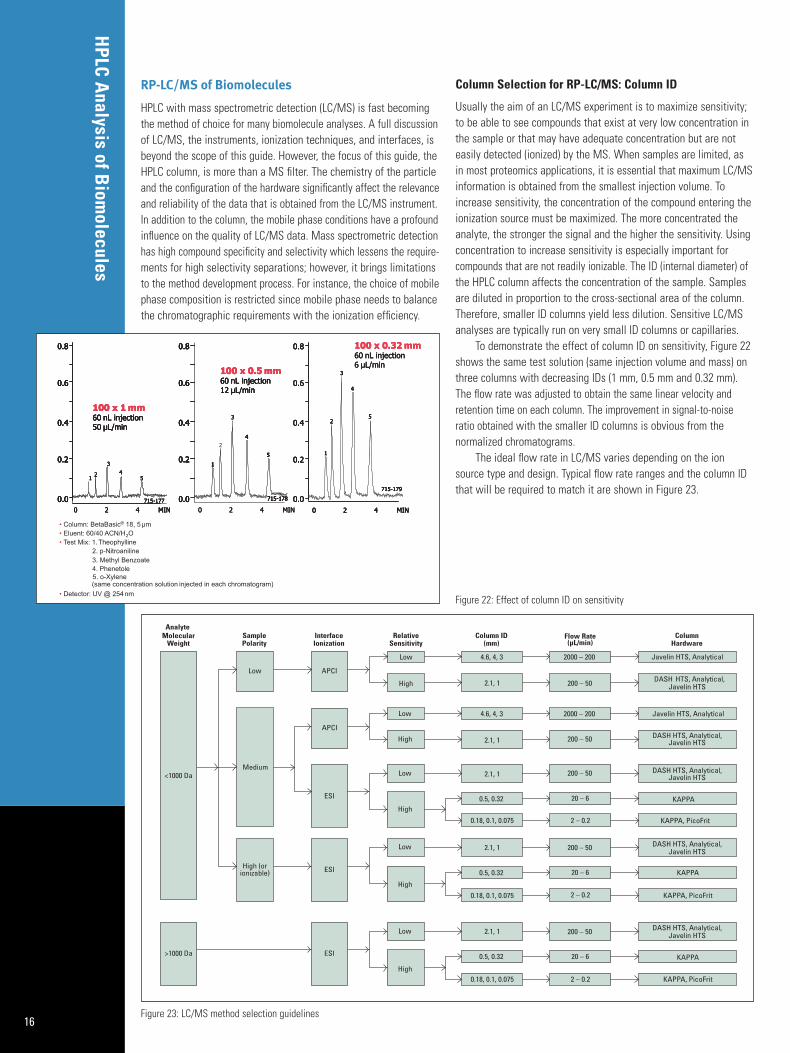
Usually the aim of an LC/MS experiment is to maximize sensitivity;to be able to see compounds that exist at very low concentration inthe sample or that may have adequate concentration but are noteasily detected (ionized) by the MS. When samples are limited, asin most proteomics applications, it is essential that maximum LC/MSinformation is obtained from the smallest injection volume. Toincrease sensitivity, the concentration of the compound entering theionization source must be maximized. The more concentrated theanalyte, the stronger the signal and the higher the sensitivity. Usingconcentration to increase sensitivity is especially important for compounds that are not readily ionizable. The ID (internal diameter) ofthe HPLC column affects the concentration of the sample. Samplesare diluted in proportion to the cross-sectional area of the column.Therefore, smaller ID columns yield less dilution. Sensitive LC/MSanalyses are typically run on very small ID columns or capillaries.
To demonstrate the effect of column ID on sensitivity, Figure 22shows the same test solution (same injection volume and mass) onthree columns with decreasing IDs (1 mm, 0.5 mm and 0.32 mm).The flow rate was adjusted to obtain the same linear velocity andretention time on each column. The improvement in signal-to-noiseratio obtained with the smaller ID columns is obvious from the normalized chromatograms.
The ideal flow rate in LC/MS varies depending on the ionsource type and design. Typical flow rate ranges and the column IDthat will be required to match it are shown in Figure 23.
Figure 23: LC/MS method selection guidelines
Figure 22: Effect of column ID on sensitivity
17
Maintaining Constant Linear Velocity with Changing Column ID
It is important to use the proper flow rate for the HPLC column andMS interface to which it is connected. The standard flow rate for a4.6 mm ID column packed with 5 µm particles is 1 mL/min. Toachieve the same linear velocity (cm/min) and hence the sameretention time when moving from one column ID to another, multiplyby the square of the ratios of the column IDs. The equation belowpresents this calculation for the flow rate on a 2.1 mm ID column (A)when the flow rate on the 4.6 mm ID column (B) is 1 mL/min.
[2] Flow B = Flow A x (ID B/ID A)2 = 1 x (2.1/4.6)2 = 0.2 mL/min
Flow rates can be changed to achieve different chromatographicgoals. Typically columns can be run from one-half to twice the recommended flow rate. However, lower flow rates may give superiorchromatography, but result in longer run times. Higher flow ratesmay result in shorter run times but poorer resolution. The amount ofresolution that can be traded for decreased analysis time and fasterthroughput will depend upon the specific requirements of the analysis.
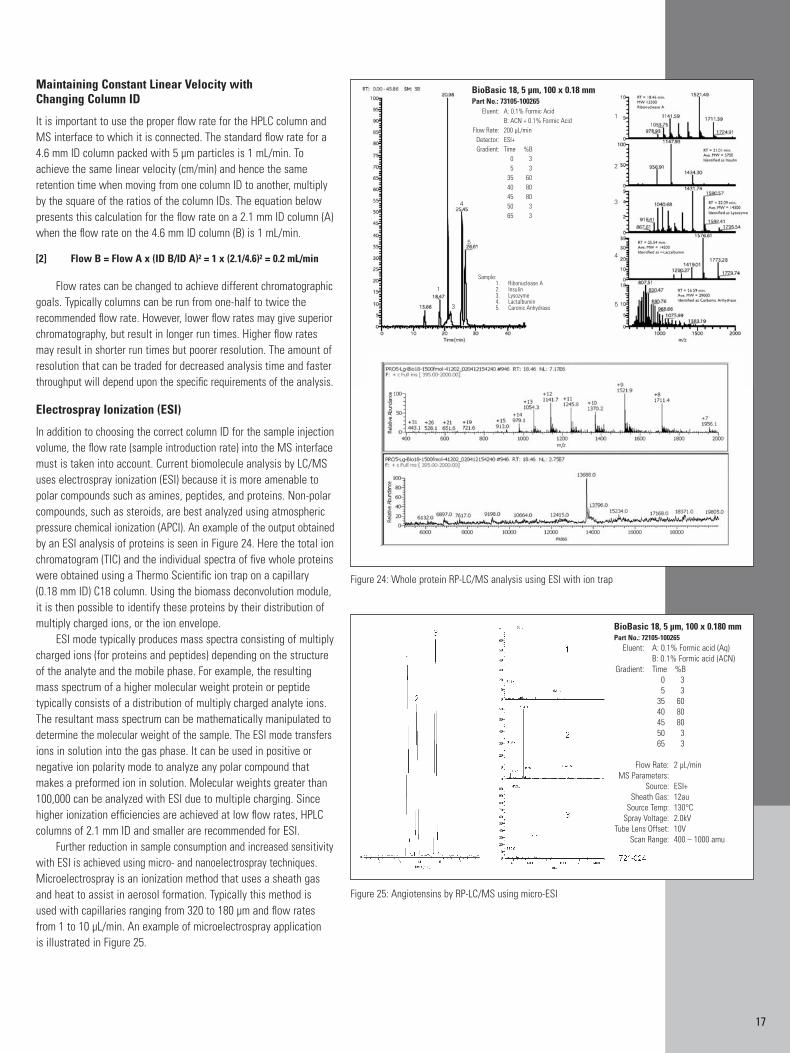
Electrospray Ionization (ESI)
In addition to choosing the correct column ID for the sample injectionvolume, the flow rate (sample introduction rate) into the MS interfacemust is taken into account. Current biomolecule analysis by LC/MSuses electrospray ionization (ESI) because it is more amenable topolar compounds such as amines, peptides, and proteins. Non-polarcompounds, such as steroids, are best analyzed using atmosphericpressure chemical ionization (APCI). An example of the output obtainedby an ESI analysis of proteins is seen in Figure 24. Here the total ionchromatogram (TIC) and the individual spectra of five whole proteinswere obtained using a Thermo Scientific ion trap on a capillary (0.18 mm ID) C18 column. Using the biomass deconvolution module,it is then possible to identify these proteins by their distribution ofmultiply charged ions, or the ion envelope.
ESI mode typically produces mass spectra consisting of multiplycharged ions (for proteins and peptides) depending on the structureof the analyte and the mobile phase. For example, the resultingmass spectrum of a higher molecular weight protein or peptide typically consists of a distribution of multiply charged analyte ions.The resultant mass spectrum can be mathematically manipulated todetermine the molecular weight of the sample. The ESI mode transfersions in solution into the gas phase. It can be used in positive or negative ion polarity mode to analyze any polar compound thatmakes a preformed ion in solution. Molecular weights greater than100,000 can be analyzed with ESI due to multiple charging. Sincehigher ionization efficiencies are achieved at low flow rates, HPLCcolumns of 2.1 mm ID and smaller are recommended for ESI.
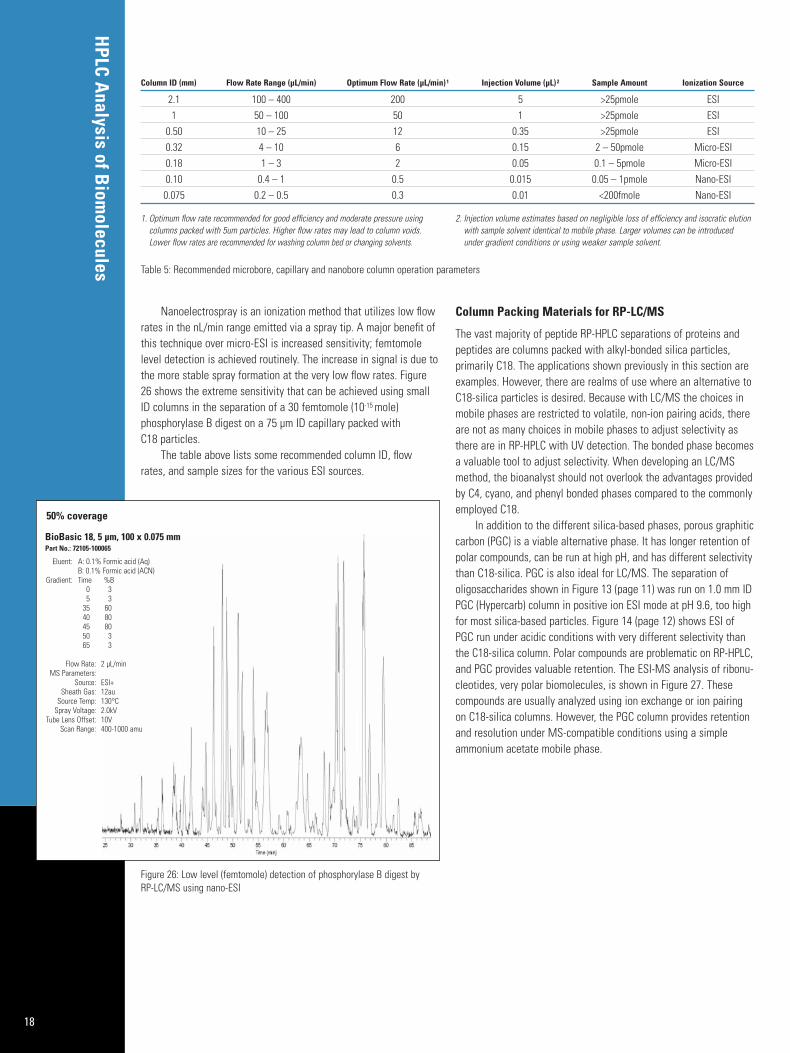
Further reduction in sample consumption and increased sensitivitywith ESI is achieved using micro- and nanoelectrospray techniques.Microelectrospray is an ionization method that uses a sheath gasand heat to assist in aerosol formation. Typically this method isused with capillaries ranging from 320 to 180 µm and flow ratesfrom 1 to 10 µL/min. An example of microelectrospray application is illustrated in Figure 25.
BioBasic 18, 5 µm, 100 x 0.180 mmPart No.: 72105-100265
Eluent: A: 0.1% Formic acid (Aq) B: 0.1% Formic acid (ACN)
Gradient: Time %B0 35 3
35 6040 8045 8050 365 3
Flow Rate: 2 µL/minMS Parameters:
Source: ESI+Sheath Gas: 12au
Source Temp: 130°CSpray Voltage: 2.0kV
Tube Lens Offset: 10VScan Range: 400 – 1000 amu
BioBasic 18, 5 µm, 100 x 0.18 mmPart No.: 73105-100265
Eluent: A: 0.1% Formic AcidB: ACN + 0.1% Formic Acid
Flow Rate: 200 µL/minDetector: ESI+Gradient: Time %B
0 35 3
35 6040 8045 8050 365 3
Sample:1. Ribonuclease A2. Insulin3. Lysozyme4. Lactalbumin5. Caronic Anhydrase
1
1
2
3
4
53
4
5
Figure 25: Angiotensins by RP-LC/MS using micro-ESI
Figure 24: Whole protein RP-LC/MS analysis using ESI with ion trap
HPLC A
nalysis of Biom
olecules
18
Nanoelectrospray is an ionization method that utilizes low flowrates in the nL/min range emitted via a spray tip. A major benefit ofthis technique over micro-ESI is increased sensitivity; femtomolelevel detection is achieved routinely. The increase in signal is due tothe more stable spray formation at the very low flow rates. Figure26 shows the extreme sensitivity that can be achieved using smallID columns in the separation of a 30 femtomole (10-15 mole) phosphorylase B digest on a 75 µm ID capillary packed with C18 particles.
The table above lists some recommended column ID, flowrates, and sample sizes for the various ESI sources.
Column Packing Materials for RP-LC/MS
The vast majority of peptide RP-HPLC separations of proteins andpeptides are columns packed with alkyl-bonded silica particles, primarily C18. The applications shown previously in this section areexamples. However, there are realms of use where an alternative toC18-silica particles is desired. Because with LC/MS the choices inmobile phases are restricted to volatile, non-ion pairing acids, thereare not as many choices in mobile phases to adjust selectivity asthere are in RP-HPLC with UV detection. The bonded phase becomesa valuable tool to adjust selectivity. When developing an LC/MSmethod, the bioanalyst should not overlook the advantages providedby C4, cyano, and phenyl bonded phases compared to the commonlyemployed C18.
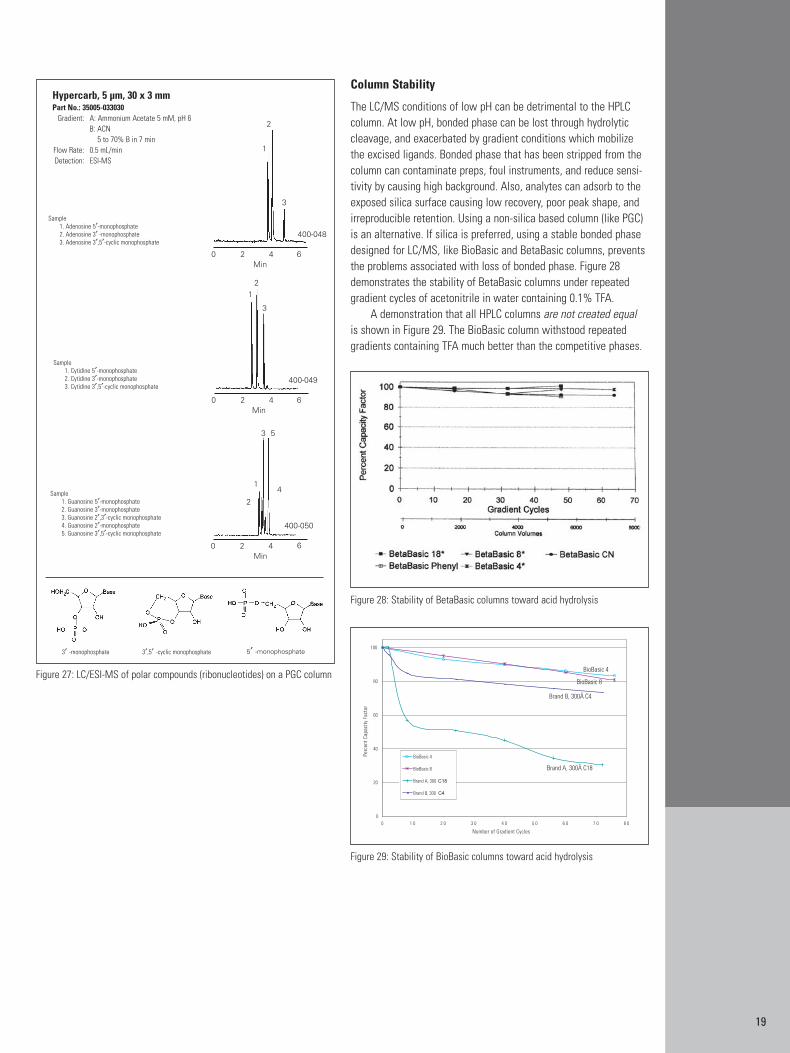
In addition to the different silica-based phases, porous graphiticcarbon (PGC) is a viable alternative phase. It has longer retention ofpolar compounds, can be run at high pH, and has different selectivitythan C18-silica. PGC is also ideal for LC/MS. The separation ofoligosaccharides shown in Figure 13 (page 11) was run on 1.0 mm IDPGC (Hypercarb) column in positive ion ESI mode at pH 9.6, too highfor most silica-based particles. Figure 14 (page 12) shows ESI ofPGC run under acidic conditions with very different selectivity thanthe C18-silica column. Polar compounds are problematic on RP-HPLC,and PGC provides valuable retention. The ESI-MS analysis of ribonu-cleotides, very polar biomolecules, is shown in Figure 27. Thesecompounds are usually analyzed using ion exchange or ion pairingon C18-silica columns. However, the PGC column provides retentionand resolution under MS-compatible conditions using a simpleammonium acetate mobile phase.
Figure 26: Low level (femtomole) detection of phosphorylase B digest by RP-LC/MS using nano-ESI
BioBasic 18, 5 µm, 100 x 0.075 mmPart No.: 72105-100065
Eluent: A: 0.1% Formic acid (Aq) B: 0.1% Formic acid (ACN)
Gradient: Time %B0 35 3
35 6040 8045 8050 365 3
Flow Rate: 2 µL/minMS Parameters:
Source: ESI+Sheath Gas: 12au
Source Temp: 130°CSpray Voltage: 2.0kV
Tube Lens Offset: 10VScan Range: 400-1000 amu
50% coverage
Column ID (mm) Flow Rate Range (µL/min) Optimum Flow Rate (µL/min) 1 Injection Volume (µL) 2 Sample Amount Ionization Source
2.1 100 – 400 200 5 >25pmole ESI1 50 – 100 50 1 >25pmole ESI
0.50 10 – 25 12 0.35 >25pmole ESI0.32 4 – 10 6 0.15 2 – 50pmole Micro-ESI0.18 1 – 3 2 0.05 0.1 – 5pmole Micro-ESI0.10 0.4 – 1 0.5 0.015 0.05 – 1pmole Nano-ESI0.075 0.2 – 0.5 0.3 0.01 <200fmole Nano-ESI
Table 5: Recommended microbore, capillary and nanobore column operation parameters
1. Optimum flow rate recommended for good efficiency and moderate pressure usingcolumns packed with 5um particles. Higher flow rates may lead to column voids.Lower flow rates are recommended for washing column bed or changing solvents.
2. Injection volume estimates based on negligible loss of efficiency and isocratic elutionwith sample solvent identical to mobile phase. Larger volumes can be introducedunder gradient conditions or using weaker sample solvent.
19
Column Stability
The LC/MS conditions of low pH can be detrimental to the HPLCcolumn. At low pH, bonded phase can be lost through hydrolyticcleavage, and exacerbated by gradient conditions which mobilizethe excised ligands. Bonded phase that has been stripped from thecolumn can contaminate preps, foul instruments, and reduce sensi-tivity by causing high background. Also, analytes can adsorb to theexposed silica surface causing low recovery, poor peak shape, andirreproducible retention. Using a non-silica based column (like PGC)is an alternative. If silica is preferred, using a stable bonded phasedesigned for LC/MS, like BioBasic and BetaBasic columns, preventsthe problems associated with loss of bonded phase. Figure 28demonstrates the stability of BetaBasic columns under repeatedgradient cycles of acetonitrile in water containing 0.1% TFA.
A demonstration that all HPLC columns are not created equal is shown in Figure 29. The BioBasic column withstood repeated gradients containing TFA much better than the competitive phases.
Figure 27: LC/ESI-MS of polar compounds (ribonucleotides) on a PGC column
0
1
2
3
2 4 6Min
400-048
5′ -monophosphate3′ -monophosphate 3′,5′ -cyclic monophosphate
0
12
3
2 4 6Min
400-049
0
1
2
3 5
4
2 4 6Min
400-050
Sample1. Adenosine 5′-monophosphate2. Adenosine 3′ -monophosphate3. Adenosine 3′,5′-cyclic monophosphate
Sample1. Cytidine 5′-monophosphate2. Cytidine 3′-monophosphate3. Cytidine 3′,5′-cyclic monophosphate
Sample1. Guanosine 5′-monophosphate2. Guanosine 3′-monophosphate3. Guanosine 2′,3′-cyclic monophosphate4. Guanosine 2′-monophosphate5. Guanosine 3′,5′-cyclic monophosphate
Hypercarb, 5 µm, 30 x 3 mmPart No.: 35005-033030
Gradient: A: Ammonium Acetate 5 mM, pH 6B: ACN
5 to 70% B in 7 minFlow Rate: 0.5 mL/minDetection: ESI-MS
Figure 28: Stability of BetaBasic columns toward acid hydrolysis
Figure 29: Stability of BioBasic columns toward acid hydrolysis
HPLC A
nalysis of Biom
olecules
20
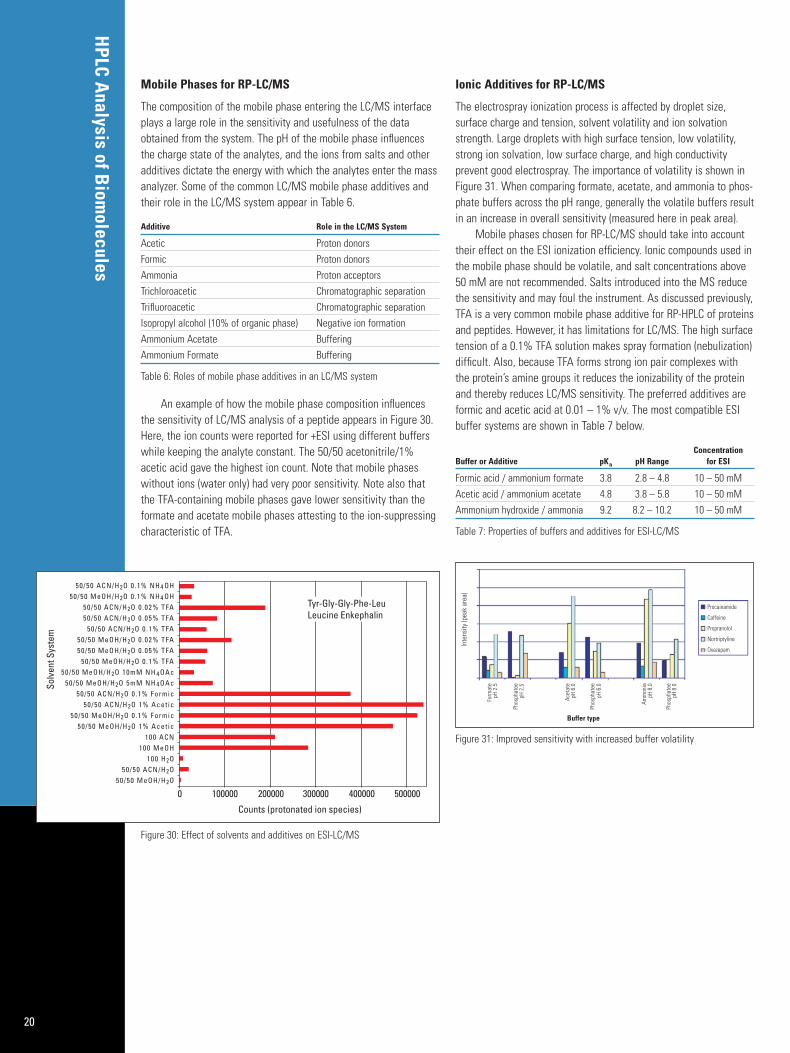
Mobile Phases for RP-LC/MS
The composition of the mobile phase entering the LC/MS interfaceplays a large role in the sensitivity and usefulness of the dataobtained from the system. The pH of the mobile phase influencesthe charge state of the analytes, and the ions from salts and otheradditives dictate the energy with which the analytes enter the massanalyzer. Some of the common LC/MS mobile phase additives andtheir role in the LC/MS system appear in Table 6.
Additive Role in the LC/MS System
Acetic Proton donorsFormic Proton donorsAmmonia Proton acceptorsTrichloroacetic Chromatographic separationTrifluoroacetic Chromatographic separationIsopropyl alcohol (10% of organic phase) Negative ion formationAmmonium Acetate BufferingAmmonium Formate Buffering
Table 6: Roles of mobile phase additives in an LC/MS system
An example of how the mobile phase composition influencesthe sensitivity of LC/MS analysis of a peptide appears in Figure 30.Here, the ion counts were reported for +ESI using different bufferswhile keeping the analyte constant. The 50/50 acetonitrile/1%acetic acid gave the highest ion count. Note that mobile phaseswithout ions (water only) had very poor sensitivity. Note also thatthe TFA-containing mobile phases gave lower sensitivity than theformate and acetate mobile phases attesting to the ion-suppressingcharacteristic of TFA.
Ionic Additives for RP-LC/MS
The electrospray ionization process is affected by droplet size, surface charge and tension, solvent volatility and ion solvationstrength. Large droplets with high surface tension, low volatility,strong ion solvation, low surface charge, and high conductivity prevent good electrospray. The importance of volatility is shown inFigure 31. When comparing formate, acetate, and ammonia to phos-phate buffers across the pH range, generally the volatile buffers resultin an increase in overall sensitivity (measured here in peak area).
Mobile phases chosen for RP-LC/MS should take into accounttheir effect on the ESI ionization efficiency. Ionic compounds used inthe mobile phase should be volatile, and salt concentrations above50 mM are not recommended. Salts introduced into the MS reducethe sensitivity and may foul the instrument. As discussed previously,TFA is a very common mobile phase additive for RP-HPLC of proteinsand peptides. However, it has limitations for LC/MS. The high surfacetension of a 0.1% TFA solution makes spray formation (nebulization)difficult. Also, because TFA forms strong ion pair complexes withthe protein’s amine groups it reduces the ionizability of the proteinand thereby reduces LC/MS sensitivity. The preferred additives areformic and acetic acid at 0.01 – 1% v/v. The most compatible ESIbuffer systems are shown in Table 7 below.
ConcentrationBuffer or Additive pKa pH Range for ESI
Formic acid / ammonium formate 3.8 2.8 – 4.8 10 – 50 mMAcetic acid / ammonium acetate 4.8 3.8 – 5.8 10 – 50 mMAmmonium hydroxide / ammonia 9.2 8.2 – 10.2 10 – 50 mM
Table 7: Properties of buffers and additives for ESI-LC/MS
Figure 30: Effect of solvents and additives on ESI-LC/MS
Figure 31: Improved sensitivity with increased buffer volatility
21
Organic/Aqueous Solvent Ratio for RP-LC/MS
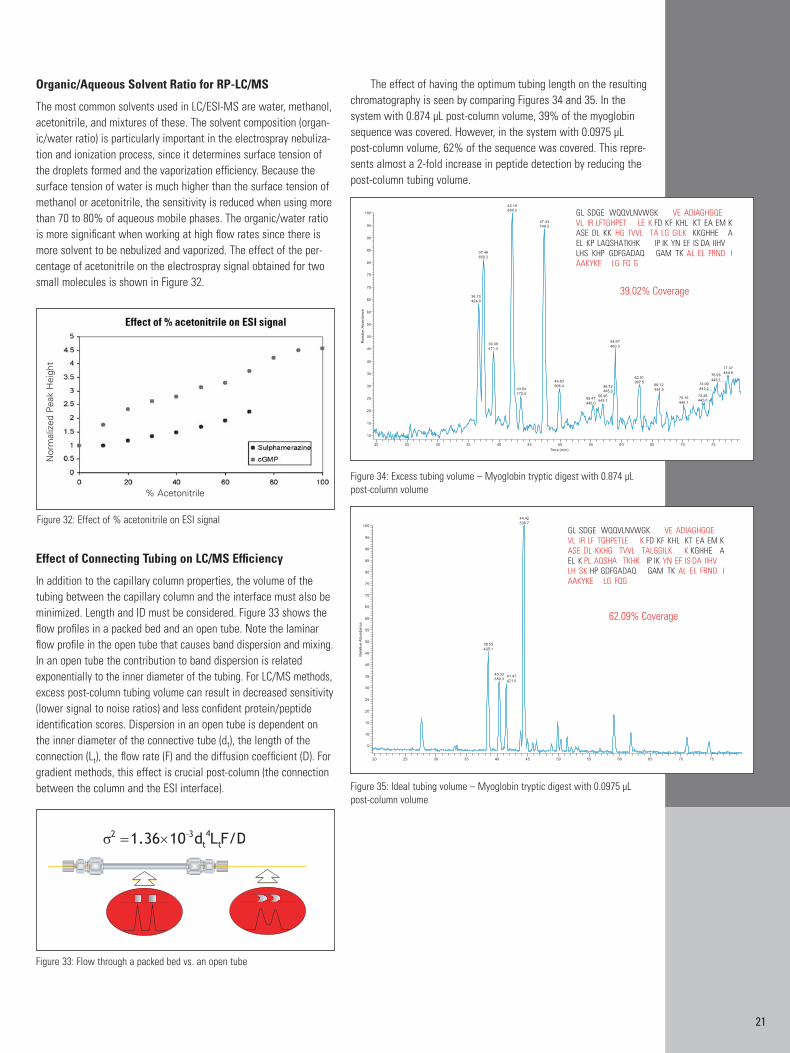
The most common solvents used in LC/ESI-MS are water, methanol,acetonitrile, and mixtures of these. The solvent composition (organ-ic/water ratio) is particularly important in the electrospray nebuliza-tion and ionization process, since it determines surface tension ofthe droplets formed and the vaporization efficiency. Because thesurface tension of water is much higher than the surface tension ofmethanol or acetonitrile, the sensitivity is reduced when using morethan 70 to 80% of aqueous mobile phases. The organic/water ratiois more significant when working at high flow rates since there ismore solvent to be nebulized and vaporized. The effect of the per-centage of acetonitrile on the electrospray signal obtained for twosmall molecules is shown in Figure 32.
Effect of Connecting Tubing on LC/MS Efficiency
In addition to the capillary column properties, the volume of the tubing between the capillary column and the interface must also beminimized. Length and ID must be considered. Figure 33 shows theflow profiles in a packed bed and an open tube. Note the laminarflow profile in the open tube that causes band dispersion and mixing.In an open tube the contribution to band dispersion is related exponentially to the inner diameter of the tubing. For LC/MS methods,excess post-column tubing volume can result in decreased sensitivity(lower signal to noise ratios) and less confident protein/peptideidentification scores. Dispersion in an open tube is dependent onthe inner diameter of the connective tube (dt), the length of the connection (Lt), the flow rate (F) and the diffusion coefficient (D). Forgradient methods, this effect is crucial post-column (the connectionbetween the column and the ESI interface).
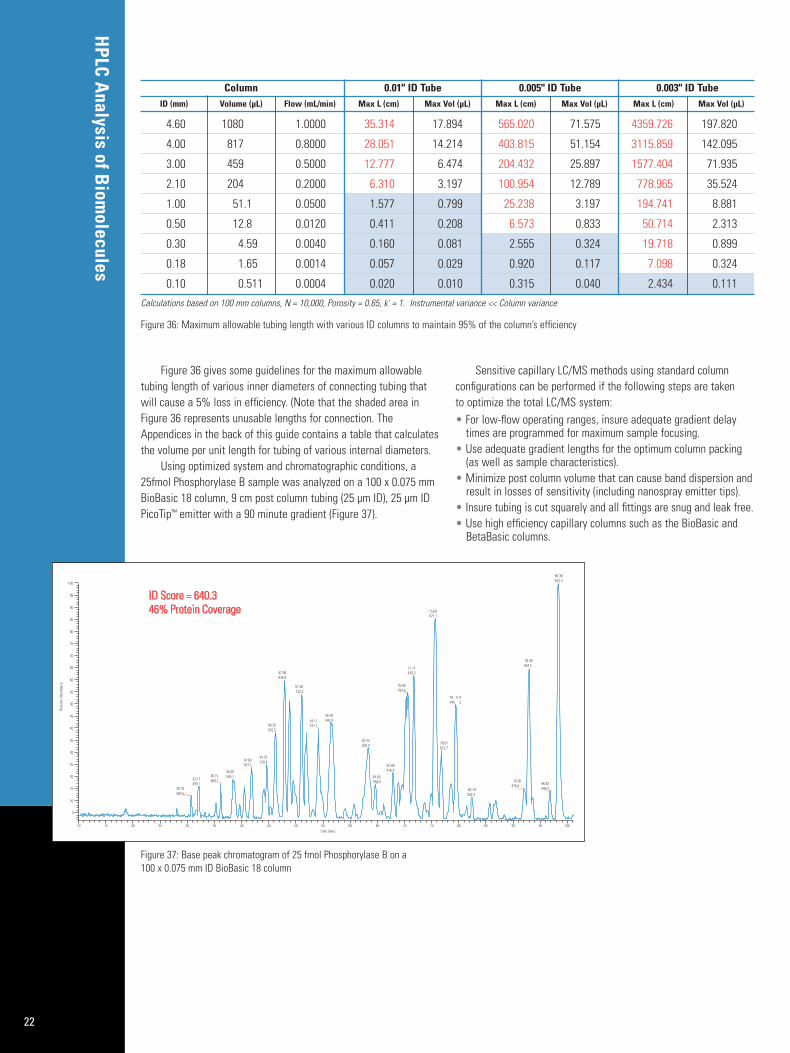
The effect of having the optimum tubing length on the resultingchromatography is seen by comparing Figures 34 and 35. In the system with 0.874 µL post-column volume, 39% of the myoglobinsequence was covered. However, in the system with 0.0975 µL post-column volume, 62% of the sequence was covered. This repre-sents almost a 2-fold increase in peptide detection by reducing thepost-column tubing volume.
Figure 32: Effect of % acetonitrile on ESI signal
Nor
mal
ized
Pea
k H
eigh
t
% Acetonitrile
Figure 33: Flow through a packed bed vs. an open tube
Figure 34: Excess tubing volume – Myoglobin tryptic digest with 0.874 µLpost-column volume
Figure 35: Ideal tubing volume – Myoglobin tryptic digest with 0.0975 µLpost-column volume
HPLC A
nalysis of Biom
olecules
22
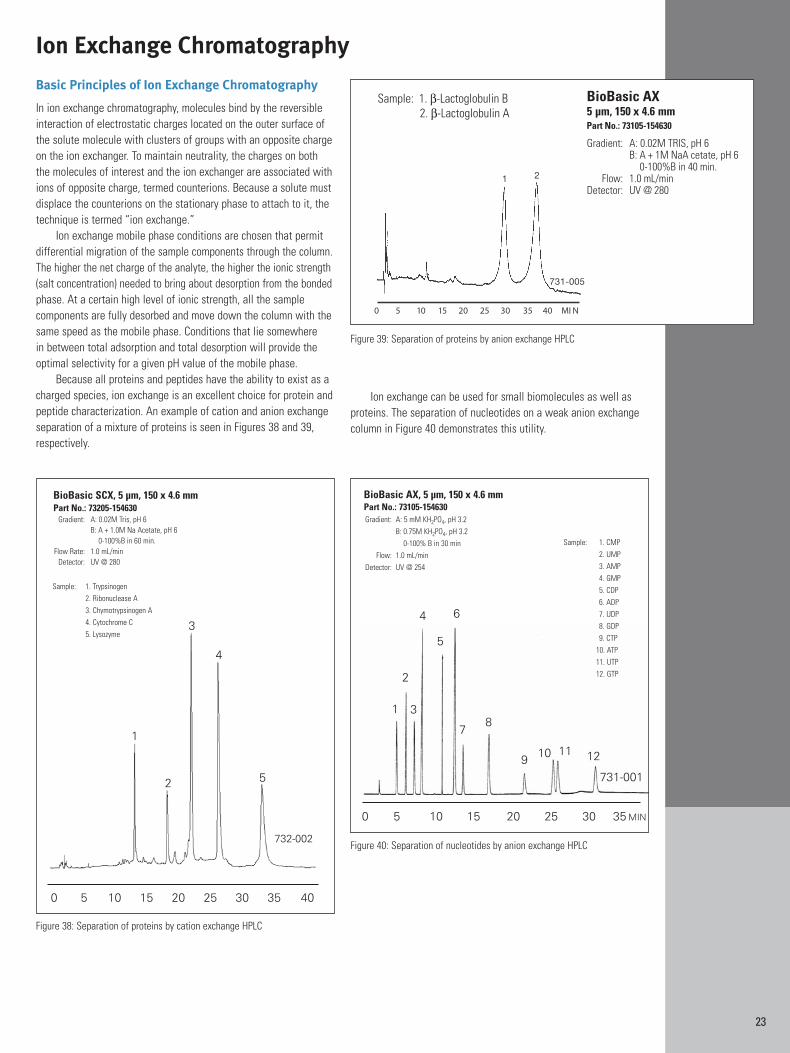
Figure 36 gives some guidelines for the maximum allowabletubing length of various inner diameters of connecting tubing thatwill cause a 5% loss in efficiency. (Note that the shaded area inFigure 36 represents unusable lengths for connection. TheAppendices in the back of this guide contains a table that calculatesthe volume per unit length for tubing of various internal diameters.
Using optimized system and chromatographic conditions, a25fmol Phosphorylase B sample was analyzed on a 100 x 0.075 mmBioBasic 18 column, 9 cm post column tubing (25 µm ID), 25 µm IDPicoTip™ emitter with a 90 minute gradient (Figure 37).
Sensitive capillary LC/MS methods using standard column configurations can be performed if the following steps are taken to optimize the total LC/MS system:• For low-flow operating ranges, insure adequate gradient delay
times are programmed for maximum sample focusing.• Use adequate gradient lengths for the optimum column packing
(as well as sample characteristics).• Minimize post column volume that can cause band dispersion and
result in losses of sensitivity (including nanospray emitter tips).• Insure tubing is cut squarely and all fittings are snug and leak free.• Use high efficiency capillary columns such as the BioBasic and
BetaBasic columns.
Figure 36: Maximum allowable tubing length with various ID columns to maintain 95% of the column’s efficiency
Figure 37: Base peak chromatogram of 25 fmol Phosphorylase B on a 100 x 0.075 mm ID BioBasic 18 column
Column 0.01" ID Tube 0.005" ID Tube 0.003" ID TubeID (mm) Volume (µL) Flow (mL/min) Max L (cm) Max Vol (µL) Max L (cm) Max Vol (µL) Max L (cm) Max Vol (µL)
4.60 1080 1.0000 35.314 17.894 565.020 71.575 4359.726 197.820
4.00 817 0.8000 28.051 14.214 403.815 51.154 3115.859 142.095
3.00 459 0.5000 12.777 6.474 204.432 25.897 1577.404 71.935
2.10 204 0.2000 6.310 3.197 100.954 12.789 778.965 35.524
1.00 51.1 0.0500 1.577 0.799 25.238 3.197 194.741 8.881
0.50 12.8 0.0120 0.411 0.208 6.573 0.833 50.714 2.313
0.30 4.59 0.0040 0.160 0.081 2.555 0.324 19.718 0.899
0.18 1.65 0.0014 0.057 0.029 0.920 0.117 7.098 0.324
0.10 0.511 0.0004 0.020 0.010 0.315 0.040 2.434 0.111
Calculations based on 100 mm columns, N = 10,000, Porosity = 0.65, k' = 1. Instrumental variance << Column variance
23
Basic Principles of Ion Exchange Chromatography
In ion exchange chromatography, molecules bind by the reversibleinteraction of electrostatic charges located on the outer surface ofthe solute molecule with clusters of groups with an opposite chargeon the ion exchanger. To maintain neutrality, the charges on boththe molecules of interest and the ion exchanger are associated withions of opposite charge, termed counterions. Because a solute mustdisplace the counterions on the stationary phase to attach to it, thetechnique is termed “ion exchange.”
Ion exchange mobile phase conditions are chosen that permitdifferential migration of the sample components through the column.The higher the net charge of the analyte, the higher the ionic strength(salt concentration) needed to bring about desorption from the bondedphase. At a certain high level of ionic strength, all the sample components are fully desorbed and move down the column with thesame speed as the mobile phase. Conditions that lie somewhere in between total adsorption and total desorption will provide theoptimal selectivity for a given pH value of the mobile phase.
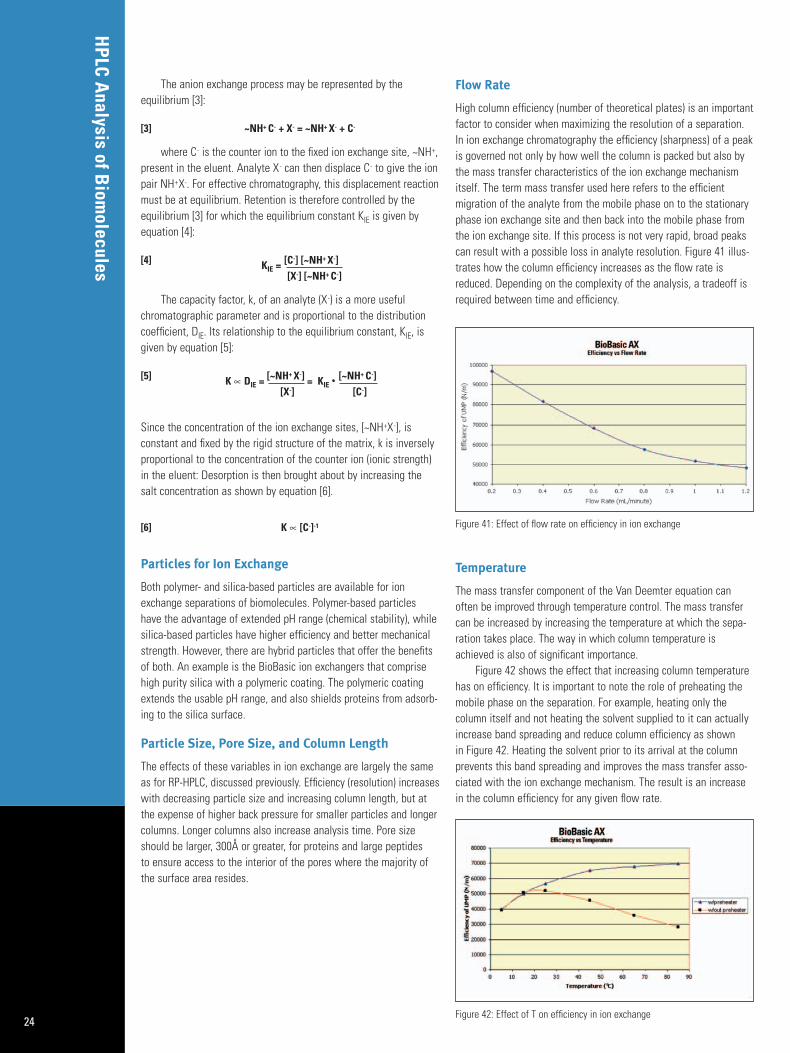
Because all proteins and peptides have the ability to exist as acharged species, ion exchange is an excellent choice for protein andpeptide characterization. An example of cation and anion exchangeseparation of a mixture of proteins is seen in Figures 38 and 39,respectively.
Ion exchange can be used for small biomolecules as well asproteins. The separation of nucleotides on a weak anion exchangecolumn in Figure 40 demonstrates this utility.
Figure 40: Separation of nucleotides by anion exchange HPLC
0 5 10 15 20 25 30 35 MIN
731-001
Sample: 1. CMP2. UMP3. AMP4. GMP5. CDP6. ADP7. UDP8. GDP9. CTP
10. ATP11. UTP12. GTP
BioBasic AX, 5 µm, 150 x 4.6 mmPart No.: 73105-154630Gradient: A: 5 mM KH2PO4, pH 3.2
B: 0.75M KH2PO4, pH 3.20-100% B in 30 min
Flow: 1.0 mL/minDetector: UV @ 254
1
2
3
4
5
6
78
1211109
Figure 38: Separation of proteins by cation exchange HPLC
Figure 39: Separation of proteins by anion exchange HPLC
0 5 10 15 20 25 30 35 40
732-002
BioBasic SCX, 5 µm, 150 x 4.6 mmPart No.: 73205-154630
Gradient: A: 0.02M Tris, pH 6B: A + 1.0M Na Acetate, pH 6
0-100%B in 60 min.Flow Rate: 1.0 mL/min
Detector: UV @ 280
Sample: 1. Trypsinogen2. Ribonuclease A3. Chymotrypsinogen A4. Cytochrome C5. Lysozyme
1
2
3
4
5
Ion Exchange Chromatography
HPLC A
nalysis of Biom
olecules
24
The anion exchange process may be represented by the equilibrium [3]:
[3] ~NH+ C- + X- = ~NH+ X- + C-
where C- is the counter ion to the fixed ion exchange site, ~NH+,present in the eluent. Analyte X- can then displace C- to give the ionpair NH+X-. For effective chromatography, this displacement reactionmust be at equilibrium. Retention is therefore controlled by theequilibrium [3] for which the equilibrium constant KIE is given byequation [4]:
[4] KIE = [C-] [~NH+ X-][X-] [~NH+ C-]
The capacity factor, k, of an analyte (X-) is a more useful chromatographic parameter and is proportional to the distributioncoefficient, DIE. Its relationship to the equilibrium constant, KIE, isgiven by equation [5]:
[5] K ∝ DIE = [~NH+ X-] = KIE • [~NH+ C-] [X-] [C-]
Since the concentration of the ion exchange sites, [~NH+X-], is constant and fixed by the rigid structure of the matrix, k is inverselyproportional to the concentration of the counter ion (ionic strength)in the eluent: Desorption is then brought about by increasing thesalt concentration as shown by equation [6].
[6] K ∝ [C-]-1
Particles for Ion Exchange
Both polymer- and silica-based particles are available for ionexchange separations of biomolecules. Polymer-based particleshave the advantage of extended pH range (chemical stability), whilesilica-based particles have higher efficiency and better mechanicalstrength. However, there are hybrid particles that offer the benefitsof both. An example is the BioBasic ion exchangers that comprisehigh purity silica with a polymeric coating. The polymeric coatingextends the usable pH range, and also shields proteins from adsorb-ing to the silica surface.
Particle Size, Pore Size, and Column Length
The effects of these variables in ion exchange are largely the sameas for RP-HPLC, discussed previously. Efficiency (resolution) increaseswith decreasing particle size and increasing column length, but atthe expense of higher back pressure for smaller particles and longercolumns. Longer columns also increase analysis time. Pore sizeshould be larger, 300Å or greater, for proteins and large peptides to ensure access to the interior of the pores where the majority ofthe surface area resides.
Flow Rate
High column efficiency (number of theoretical plates) is an importantfactor to consider when maximizing the resolution of a separation.In ion exchange chromatography the efficiency (sharpness) of a peakis governed not only by how well the column is packed but also bythe mass transfer characteristics of the ion exchange mechanismitself. The term mass transfer used here refers to the efficientmigration of the analyte from the mobile phase on to the stationaryphase ion exchange site and then back into the mobile phase fromthe ion exchange site. If this process is not very rapid, broad peakscan result with a possible loss in analyte resolution. Figure 41 illus-trates how the column efficiency increases as the flow rate isreduced. Depending on the complexity of the analysis, a tradeoff isrequired between time and efficiency.
Temperature
The mass transfer component of the Van Deemter equation canoften be improved through temperature control. The mass transfercan be increased by increasing the temperature at which the sepa-ration takes place. The way in which column temperature isachieved is also of significant importance.
Figure 42 shows the effect that increasing column temperaturehas on efficiency. It is important to note the role of preheating themobile phase on the separation. For example, heating only the column itself and not heating the solvent supplied to it can actuallyincrease band spreading and reduce column efficiency as shown in Figure 42. Heating the solvent prior to its arrival at the columnprevents this band spreading and improves the mass transfer asso-ciated with the ion exchange mechanism. The result is an increasein the column efficiency for any given flow rate.
Figure 41: Effect of flow rate on efficiency in ion exchange
Figure 42: Effect of T on efficiency in ion exchange
25
Ion Exchange Bonded Phases
Most ion exchange packings fall into two groups, cation exchangersand anion exchangers. Cation exchangers contain acidic groups, suchas sulfonic acid or carboxylic acid, and are used to separate cationic(positively-charged) compounds. Strong cation exchangers commonlycomprise sulfonate groups (-SO3
-). These are strong acids and theirion exchange character is relatively unaffected by mobile phase pH.Carboxylate (-COO-) ions are common weak cation exchangers. WithpKa values in the 4 – 6 range, they are ionized and effective as acation exchange media above pH 6. Anion exchangers contain basicgroups, such as secondary, tertiary, or quaternary amines, and areused to separate anionic (negatively-charged) compounds. Quaternaryamines (-NH4
+) are strong bases and their exchange character is relatively unaffected by mobile phase pH. Secondary and tertiaryamines are weak bases with pKa values between 8 and 11. A weakly basic anion exchanger should be used below pH 8.
It is important to buffer the mobile phase in this mode of chromatography to control the ionization of both the analyte and thepacking, since the ionic state of both affects the acid-base equilibriabetween analyte and ion exchange packing. A strong anion exchangemedia will be ionized over most of the pH range 2 – 8. A weak anionexchange media can be turned “on” and “off” within that range throughchanges in the pH of the mobile phase. It is important to emphasizethat while the ion exchange capacity of a weak ion exchange mediawill be maximized at low pH, it will still have some ionic characterand function as an ion exchanger even at pH 8, giving it good versatility and making pH a powerful tool for modifying selectivity.
Measuring Ion Exchange Capacity
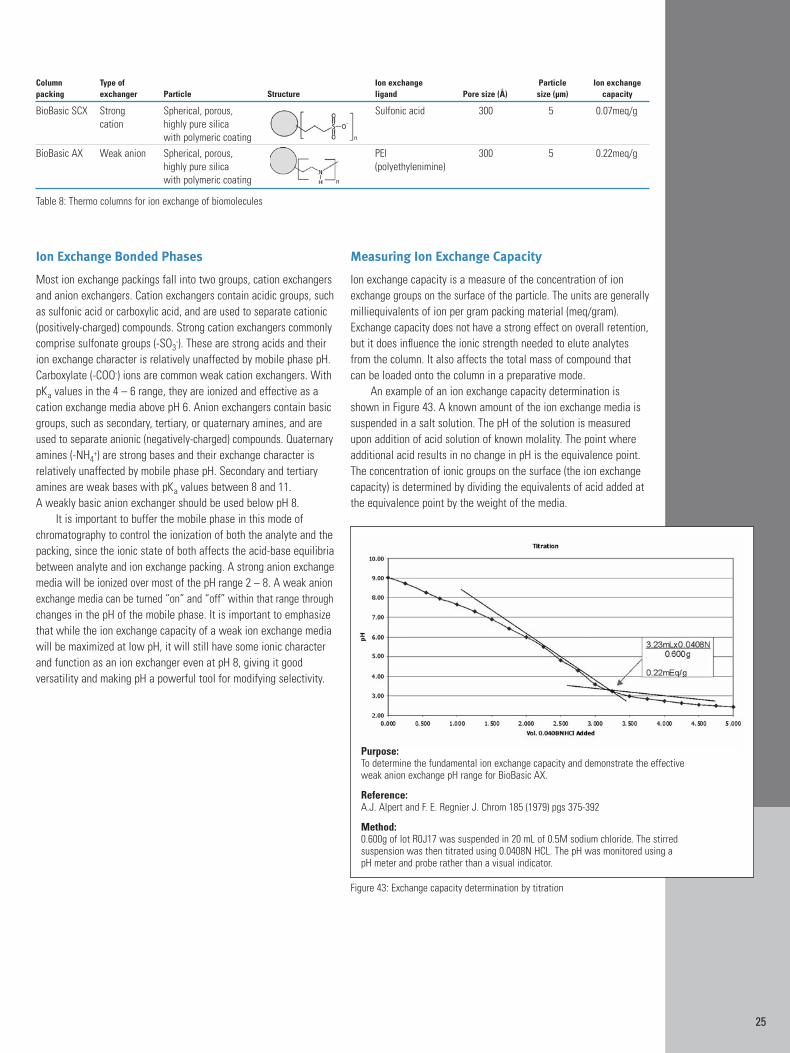
Ion exchange capacity is a measure of the concentration of ionexchange groups on the surface of the particle. The units are generallymilliequivalents of ion per gram packing material (meq/gram).Exchange capacity does not have a strong effect on overall retention,but it does influence the ionic strength needed to elute analytesfrom the column. It also affects the total mass of compound thatcan be loaded onto the column in a preparative mode.
An example of an ion exchange capacity determination isshown in Figure 43. A known amount of the ion exchange media issuspended in a salt solution. The pH of the solution is measuredupon addition of acid solution of known molality. The point whereadditional acid results in no change in pH is the equivalence point.The concentration of ionic groups on the surface (the ion exchangecapacity) is determined by dividing the equivalents of acid added atthe equivalence point by the weight of the media.
Column Type of Ion exchange Particle Ion exchange packing exchanger Particle Structure ligand Pore size (Å) size (µm) capacity
BioBasic SCX Strong Spherical, porous, Sulfonic acid 300 5 0.07meq/gcation highly pure silica
with polymeric coatingBioBasic AX Weak anion Spherical, porous, PEI 300 5 0.22meq/g
highly pure silica (polyethylenimine)with polymeric coating
Table 8: Thermo columns for ion exchange of biomolecules
Figure 43: Exchange capacity determination by titration
Purpose: To determine the fundamental ion exchange capacity and demonstrate the effective weak anion exchange pH range for BioBasic AX.
Reference:A.J. Alpert and F. E. Regnier J. Chrom 185 (1979) pgs 375-392
Method:0.600g of lot R0J17 was suspended in 20 mL of 0.5M sodium chloride. The stirred suspension was then titrated using 0.0408N HCL. The pH was monitored using a pH meter and probe rather than a visual indicator.
HPLC A
nalysis of Biom
olecules
26
Mobile Phases for Ion Exchange HPLC
Mobile Phase pH
The pH of the mobile phase can have considerable effect on retention and selectivity. This is because:• A shift in pH that causes the analyte to change from its ionized
state to its neutral state prevents the analyte from taking part inthe ion exchange process and consequently retention is reduced.
• A shift in pH that causes the ion exchange site to change from itsionized state to a neutral state essentially eliminates sites avail-able for ion exchange and retention is lost.
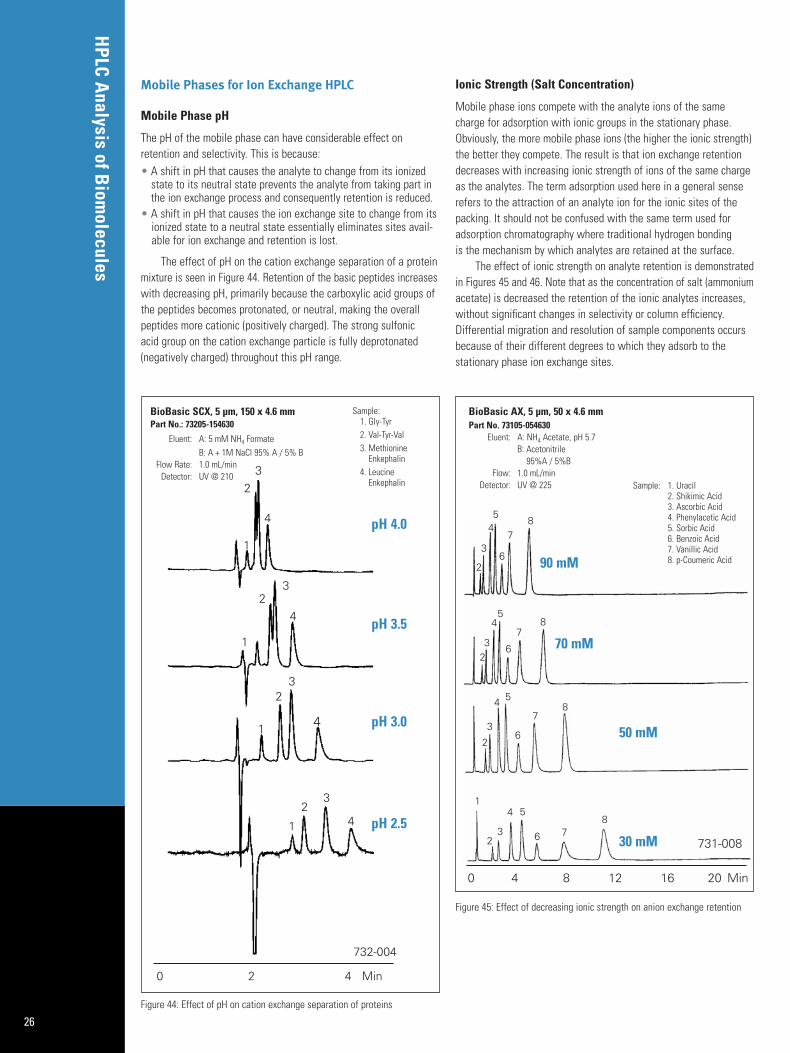
The effect of pH on the cation exchange separation of a proteinmixture is seen in Figure 44. Retention of the basic peptides increaseswith decreasing pH, primarily because the carboxylic acid groups ofthe peptides becomes protonated, or neutral, making the overallpeptides more cationic (positively charged). The strong sulfonic acid group on the cation exchange particle is fully deprotonated(negatively charged) throughout this pH range.
Ionic Strength (Salt Concentration)
Mobile phase ions compete with the analyte ions of the samecharge for adsorption with ionic groups in the stationary phase.Obviously, the more mobile phase ions (the higher the ionic strength)the better they compete. The result is that ion exchange retentiondecreases with in creasing ionic strength of ions of the same chargeas the analytes. The term adsorption used here in a general senserefers to the attraction of an analyte ion for the ionic sites of thepacking. It should not be confused with the same term used foradsorption chromatography where traditional hydrogen bonding is the mechanism by which analytes are retained at the surface.
The effect of ionic strength on analyte retention is demonstratedin Figures 45 and 46. Note that as the concentration of salt (ammoniumacetate) is decreased the retention of the ionic analytes increases,with out significant changes in selectivity or column efficiency.Differential migration and resolution of sample components occursbecause of their different degrees to which they adsorb to the stationary phase ion exchange sites.
Figure 45: Effect of decreasing ionic strength on anion exchange retention
0 2 4 Min
732-004
BioBasic SCX, 5 µm, 150 x 4.6 mmPart No.: 73205-154630
Eluent: A: 5 mM NH4 FormateB: A + 1M NaCl 95% A / 5% B
Flow Rate: 1.0 mL/minDetector: UV @ 210
Sample:1. Gly-Tyr2. Val-Tyr-Val3. Methionine
Enkephalin4. Leucine
Enkephalin
1
23
4
1
23
4
1
23
4
1
23
4 pH 2.5
pH 3.0
pH 3.5
pH 4.0
Figure 44: Effect of pH on cation exchange separation of proteins
0 4 8 12 16 20 Min
731-008
Sample: 1. Uracil2. Shikimic Acid3. Ascorbic Acid4. Phenylacetic Acid5. Sorbic Acid6. Benzoic Acid7. Vanillic Acid8. p-Coumeric Acid
2
3
45
6
78
90 mM
70 mM
50 mM
30 mM
23
45
6
78
2
3
4 5
6
78
1
23
4 5
6 78
BioBasic AX, 5 µm, 50 x 4.6 mmPart No. 73105-054630
Eluent: A: NH4 Acetate, pH 5.7B: Acetonitrile
95%A / 5%BFlow: 1.0 mL/min
Detector: UV @ 225
27
The competition between analyte and salt for the ion exchangesite is largely controlled by the concentration and nature of the saltion. Choice of the appropriate counterion is therefore of significantimportance in adjusting retention. One usually employs NH4
+, H+,Na+, K+, or Ca2+ for cation and acetate-, Cl-, NO3
-, SO42-, or PO4
3- foranion exchangers. The eluting strength of the counterion correlatesdirectly with its charge. For example, by substituting the eluent ionof a cation exchanger in the series H+, Na+, K+, Ca2+ the relativestrength between counterion and fixed ion increases and retentionof a given cation (analyte) decreases.
Controlling Retention with Salt and pH Gradients
When a single ionic strength is insufficient to elute all analytes(both strongly and weakly retained) from the column in a reasonabletime, salt or pH gradients can be applied. Salt gradients employ agradual increase in ionic strength in the mobile phase. This gradientgradually desorbs the sample components in the order of increasingnet charge, so that components are desorbed off one at a time fromthe surface to provide separation of the mixture. Thus the salt gradi-ent compresses a chromatogram so as to elute components withwidely different adsorptive properties within a reasonable time. Thegradient profile can be linear or stepwise.
pH gradients affect retention in the same manner, by takingadvantage of the different pKa values of analytes and stationaryphase ions. In a typical pH gradient, the mobile phase pH ischanged from low pH to high pH (for anion exchange) or high to low(for cation exchange), bracketing the pKa range of the analytes.
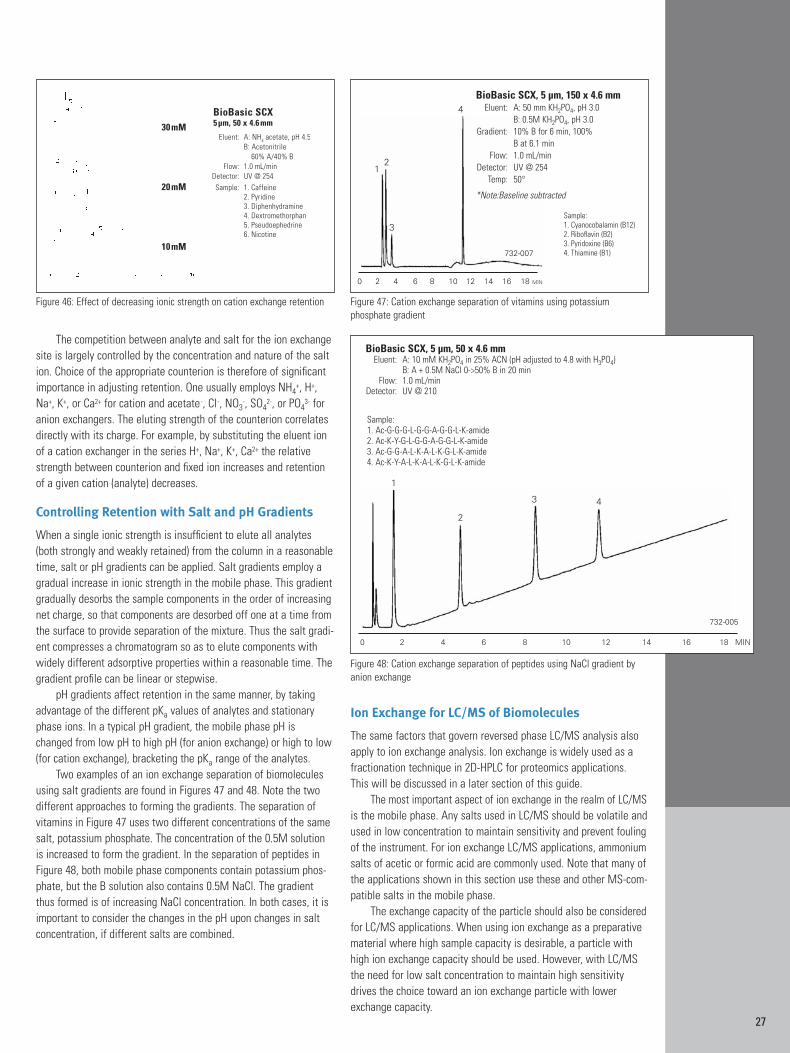
Two examples of an ion exchange separation of biomoleculesusing salt gradients are found in Figures 47 and 48. Note the twodifferent approaches to forming the gradients. The separation ofvitamins in Figure 47 uses two different concentrations of the samesalt, potassium phosphate. The concentration of the 0.5M solutionis increased to form the gradient. In the separation of peptides inFigure 48, both mobile phase components contain potassium phos-phate, but the B solution also contains 0.5M NaCl. The gradientthus formed is of increasing NaCl concentration. In both cases, it isimportant to consider the changes in the pH upon changes in saltconcentration, if different salts are combined.
Ion Exchange for LC/MS of Biomolecules
The same factors that govern reversed phase LC/MS analysis alsoapply to ion exchange analysis. Ion exchange is widely used as afractionation technique in 2D-HPLC for proteomics applications. This will be discussed in a later section of this guide.
The most important aspect of ion exchange in the realm of LC/MSis the mobile phase. Any salts used in LC/MS should be volatile andused in low concentration to maintain sensitivity and prevent foulingof the instrument. For ion exchange LC/MS applications, ammoniumsalts of acetic or formic acid are commonly used. Note that many ofthe applications shown in this section use these and other MS-com-patible salts in the mobile phase.
The exchange capacity of the particle should also be consideredfor LC/MS applications. When using ion exchange as a preparativematerial where high sample capacity is desirable, a particle withhigh ion exchange capacity should be used. However, with LC/MSthe need for low salt concentration to maintain high sensitivitydrives the choice toward an ion exchange particle with lower exchange capacity.
Figure 46: Effect of decreasing ionic strength on cation exchange retention Figure 47: Cation exchange separation of vitamins using potassium phosphate gradient
Figure 48: Cation exchange separation of peptides using NaCl gradient byanion exchange
0 2 4 6 8 10 12 14 16 18 MIN
732-007
Sample:1. Cyanocobalamin (B12)2. Riboflavin (B2)3. Pyridoxine (B6)4. Thiamine (B1)
BioBasic SCX, 5 µm, 150 x 4.6 mmEluent: A: 50 mm KH2PO4, pH 3.0
B: 0.5M KH2PO4, pH 3.0Gradient: 10% B for 6 min, 100%
B at 6.1 minFlow: 1.0 mL/min
Detector: UV @ 254Temp: 50°
*Note:Baseline subtracted
12
3
4
0 2 4 6 8 10 12 14 16 18 MIN
732-005
Sample:1. Ac-G-G-G-L-G-G-A-G-G-L-K-amide2. Ac-K-Y-G-L-G-G-A-G-G-L-K-amide3. Ac-G-G-A-L-K-A-L-K-G-L-K-amide4. Ac-K-Y-A-L-K-A-L-K-G-L-K-amide
BioBasic SCX, 5 µm, 50 x 4.6 mmEluent: A: 10 mM KH2PO4 in 25% ACN (pH adjusted to 4.8 with H3PO4)
B: A + 0.5M NaCl 0->50% B in 20 minFlow: 1.0 mL/min
Detector: UV @ 210
1
2
3 4
HPLC A
nalysis of Biom
olecules
28
Basic Principles of Size Exclusion Chromatography
Size exclusion chromatography (SEC) is a noninteractive techniquethat separates solutes according to their molecular size in solution.It is often used as the first step in isolation of a protein from a crudesample. When used with calibration standards it is possible todetermine the molecular mass of compounds with similar molecularshape to the standards, such as proteins and oligosaccharides.
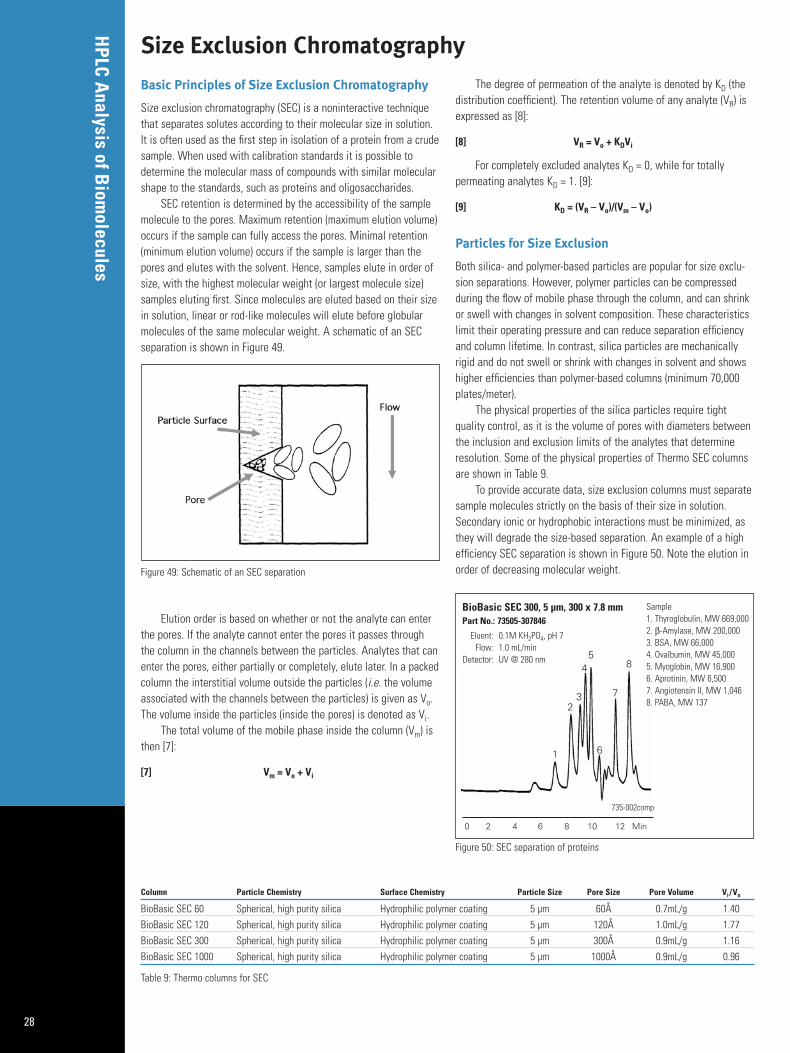
SEC retention is determined by the accessibility of the samplemolecule to the pores. Maximum retention (maximum elution volume)occurs if the sample can fully access the pores. Minimal retention(minimum elution volume) occurs if the sample is larger than thepores and elutes with the solvent. Hence, samples elute in order ofsize, with the highest molecular weight (or largest molecule size)samples eluting first. Since molecules are eluted based on their sizein solution, linear or rod-like molecules will elute before globularmolecules of the same molecular weight. A schematic of an SECseparation is shown in Figure 49.
Elution order is based on whether or not the analyte can enterthe pores. If the analyte cannot enter the pores it passes throughthe column in the channels between the particles. Analytes that canenter the pores, either partially or completely, elute later. In a packedcolumn the interstitial volume outside the particles (i.e. the volumeassociated with the channels between the particles) is given as Vo.The volume inside the particles (inside the pores) is denoted as Vi.
The total volume of the mobile phase inside the column (Vm) isthen [7]:
[7] Vm = Vo + Vi
The degree of permeation of the analyte is denoted by KD (thedistribution coefficient). The retention volume of any analyte (VR) isexpressed as [8]:
[8] VR = Vo + KDVi
For completely excluded analytes KD = 0, while for totally permeating analytes KD = 1. [9]:
[9] KD = (VR – Vo)/(Vm – Vo)
Particles for Size Exclusion
Both silica- and polymer-based particles are popular for size exclu-sion separations. However, polymer particles can be compressedduring the flow of mobile phase through the column, and can shrinkor swell with changes in solvent composition. These characteristicslimit their operating pressure and can reduce separation efficiencyand column lifetime. In contrast, silica particles are mechanicallyrigid and do not swell or shrink with changes in solvent and showshigher efficiencies than polymer-based columns (minimum 70,000plates/meter).
The physical properties of the silica particles require tight quality control, as it is the volume of pores with diameters betweenthe inclusion and exclusion limits of the analytes that determineresolution. Some of the physical properties of Thermo SEC columnsare shown in Table 9.
To provide accurate data, size exclusion columns must separatesample molecules strictly on the basis of their size in solution.Secondary ionic or hydrophobic interactions must be minimized, asthey will degrade the size-based separation. An example of a highefficiency SEC separation is shown in Figure 50. Note the elution inorder of decreasing molecular weight.
0 2 4 6 8 10 12 Min
735-002comp
Sample1. Thyroglobulin, MW 669,0002. β-Amylase, MW 200,0003. BSA, MW 66,0004. Ovalbumin, MW 45,0005. Myoglobin, MW 16,9006. Aprotinin, MW 6,5007. Angiotensin II, MW 1,0468. PABA, MW 137
1
23
45
6
7
8
BioBasic SEC 300, 5 µm, 300 x 7.8 mmPart No.: 73505-307846
Eluent: 0.1M KH2PO4, pH 7Flow: 1.0 mL/min
Detector: UV @ 280 nm
Figure 50: SEC separation of proteins
Column Particle Chemistry Surface Chemistry Particle Size Pore Size Pore Volume Vi /Vo
BioBasic SEC 60 Spherical, high purity silica Hydrophilic polymer coating 5 µm 60Å 0.7mL/g 1.40BioBasic SEC 120 Spherical, high purity silica Hydrophilic polymer coating 5 µm 120Å 1.0mL/g 1.77BioBasic SEC 300 Spherical, high purity silica Hydrophilic polymer coating 5 µm 300Å 0.9mL/g 1.16BioBasic SEC 1000 Spherical, high purity silica Hydrophilic polymer coating 5 µm 1000Å 0.9mL/g 0.96
Table 9: Thermo columns for SEC
Figure 49: Schematic of an SEC separation
Size Exclusion Chromatography
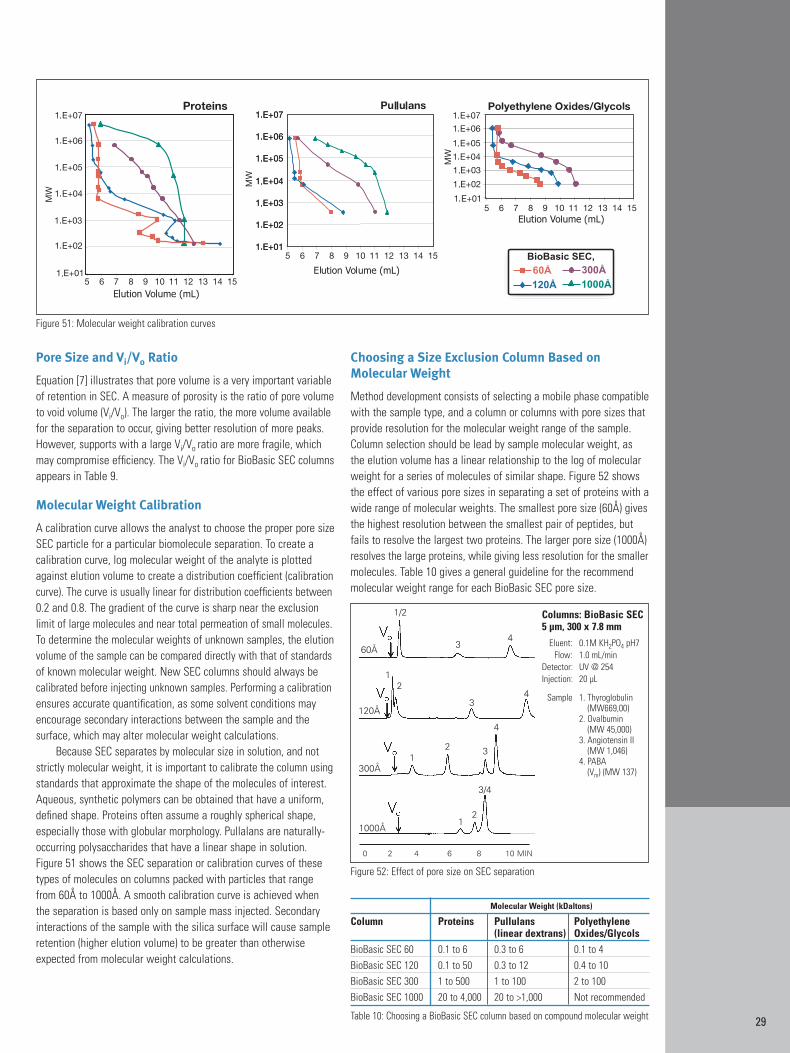
29
Pore Size and Vi/Vo Ratio
Equation [7] illustrates that pore volume is a very important variableof retention in SEC. A measure of porosity is the ratio of pore volumeto void volume (Vi/Vo). The larger the ratio, the more volume availablefor the separation to occur, giving better resolution of more peaks.However, supports with a large Vi/Vo ratio are more fragile, whichmay compromise efficiency. The Vi/Vo ratio for BioBasic SEC columnsappears in Table 9.
Molecular Weight Calibration
A calibration curve allows the analyst to choose the proper pore sizeSEC particle for a particular biomolecule separation. To create a calibration curve, log molecular weight of the analyte is plottedagainst elution volume to create a distribution coefficient (calibrationcurve). The curve is usually linear for distribution coefficients between0.2 and 0.8. The gradient of the curve is sharp near the exclusionlimit of large molecules and near total permeation of small molecules.To determine the molecular weights of unknown samples, the elutionvolume of the sample can be compared directly with that of standardsof known molecular weight. New SEC columns should always becalibrated before injecting unknown samples. Performing a calibrationensures accurate quantification, as some solvent conditions mayencourage secondary interactions between the sample and the surface, which may alter molecular weight calculations.
Because SEC separates by molecular size in solution, and notstrictly molecular weight, it is important to calibrate the column usingstandards that approximate the shape of the molecules of interest.Aqueous, synthetic polymers can be obtained that have a uniform,defined shape. Proteins often assume a roughly spherical shape,especially those with globular morphology. Pullalans are naturally-occurring polysaccharides that have a linear shape in solution.Figure 51 shows the SEC separation or calibration curves of thesetypes of molecules on columns packed with particles that rangefrom 60Å to 1000Å. A smooth calibration curve is achieved whenthe separation is based only on sample mass injected. Secondaryinteractions of the sample with the silica surface will cause sampleretention (higher elution volume) to be greater than otherwiseexpected from molecular weight calculations.
Choosing a Size Exclusion Column Based onMolecular Weight
Method development consists of selecting a mobile phase compatiblewith the sample type, and a column or columns with pore sizes thatprovide resolution for the molecular weight range of the sample.Column selection should be lead by sample molecular weight, asthe elution volume has a linear relationship to the log of molecularweight for a series of molecules of similar shape. Figure 52 showsthe effect of various pore sizes in separating a set of proteins with awide range of molecular weights. The smallest pore size (60Å) givesthe highest resolution between the smallest pair of peptides, butfails to resolve the largest two proteins. The larger pore size (1000Å)resolves the large proteins, while giving less resolution for the smallermolecules. Table 10 gives a general guideline for the recommendmolecular weight range for each BioBasic SEC pore size.
Molecular Weight (kDaltons)
Column Proteins Pullulans Polyethylene(linear dextrans) Oxides/Glycols
BioBasic SEC 60 0.1 to 6 0.3 to 6 0.1 to 4BioBasic SEC 120 0.1 to 50 0.3 to 12 0.4 to 10BioBasic SEC 300 1 to 500 1 to 100 2 to 100BioBasic SEC 1000 20 to 4,000 20 to >1,000 Not recommended
Table 10: Choosing a BioBasic SEC column based on compound molecular weight
Figure 51: Molecular weight calibration curves
Columns: BioBasic SEC 5 µm, 300 x 7.8 mm
Eluent: 0.1M KH2PO4 pH7Flow: 1.0 mL/min
Detector: UV @ 254Injection: 20 µL
Sample 1. Thyroglobulin(MW669,00)
2. Ovalbumin (MW 45,000)
3. Angiotensin II(MW 1,046)
4. PABA (Vm) (MW 137)
0 2 4 6 8 10 MIN
4
4
4
3/4
3
3
3
1/2
2
2
21
1
1
60Å
120Å
300Å
1000Å
Figure 52: Effect of pore size on SEC separation
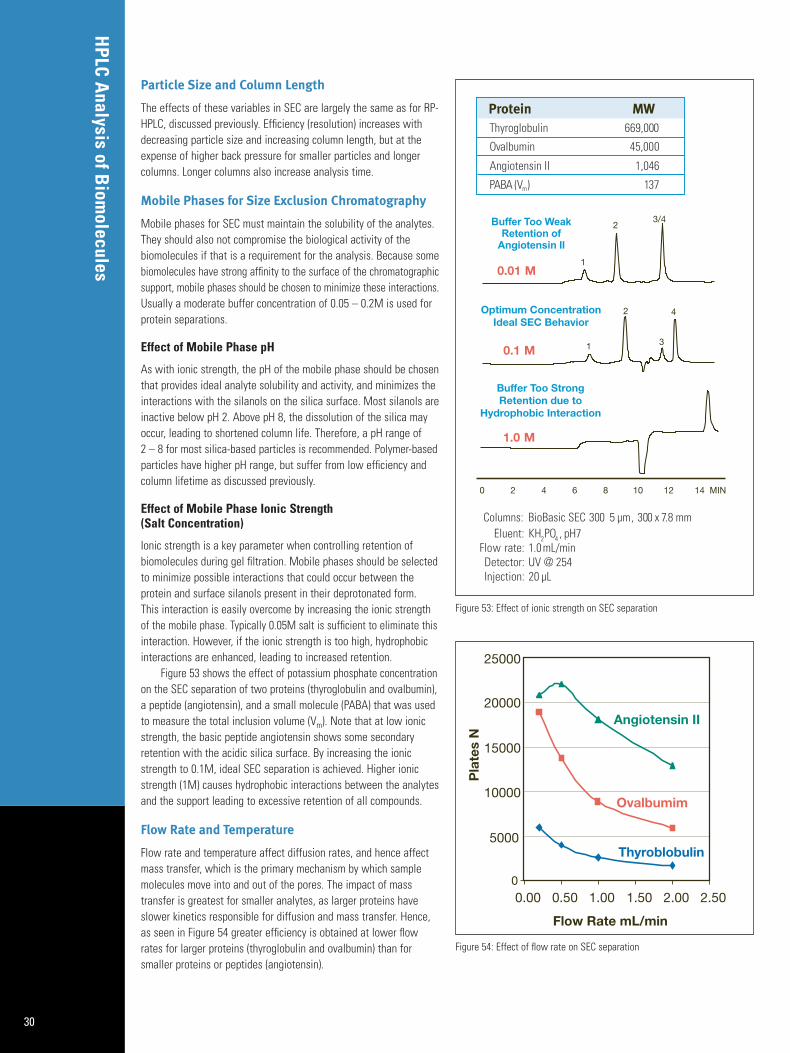
HPLC A
nalysis of Biom
olecules
30
Particle Size and Column Length
The effects of these variables in SEC are largely the same as for RP-HPLC, discussed previously. Efficiency (resolution) increases withdecreasing particle size and increasing column length, but at theexpense of higher back pressure for smaller particles and longercolumns. Longer columns also increase analysis time.
Mobile Phases for Size Exclusion Chromatography
Mobile phases for SEC must maintain the solubility of the analytes.They should also not compromise the biological activity of the biomolecules if that is a requirement for the analysis. Because somebiomolecules have strong affinity to the surface of the chromatographicsupport, mobile phases should be chosen to minimize these interactions.Usually a moderate buffer concentration of 0.05 – 0.2M is used forprotein separations.
Effect of Mobile Phase pH
As with ionic strength, the pH of the mobile phase should be chosenthat provides ideal analyte solubility and activity, and minimizes theinteractions with the silanols on the silica surface. Most silanols areinactive below pH 2. Above pH 8, the dissolution of the silica mayoccur, leading to shortened column life. Therefore, a pH range of 2 – 8 for most silica-based particles is recommended. Polymer-basedparticles have higher pH range, but suffer from low efficiency andcolumn lifetime as discussed previously.
Effect of Mobile Phase Ionic Strength (Salt Concentration)
Ionic strength is a key parameter when controlling retention of biomolecules during gel filtration. Mobile phases should be selectedto minimize possible interactions that could occur between the protein and surface silanols present in their deprotonated form. This interaction is easily overcome by increasing the ionic strengthof the mobile phase. Typically 0.05M salt is sufficient to eliminate thisinteraction. However, if the ionic strength is too high, hydrophobicinteractions are enhanced, leading to increased retention.
Figure 53 shows the effect of potassium phosphate concentrationon the SEC separation of two proteins (thyroglobulin and ovalbumin),a peptide (angiotensin), and a small molecule (PABA) that was usedto measure the total inclusion volume (Vm). Note that at low ionicstrength, the basic peptide angiotensin shows some secondaryretention with the acidic silica surface. By increasing the ionicstrength to 0.1M, ideal SEC separation is achieved. Higher ionicstrength (1M) causes hydrophobic interactions between the analytesand the support leading to excessive retention of all compounds.
Flow Rate and Temperature
Flow rate and temperature affect diffusion rates, and hence affectmass transfer, which is the primary mechanism by which samplemolecules move into and out of the pores. The impact of masstransfer is greatest for smaller analytes, as larger proteins haveslower kinetics responsible for diffusion and mass transfer. Hence,as seen in Figure 54 greater efficiency is obtained at lower flowrates for larger proteins (thyroglobulin and ovalbumin) than forsmaller proteins or peptides (angiotensin).
Figure 53: Effect of ionic strength on SEC separation
Figure 54: Effect of flow rate on SEC separation
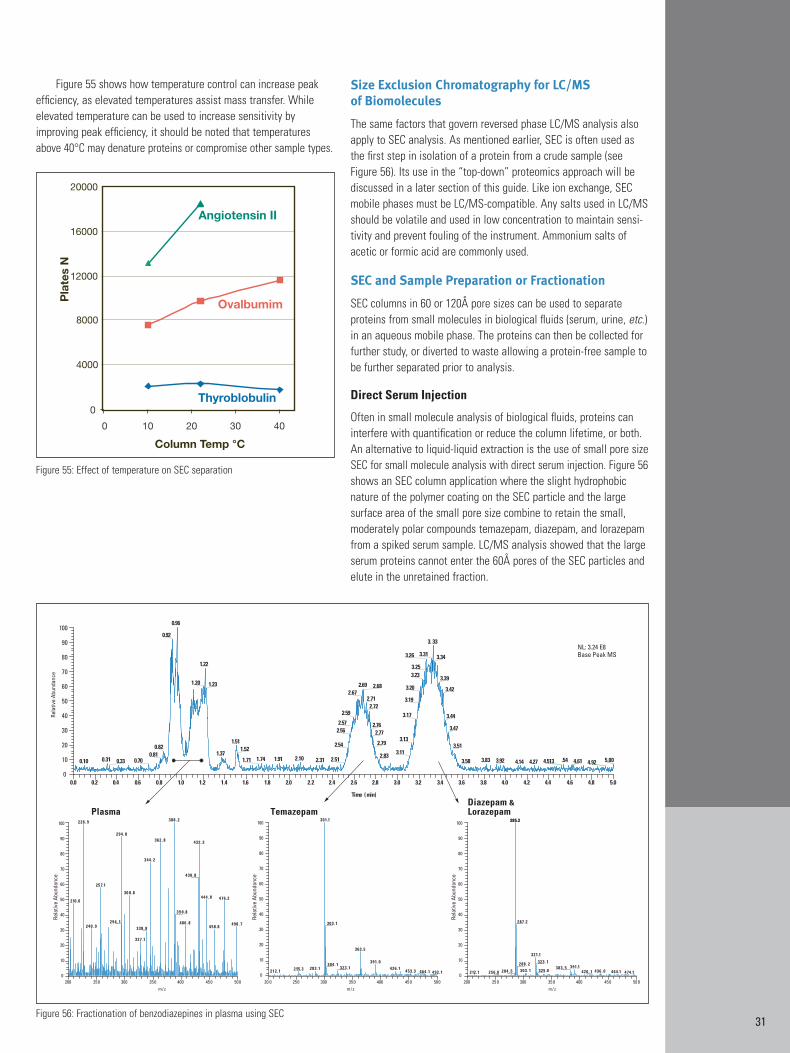
31
Figure 55 shows how temperature control can increase peakefficiency, as elevated temperatures assist mass transfer. While elevated temperature can be used to increase sensitivity by improving peak efficiency, it should be noted that temperaturesabove 40°C may denature proteins or compromise other sample types.
Size Exclusion Chromatography for LC/MS of Biomolecules
The same factors that govern reversed phase LC/MS analysis alsoapply to SEC analysis. As mentioned earlier, SEC is often used asthe first step in isolation of a protein from a crude sample (seeFigure 56). Its use in the “top-down” proteomics approach will bediscussed in a later section of this guide. Like ion exchange, SECmobile phases must be LC/MS-compatible. Any salts used in LC/MSshould be volatile and used in low concentration to maintain sensi-tivity and prevent fouling of the instrument. Ammonium salts ofacetic or formic acid are commonly used.
SEC and Sample Preparation or Fractionation
SEC columns in 60 or 120Å pore sizes can be used to separate proteins from small molecules in biological fluids (serum, urine, etc.)in an aqueous mobile phase. The proteins can then be collected forfurther study, or diverted to waste allowing a protein-free sample tobe further separated prior to analysis.
Direct Serum Injection
Often in small molecule analysis of biological fluids, proteins caninterfere with quantification or reduce the column lifetime, or both.An alternative to liquid-liquid extraction is the use of small pore sizeSEC for small molecule analysis with direct serum injection. Figure 56shows an SEC column application where the slight hydrophobicnature of the polymer coating on the SEC particle and the large surface area of the small pore size combine to retain the small,moderately polar compounds temazepam, diazepam, and lorazepamfrom a spiked serum sample. LC/MS analysis showed that the largeserum proteins cannot enter the 60Å pores of the SEC particles andelute in the unretained fraction.
Figure 56: Fractionation of benzodiazepines in plasma using SEC
Figure 55: Effect of temperature on SEC separation
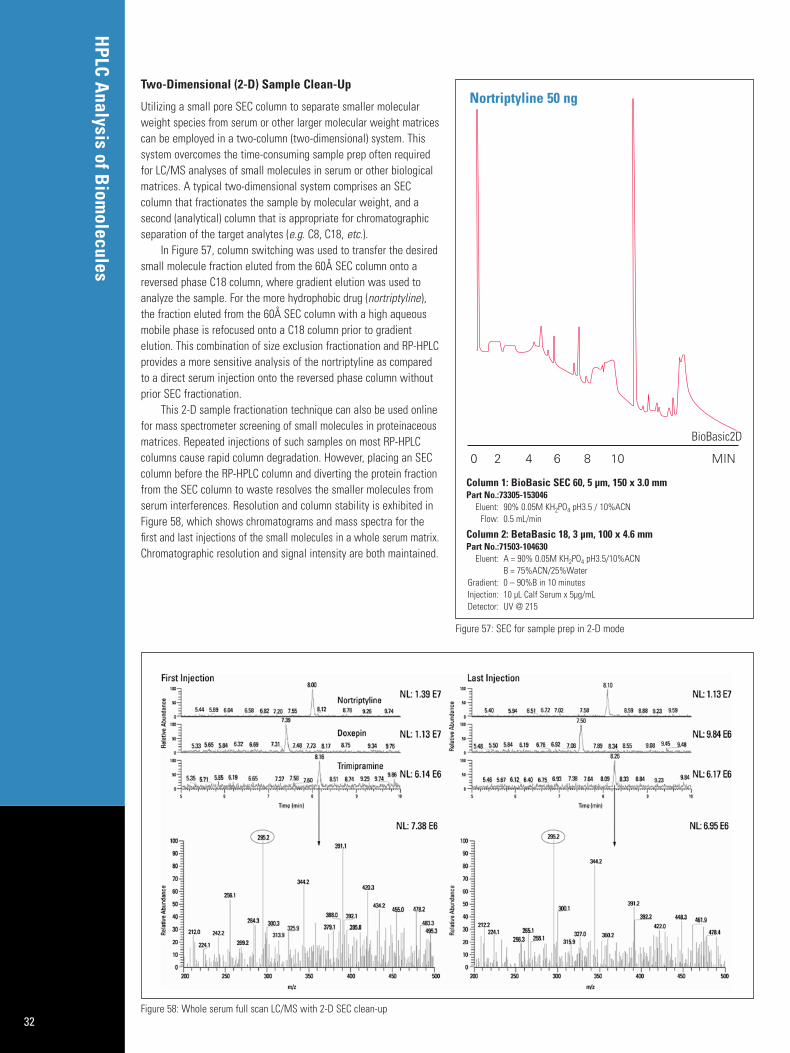
HPLC A
nalysis of Biom
olecules
32
Two-Dimensional (2-D) Sample Clean-Up
Utilizing a small pore SEC column to separate smaller molecularweight species from serum or other larger molecular weight matricescan be employed in a two-column (two-dimensional) system. Thissystem overcomes the time-consuming sample prep often requiredfor LC/MS analyses of small molecules in serum or other biologicalmatrices. A typical two-dimensional system comprises an SEC column that fractionates the sample by molecular weight, and asecond (analytical) column that is appropriate for chromatographicseparation of the target analytes (e.g. C8, C18, etc.).
In Figure 57, column switching was used to transfer the desiredsmall molecule fraction eluted from the 60Å SEC column onto areversed phase C18 column, where gradient elution was used toanalyze the sample. For the more hydrophobic drug (nortriptyline),the fraction eluted from the 60Å SEC column with a high aqueousmobile phase is refocused onto a C18 column prior to gradient elution. This combination of size exclusion fractionation and RP-HPLCprovides a more sensitive analysis of the nortriptyline as comparedto a direct serum injection onto the reversed phase column withoutprior SEC fractionation.
This 2-D sample fractionation technique can also be used onlinefor mass spectrometer screening of small molecules in proteinaceousmatrices. Repeated injections of such samples on most RP-HPLCcolumns cause rapid column degradation. However, placing an SECcolumn before the RP-HPLC column and diverting the protein fractionfrom the SEC column to waste resolves the smaller molecules fromserum interferences. Resolution and column stability is exhibited inFigure 58, which shows chromatograms and mass spectra for thefirst and last injections of the small molecules in a whole serum matrix.Chromatographic resolution and signal intensity are both maintained.
Figure 57: SEC for sample prep in 2-D mode
Figure 58: Whole serum full scan LC/MS with 2-D SEC clean-up
0 2 4 6 8 10 MIN
BioBasic2D
Column 1: BioBasic SEC 60, 5 µm, 150 x 3.0 mmPart No.:73305-153046
Eluent: 90% 0.05M KH2PO4 pH3.5 / 10%ACNFlow: 0.5 mL/min
Column 2: BetaBasic 18, 3 µm, 100 x 4.6 mmPart No.:71503-104630
Eluent: A = 90% 0.05M KH2PO4 pH3.5/10%ACNB = 75%ACN/25%Water
Gradient: 0 – 90%B in 10 minutesInjection: 10 µL Calf Serum x 5µg/mLDetector: UV @ 215
Nortriptyline 50 ng
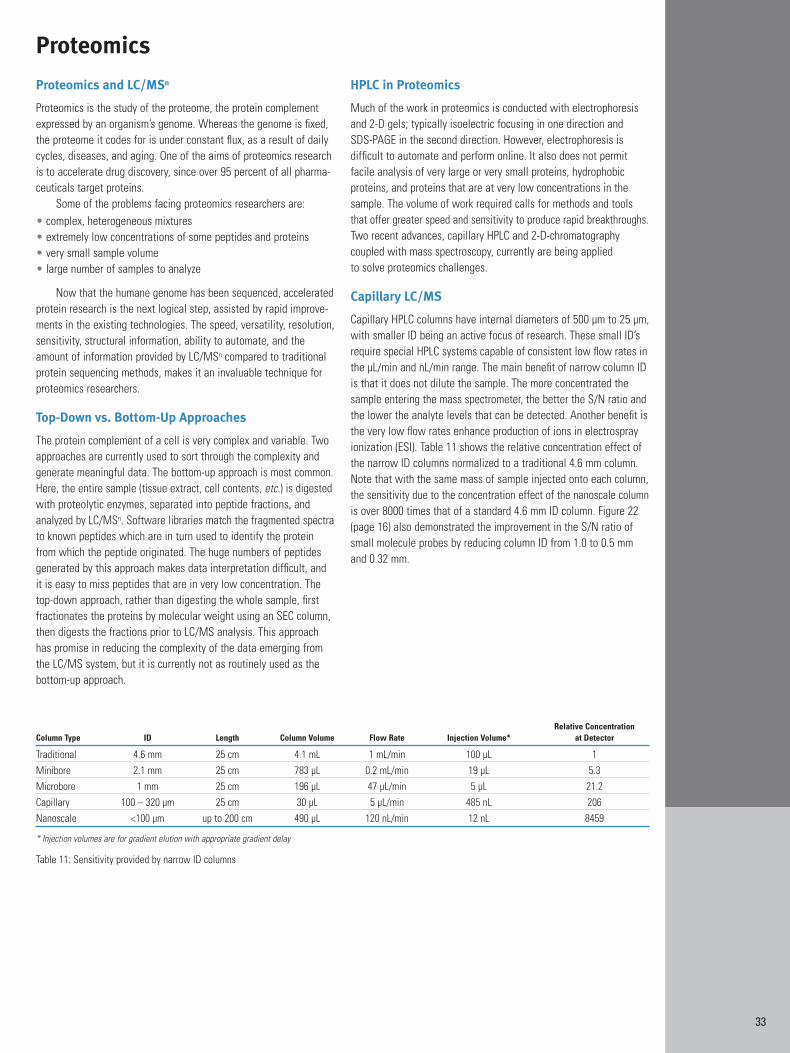
33
Proteomics and LC/MSn
Proteomics is the study of the proteome, the protein complementexpressed by an organism’s genome. Whereas the genome is fixed,the proteome it codes for is under constant flux, as a result of dailycycles, diseases, and aging. One of the aims of proteomics researchis to accelerate drug discovery, since over 95 percent of all pharma-ceuticals target proteins.
Some of the problems facing proteomics researchers are:• complex, heterogeneous mixtures• extremely low concentrations of some peptides and proteins• very small sample volume• large number of samples to analyze
Now that the humane genome has been sequenced, acceleratedprotein research is the next logical step, assisted by rapid improve-ments in the existing technologies. The speed, versatility, resolution,sensitivity, structural information, ability to automate, and theamount of information provided by LC/MSn compared to traditionalprotein sequencing methods, makes it an invaluable technique forproteomics researchers.
Top-Down vs. Bottom-Up Approaches
The protein complement of a cell is very complex and variable. Twoapproaches are currently used to sort through the complexity andgenerate meaningful data. The bottom-up approach is most common.Here, the entire sample (tissue extract, cell contents, etc.) is digestedwith proteolytic enzymes, separated into peptide fractions, and analyzed by LC/MSn. Software libraries match the fragmented spectrato known peptides which are in turn used to identify the proteinfrom which the peptide originated. The huge numbers of peptidesgenerated by this approach makes data interpretation difficult, andit is easy to miss peptides that are in very low concentration. Thetop-down approach, rather than digesting the whole sample, firstfractionates the proteins by molecular weight using an SEC column,then digests the fractions prior to LC/MS analysis. This approachhas promise in reducing the complexity of the data emerging fromthe LC/MS system, but it is currently not as routinely used as thebottom-up approach.
HPLC in Proteomics
Much of the work in proteomics is conducted with electrophoresisand 2-D gels; typically isoelectric focusing in one direction and SDS-PAGE in the second direction. However, electrophoresis is difficult to automate and perform online. It also does not permitfacile analysis of very large or very small proteins, hydrophobic proteins, and proteins that are at very low concentrations in thesample. The volume of work required calls for methods and toolsthat offer greater speed and sensitivity to produce rapid breakthroughs.Two recent advances, capillary HPLC and 2-D-chromatography coupled with mass spectroscopy, currently are being applied to solve proteomics challenges.
Capillary LC/MS
Capillary HPLC columns have internal diameters of 500 µm to 25 µm,with smaller ID being an active focus of research. These small ID’srequire special HPLC systems capable of consistent low flow rates inthe µL/min and nL/min range. The main benefit of narrow column IDis that it does not dilute the sample. The more concentrated thesample entering the mass spectrometer, the better the S/N ratio andthe lower the analyte levels that can be detected. Another benefit isthe very low flow rates enhance production of ions in electrosprayionization (ESI). Table 11 shows the relative concentration effect ofthe narrow ID columns normalized to a traditional 4.6 mm column.Note that with the same mass of sample injected onto each column,the sensitivity due to the concentration effect of the nanoscale columnis over 8000 times that of a standard 4.6 mm ID column. Figure 22(page 16) also demonstrated the improvement in the S/N ratio ofsmall molecule probes by reducing column ID from 1.0 to 0.5 mm and 0.32 mm.
Proteomics
Relative Concentration Column Type ID Length Column Volume Flow Rate Injection Volume* at Detector
Traditional 4.6 mm 25 cm 4.1 mL 1 mL/min 100 µL 1Minibore 2.1 mm 25 cm 783 µL 0.2 mL/min 19 µL 5.3Microbore 1 mm 25 cm 196 µL 47 µL/min 5 µL 21.2Capillary 100 – 320 µm 25 cm 30 µL 5 µL/min 485 nL 206Nanoscale <100 µm up to 200 cm 490 µL 120 nL/min 12 nL 8459
* Injection volumes are for gradient elution with appropriate gradient delay
Table 11: Sensitivity provided by narrow ID columns
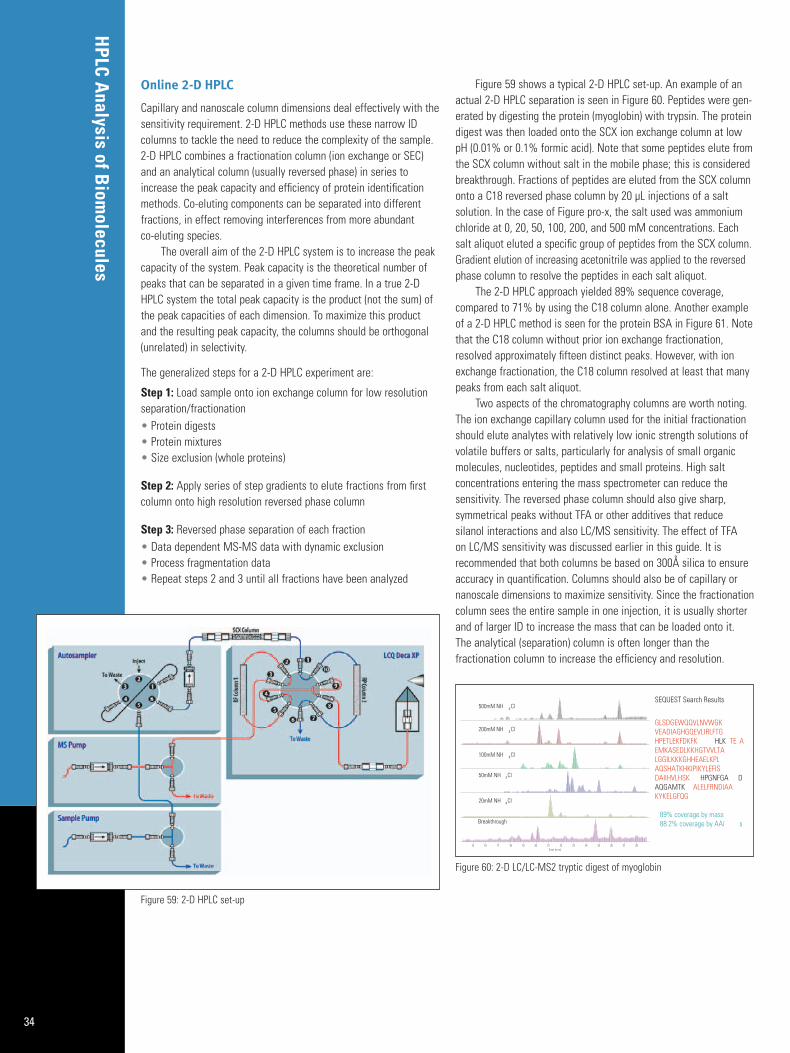
HPLC A
nalysis of Biom
olecules
34
Online 2-D HPLC
Capillary and nanoscale column dimensions deal effectively with thesensitivity requirement. 2-D HPLC methods use these narrow IDcolumns to tackle the need to reduce the complexity of the sample.2-D HPLC combines a fractionation column (ion exchange or SEC)and an analytical column (usually reversed phase) in series toincrease the peak capacity and efficiency of protein identificationmethods. Co-eluting components can be separated into differentfractions, in effect removing interferences from more abundant co-eluting species.
The overall aim of the 2-D HPLC system is to increase the peakcapacity of the system. Peak capacity is the theoretical number ofpeaks that can be separated in a given time frame. In a true 2-DHPLC system the total peak capacity is the product (not the sum) ofthe peak capacities of each dimension. To maximize this productand the resulting peak capacity, the columns should be orthogonal(unrelated) in selectivity.
The generalized steps for a 2-D HPLC experiment are:
Step 1: Load sample onto ion exchange column for low resolutionseparation/fractionation• Protein digests• Protein mixtures• Size exclusion (whole proteins)
Step 2: Apply series of step gradients to elute fractions from firstcolumn onto high resolution reversed phase column
Step 3: Reversed phase separation of each fraction• Data dependent MS-MS data with dynamic exclusion• Process fragmentation data• Repeat steps 2 and 3 until all fractions have been analyzed
Figure 59 shows a typical 2-D HPLC set-up. An example of anactual 2-D HPLC separation is seen in Figure 60. Peptides were gen-erated by digesting the protein (myoglobin) with trypsin. The proteindigest was then loaded onto the SCX ion exchange column at lowpH (0.01% or 0.1% formic acid). Note that some peptides elute fromthe SCX column without salt in the mobile phase; this is consideredbreakthrough. Fractions of peptides are eluted from the SCX columnonto a C18 reversed phase column by 20 µL injections of a salt solution. In the case of Figure pro-x, the salt used was ammoniumchloride at 0, 20, 50, 100, 200, and 500 mM concentrations. Eachsalt aliquot eluted a specific group of peptides from the SCX column.Gradient elution of increasing acetonitrile was applied to the reversedphase column to resolve the peptides in each salt aliquot.
The 2-D HPLC approach yielded 89% sequence coverage, compared to 71% by using the C18 column alone. Another exampleof a 2-D HPLC method is seen for the protein BSA in Figure 61. Notethat the C18 column without prior ion exchange fractionation,resolved approximately fifteen distinct peaks. However, with ionexchange fractionation, the C18 column resolved at least that manypeaks from each salt aliquot.
Two aspects of the chromatography columns are worth noting.The ion exchange capillary column used for the initial fractionationshould elute analytes with relatively low ionic strength solutions ofvolatile buffers or salts, particularly for analysis of small organicmolecules, nucleotides, peptides and small proteins. High salt concentrations entering the mass spectrometer can reduce the sensitivity. The reversed phase column should also give sharp, symmetrical peaks without TFA or other additives that reducesilanol interactions and also LC/MS sensitivity. The effect of TFA on LC/MS sensitivity was discussed earlier in this guide. It is recommended that both columns be based on 300Å silica to ensureaccuracy in quantification. Columns should also be of capillary ornanoscale dimensions to maximize sensitivity. Since the fractionationcolumn sees the entire sample in one injection, it is usually shorterand of larger ID to increase the mass that can be loaded onto it. The analytical (separation) column is often longer than the fractionation column to increase the efficiency and resolution.
Figure 59: 2-D HPLC set-up
Figure 60: 2-D LC/LC-MS2 tryptic digest of myoglobin
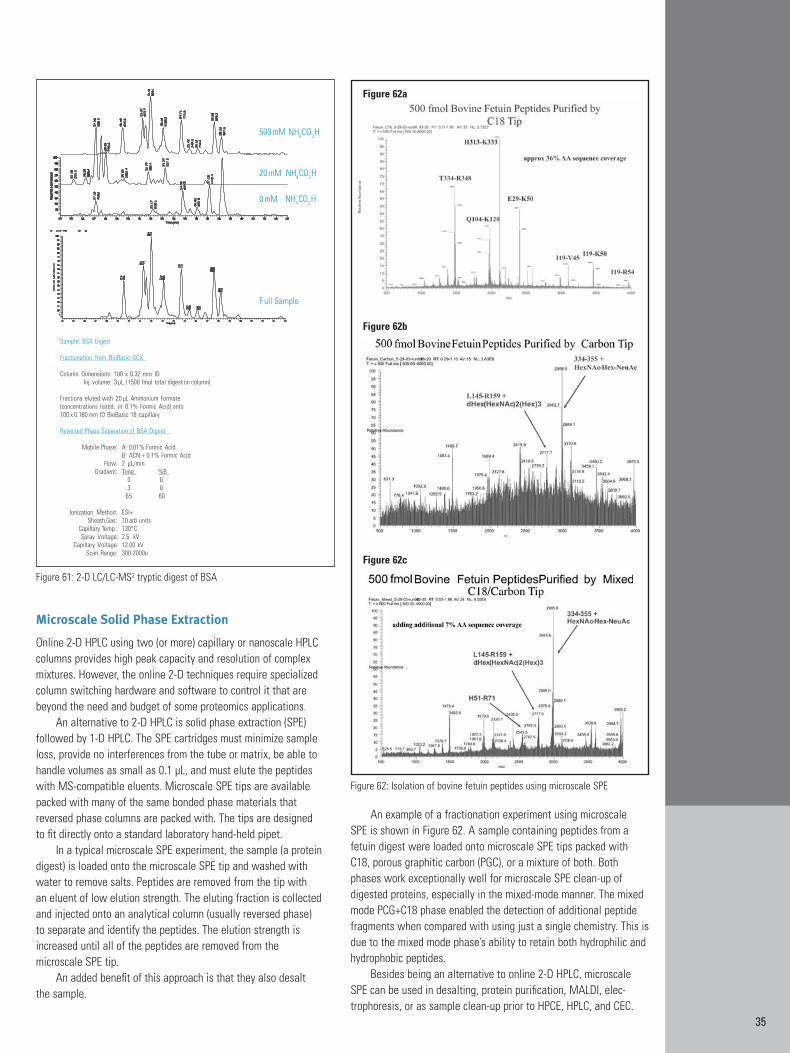
35
Microscale Solid Phase Extraction
Online 2-D HPLC using two (or more) capillary or nanoscale HPLCcolumns provides high peak capacity and resolution of complex mixtures. However, the online 2-D techniques require specializedcolumn switching hardware and software to control it that arebeyond the need and budget of some proteomics applications.
An alternative to 2-D HPLC is solid phase extraction (SPE) followed by 1-D HPLC. The SPE cartridges must minimize sampleloss, provide no interferences from the tube or matrix, be able tohandle volumes as small as 0.1 µL, and must elute the peptideswith MS-compatible eluents. Microscale SPE tips are availablepacked with many of the same bonded phase materials thatreversed phase columns are packed with. The tips are designed to fit directly onto a standard laboratory hand-held pipet.
In a typical microscale SPE experiment, the sample (a proteindigest) is loaded onto the microscale SPE tip and washed withwater to remove salts. Peptides are removed from the tip with an eluent of low elution strength. The eluting fraction is collectedand injected onto an analytical column (usually reversed phase) to separate and identify the peptides. The elution strength isincreased until all of the peptides are removed from the microscale SPE tip.
An added benefit of this approach is that they also desalt the sample.
An example of a fractionation experiment using microscale SPE is shown in Figure 62. A sample containing peptides from afetuin digest were loaded onto microscale SPE tips packed withC18, porous graphitic carbon (PGC), or a mixture of both. Both phases work exceptionally well for microscale SPE clean-up ofdigested proteins, especially in the mixed-mode manner. The mixedmode PCG+C18 phase enabled the detection of additional peptidefragments when compared with using just a single chemistry. This isdue to the mixed mode phase’s ability to retain both hydrophilic andhydrophobic peptides.
Besides being an alternative to online 2-D HPLC, microscaleSPE can be used in desalting, protein purification, MALDI, elec-trophoresis, or as sample clean-up prior to HPCE, HPLC, and CEC.
Figure 61: 2-D LC/LC-MS2 tryptic digest of BSA
Figure 62: Isolation of bovine fetuin peptides using microscale SPE
Figure 62a
Figure 62b
Figure 62c
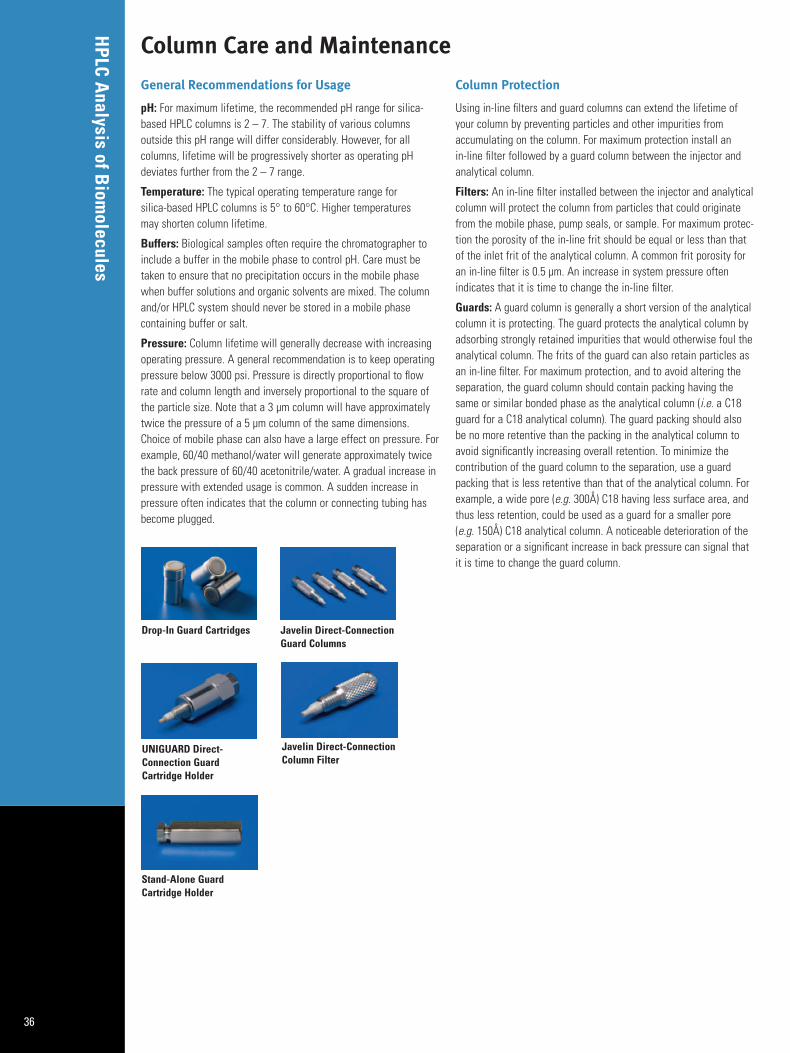
HPLC A
nalysis of Biom
olecules
36
General Recommendations for Usage
pH: For maximum lifetime, the recommended pH range for silica-based HPLC columns is 2 – 7. The stability of various columns outside this pH range will differ considerably. However, for allcolumns, lifetime will be progressively shorter as operating pH deviates further from the 2 – 7 range.
Temperature: The typical operating temperature range for silica-based HPLC columns is 5° to 60°C. Higher temperatures may shorten column lifetime.
Buffers: Biological samples often require the chromatographer toinclude a buffer in the mobile phase to control pH. Care must betaken to ensure that no precipitation occurs in the mobile phasewhen buffer solutions and organic solvents are mixed. The columnand/or HPLC system should never be stored in a mobile phase containing buffer or salt.
Pressure: Column lifetime will generally decrease with increasingoperating pressure. A general recommendation is to keep operatingpressure below 3000 psi. Pressure is directly proportional to flowrate and column length and inversely proportional to the square ofthe particle size. Note that a 3 µm column will have approximatelytwice the pressure of a 5 µm column of the same dimensions.Choice of mobile phase can also have a large effect on pressure. For example, 60/40 methanol/water will generate approximately twicethe back pressure of 60/40 acetonitrile/water. A gradual increase inpressure with extended usage is common. A sudden increase inpressure often indicates that the column or connecting tubing hasbecome plugged.
Column Protection
Using in-line filters and guard columns can extend the lifetime ofyour column by preventing particles and other impurities from accumulating on the column. For maximum protection install an in-line filter followed by a guard column between the injector andanalytical column.
Filters: An in-line filter installed between the injector and analyticalcolumn will protect the column from particles that could originatefrom the mobile phase, pump seals, or sample. For maximum protec-tion the porosity of the in-line frit should be equal or less than thatof the inlet frit of the analytical column. A common frit porosity foran in-line filter is 0.5 µm. An increase in system pressure often indicates that it is time to change the in-line filter.
Guards: A guard column is generally a short version of the analyticalcolumn it is protecting. The guard protects the analytical column byadsorbing strongly retained impurities that would otherwise foul theanalytical column. The frits of the guard can also retain particles asan in-line filter. For maximum protection, and to avoid altering theseparation, the guard column should contain packing having thesame or similar bonded phase as the analytical column (i.e. a C18guard for a C18 analytical column). The guard packing should alsobe no more retentive than the packing in the analytical column toavoid significantly increasing overall retention. To minimize the contribution of the guard column to the separation, use a guardpacking that is less retentive than that of the analytical column. Forexample, a wide pore (e.g. 300Å) C18 having less surface area, andthus less retention, could be used as a guard for a smaller pore (e.g. 150Å) C18 analytical column. A noticeable deterioration of the separation or a significant increase in back pressure can signal thatit is time to change the guard column.
Column Care and Maintenance
Javelin Direct-ConnectionGuard Columns
Javelin Direct-ConnectionColumn Filter
Stand-Alone GuardCartridge Holder
Drop-In Guard Cartridges
UNIGUARD Direct-Connection GuardCartridge Holder
37
Column Cleaning
If some components of the sample are not eluted by the mobilephase, they will gradually accumulate on the column, eventuallyleading to loss of column performance. For optimum reproducibilityand maximum column lifetime, periodically clean the column, ratherthan waiting until column performance has been affected. For highback pressure, reverse the flow direction if the column designallows. Backflushing at low flow rates should not harm a well-packedsilica-based column. Do not backflush into the detector. Clean thecolumn by backflushing at a low flow (i.e. half of usual) with 10 – 20column volumes of an appropriate strong mobile phase. For areversed phase column the most appropriate cleaning mobile phaseis one containing a high proportion of a polar organic solvent, suchas isopropanol. Flushing with several gradient cycles of weak tostrong mobile phase is sometimes more effective than flushing iso-cratically with just strong mobile phase, particularly for hydrophobicproteins adsorbed on reversed phase columns.
If the above procedure does not adequately clean the column,alternative flushing mobile phases are a nonpolar organic solvent, ora low concentration surfactant solution. A nonpolar organic solventlike methylene chloride or chloroform may be required to elute veryhydrophobic or oily compounds. A surfactant solution, such as 0.5%SDS will be effective at removing precipitated proteins. Denaturingagents, such as 5 – 8M urea or guanidine HCl are sometimes effec-tive at removing strongly adsorbed proteins. In addition, sometimesflushing with a dilute aqueous buffer with pH significantly lower orhigher than the chromatographic mobile phase can solubilize precip-itated impurities. The most effective cleaning scheme will dependon the conditions and samples to which the column is exposed.
The main purpose of the above procedure is to remove thebuild-up of compounds that do not elute under the usual mobilephase conditions, but a secondary purpose is to recondition the stationary phase after it has been changed (usually a gradualprocess) in some way by the mobile phase or one of its components.Before flushing with organic solvents, buffers and additives shouldfirst be flushed out of the column with a high aqueous/organic mix-ture (i.e. 90/10 water/acetonitrile) rather than pure water. Elevatedtemperatures (e.g. 50°C) can also enhance the cleaning effect.
Column frits that hold the packing bed in place should bechanged only as a last resort to restore the column. Please contactthe column manufacturer before removing a column end fitting.
Column Storage
A mixture of acetonitrile and water is a good storage solvent forreversed phase columns. Acetonitrile concentration should be atleast 10%. Avoid storage with acidic modifiers such as trifluoroaceticacid. Buffers and additives should be flushed from the system priorto storage to minimize the chance of chemical reaction or residuedeposit from inadvertent evaporation. A good storage solvent retardsbiological growth and minimizes chemical reactions within the column, such as hydrolysis of the stationary phase. Pure watershould generally be avoided as storage solvent for silica-basedcolumns as it does not retard microbial growth and can potentiallypromote hydrolysis. It is desirable to select storage solvents that aremiscible with the typical mobile phase employed for separation.Using 10% acetonitrile as your storage solvent will allow you todirectly equilibrate the column with almost any buffer containingmobile phase without danger of precipitating salts.
Steel plugs are recommended over plastic for long periods ofstorage to help prevent evaporation of the storage solvent, althoughthere is no strong evidence that silica-based columns are harmed bydry storage if residues have not formed. When employingalcohol/water mixtures for flushing or storage, use caution becausethey are more viscous than either water or alcohol alone and cangenerate high back pressures.
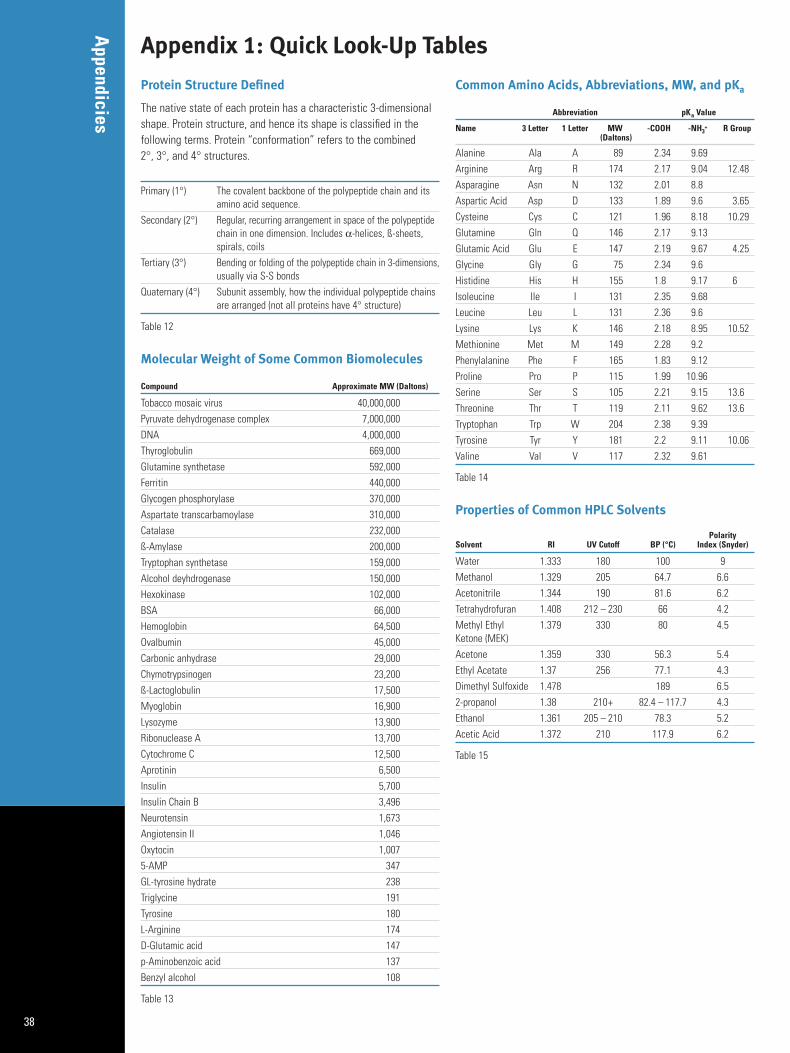
Appendicies
38
Protein Structure Defined
The native state of each protein has a characteristic 3-dimensionalshape. Protein structure, and hence its shape is classified in the following terms. Protein “conformation” refers to the combined 2°, 3°, and 4° structures.
Primary (1°) The covalent backbone of the polypeptide chain and itsamino acid sequence.
Secondary (2°) Regular, recurring arrangement in space of the polypeptidechain in one dimension. Includes α-helices, ß-sheets, spirals, coils
Tertiary (3°) Bending or folding of the polypeptide chain in 3-dimensions,usually via S-S bonds
Quaternary (4°) Subunit assembly, how the individual polypeptide chainsare arranged (not all proteins have 4° structure)
Table 12
Molecular Weight of Some Common Biomolecules
Compound Approximate MW (Daltons)
Tobacco mosaic virus 40,000,000Pyruvate dehydrogenase complex 7,000,000DNA 4,000,000Thyroglobulin 669,000Glutamine synthetase 592,000Ferritin 440,000Glycogen phosphorylase 370,000Aspartate transcarbamoylase 310,000Catalase 232,000ß-Amylase 200,000Tryptophan synthetase 159,000Alcohol deyhdrogenase 150,000Hexokinase 102,000BSA 66,000Hemoglobin 64,500Ovalbumin 45,000Carbonic anhydrase 29,000Chymotrypsinogen 23,200ß-Lactoglobulin 17,500Myoglobin 16,900Lysozyme 13,900Ribonuclease A 13,700Cytochrome C 12,500Aprotinin 6,500Insulin 5,700Insulin Chain B 3,496Neurotensin 1,673Angiotensin II 1,046Oxytocin 1,0075-AMP 347GL-tyrosine hydrate 238Triglycine 191Tyrosine 180L-Arginine 174D-Glutamic acid 147p-Aminobenzoic acid 137Benzyl alcohol 108
Table 13
Common Amino Acids, Abbreviations, MW, and pKa
Abbreviation pKa Value
Name 3 Letter 1 Letter MW -COOH -NH3+ R Group
(Daltons)
Alanine Ala A 89 2.34 9.69Arginine Arg R 174 2.17 9.04 12.48Asparagine Asn N 132 2.01 8.8Aspartic Acid Asp D 133 1.89 9.6 3.65Cysteine Cys C 121 1.96 8.18 10.29Glutamine Gln Q 146 2.17 9.13Glutamic Acid Glu E 147 2.19 9.67 4.25Glycine Gly G 75 2.34 9.6Histidine His H 155 1.8 9.17 6Isoleucine Ile I 131 2.35 9.68Leucine Leu L 131 2.36 9.6Lysine Lys K 146 2.18 8.95 10.52Methionine Met M 149 2.28 9.2Phenylalanine Phe F 165 1.83 9.12Proline Pro P 115 1.99 10.96Serine Ser S 105 2.21 9.15 13.6Threonine Thr T 119 2.11 9.62 13.6Tryptophan Trp W 204 2.38 9.39Tyrosine Tyr Y 181 2.2 9.11 10.06Valine Val V 117 2.32 9.61
Table 14
Properties of Common HPLC Solvents
Polarity Solvent RI UV Cutoff BP (°C) Index (Snyder)
Water 1.333 180 100 9Methanol 1.329 205 64.7 6.6Acetonitrile 1.344 190 81.6 6.2Tetrahydrofuran 1.408 212 – 230 66 4.2Methyl Ethyl 1.379 330 80 4.5Ketone (MEK)Acetone 1.359 330 56.3 5.4Ethyl Acetate 1.37 256 77.1 4.3Dimethyl Sulfoxide 1.478 189 6.52-propanol 1.38 210+ 82.4 – 117.7 4.3Ethanol 1.361 205 – 210 78.3 5.2Acetic Acid 1.372 210 117.9 6.2
Table 15
Appendix 1: Quick Look-Up Tables
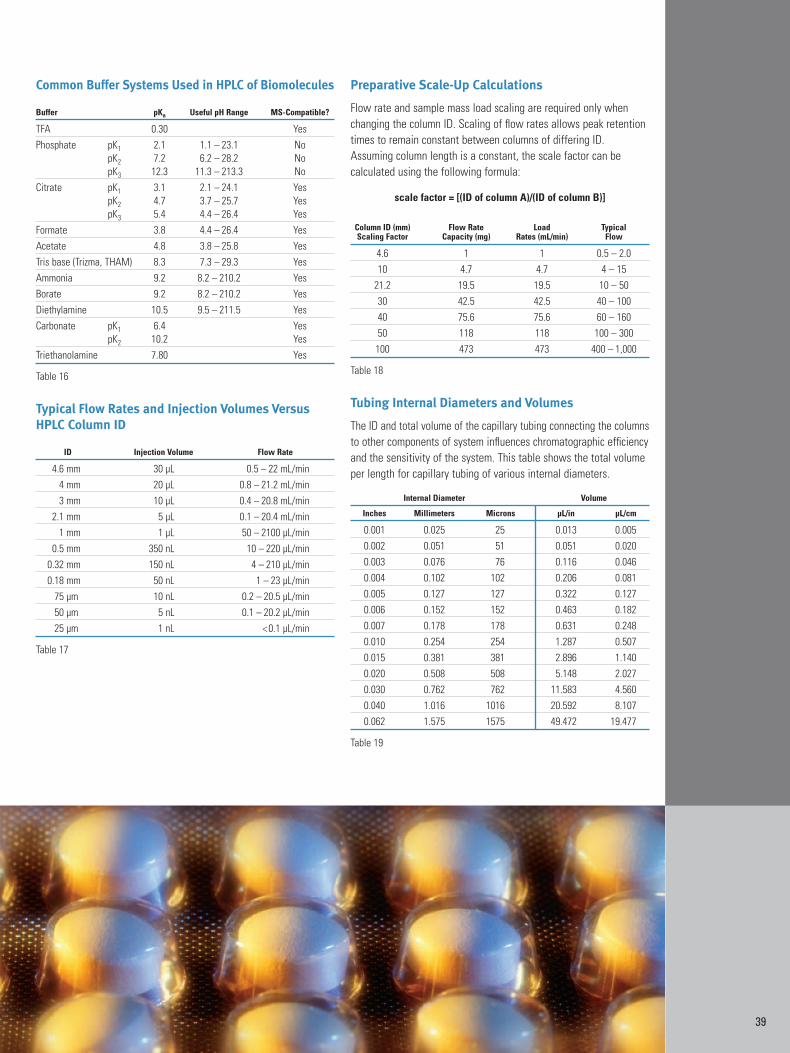
39
Common Buffer Systems Used in HPLC of Biomolecules
Buffer pKa Useful pH Range MS-Compatible?
TFA 0.30 YesPhosphate pK1 2.1 1.1 – 23.1 No
pK2 7.2 6.2 – 28.2 NopK3 12.3 11.3 – 213.3 No
Citrate pK1 3.1 2.1 – 24.1 YespK2 4.7 3.7 – 25.7 YespK3 5.4 4.4 – 26.4 Yes
Formate 3.8 4.4 – 26.4 YesAcetate 4.8 3.8 – 25.8 YesTris base (Trizma, THAM) 8.3 7.3 – 29.3 YesAmmonia 9.2 8.2 – 210.2 YesBorate 9.2 8.2 – 210.2 YesDiethylamine 10.5 9.5 – 211.5 YesCarbonate pK1 6.4 Yes
pK2 10.2 YesTriethanolamine 7.80 Yes
Table 16
Typical Flow Rates and Injection Volumes VersusHPLC Column ID
ID Injection Volume Flow Rate
4.6 mm 30 µL 0.5 – 22 mL/min4 mm 20 µL 0.8 – 21.2 mL/min3 mm 10 µL 0.4 – 20.8 mL/min
2.1 mm 5 µL 0.1 – 20.4 mL/min1 mm 1 µL 50 – 2100 µL/min
0.5 mm 350 nL 10 – 220 µL/min0.32 mm 150 nL 4 – 210 µL/min0.18 mm 50 nL 1 – 23 µL/min
75 µm 10 nL 0.2 – 20.5 µL/min50 µm 5 nL 0.1 – 20.2 µL/min25 µm 1 nL <0.1 µL/min
Table 17
Preparative Scale-Up Calculations
Flow rate and sample mass load scaling are required only whenchanging the column ID. Scaling of flow rates allows peak retentiontimes to remain constant between columns of differing ID.Assuming column length is a constant, the scale factor can be calculated using the following formula:
scale factor = [(ID of column A)/(ID of column B)]
Column ID (mm) Flow Rate Load Typical Scaling Factor Capacity (mg) Rates (mL/min) Flow
4.6 1 1 0.5 – 2.010 4.7 4.7 4 – 15
21.2 19.5 19.5 10 – 5030 42.5 42.5 40 – 10040 75.6 75.6 60 – 16050 118 118 100 – 300100 473 473 400 – 1,000
Table 18
Tubing Internal Diameters and Volumes
The ID and total volume of the capillary tubing connecting the columnsto other components of system influences chromatographic efficiencyand the sensitivity of the system. This table shows the total volumeper length for capillary tubing of various internal diameters.
Internal Diameter Volume
Inches Millimeters Microns µL/in µL/cm
0.001 0.025 25 0.013 0.0050.002 0.051 51 0.051 0.0200.003 0.076 76 0.116 0.0460.004 0.102 102 0.206 0.0810.005 0.127 127 0.322 0.1270.006 0.152 152 0.463 0.1820.007 0.178 178 0.631 0.2480.010 0.254 254 1.287 0.5070.015 0.381 381 2.896 1.1400.020 0.508 508 5.148 2.0270.030 0.762 762 11.583 4.5600.040 1.016 1016 20.592 8.1070.062 1.575 1575 49.472 19.477
Table 19
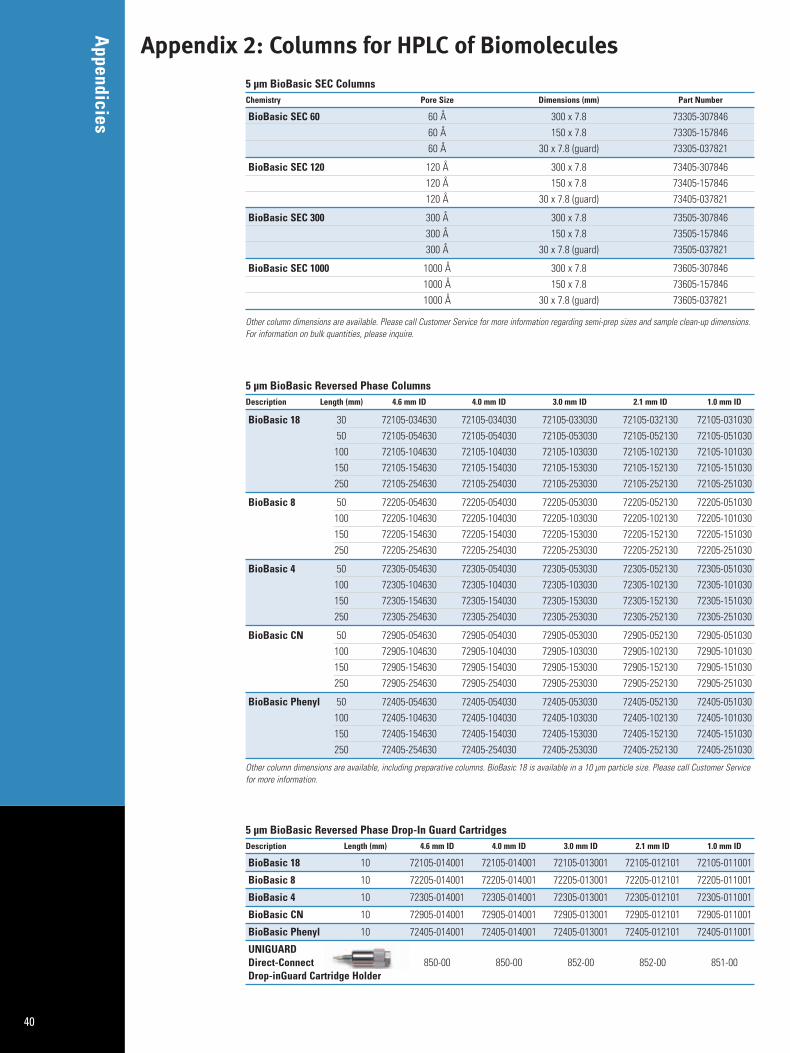
Appendicies
40
Appendix 2: Columns for HPLC of Biomolecules5 µm BioBasic SEC ColumnsChemistry Pore Size Dimensions (mm) Part Number
BioBasic SEC 60 60 Å 300 x 7.8 73305-30784660 Å 150 x 7.8 73305-15784660 Å 30 x 7.8 (guard) 73305-037821
BioBasic SEC 120 120 Å 300 x 7.8 73405-307846120 Å 150 x 7.8 73405-157846120 Å 30 x 7.8 (guard) 73405-037821
BioBasic SEC 300 300 Å 300 x 7.8 73505-307846300 Å 150 x 7.8 73505-157846300 Å 30 x 7.8 (guard) 73505-037821
BioBasic SEC 1000 1000 Å 300 x 7.8 73605-3078461000 Å 150 x 7.8 73605-1578461000 Å 30 x 7.8 (guard) 73605-037821
Other column dimensions are available. Please call Customer Service for more information regarding semi-prep sizes and sample clean-up dimensions.For information on bulk quantities, please inquire.
5 µm BioBasic Reversed Phase ColumnsDescription Length (mm) 4.6 mm ID 4.0 mm ID 3.0 mm ID 2.1 mm ID 1.0 mm ID
BioBasic 18 30 72105-034630 72105-034030 72105-033030 72105-032130 72105-03103050 72105-054630 72105-054030 72105-053030 72105-052130 72105-051030100 72105-104630 72105-104030 72105-103030 72105-102130 72105-101030150 72105-154630 72105-154030 72105-153030 72105-152130 72105-151030250 72105-254630 72105-254030 72105-253030 72105-252130 72105-251030
BioBasic 8 50 72205-054630 72205-054030 72205-053030 72205-052130 72205-051030100 72205-104630 72205-104030 72205-103030 72205-102130 72205-101030150 72205-154630 72205-154030 72205-153030 72205-152130 72205-151030250 72205-254630 72205-254030 72205-253030 72205-252130 72205-251030
BioBasic 4 50 72305-054630 72305-054030 72305-053030 72305-052130 72305-051030100 72305-104630 72305-104030 72305-103030 72305-102130 72305-101030150 72305-154630 72305-154030 72305-153030 72305-152130 72305-151030250 72305-254630 72305-254030 72305-253030 72305-252130 72305-251030
BioBasic CN 50 72905-054630 72905-054030 72905-053030 72905-052130 72905-051030100 72905-104630 72905-104030 72905-103030 72905-102130 72905-101030150 72905-154630 72905-154030 72905-153030 72905-152130 72905-151030250 72905-254630 72905-254030 72905-253030 72905-252130 72905-251030
BioBasic Phenyl 50 72405-054630 72405-054030 72405-053030 72405-052130 72405-051030100 72405-104630 72405-104030 72405-103030 72405-102130 72405-101030150 72405-154630 72405-154030 72405-153030 72405-152130 72405-151030250 72405-254630 72405-254030 72405-253030 72405-252130 72405-251030
Other column dimensions are available, including preparative columns. BioBasic 18 is available in a 10 µm particle size. Please call Customer Servicefor more information.
5 µm BioBasic Reversed Phase Drop-In Guard CartridgesDescription Length (mm) 4.6 mm ID 4.0 mm ID 3.0 mm ID 2.1 mm ID 1.0 mm ID
BioBasic 18 10 72105-014001 72105-014001 72105-013001 72105-012101 72105-011001
BioBasic 8 10 72205-014001 72205-014001 72205-013001 72205-012101 72205-011001
BioBasic 4 10 72305-014001 72305-014001 72305-013001 72305-012101 72305-011001
BioBasic CN 10 72905-014001 72905-014001 72905-013001 72905-012101 72905-011001
BioBasic Phenyl 10 72405-014001 72405-014001 72405-013001 72405-012101 72405-011001
UNIGUARD Direct-Connect 850-00 850-00 852-00 852-00 851-00Drop-inGuard Cartridge Holder
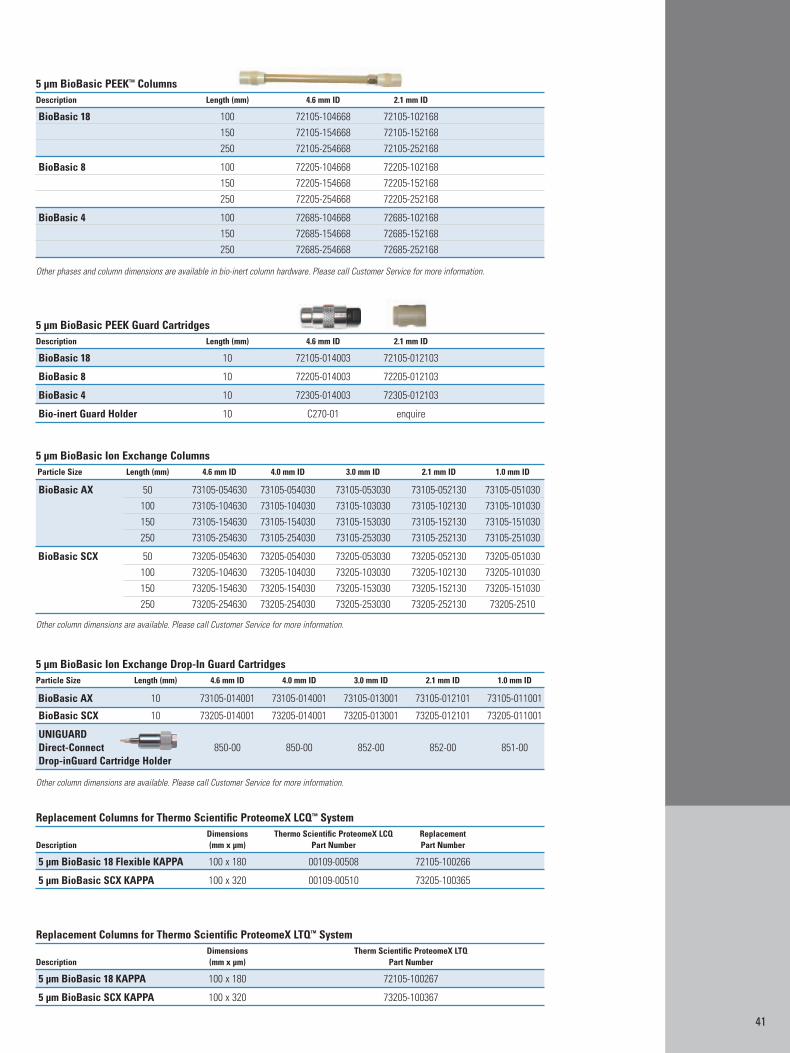
41
5 µm BioBasic PEEK Guard CartridgesDescription Length (mm) 4.6 mm ID 2.1 mm ID
BioBasic 18 10 72105-014003 72105-012103
BioBasic 8 10 72205-014003 72205-012103
BioBasic 4 10 72305-014003 72305-012103
Bio-inert Guard Holder 10 C270-01 enquire
5 µm BioBasic PEEK™ ColumnsDescription Length (mm) 4.6 mm ID 2.1 mm ID
BioBasic 18 100 72105-104668 72105-102168150 72105-154668 72105-152168250 72105-254668 72105-252168
BioBasic 8 100 72205-104668 72205-102168150 72205-154668 72205-152168250 72205-254668 72205-252168
BioBasic 4 100 72685-104668 72685-102168150 72685-154668 72685-152168250 72685-254668 72685-252168
Other phases and column dimensions are available in bio-inert column hardware. Please call Customer Service for more information.
5 µm BioBasic Ion Exchange ColumnsParticle Size Length (mm) 4.6 mm ID 4.0 mm ID 3.0 mm ID 2.1 mm ID 1.0 mm ID
BioBasic AX 50 73105-054630 73105-054030 73105-053030 73105-052130 73105-051030100 73105-104630 73105-104030 73105-103030 73105-102130 73105-101030150 73105-154630 73105-154030 73105-153030 73105-152130 73105-151030250 73105-254630 73105-254030 73105-253030 73105-252130 73105-251030
BioBasic SCX 50 73205-054630 73205-054030 73205-053030 73205-052130 73205-051030100 73205-104630 73205-104030 73205-103030 73205-102130 73205-101030150 73205-154630 73205-154030 73205-153030 73205-152130 73205-151030250 73205-254630 73205-254030 73205-253030 73205-252130 73205-2510
Other column dimensions are available. Please call Customer Service for more information.
5 µm BioBasic Ion Exchange Drop-In Guard CartridgesParticle Size Length (mm) 4.6 mm ID 4.0 mm ID 3.0 mm ID 2.1 mm ID 1.0 mm ID
BioBasic AX 10 73105-014001 73105-014001 73105-013001 73105-012101 73105-011001
BioBasic SCX 10 73205-014001 73205-014001 73205-013001 73205-012101 73205-011001
UNIGUARD Direct-Connect 850-00 850-00 852-00 852-00 851-00Drop-inGuard Cartridge Holder
Other column dimensions are available. Please call Customer Service for more information.
Replacement Columns for Thermo Scientific ProteomeX LCQ™ SystemDimensions Thermo Scientific ProteomeX LCQ Replacement
Description (mm x µm) Part Number Part Number
5 µm BioBasic 18 Flexible KAPPA 100 x 180 00109-00508 72105-100266
5 µm BioBasic SCX KAPPA 100 x 320 00109-00510 73205-100365
Replacement Columns for Thermo Scientific ProteomeX LTQ™ SystemDimensions Therm Scientific ProteomeX LTQ
Description (mm x µm) Part Number
5 µm BioBasic 18 KAPPA 100 x 180 72105-100267
5 µm BioBasic SCX KAPPA 100 x 320 73205-100367
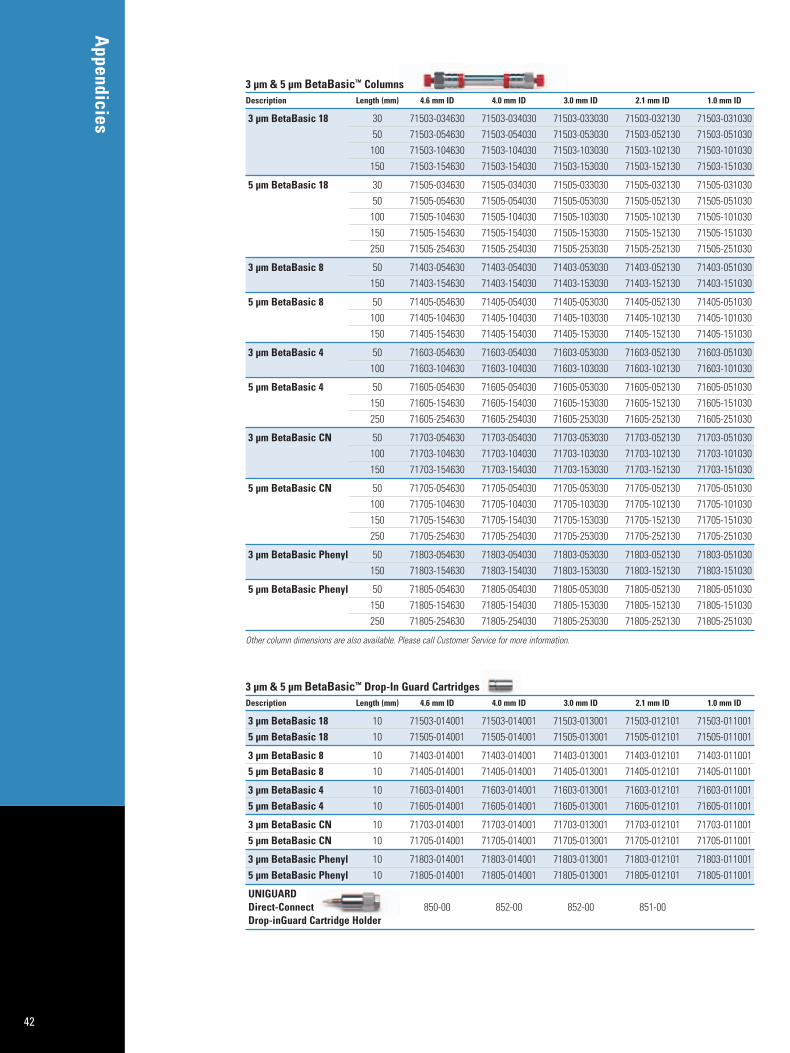
Appendicies
42
3 µm & 5 µm BetaBasic™ ColumnsDescription Length (mm) 4.6 mm ID 4.0 mm ID 3.0 mm ID 2.1 mm ID 1.0 mm ID
3 µm BetaBasic 18 30 71503-034630 71503-034030 71503-033030 71503-032130 71503-03103050 71503-054630 71503-054030 71503-053030 71503-052130 71503-051030100 71503-104630 71503-104030 71503-103030 71503-102130 71503-101030150 71503-154630 71503-154030 71503-153030 71503-152130 71503-151030
5 µm BetaBasic 18 30 71505-034630 71505-034030 71505-033030 71505-032130 71505-03103050 71505-054630 71505-054030 71505-053030 71505-052130 71505-051030100 71505-104630 71505-104030 71505-103030 71505-102130 71505-101030150 71505-154630 71505-154030 71505-153030 71505-152130 71505-151030250 71505-254630 71505-254030 71505-253030 71505-252130 71505-251030
3 µm BetaBasic 8 50 71403-054630 71403-054030 71403-053030 71403-052130 71403-051030150 71403-154630 71403-154030 71403-153030 71403-152130 71403-151030
5 µm BetaBasic 8 50 71405-054630 71405-054030 71405-053030 71405-052130 71405-051030100 71405-104630 71405-104030 71405-103030 71405-102130 71405-101030150 71405-154630 71405-154030 71405-153030 71405-152130 71405-151030
3 µm BetaBasic 4 50 71603-054630 71603-054030 71603-053030 71603-052130 71603-051030100 71603-104630 71603-104030 71603-103030 71603-102130 71603-101030
5 µm BetaBasic 4 50 71605-054630 71605-054030 71605-053030 71605-052130 71605-051030150 71605-154630 71605-154030 71605-153030 71605-152130 71605-151030250 71605-254630 71605-254030 71605-253030 71605-252130 71605-251030
3 µm BetaBasic CN 50 71703-054630 71703-054030 71703-053030 71703-052130 71703-051030100 71703-104630 71703-104030 71703-103030 71703-102130 71703-101030150 71703-154630 71703-154030 71703-153030 71703-152130 71703-151030
5 µm BetaBasic CN 50 71705-054630 71705-054030 71705-053030 71705-052130 71705-051030100 71705-104630 71705-104030 71705-103030 71705-102130 71705-101030150 71705-154630 71705-154030 71705-153030 71705-152130 71705-151030250 71705-254630 71705-254030 71705-253030 71705-252130 71705-251030
3 µm BetaBasic Phenyl 50 71803-054630 71803-054030 71803-053030 71803-052130 71803-051030150 71803-154630 71803-154030 71803-153030 71803-152130 71803-151030
5 µm BetaBasic Phenyl 50 71805-054630 71805-054030 71805-053030 71805-052130 71805-051030150 71805-154630 71805-154030 71805-153030 71805-152130 71805-151030250 71805-254630 71805-254030 71805-253030 71805-252130 71805-251030
Other column dimensions are also available. Please call Customer Service for more information.
3 µm & 5 µm BetaBasic™ Drop-In Guard CartridgesDescription Length (mm) 4.6 mm ID 4.0 mm ID 3.0 mm ID 2.1 mm ID 1.0 mm ID
3 µm BetaBasic 18 10 71503-014001 71503-014001 71503-013001 71503-012101 71503-0110015 µm BetaBasic 18 10 71505-014001 71505-014001 71505-013001 71505-012101 71505-011001
3 µm BetaBasic 8 10 71403-014001 71403-014001 71403-013001 71403-012101 71403-0110015 µm BetaBasic 8 10 71405-014001 71405-014001 71405-013001 71405-012101 71405-011001
3 µm BetaBasic 4 10 71603-014001 71603-014001 71603-013001 71603-012101 71603-0110015 µm BetaBasic 4 10 71605-014001 71605-014001 71605-013001 71605-012101 71605-011001
3 µm BetaBasic CN 10 71703-014001 71703-014001 71703-013001 71703-012101 71703-0110015 µm BetaBasic CN 10 71705-014001 71705-014001 71705-013001 71705-012101 71705-011001
3 µm BetaBasic Phenyl 10 71803-014001 71803-014001 71803-013001 71803-012101 71803-0110015 µm BetaBasic Phenyl 10 71805-014001 71805-014001 71805-013001 71805-012101 71805-011001
UNIGUARD Direct-Connect 850-00 852-00 852-00 851-00Drop-inGuard Cartridge Holder
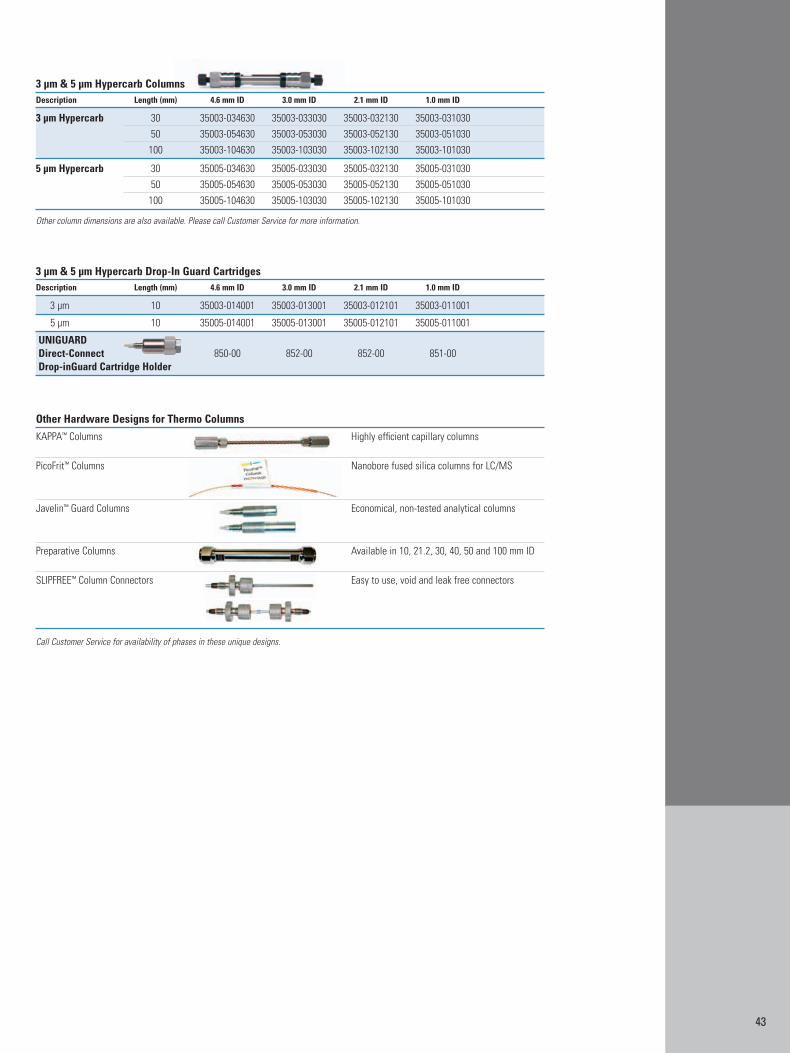
43
3 µm & 5 µm Hypercarb ColumnsDescription Length (mm) 4.6 mm ID 3.0 mm ID 2.1 mm ID 1.0 mm ID
3 µm Hypercarb 30 35003-034630 35003-033030 35003-032130 35003-03103050 35003-054630 35003-053030 35003-052130 35003-051030100 35003-104630 35003-103030 35003-102130 35003-101030
5 µm Hypercarb 30 35005-034630 35005-033030 35005-032130 35005-03103050 35005-054630 35005-053030 35005-052130 35005-051030100 35005-104630 35005-103030 35005-102130 35005-101030
Other column dimensions are also available. Please call Customer Service for more information.
Other Hardware Designs for Thermo Columns
KAPPA™ Columns Highly efficient capillary columns
PicoFrit™ Columns Nanobore fused silica columns for LC/MS
Javelin™ Guard Columns Economical, non-tested analytical columns
Preparative Columns Available in 10, 21.2, 30, 40, 50 and 100 mm ID
SLIPFREE™ Column Connectors Easy to use, void and leak free connectors
Call Customer Service for availability of phases in these unique designs.
3 µm & 5 µm Hypercarb Drop-In Guard CartridgesDescription Length (mm) 4.6 mm ID 3.0 mm ID 2.1 mm ID 1.0 mm ID
3 µm 10 35003-014001 35003-013001 35003-012101 35003-011001
5 µm 10 35005-014001 35005-013001 35005-012101 35005-011001
UNIGUARD Direct-Connect 850-00 852-00 852-00 851-00Drop-inGuard Cartridge Holder
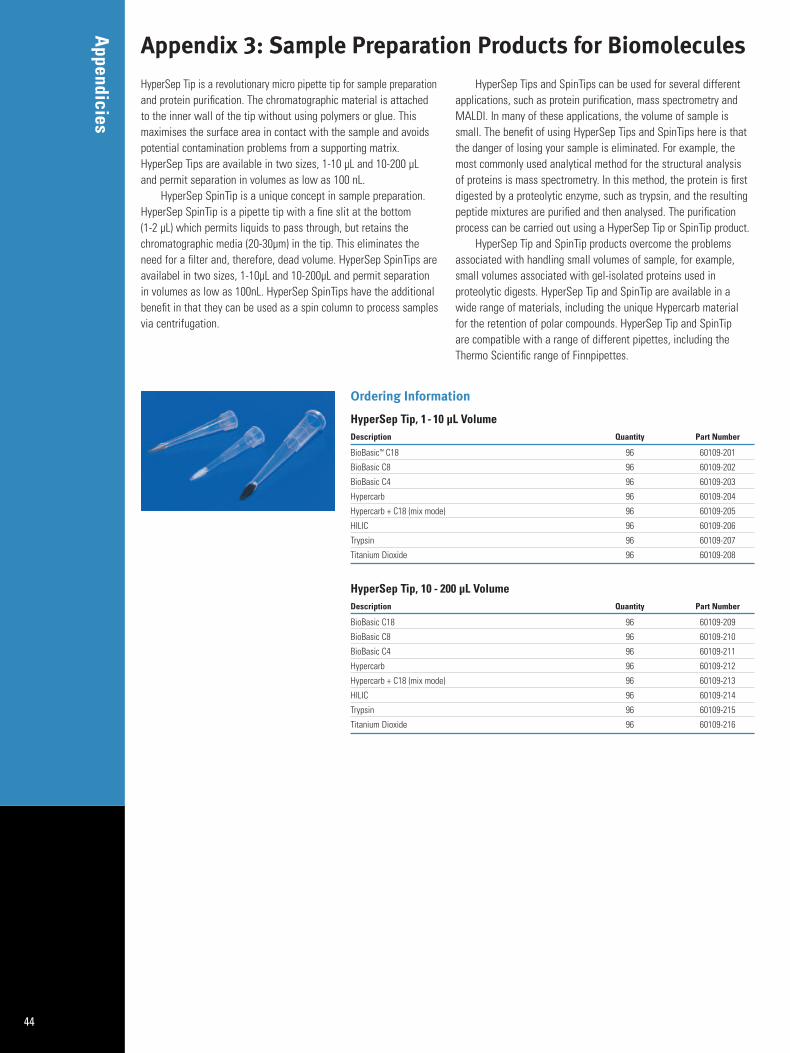
Appendicies
44
Appendix 3: Sample Preparation Products for BiomoleculesHyperSep Tip is a revolutionary micro pipette tip for sample preparationand protein purification. The chromatographic material is attachedto the inner wall of the tip without using polymers or glue. Thismaximises the surface area in contact with the sample and avoidspotential contamination problems from a supporting matrix.HyperSep Tips are available in two sizes, 1-10 µL and 10-200 µL and permit separation in volumes as low as 100 nL.
HyperSep SpinTip is a unique concept in sample preparation.HyperSep SpinTip is a pipette tip with a fine slit at the bottom (1-2 µL) which permits liquids to pass through, but retains the chromatographic media (20-30µm) in the tip. This eliminates theneed for a filter and, therefore, dead volume. HyperSep SpinTips areavailabel in two sizes, 1-10µL and 10-200µL and permit separationin volumes as low as 100nL. HyperSep SpinTips have the additionalbenefit in that they can be used as a spin column to process samplesvia centrifugation.
HyperSep Tips and SpinTips can be used for several differentapplications, such as protein purification, mass spectrometry andMALDI. In many of these applications, the volume of sample issmall. The benefit of using HyperSep Tips and SpinTips here is thatthe danger of losing your sample is eliminated. For example, themost commonly used analytical method for the structural analysis of proteins is mass spectrometry. In this method, the protein is firstdigested by a proteolytic enzyme, such as trypsin, and the resultingpeptide mixtures are purified and then analysed. The purificationprocess can be carried out using a HyperSep Tip or SpinTip product.
HyperSep Tip and SpinTip products overcome the problemsassociated with handling small volumes of sample, for example,small volumes associated with gel-isolated proteins used in proteolytic digests. HyperSep Tip and SpinTip are available in awide range of materials, including the unique Hypercarb material for the retention of polar compounds. HyperSep Tip and SpinTip are compatible with a range of different pipettes, including theThermo Scientific range of Finnpipettes.
Ordering Information
HyperSep Tip, 1- 10 µL VolumeDescription Quantity Part Number
BioBasic™ C18 96 60109-201
BioBasic C8 96 60109-202
BioBasic C4 96 60109-203
Hypercarb 96 60109-204
Hypercarb + C18 (mix mode) 96 60109-205
HILIC 96 60109-206
Trypsin 96 60109-207
Titanium Dioxide 96 60109-208
HyperSep Tip, 10 - 200 µL VolumeDescription Quantity Part Number
BioBasic C18 96 60109-209
BioBasic C8 96 60109-210
BioBasic C4 96 60109-211
Hypercarb 96 60109-212
Hypercarb + C18 (mix mode) 96 60109-213
HILIC 96 60109-214
Trypsin 96 60109-215
Titanium Dioxide 96 60109-216
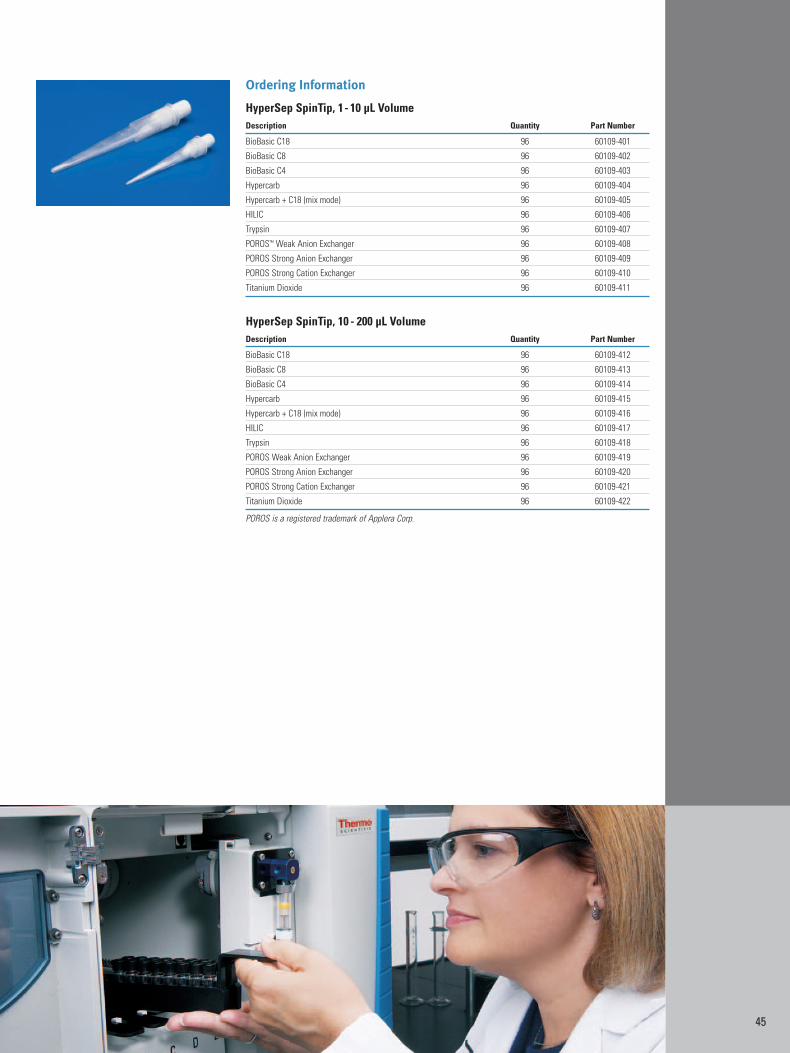
45
Ordering Information
HyperSep SpinTip, 1- 10 µL VolumeDescription Quantity Part Number
BioBasic C18 96 60109-401
BioBasic C8 96 60109-402
BioBasic C4 96 60109-403
Hypercarb 96 60109-404
Hypercarb + C18 (mix mode) 96 60109-405
HILIC 96 60109-406
Trypsin 96 60109-407
POROS™ Weak Anion Exchanger 96 60109-408
POROS Strong Anion Exchanger 96 60109-409
POROS Strong Cation Exchanger 96 60109-410
Titanium Dioxide 96 60109-411
HyperSep SpinTip, 10 - 200 µL VolumeDescription Quantity Part Number
BioBasic C18 96 60109-412
BioBasic C8 96 60109-413
BioBasic C4 96 60109-414
Hypercarb 96 60109-415
Hypercarb + C18 (mix mode) 96 60109-416
HILIC 96 60109-417
Trypsin 96 60109-418
POROS Weak Anion Exchanger 96 60109-419
POROS Strong Anion Exchanger 96 60109-420
POROS Strong Cation Exchanger 96 60109-421
Titanium Dioxide 96 60109-422
POROS is a registered trademark of Applera Corp.
Appendicies
46
Alkyl Chain LengthReversed Phase ...........................................9
Amino AcidsProperties...................................................38
Anion ExchangeCapacity .....................................................25Structure ....................................................25
BetaBasic ColumnsDescription...................................................5Ordering Tables..........................................40
BioBasic ColumnsDescription...................................................5Ion Exchange .............................................23Ordering TablesReversed Phase ...........................................6Size Exclusion ...........................................28
BuffersCommon.....................................................39General Recommendations .......................36
Capillary ColumnsLC/MS........................................................17Proteomics .................................................33
Cation ExchangeCapacity .....................................................25Structure ....................................................25
Column CareCleaning.....................................................37Protection...................................................36Storage ......................................................37
Column LengthIon Exchange .............................................24Reversed Phase ...........................................8Size Exclusion ...........................................30
Direct Serum InjectionSize Exclusion ...........................................31
EfficiencyReversed Phase ...........................................6
ESIProteomics .................................................33Reversed Phase LC/MS.............................17
FiltersColumn Protection .....................................36
Flow RateIon Exchange .............................................24Reversed Phase ...........................................8Size Exclusion ...........................................30vs. ID ..........................................................39
GradientpH...............................................................27Reversed Phase .........................................15Salt.............................................................27
Guard ColumnsColumn Protection .....................................36
HPLC SolventsProperties...................................................38
Hypercarb ColumnsDescription...................................................5Interaction Types .........................................9LC/MS........................................................18Microscale SPE..........................................35Ordering Tables..........................................43Polar Retention ..........................................10
Internal DiameterRP-LC/MS ..................................................16vs. Flow Rate .............................................39
Ion ExchangeCapacity .....................................................25Flow Rate...................................................24Ionic Strength ............................................26Mechanisms ..............................................23Mobile Phase.............................................26Particles .....................................................24pH...............................................................26Phases........................................................25Temperature...............................................24
Ion PairingTFA.............................................................14
IsocraticReversed Phase .....................................8, 15
LC/MSColumn Selection ......................................16ESI..............................................................17Ion Exchange .............................................27Ionic Additives ...........................................20Mobile Phase.............................................20Nanospray..................................................18Organic/Aqueous Ratio .............................21Packing Materials......................................18Reversed Phase .........................................16Size Exclusion ...........................................31
Linear VelocityDefinition .....................................................8LC/MS........................................................17Reversed Phase ...........................................8
MechanismsHypercarb/PGC .....................................9, 10Ion Exchange .............................................23Polar Retention ..........................................10Reversed Phase ...........................................9Size Exclusion ...........................................28
Microscale SPESample Clean-Up.......................................35
Mobile PhaseAdditives....................................................12Ionic Modifiers...........................................13Ionic Strength ............................................26LC/MS........................................................20Organic Modifier........................................14Organic/Aqueous Ratio .............................21pH...............................................................13pH for Ion Exchange ..................................26RP-HPLC .....................................................12SEC.............................................................30
Moleclar WeightColumn Selection ......................................29Common Biomolecules ..............................38Size Exclusion ...........................................29
NanosprayReversed Phase LC/MS.............................19
Particle SizeIon Exchange .............................................24Reversed Phase ...........................................6Size Exclusion ...........................................30
pHGradient .....................................................27Ion Exchange .........................................26Mobile Phase.........................................13
pH StabilityBetaBasic Columns....................................19BioBasic Columns......................................19General Recommendations .......................36Hypercarb/PGC Columns ...........................10
Polar RetentionHypercarb/PGC ..........................................10
Pore SizeIon Exchange .............................................24Reversed Phase ...........................................7Size Exclusion ...........................................29
Porous Graphitic CarbonInteraction Types .........................................9LC/MS........................................................18Microscale SPE..........................................35Polar Retention ..........................................10
Preparative ChromatographyCalculations ...............................................39
PressureGeneral Recommendations .......................36vs. Flow Rate ...............................................8
Protein Structure3-D Shape..................................................38
Appendix 4: Index
47
ProteomicsCapillary LC/MS ........................................33LC/MS........................................................33Reversed Phase .........................................33Sample Preparation.......................35, 44, 45
ResolutionDefinition .....................................................6
Reversed PhaseAlkyl Chain Length.......................................9BetaBasic Columns......................................5BioBasic Columns........................................5HyPURITY C18 Columns ..............................5Interaction Types .....................................9LC/MS....................................................16Mechanisms ............................................6Phases......................................................9Thermo Columns..................................5, 6
Sample PreparationMicroscale SPE..........................................35Size Exclusion ...........................................31Two-Dimensional Chromatography.....32, 34
SelectivityBonded Phase ..............................................9Chain Length..............................................10Temperature...............................................15
Size Exclusion Chromatography2-D Chromatography .................................33Column Length...........................................30Direct Serum Injection...............................31Flow Rate...................................................30LC/MS........................................................31Mobile Phase.............................................30Particles .....................................................28Principles ...................................................28Temperature...............................................30
SPESPE.................................................35, 44, 45
TemperatureGeneral Recommendations .......................36Ion Exchange .............................................24Reversed Phase .........................................15Size Exclusion ...........................................30
TFAIon Pairing..................................................14
TubingID and Volume ...........................................39LC/MS........................................................21
Two-Dimensional ChromatographyProteomics .................................................34Sample Clean-Up.......................................32
ViscositySolvents .....................................................14
Basic HPLC and CE of Biomolecules.R.L. Cunico, K.M.Gooding, and T.Wehr, (Bay BioanalyticalLaboratory, Richmond, CA, 1998).
CRC Handbook of Chemistry and Physics, 85th Edition.,(CRC Press, Whitehouse Station, NJ, 2004).
High Performance Liquid Chromatography of Peptides and Proteins:Separation, Analysis, and Conformation.C. Mant and R. Hodges, (CRC Press, Boca Raton, 1991).
Lehninger Principles of Biochemistry, Fourth Edition.D. L. Nelson, M. M. Cox (W.H. Freeman & Company, New York, NY, 2004).
The Merck Index, 13th Edition. (Merck & Co., Inc., Whitehouse Station, NJ, 2001).
Practical HPLC Method Development, 2nd Edition.L.R. Snyder, J.J. Kirkland, J.L. Glajch, (John Wiley & Sons,New York, NY, 1997).
Stability of High Ligand-Density HPLC Bonded-Phase Silica Media at Low pH. R.C. Ludwig, T.S. Reid, R.A. Henry, K.J.Duff, LC*GC, 16(2), 158 (1998).
Successful LC Operation: A Troubleshooting Guide, Version 1.(Thermo Electron Corporation, 2001).
Appendix 5: References
Tap our expertise throughout the life of your instrument. Thermo Scientific Services
extends its support throughout our worldwide network of highly trained and certified
engineers who are experts in laboratory technologies and applications. Put our team
of experts to work for you in a range of disciplines – from system installation, training
and technical support, to complete asset management and regulatory compliance
consulting. Improve your productivity and lower the cost of instrument ownership
through our product support services. Maximize uptime while eliminating the
uncontrollable cost of unplanned maintenance and repairs. When it’s time to
enhance your system, we also offer certified parts and a range of accessories and
consumables suited to your application.
To learn more about our products and comprehensive service offerings,
visit us at www.thermoscientific.com/chromatography.
Laboratory Solutions Backed by Worldwide Service and Support
TGCCSBIOMOL 0610
©2010 Thermo Fisher Scientific Inc. All rights reserved. ICAT and TurboSEQUEST are trademarks of the University of Washington. PEEK is the trademark ofVictrex, plc. PicoTip is the trademark of New Objective, Inc. All other trademarks are the property of Thermo Fisher Scientific Inc. and its subsidiaries.Specifications, terms and pricing are subject to change. Not all products are available in all countries. Please consult your local sales representative for details.
For more information, visit the Chromatography Resource Center at www.thermoscientific.com/chromatography
USA and Canada +1 800 332 3331France +33 (0) 3 88 67 53 20Germany +49 6103 408 0Switzerland +41 56 618 41 11United Kingdom +44 1509 555500
Japan +81 45 453 9220China +86-21-68654588 or +86-10-84193588India 1 800 22 8374 (toll-free)
+91 22 6716 2200All Other Enquiries +44 (0) 1928 534 050
Technical SupportNorth America +1 800 332 3331Outside North America +44 (0) 1928 534 440